1. Introduction
Within the road transport sector, a main driver for technological innovation is the need to reduce fuel consumption and vehicle exhaust emissions. Legislative requirements are motivating original equipment manufacturers (OEMs) to develop and integrate new and innovative technologies into their fleet. Consequently, over the last few years, different types of electric vehicles (EVs) have been built alongside conventional internal combustion engine (ICE) cars. Within the field of EVs, a key enabling technology is the design and integration of rechargeable energy storage systems (RESS) [
1,
2]. Multi-cell RESSs require a battery management system (BMS) to ensure safe and consistent operation over the life of the vehicle and to report the status of the RESS to the wider vehicle control systems. One of the key challenges is to monitor the variations in capacity and impedance between cells. Often, the RESS is limited by characteristics of the weakest cell [
3,
4], and accounting for these differences minimizes the impact of cell variation on RESS performance.
Many OEMs are employing cylindrical format cells (e.g., 18650) for the design and construction of the RESS [
5,
6,
7,
8]. Cylindrical cells are often chosen in EV applications over their prismatic and pouch cell counterparts because of a combination of factors. For example, 18650 format cells are produced in very large quantity which makes them cost effective [
8,
9,
10]. Similarly, they may have built-in safety systems such as a positive temperature coefficient (PTC) resistor that prevents high current surge and the use of a current interrupt device (CID) to protect the cell in the event of excessive internal pressure [
8,
9,
10].
To ensure in-market reliability and customer satisfaction, OEMs perform a variety of life representative durability tests during the design and prototype stages of the development process. Firstly, these tests ensure that new vehicle sub-assemblies and components are fit-for-purpose. Secondly, it allows OEMs to obtain characterization data for models that are used for the development of core functionality within the BMS. Thirdly, it ensures that the product meets strict requirements for vehicle homologation.
Vibration durability is one of these tests, and plays an important role in the selection of components. As discussed within [
11,
12,
13,
14,
15] poorly integrated components, assemblies or structures subjected to vibration can result in a significantly reduced service life or the occurrence of catastrophic structural failure through fatigue cracking or work hardening of materials [
13,
16,
17].
With respect to 18650 format battery cells, vibration-induced degradation in cell electrical performance has been previously reported. In [
18], 18650 format Li-ion cells, of unknown chemistry, were subjected to a vibration profile along the Z-axis of the cells. The cells were clamped to an electromagnetic shaker (EMS) table and excited for 186 h with a swept-sine wave from 4 to 20 Hz and back to 4 Hz in 30 s. The authors reported that most of the cells exhibited an increase in resistance along with a reduction in their 1C discharge capacity. Additionally, they described the occurrence of complete cell level failures, such as an internal short circuit. The latter failure mode was attributed within the research to the central mandrel becoming loose during the vibration test, which in turn damaged the upper and lower cell components, including the current collector and tabs.
In [
19], commercially available nickel manganese cobalt oxide (NMC) Samsung 2.2 Ah 18650 cylindrical cells (model number ICR18650-22F) were evaluated for electrical degradation when subjected to vibration profiles representative of 100,000 miles of European and North American customer use for chassis mounted RESS. The two batches of cells were evaluated to two different random vibration cycles:
Society of Automotive Engineers (SAE) J2380 [
20];
WMG/Millbrook Proving Ground (WMG/MBK) profiles [
21,
22].
Both batches of cells displayed a significant increase in ohmic resistance (R
O) regardless of vibration profile utilized for their assessment. Increases in R
O were within the range of 17.4% to 128.1%. A reduction in capacity was also observed in some samples evaluated, with 12.22% being the greatest reduction observed. It was acknowledged within [
19] that the impact of vibration-induced ageing may require greater levels of cell balancing by the battery management system (BMS), when the cells are aggregated to form a rechargeable energy storage system (RESS). As a result, the authors are proposing to utilize the electrical data obtained from the vibration aged Samsung 18650 cells defined in [
19] to determine, via simulation techniques, the specific impact on the BMS strategy of a hybrid electric vehicle (HEV) and plug-in hybrid electric vehicle (PHEV).
This paper is structured as follows:
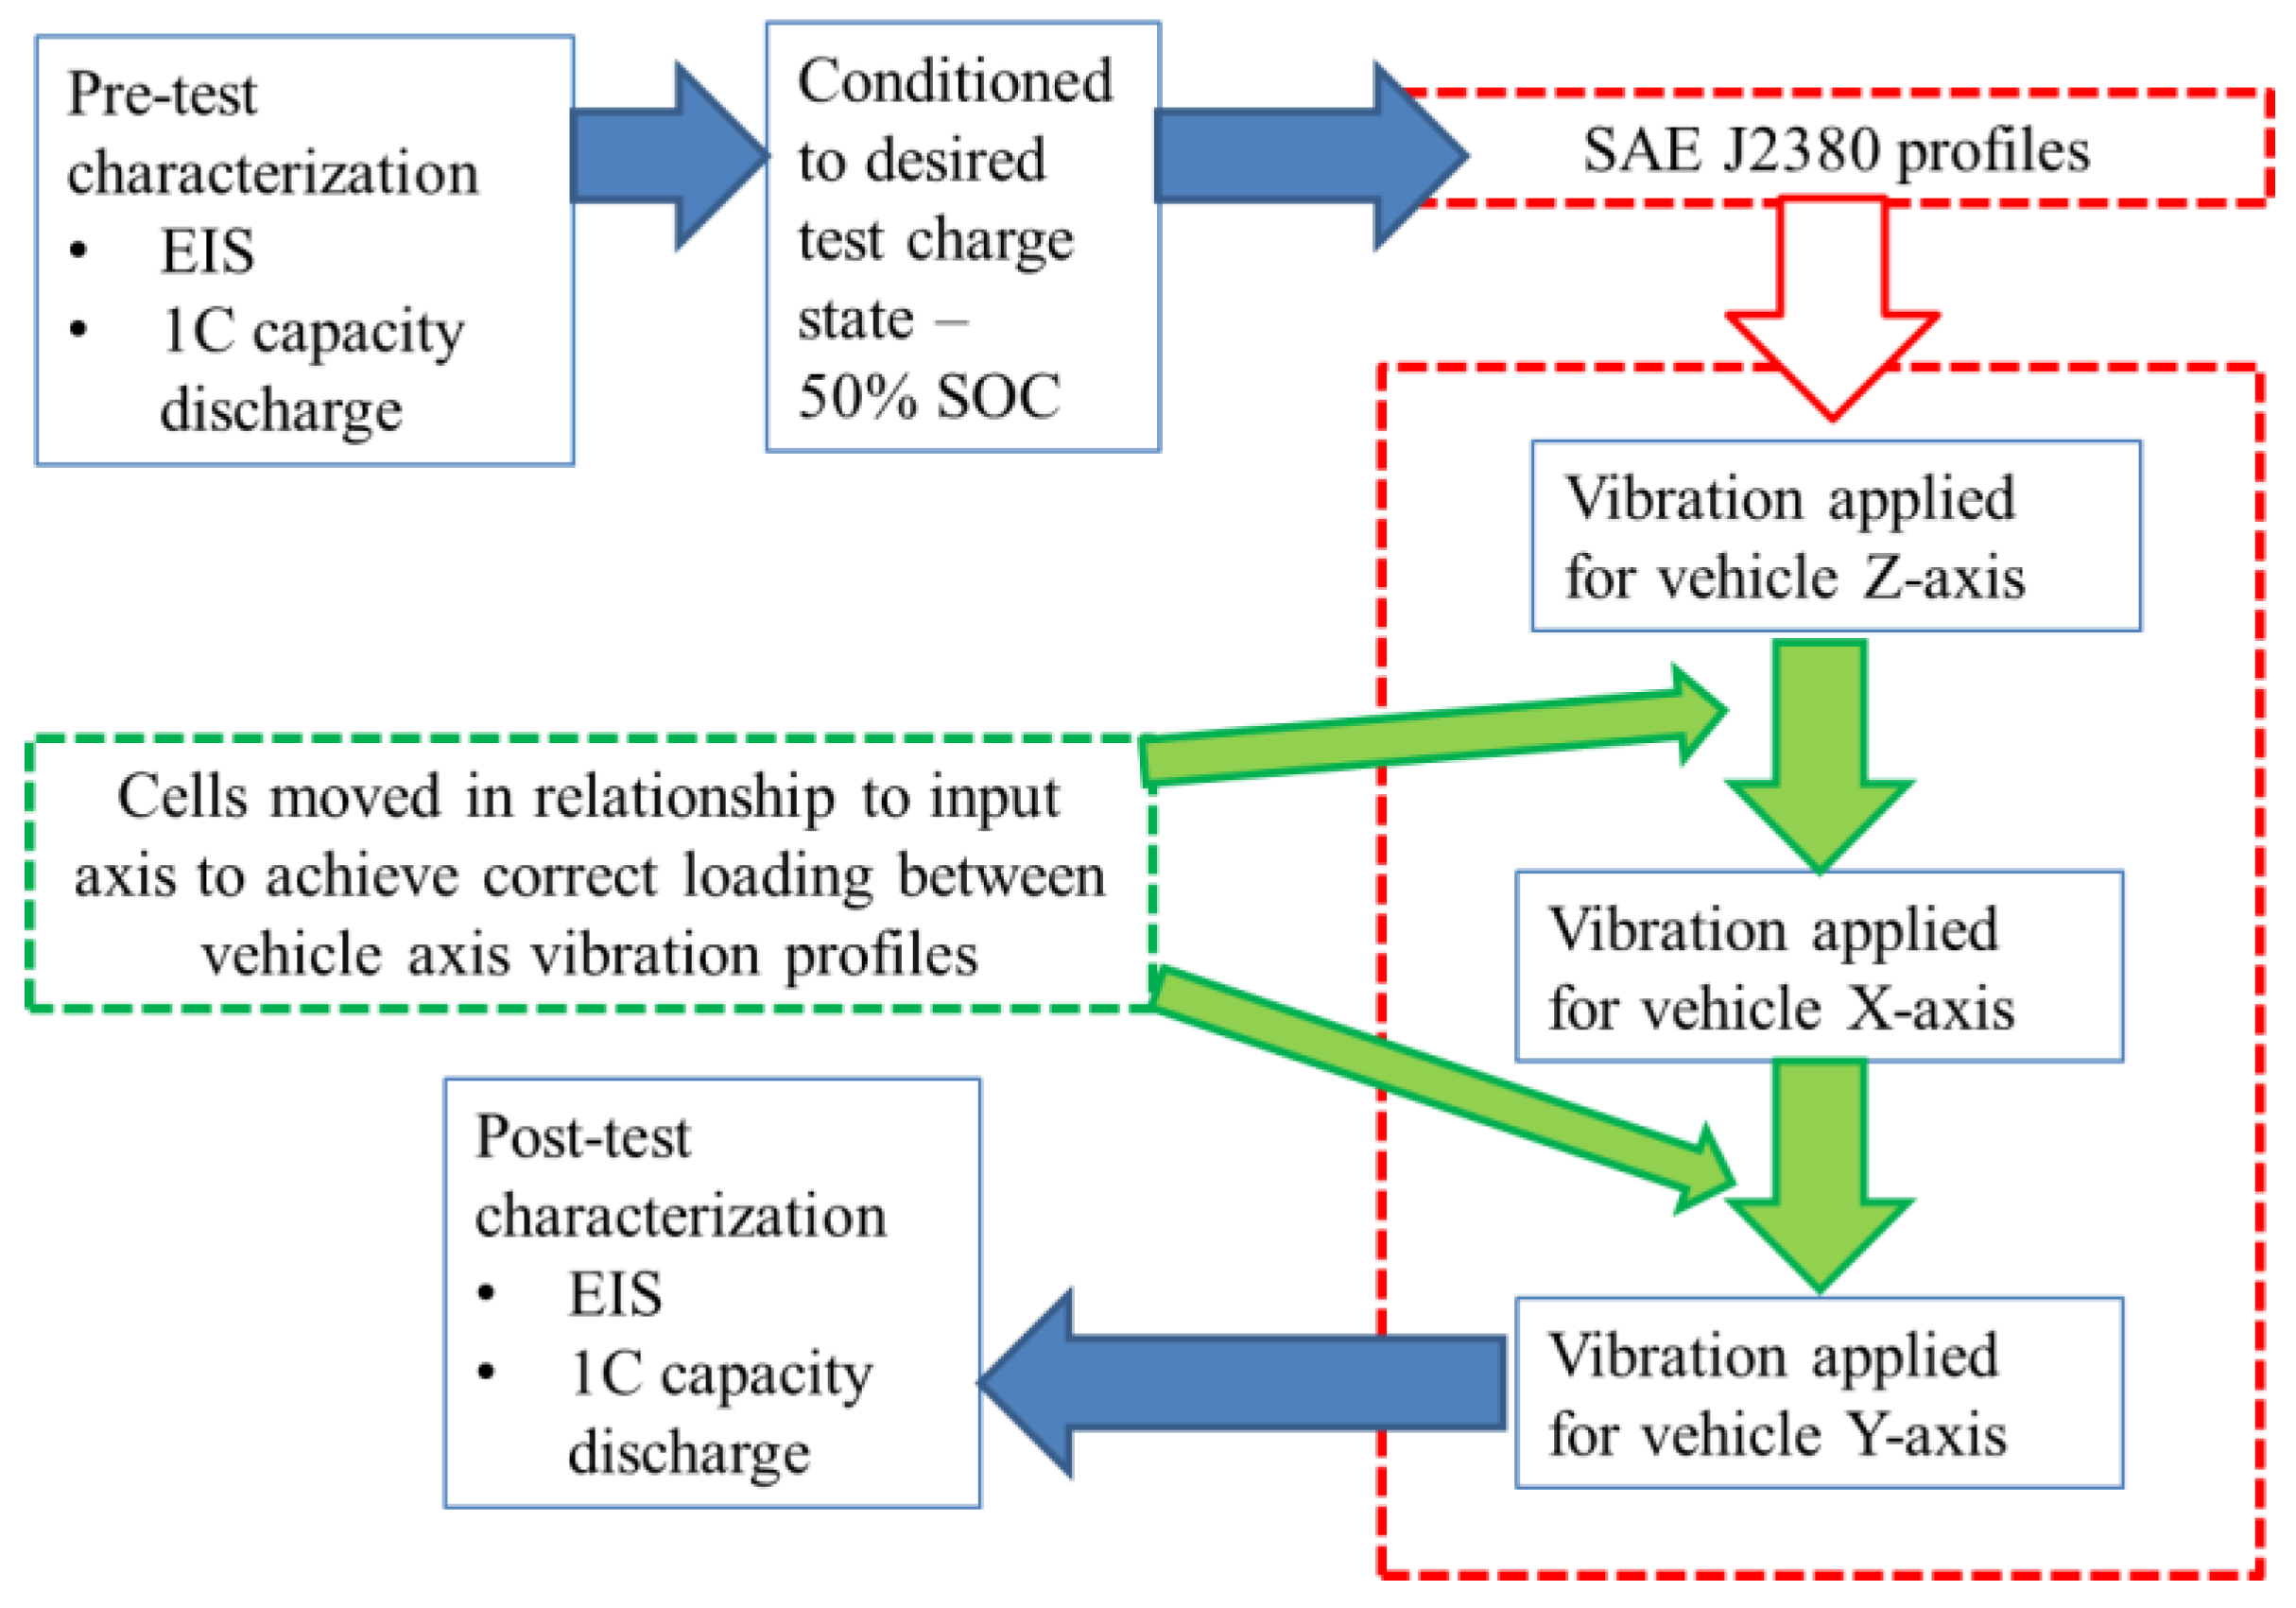
Section 2 of this paper provides a detailed overview of the experimental method employed to assess vibration-induced ageing.
Section 3 summarizes the experimental results. The cell modelling techniques are introduced in
Section 4 and the models are parameterized in
Section 5. Two case studies, considering the impact of vibration-aged cells in series and parallel connections, are presented in
Section 6, using the models parameterized from the experimental data. Further work and conclusions are presented in
Section 7 and
Section 8, respectively.
4. Cell Modelling
Equivalent circuit models (ECMs) are commonly used to model cells due to their simplicity, ease of parameterization and real-time suitability compared to physics based models [
29]. As well as being used to analyze cell and battery pack performance as part of a model-based design process [
30], they can also be used for model-based state estimation of SOC and state of health (SOH) [
3,
31,
32].
ECMs generally consist of a resistor connected in series with a number of resistor-capacitor (RC) pairs. A greater number of RC pairs increases the model bandwidth and accuracy, at the expense of computational complexity.
Figure 5a shows a single cell ECM with
NRC RC pairs. Several ECMs can be combined in parallel as in
Figure 5b and/or in series as in
Figure 5c. Compared to other types of cell, 18650 format cells have a low comparatively charge capacity. For larger applications, such as electric vehicles, the battery pack must contain many cells in parallel and series in order to meet power and energy requirements. For example, the Tesla Model S 85 kWh battery pack contains 7104 18650 format cells arranged into 96 series units, with each series unit containing 74 cells connected in parallel [
33]. Understanding and managing the variations in the properties of each of these cells is important for optimizing the performance of the battery pack.
Dubarry
et al. [
34] showed that a series string of cells can be equated to a single cell model by accounting for the variations between cells. However, the authors note that this will become complex for larger numbers of cells, and the resulting model lacks the individual cell voltages which are important for assessing when the series string of cells has reach end of charge/ end of discharge. In [
35] the authors find that string SOC estimation accuracy suffers when an averaged single cell model is used rather than individual cells. In [
36], it is suggested that prior to assembling a series-parallel model of cells, the cells should be screened to ensure that only cells with very similar resistance and capacity are connected together. From this, it is assumed that cells in parallel can be equated to a single cell, as can cells in series. Combining both together, an arbitrary series-parallel module of cells can be represented by a single averaged ECM. However, As discussed in [
37] there is no guarantee that the cells will remain similar over their life, and a single effective cell will not account for variations in current and SOC which can occur. Individual ECMs can also be used to implement model-based balancing strategies for cells in series [
38].
The EIS data collected during the experimental phase were all obtained at 50% SOC. While it is known that cell impedance is a function of SOC, it is generally considered that there is little variation in the central SOC region at moderate temperatures [
39,
40] For the studies considered in this paper, the SOC of the cells is maintained between 30 and 70%. While the impedance remains constant, the open circuit voltage (OCV) is a nonlinear function of SOC. This can be incorporated into the cell model by using a lookup table.
In this case, OCV is implemented as a state and a parameter
F is found using Equation (1), where
Q is the 1C discharge capacity in Ah. This is then used to capture the relationship of OCV and current given by Equation (2). Each RC pair voltage is governed by Equation (3), and the terminal voltage of the cell given by Equation (4). Note that the DC resistance in the ECM is referred to as
RD to avoid confusion with
RO obtained from the EIS plots. Model errors and limits in bandwidth mean that the
RD resistance may not equate exactly to the
RO value for a given cell:
These equations can be put into state-space form, which is well suited to modelling arbitrary time-domain signals such as the current applied under real-world driving conditions. For a single cell model with N
RC pairs, the state equation are given by Equation (5), and the output equation by Equation (6).
The ECM impedance can be considered in the frequency domain, as a function of complex angular frequency
s. The impedance for an ECM with
NRC RC pairs is given in Equation (7):
An averaged parallel model (APM)—a single-cell effective model of the parallel-connected unit of cells— can also be created by combining each cell as per Equation (8). This averages out any variations in cell properties and as such cannot be used to explore the wider impact of combining cells in parallel. Similarly, an average series model (ASM) for cell impedance from a series string of
N cells is given by Equation (9):
The output voltage can then be multiplied by
N to obtain the string voltage. Using the method described and validated in [
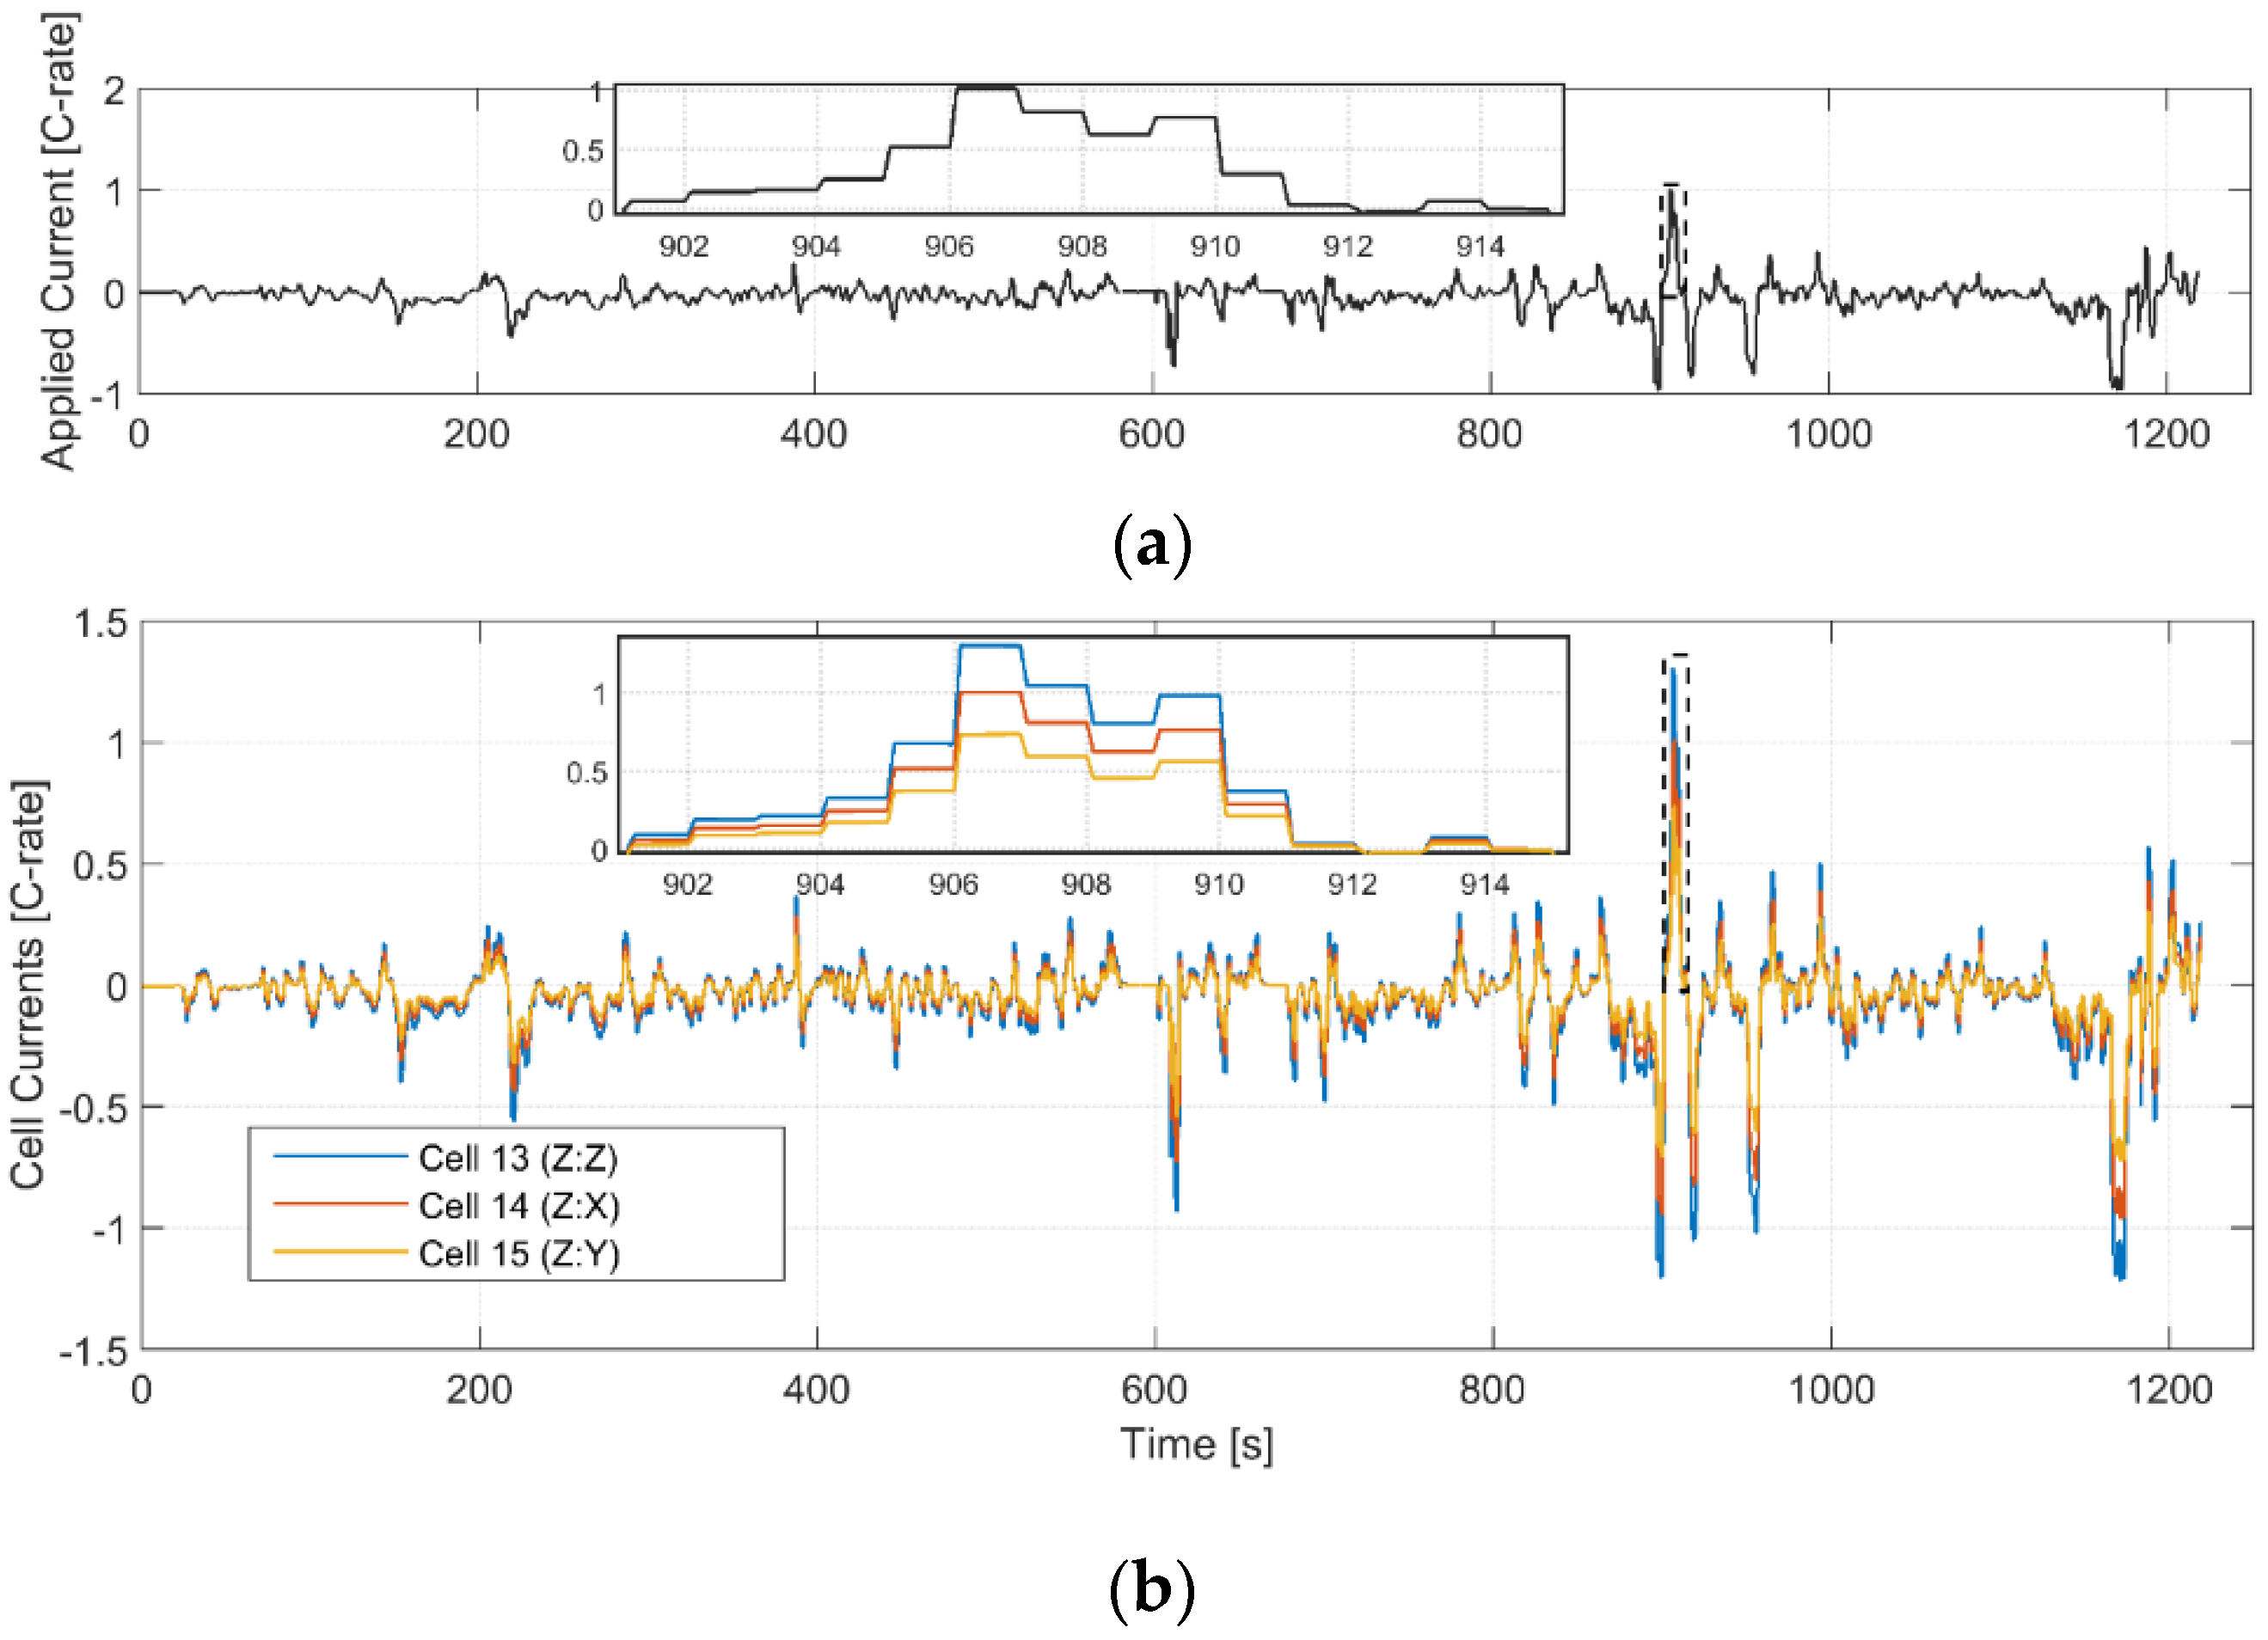
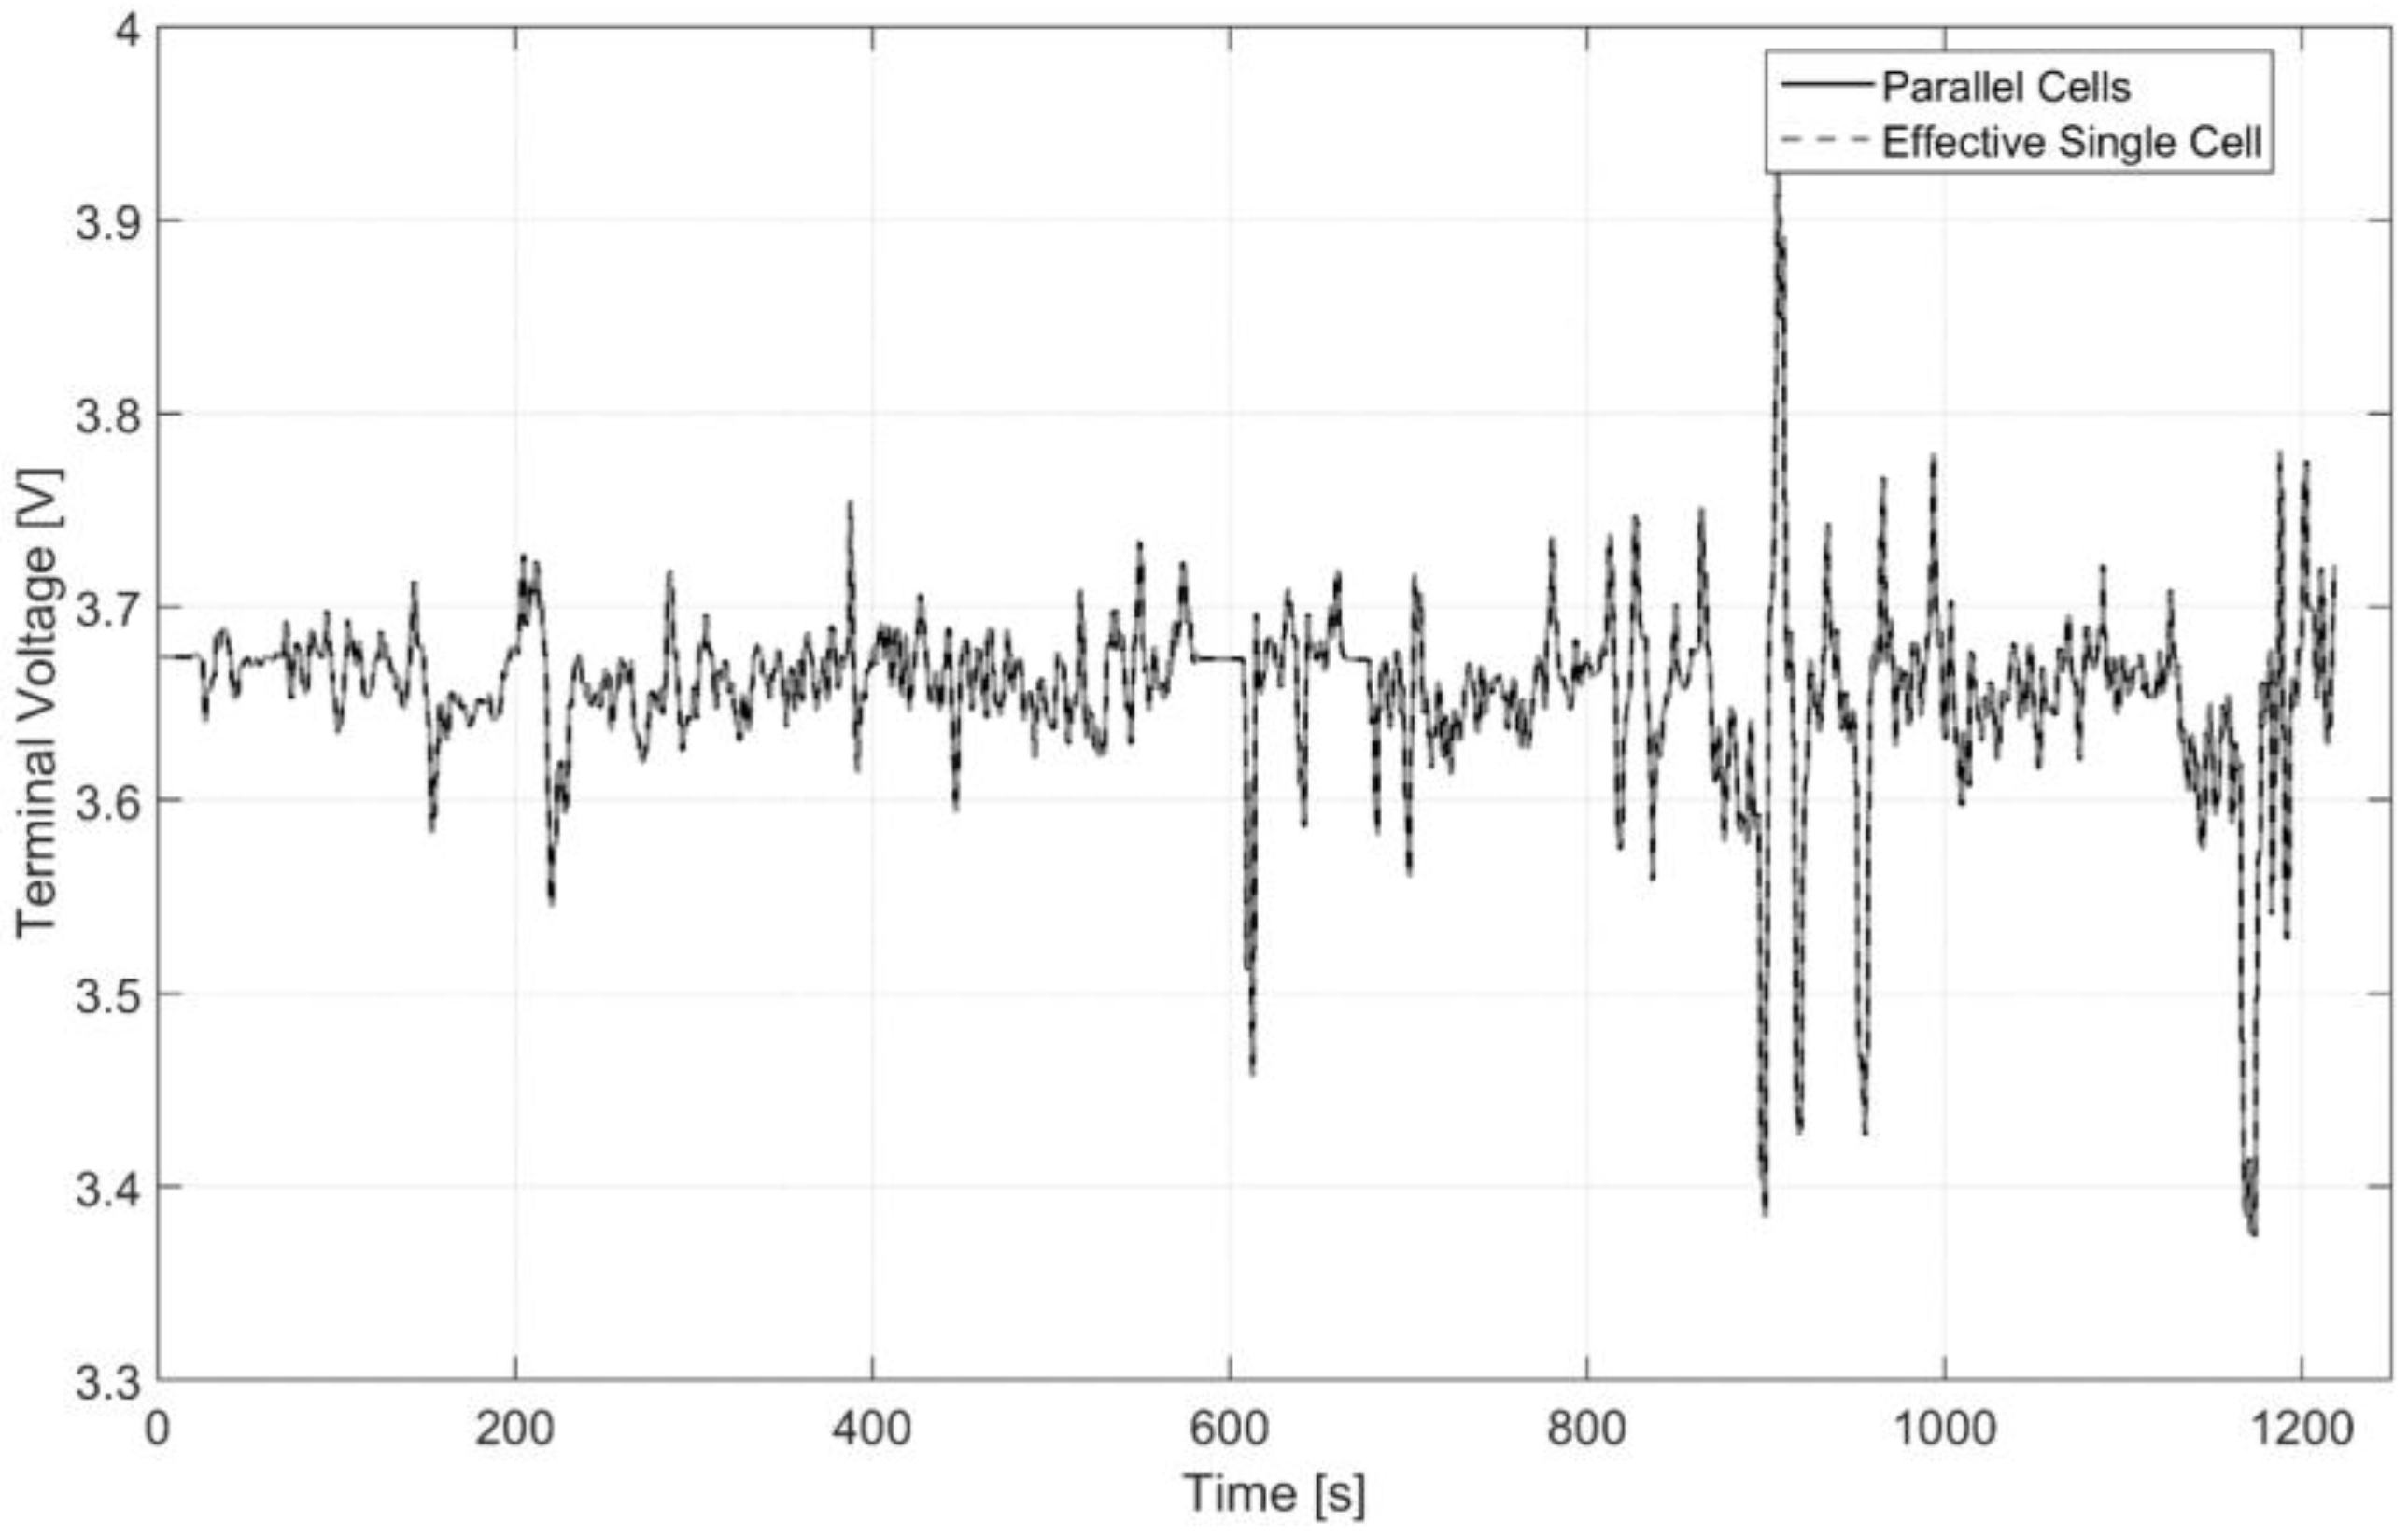
37], the individual ECMs can be combined into a parallel cell model, with the applied current as the input, and the terminal voltage as the output. Unlike the single effective cell model, this solution does not average out the variations in cell properties, and it means that the current through each cell can be calculated. In the paper, individual ECMs were parameterized from cells with different impedances resulting from charge-discharging cycling-induced ageing. A dynamic current load was applied to the cells while connected in parallel, and individual cell currents were also measured. The same applied load was used as an input to the parallel cell model so that cell currents and voltage could be calculated. The simulated cell currents were found to be accurate to 2% of the measured currents.
A summary of the parallel cell model is provided below, with the full derivation in [
37]. The individual cells are combined into a single system by creating block diagonals of the state matrices in Equation (5) and selecting one set of output matrices from Equation (6) (since all of the cells are at the same voltage, only one output voltage is required and in this case the first cell is chosen to calculate voltage), which takes the form of Equation (10). The input matrix has to be updated at each time step by solving Equation (1). This system requires an input vector of cell currents, which is typically not available for a system of parallel cells. However, by applying Kirchoff’s laws, the cell currents can be calculated from knowledge of the cells’ states, model parameters and the known current applied to the parallel stack. This results in a linear system of equations which solves for a vector of cell currents based on each cell being at the same terminal voltage as its neighbor. These cell currents are given by Equation (11), which can be substituted into Equation (10) to give Equation (12):
This augmented solution demonstrates that the entire system of parallel states can be solved for while maintaining the same input (applied current) and output (cell voltage) and state-space structure as for a single cell model. This allows for the same simulation and analysis methods to be used as for single cells or cells in series.
5. Model Parameterization
ECMs are not based on physical elements, and as such must be parameterized using system identification techniques rather than taking physical measurements of the cells. Each set of EIS data described in
Section 3.1 was used to derive ECM parameters. To obtain the parameters, a nonlinear least squares optimization routine was used to apply the cost function in Equation (13). This adjusts the parameter vector
θ in order to minimize the sum-of-squares difference between the experimentally measured impedance
ZE, and the model impedance
ZM, over
Nf frequency points. The model impedance is calculated using Equation (7). The nonlinear least squares algorithm finds a local minimum to the cost function. There may be several local minima and depending on the starting point of the optimization, the global minimum may not be found. To reduce the sensitivity to initial conditions a multi-start algorithm was employed, which runs the local solver several times from different starting points, and then chooses the best solution from all of the runs:
The solution is also sensitive to the number of RC pairs chosen. The decision was made to cover the full frequency range of the EIS data up to the inductive region. For this type of cell, the crossing point of the impedance into the inductive region occurs at around 200 Hz. This is faster than a BMS will typically sample at [
41] but previous research has found that there can be high frequency dynamics within parallel stacks [
37] that the BMS may need to take account of in order to properly manage the individual cells.
An example of the Nyquist fits for cell 5 is shown in
Figure 6a, and the associated errors in
Figure 6b. It was found that a 4RC model provides an acceptable fit to the EIS data, with further RC pairs not significantly reducing the error. Several of the RC pairs are required to approximate a resistor-constant phase element pair which would better represent the curve shape, but cannot be easily translated to the time domain [
42].
The model parameter results for the cells before and after ageing, are given in
Table 5. As mentioned in
Section 4, the limitations of the model mean that the
RD values do not exactly match the
RO values from
Table 3, but the differences are all under 5 mΩ.


 ,
, 


