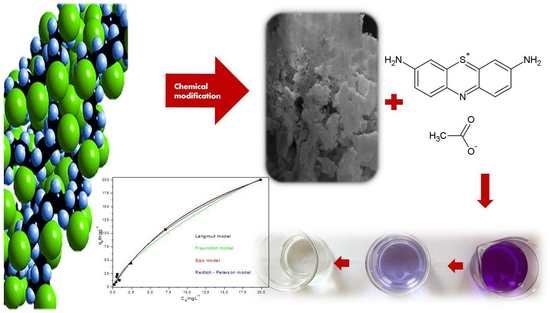
2.1. Adsorbent Characterization
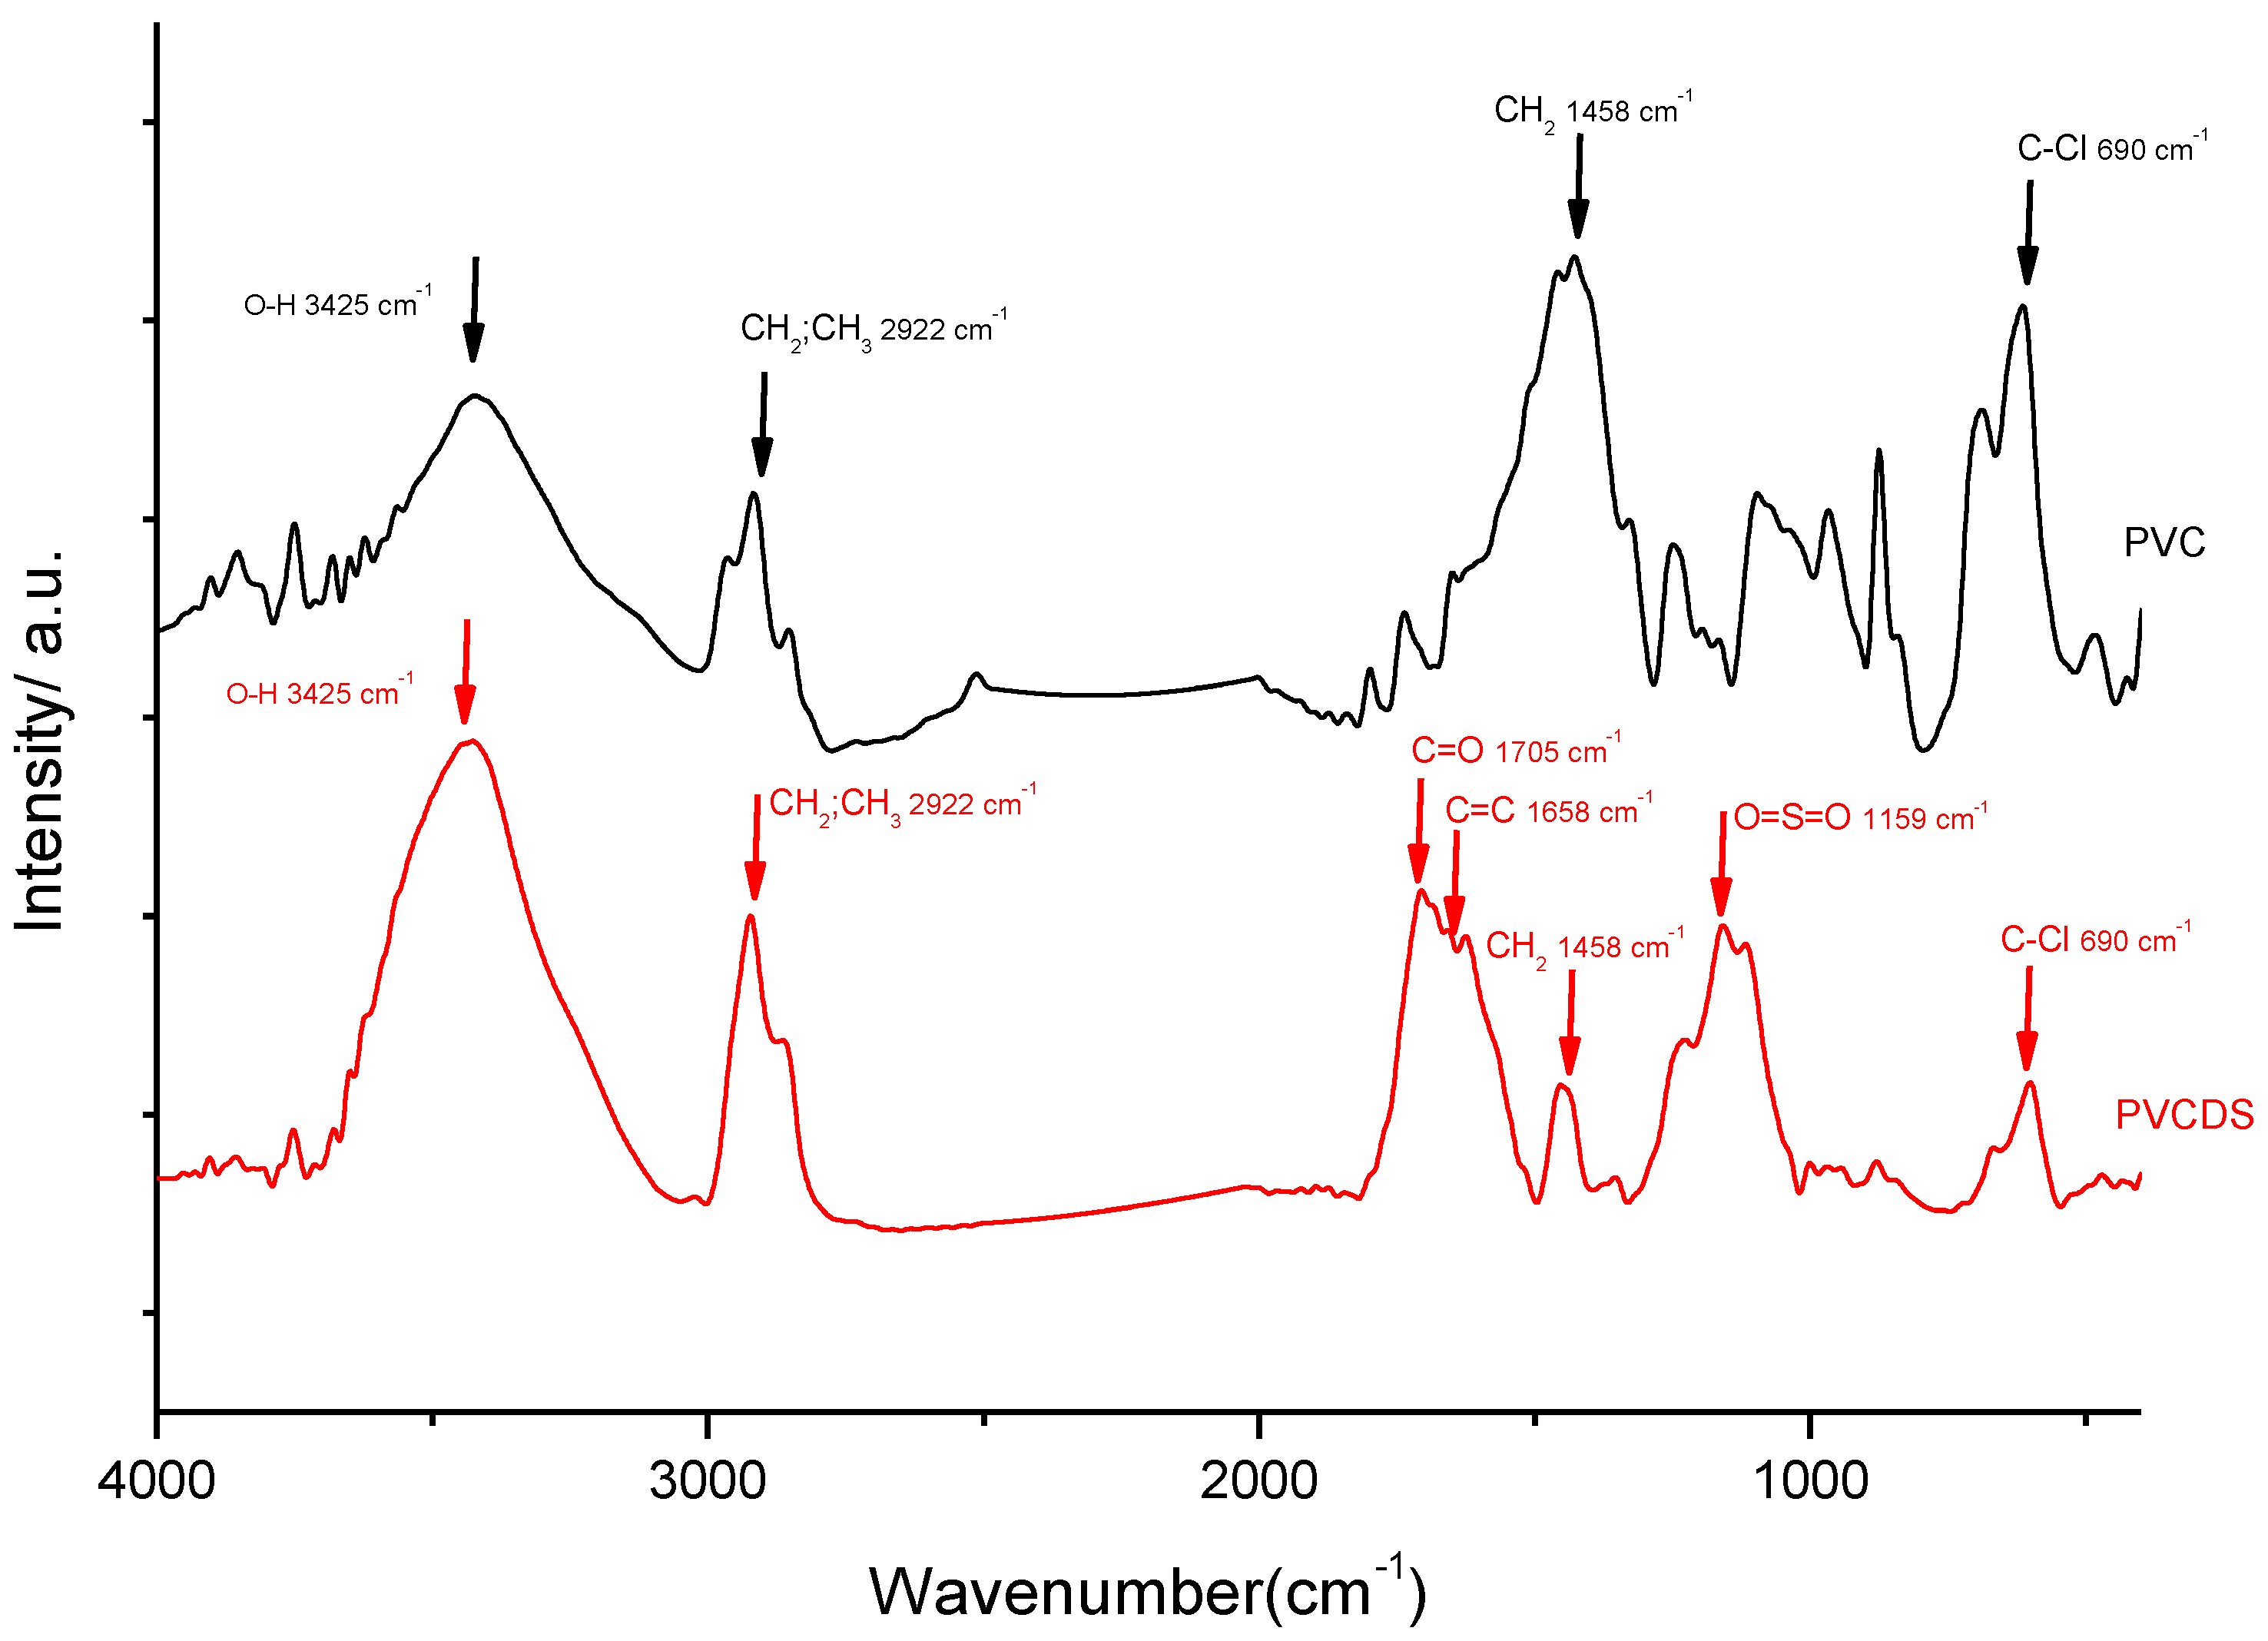
The absorption spectra in the infrared region, shown in
Figure 1 (PVC and PVCDS curves) for PVC reveals the presence of at least three peaks in the region between 3000 and 2800 cm
−1, with the most intense being centered at 2922 cm
−1, attributed to the axial deformation of the C-H bond, symmetrical and asymmetric modes, present throughout the carbon chain. The chemical modification of the PVC leads to change in the profile of this band due to the elimination reactions since it may be related to the output of chlorine atoms and a proportional increase in quantitative carbon (sp
2) in the structure. The presence of chlorine in the polymer structure before and after the chemical modification is confirmed by the presence of a peak at 690 cm
−1 attributed to the axial deformation of the C-Cl bond. When comparing the profiles of the PVC and PVCDS infrared curves, the decrease of chlorine in the PVDCS structure is clearly observed, confirmed by the reduction in the intensity of this band.
It is also observed, for both samples, the presence of the peak at 3425 cm
−1, assigned to the presence of O-H hydroxyl groups, in the structure. Although unexpected, the presence of this band for PVC may be related to additives added during the synthesis of the polymer [
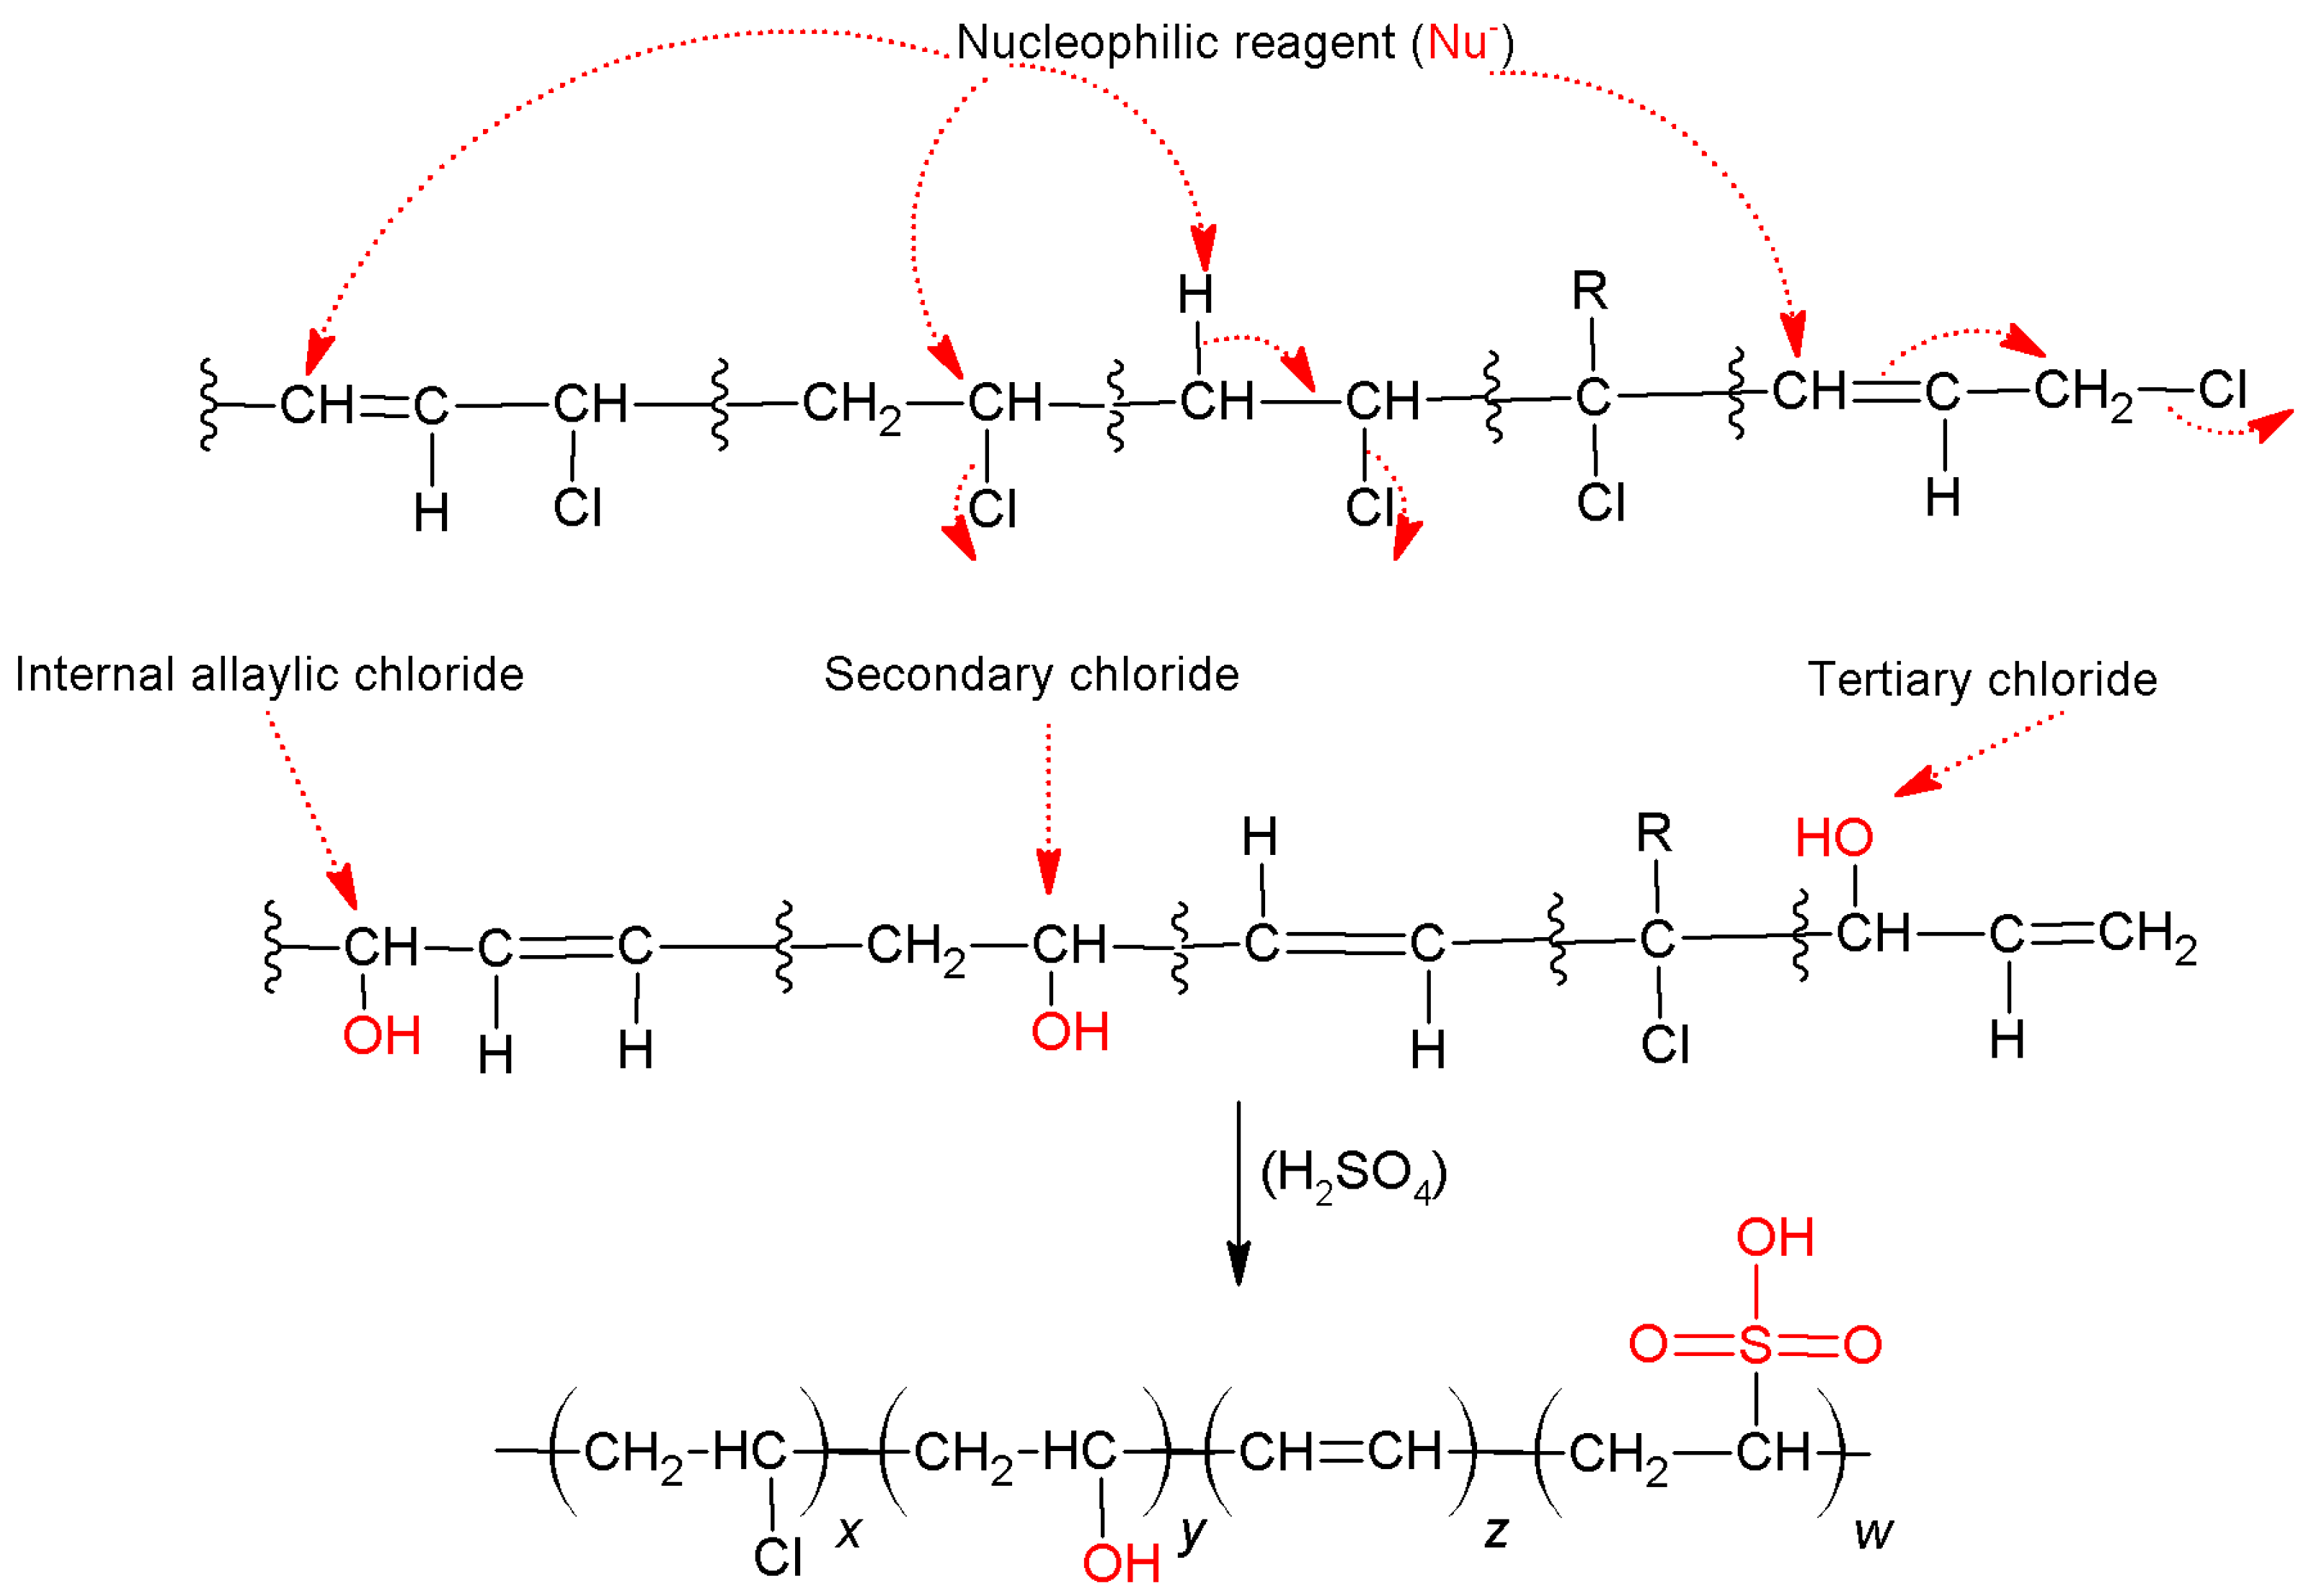
18]. For the PVCDS, the increase in the intensity of this band is related to the chemical modifications undergone during the process of dehydrochlorination and subsequent treatment with sulfuric acid. Dehydrochlorination leads to electrophilic elimination, with the formation of polyenic structure [
8]. This process is followed through competitiveness of a nucleophilic substitution, which leads to the formation of hydroxyl groups. The spectrum in the infrared region for the PVDCS shows the presence of a peak at 1705 cm
−1, attributed to the formation of carbonyls that may be associated with oxidative processes and a peak at 1658 cm
−1, assigned to C=C stretching indicating elimination reactions during treatment with concentrated sulfuric acid. The treatment with sulfuric acid leads to the appearance of some intense bands in the region between 1200 and 1100 cm
−1, particularly the band at 1159 cm
−1, assigned to stretching of O=S=O resulting from the formation of sulfonic acid group in the polymer [
19], as shown in
Scheme 1 [
20]. The PVCDS has similar structures to others sulfonated polymeric materials.
The chemical modification of PVC was also confirmed by the elemental analysis data presented in
Table 1. The percentage of chlorine in the PVC structure was evaluated through the difference of the values found for carbon and hydrogen, and the value found was 59.68% of mass. This value is higher than expected when considering that the percentage by mass of chlorine in the monomeric unit of PVC is equal to 56.73%. The difference observed, 2.95%, may be related to additives in their structure.
The percentage of sulfur atoms in the chemically modified sample (PVDCS) significantly increased in polymer structure and these results are confirmed by FTIR data.
The conversion of the chemical modification reaction of PVC was evaluated through the reduction of the chlorine amount in the polymer found from the
Cl/
C molar ratio obtained for the PVC, considering the monomer unit of the polymer as compared to the values of
Cl/
C molar ratio for PVCDS, according to Equation (1), proposed by Guo et al. [
9].
where (
Cl/
C)
p is the ratio obtained from chemically modified samples.
When considering the data presented in
Table 1, the reaction presents 65% of dehydrochlorination. It is observed from the elemental analysis data the presence of sulfur atoms in the structure, at a ratio of about 31 carbon atoms for each sulfur atom, or considering the monomeric unit of PVC, wherein for every 16 units, there is one unit with a sulfur atom attached.
To evaluate the chemical properties of the groups bound to the modified PVC, the ion exchange capacity was investigated. According to Siva, et al. (2012), the ion exchange capacity for pure PVC is of the order 0.044 mmol·g
−1 (±0.02) that was already performed for the chemically modified PVC, at a temperature of 300 K (±1) and pH 5.0 (±0.5) resulted in an ion exchange capacity of 1.03 mmol·g
−1 (±0.03) [
21]. The assay performed at a temperature of 300 K (±1) and pH 5.0 (±0.5) resulted in an ion exchange capacity of 1.03 mmol·g
−1 (±0.03). This result indicates the possible presence of sulfonic groups responsible for the ion exchange process. The obtained result is like previous work developed with similar materials [
8].
The values of surface area,
σ, specific volume of pores,
V, and average diameter of pores,
d, of original PVC and PVCDS were obtained through adsorption and desorption measurements of N
2 at −196.6 °C. The results obtained are presented in
Table 2.
The surface area, total pore volume, and average pore diameter of the PVCDS were 295.57 m
2·g
−1, 0.43 cm
3·g
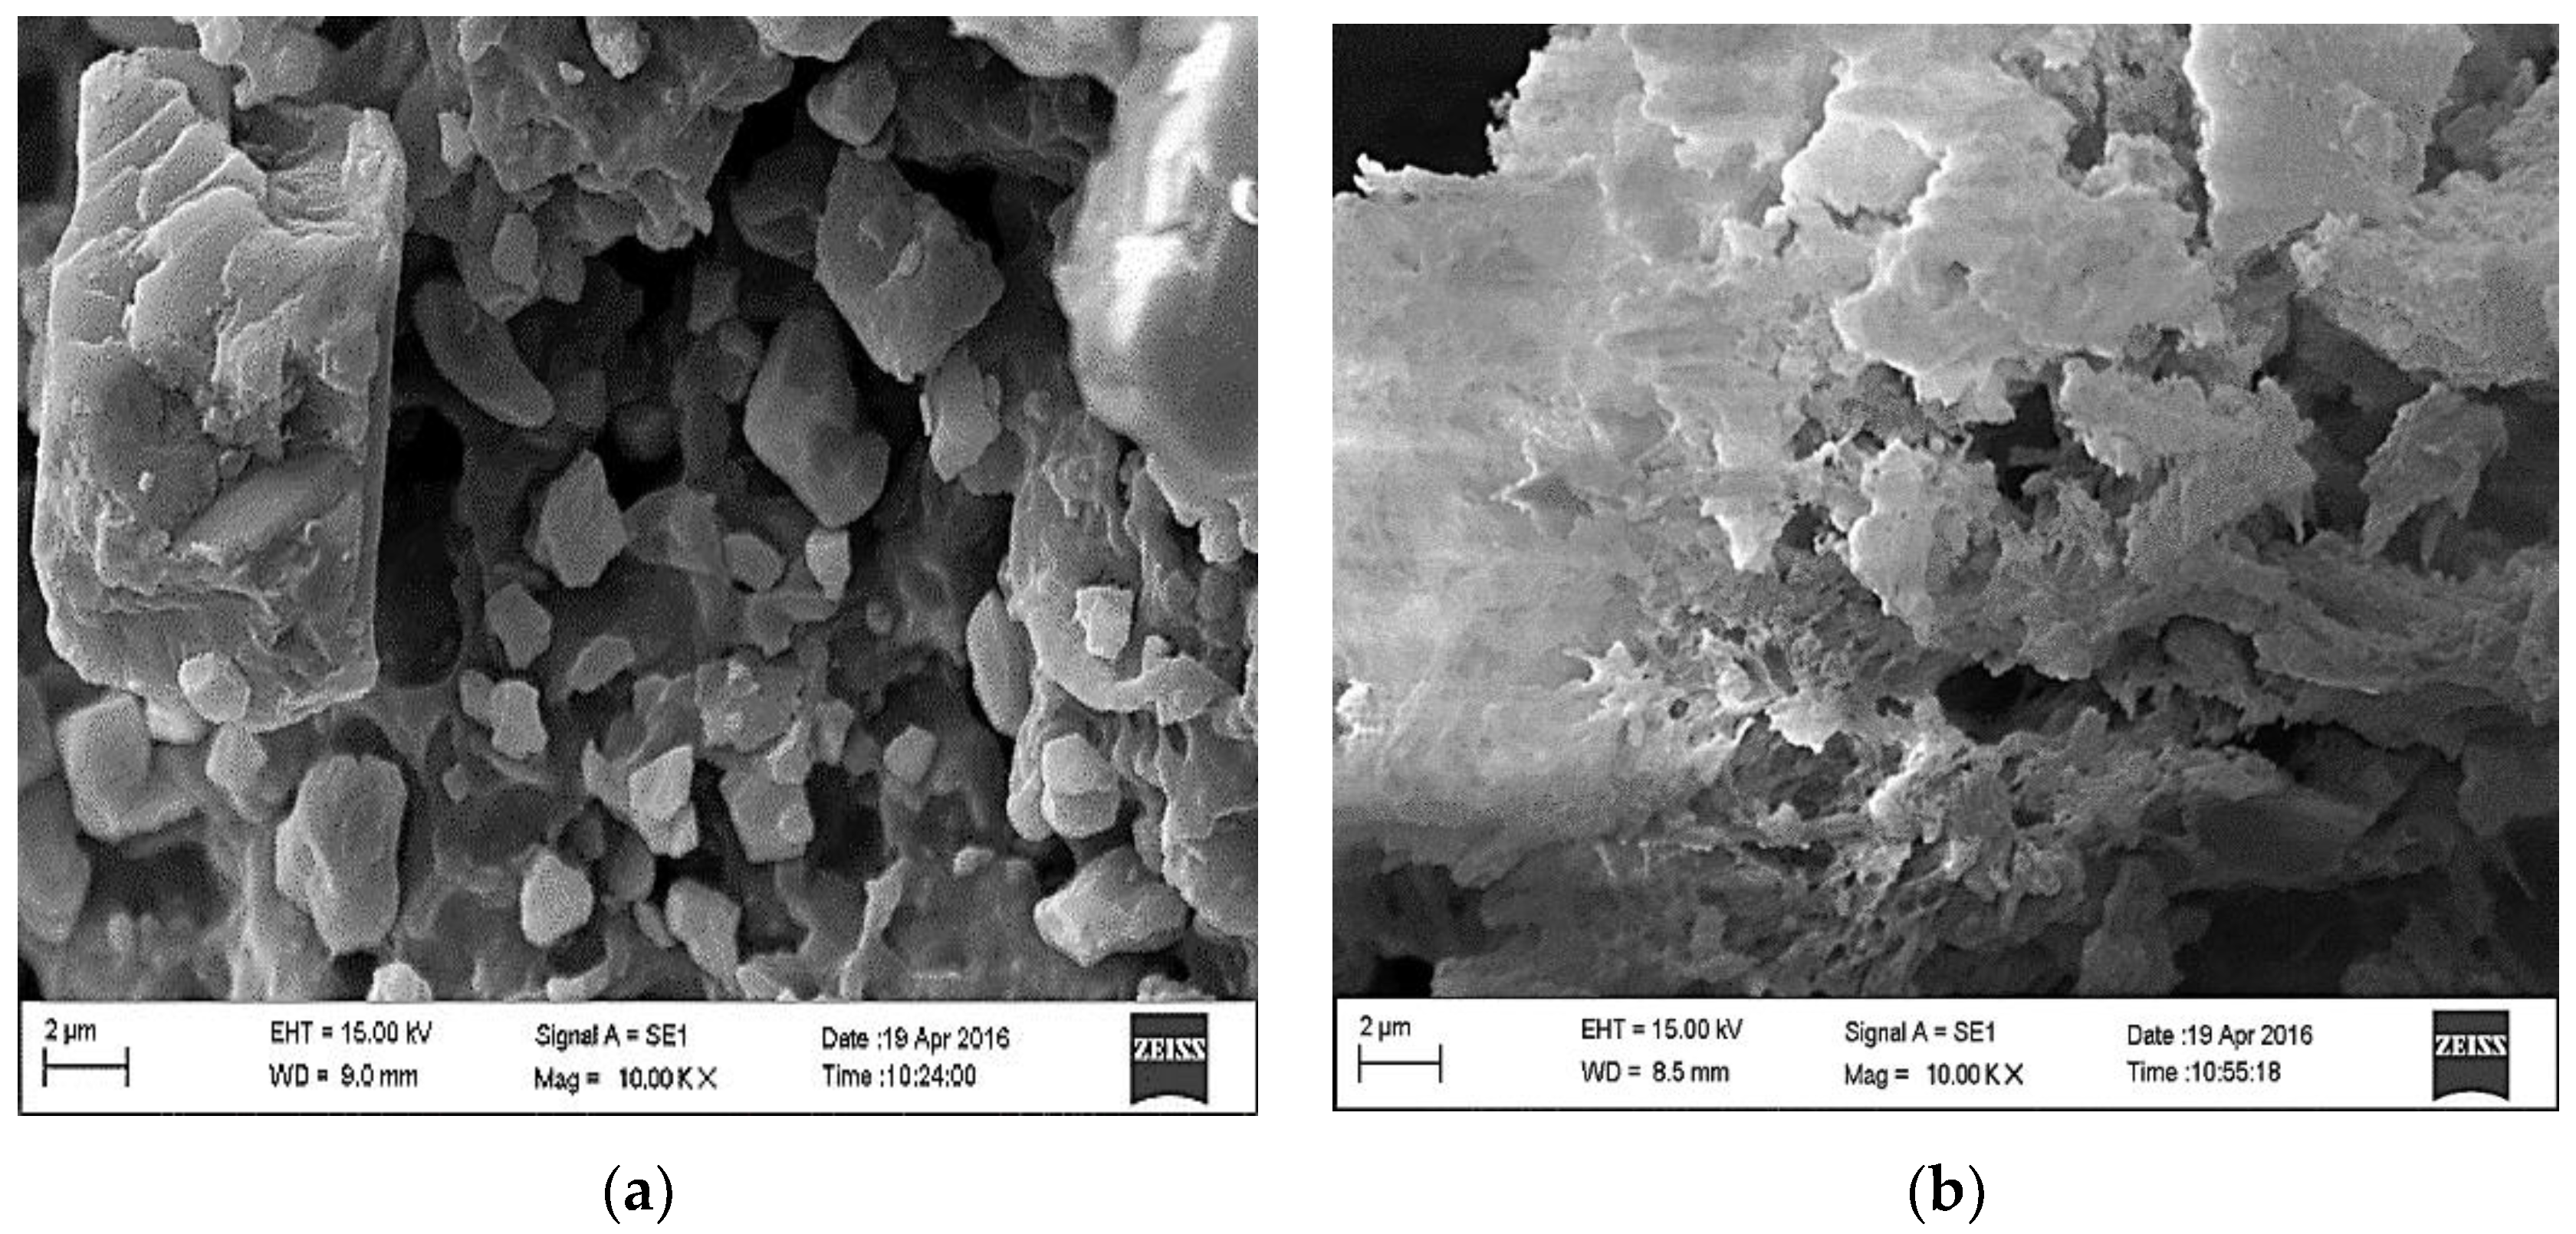
−1, and 5.76 nm, respectively. The average pore diameter of 5.76 nm indicated that the PVCDS was in the mesoporous region. The increase of surface area and pore volume of the PVCDS possibly occurs due to treatment with sulfuric acid leading to a change in surface roughness as observed by Xu and Lee (2009) in the SEM micrograph [
10].
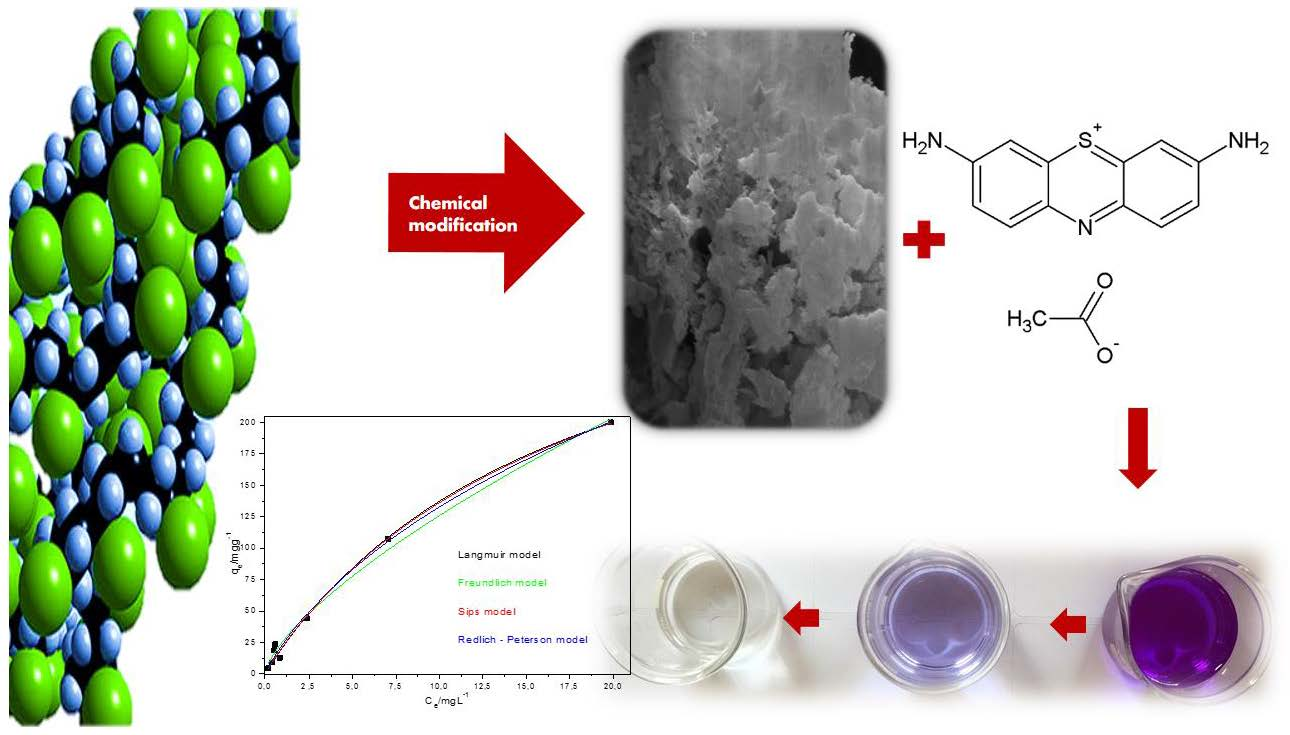
Figure 2a,b show the morphology of the PVC and PVCDS, respectively. As it can be seen from
Figure 2a, the original PVC has granular structure, with microparticles of different sizes and dense appearance. After the chemical modification, the morphological structure of PVC changes significantly with the formation of possible lamellar regions, apparently represented by small scale flakes. Regions that distinguish among scales are observed with possible porous structure,
Figure 2b. The chemical treatment of PVC modifies its original morphology and leads to an increase of the surface area, desired aspect for the use of this material as an adsorbent.
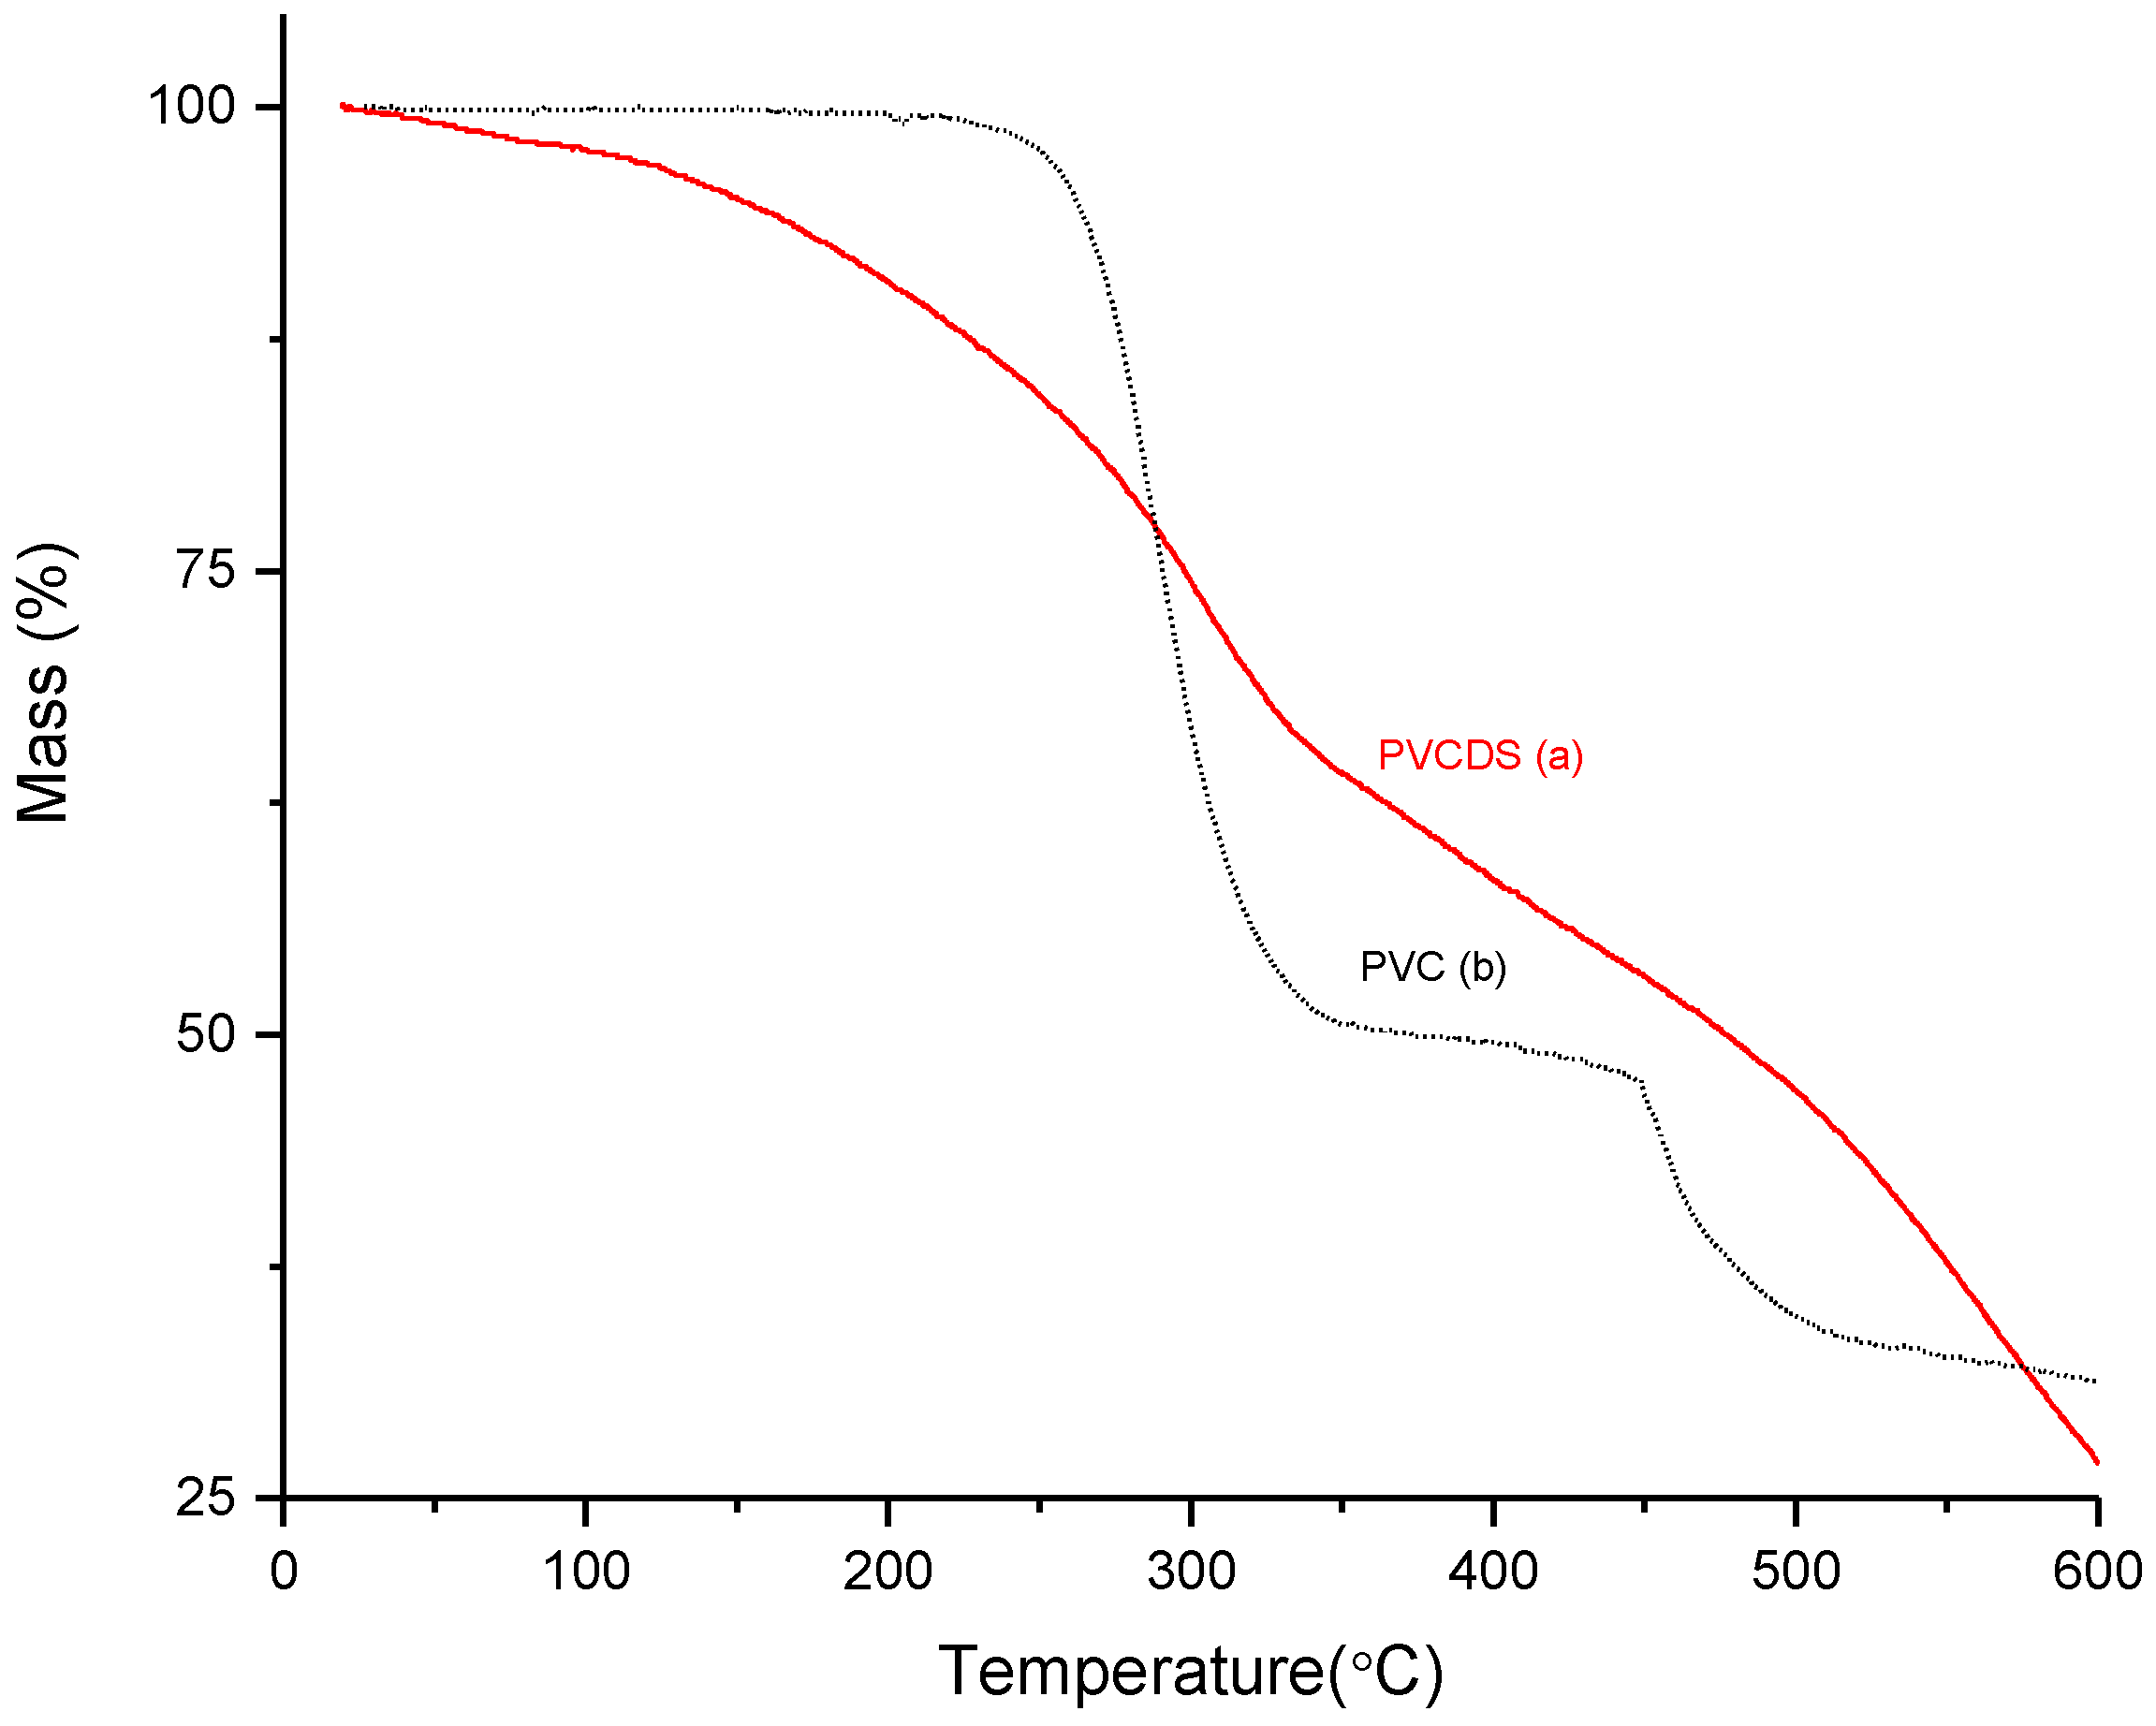
The thermal stability of the modified PVC was evaluated through thermogravimetric curves, as shown at
Figure 3. The original PVC presents three thermal events: (i) between 240 and 350 °C, attributed to thermal dehydrochlorination, with a reduction of about 56% in mass. The percentage of chlorine reduction corroborates the data for elemental analysis of the material; (ii) the second event started at approximately 450 °C is related to chain rupture after the condensation process and chain rearrangement reactions, and (iii) a third event can be observed and is assigned to decomposition of carbonaceous residues observed between 550 °C and 600 °C.
For the PVDCS, when considering that most chlorine present in the structure was removed by chemical dehydrochlorination, the thermal events are related to the removal of remaining chlorine (thermal dehydrochlorination) and other processes such as desulfonation, which leads to a decrease in the thermal stability of the modified polymer since materials with sulphonic groups exhibit decomposition between 200 °C and 400 °C [
22,
23,
24]. The obtained curves resemble those observed for other sulfonated materials. Other thermal events are observed at temperatures above 400 °C and may be related to the decomposition of the polymer due to the cleavage of the main chain.
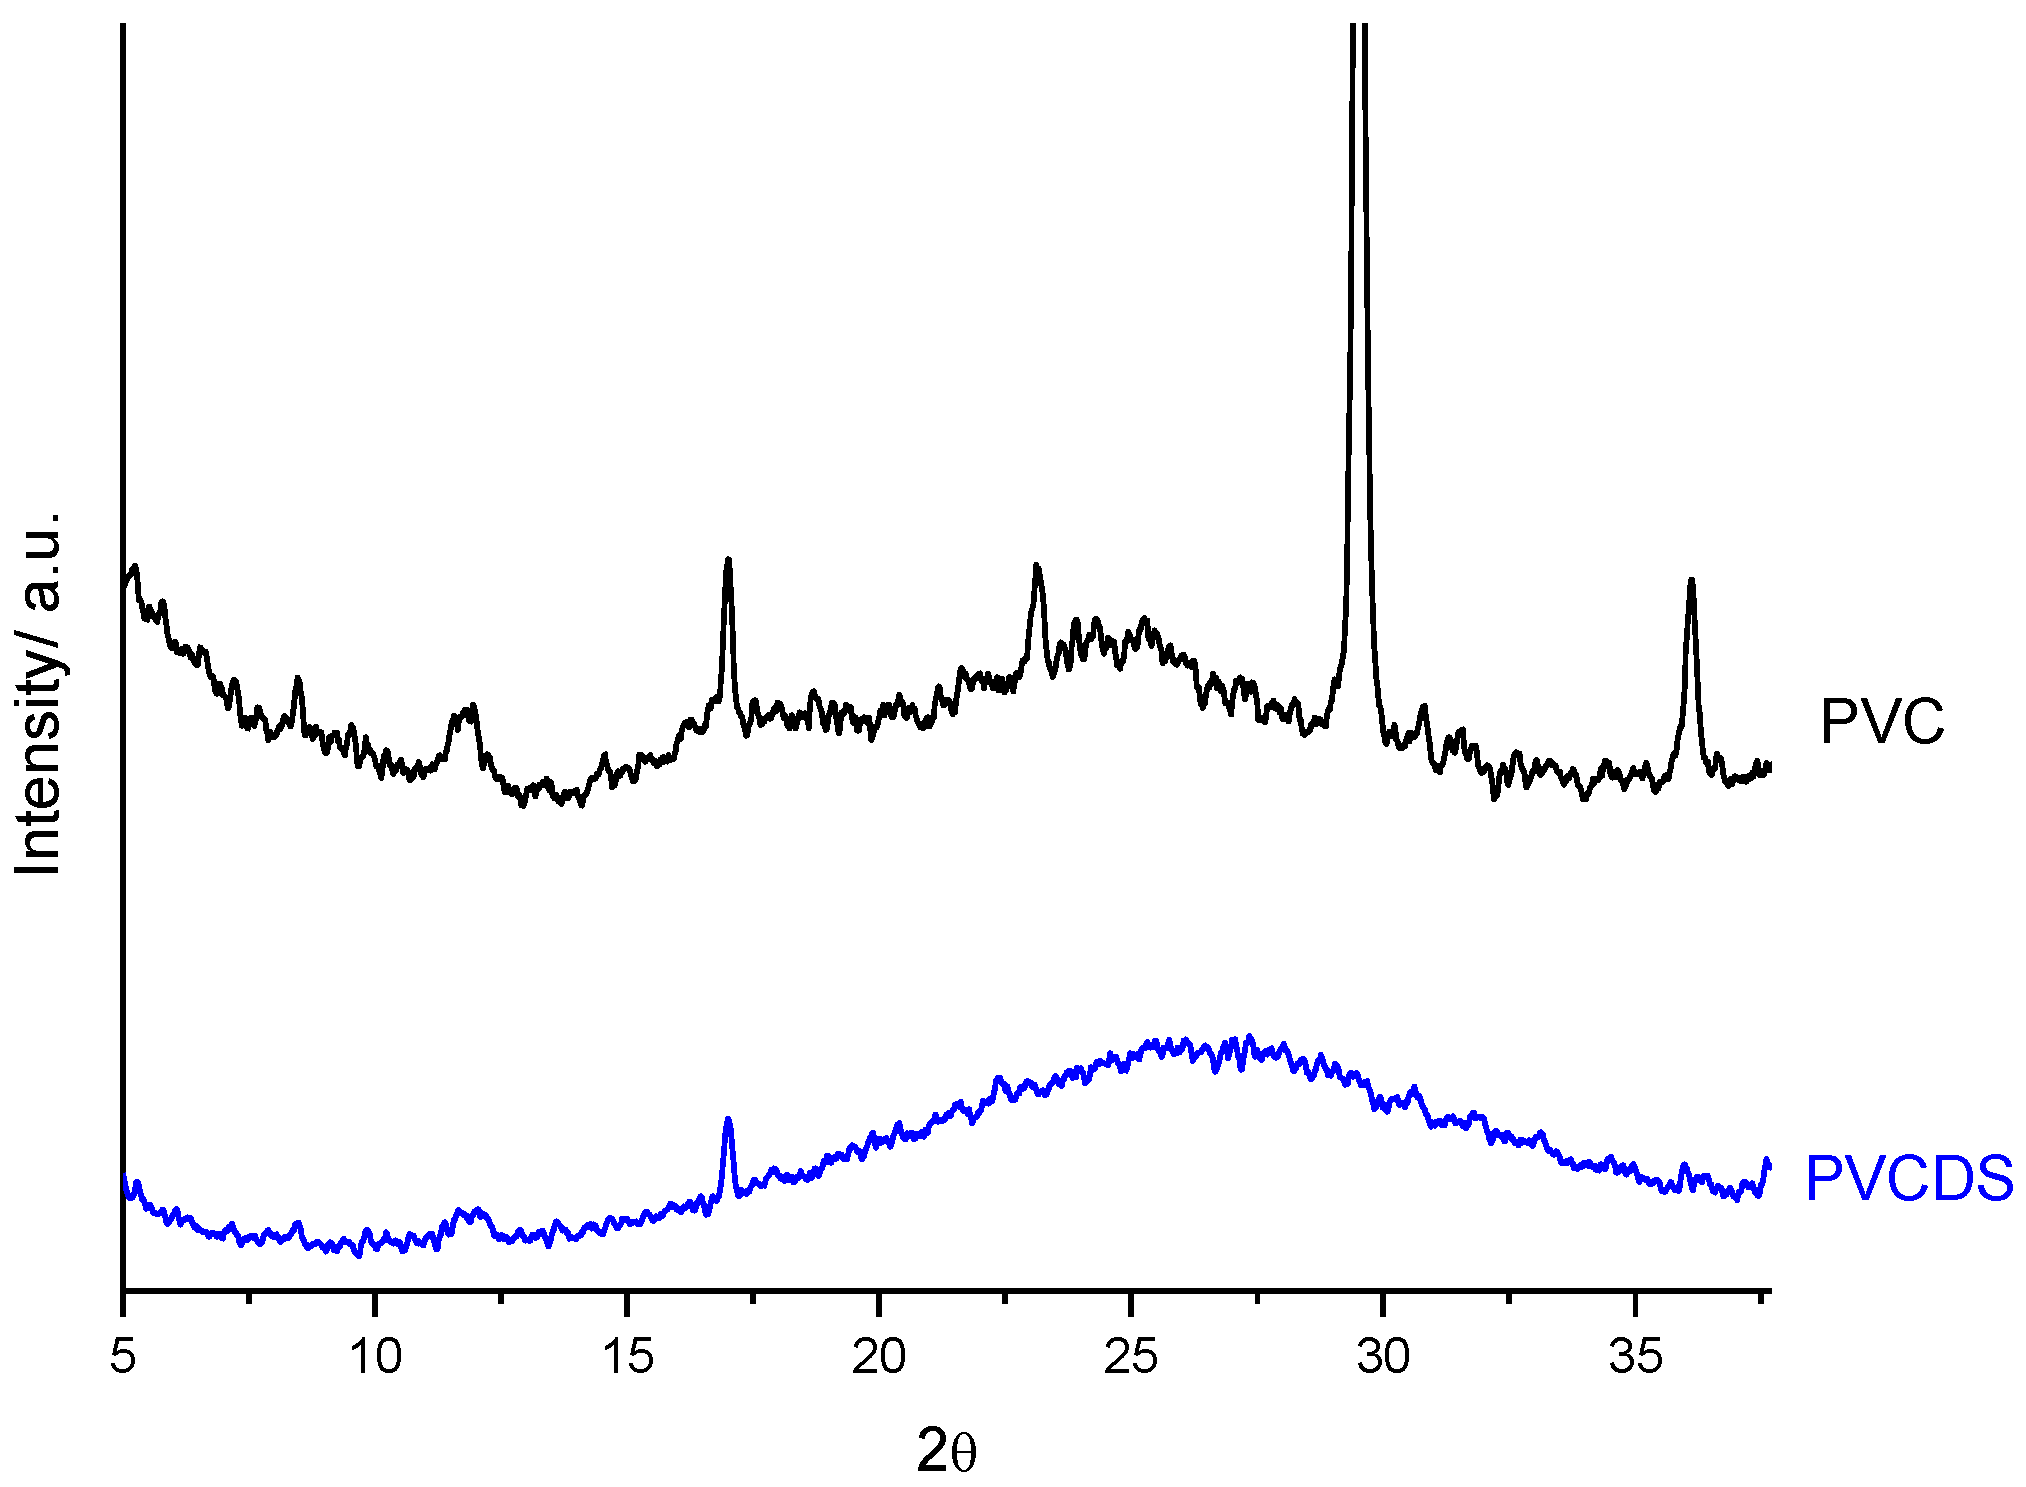
Figure 4 shows the X-ray diffraction for PVC and PVCDS. For PVC, it was observed the presence of the one peak at 2θ equal to 16.9° and halo centered at 24.6° 2θ, the first one associated to the crystalline regions of the PVC and the last one evidences the amorphous character of the original material [
25]. The polymer is semicrystalline, presumably showing to have a low crystallinity index which can be identified by the diffractogram profile.
The chemical modification of the PVC changes the diffraction pattern of the derivative produced (PVCDS), increasing the area of the halo between 19° and 25°, 2θ. This aspect indicates an increase in the amorphous fraction of the polymer. It is also observed a reduction in peak intensity at 17°, 2θ, which corroborates the previous assertion. The reduction of crystallinity increases the accessibility of the polymer, which can improve the adsorption process.
2.3. Adsorption Isotherm
Adsorption isotherms describe the relationship between the amount of substance that is adsorbed by an adsorbent and the concentration of the solution substance in equilibrium. The equilibrium studies provide, through models, an idea of the adsorption mechanism. The equations and isotherm parameters pertinent to each model are shown in
Table 5. The application of these models to the experimental data is presented in
Figure 9 and the parameters obtained are presented in
Table 6.
The evaluation of the parameters of the expressions representing each model (expressions of 2 or 3 parameters) provides a series of physico-chemical information such as adsorption capacity, surface properties, adsorbent affinity, and the interactions between adsorbate and adsorbent can be better understood [
11].
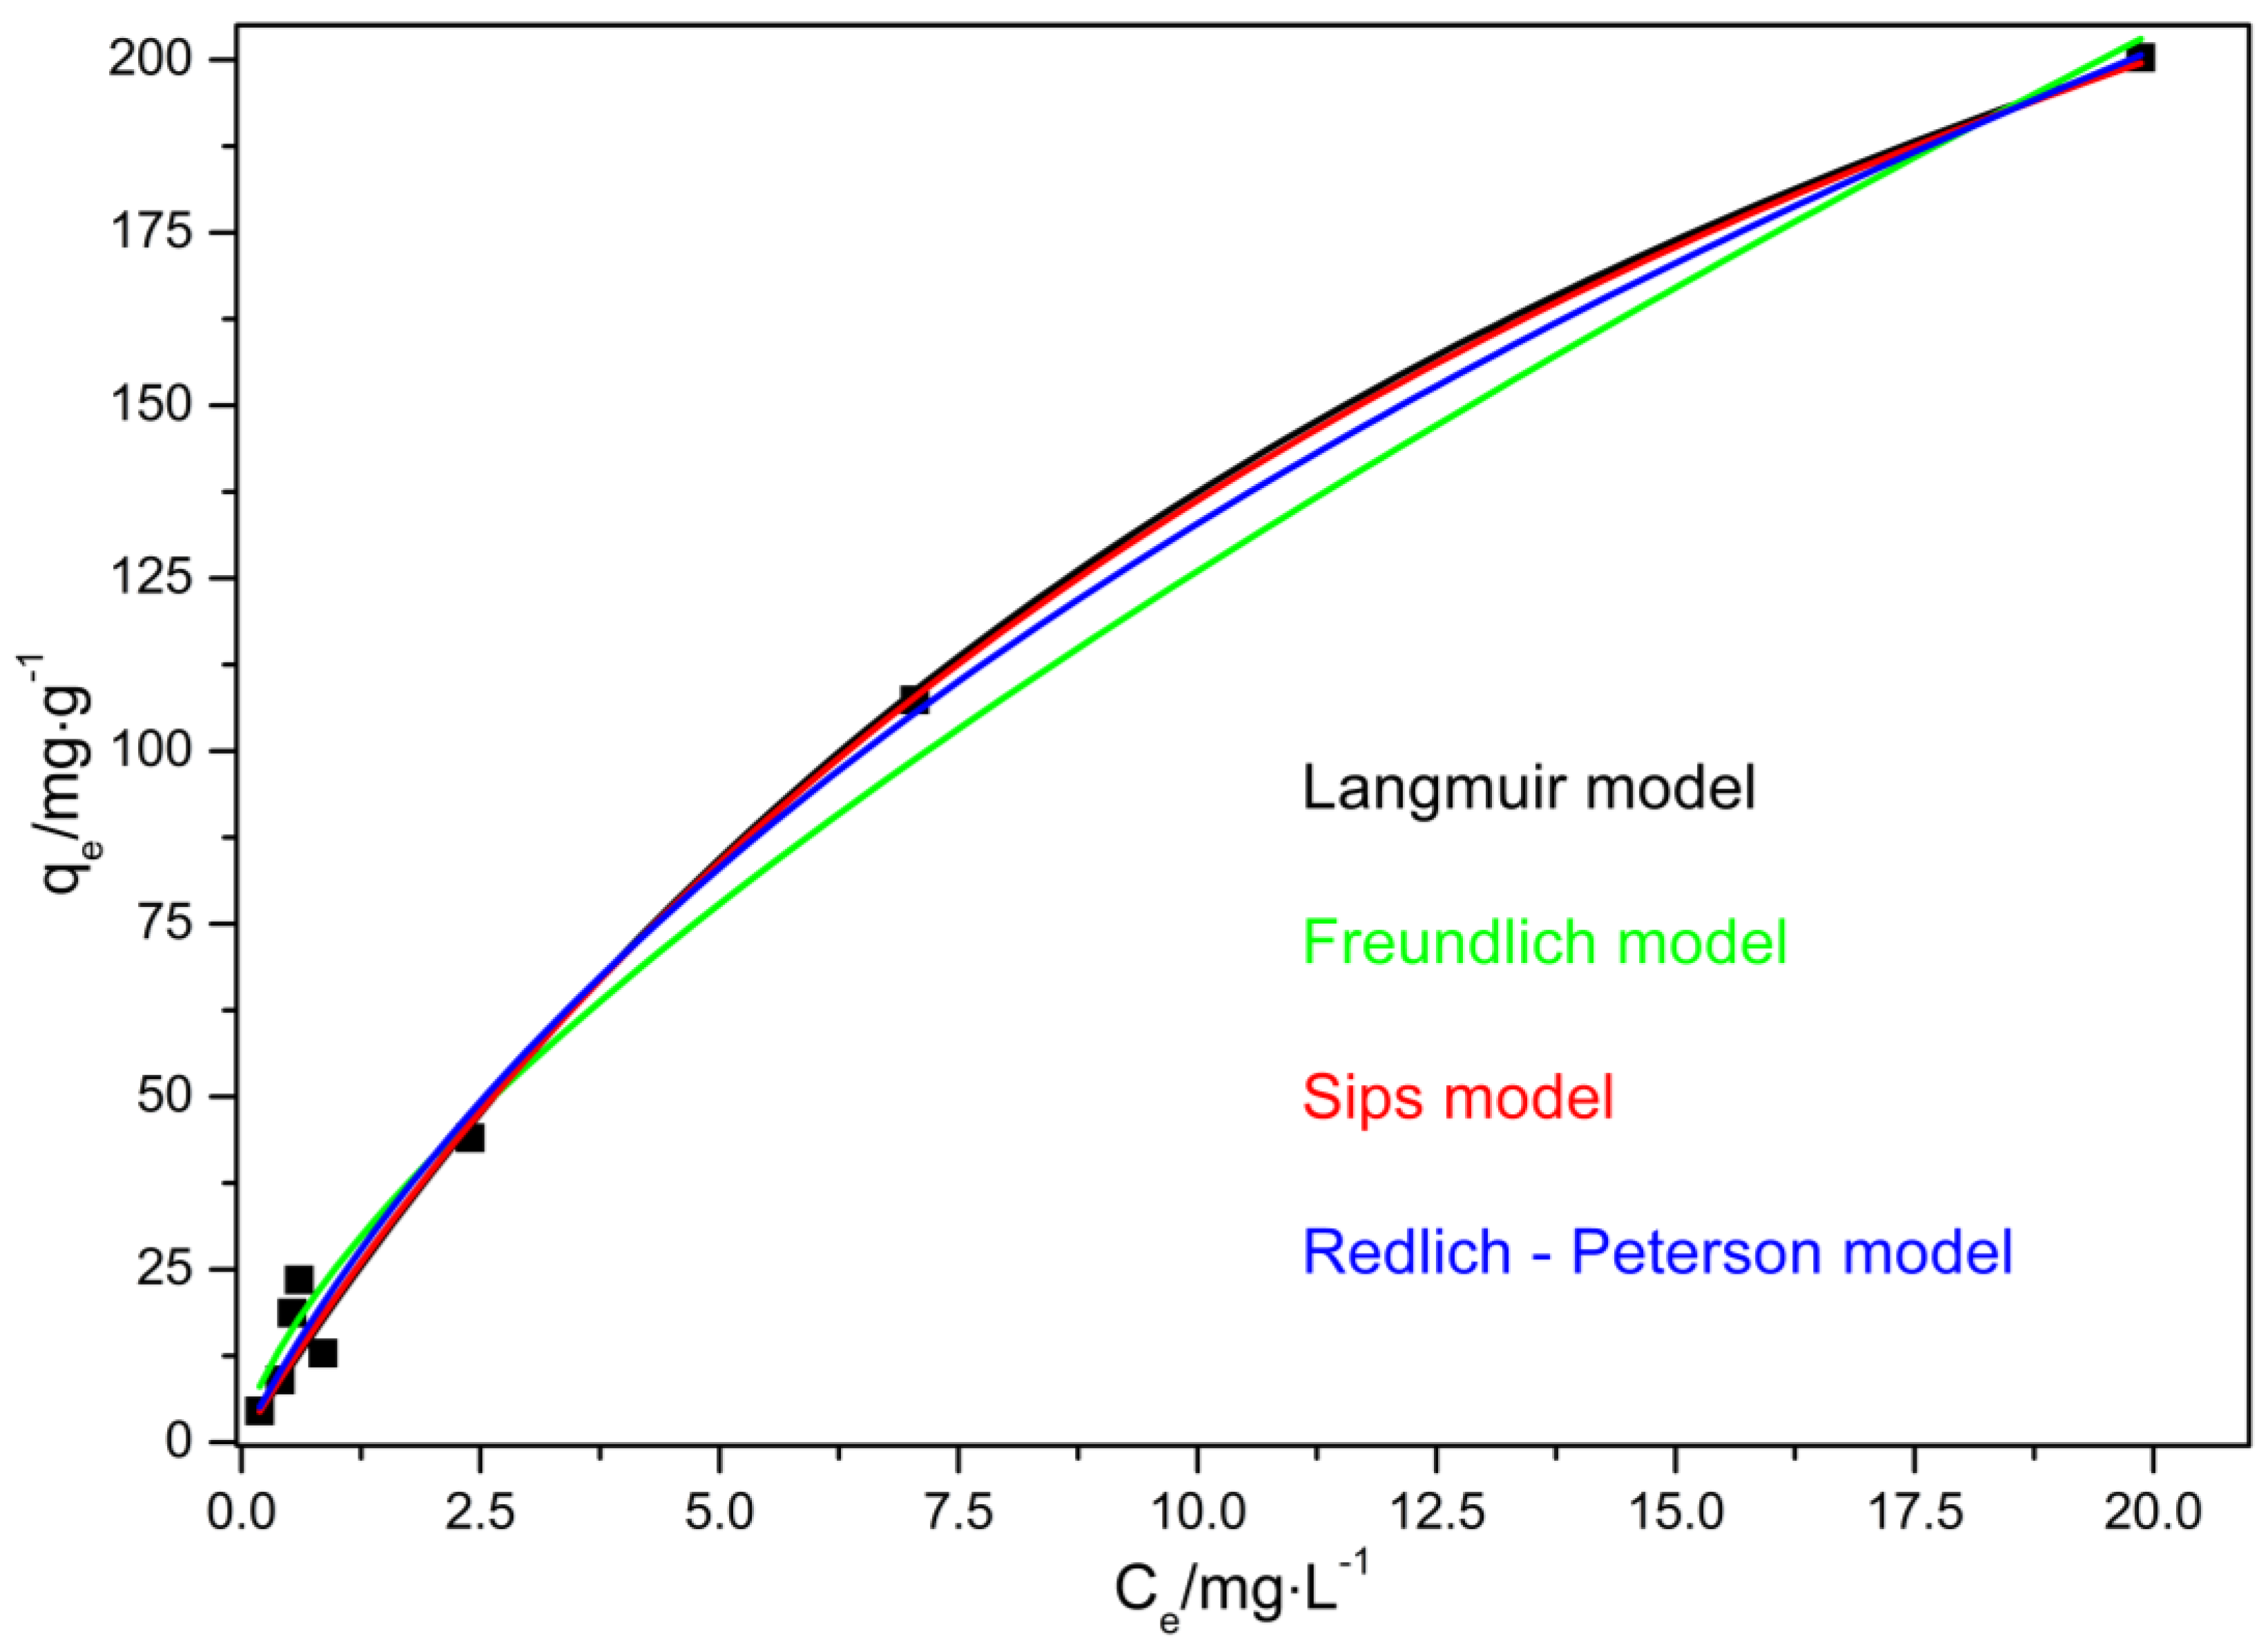
Figure 10 shows the application of the adsorption isotherm models to the experimental data.
The Langmuir and Freundlich isotherm are two-parameter models that provide information about adsorption capacities and activation energies of the adsorption process. The isotherms models that consider these three parameters are obtained from the articulation of the expressions of the Langmuir and Freundlich models, such as the Redlich-Peterson and Sips models.
As seen in
Figure 10, adsorption increases with an increasing concentration of VL at low dye concentrations, and tends to a near constant value at high dye concentrations. The results show that for the experimental conditions evaluated all the models present good adjustment of the experimental data since the coefficient of determination,
R2, presents values that aew superior to 0.99. Despite of that, it is possible to observe that the best adjustments were achieved through the Sips and Langmuir models.
The values for adsorption parameters are summarized in
Table 6.
Since the Sips and Langmuir models are the ones that better represent the experimental data, and the value of the ns parameter, obtained from the Sips model, is close to 1, the Langmuir model better represents the results that are obtained. In this sense, it is assumed that there is a homogeneous distribution of the active sites on the surface of the adsorbent (PVCDS).
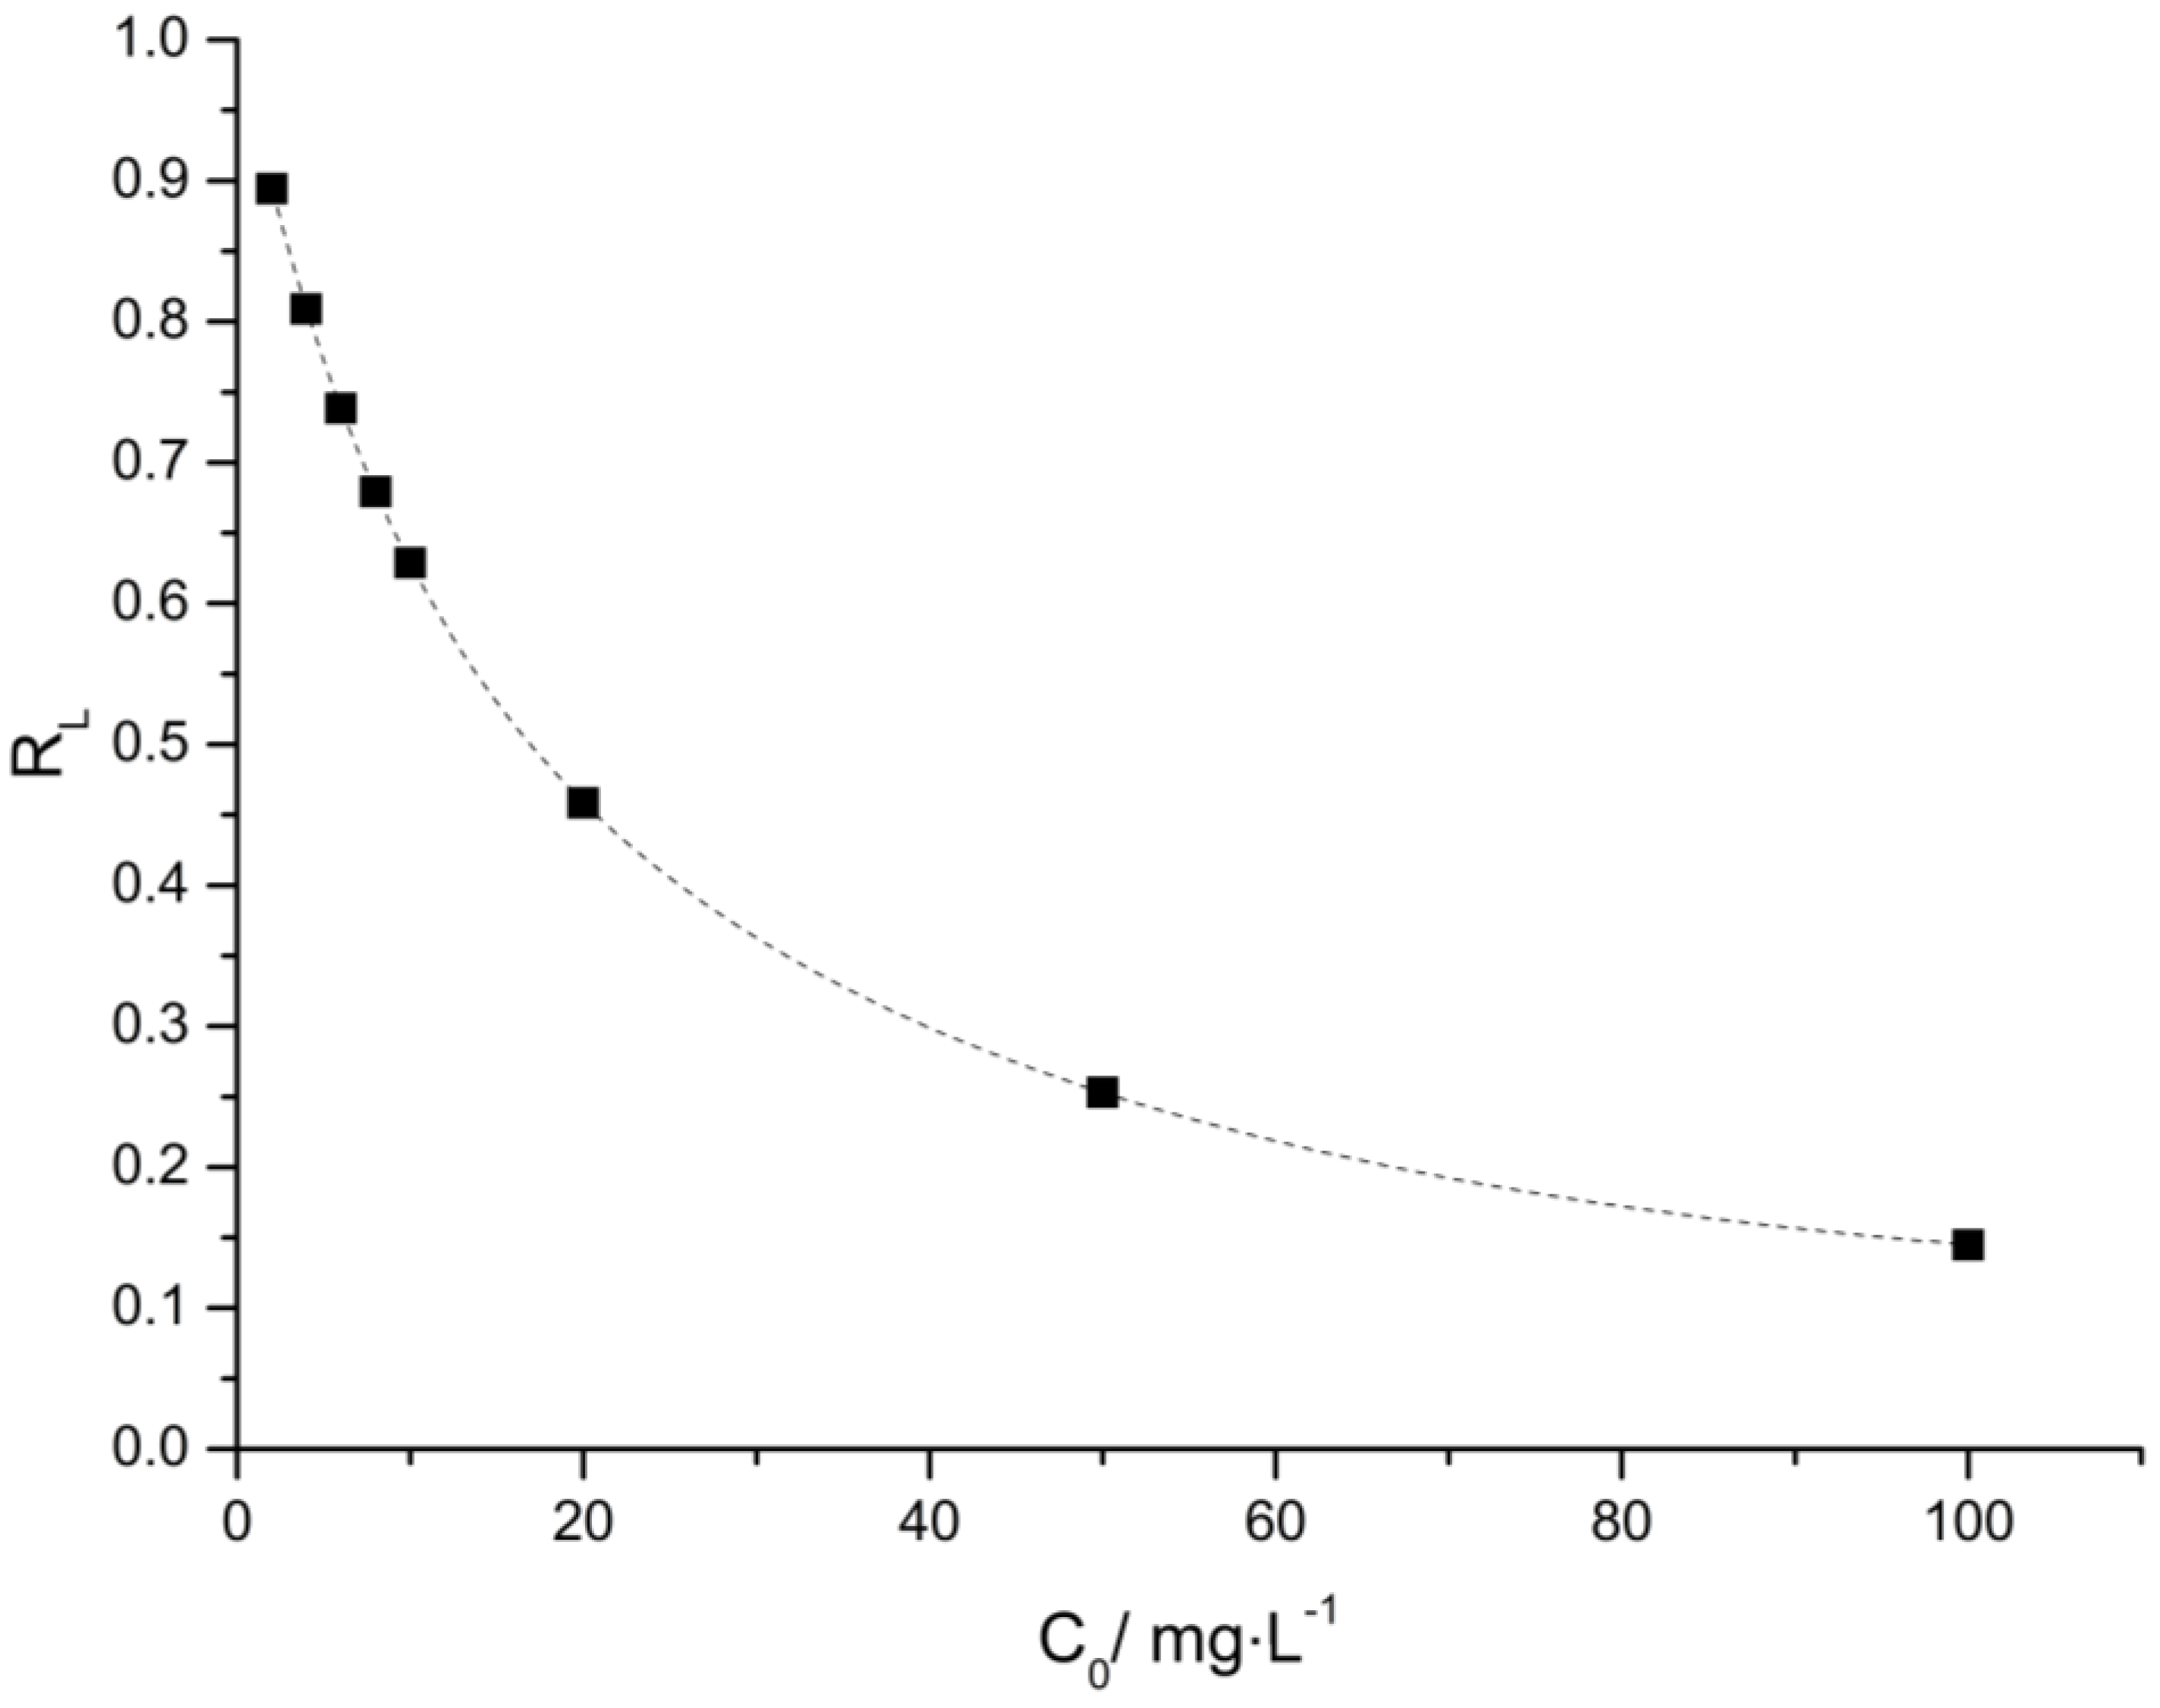
Another important aspect in the evaluation of the adsorption mechanism considering the Langmuir model is the calculation of the constant
RL Equation (2), separation factor found through the expression:
in which
KL is the equilibrium constant of Langmuir and
C0 is the initial concentration of the dye (mg·L
−1).
Figure 11 shows calculated
RL values at different initial dye concentrations.
Dimensionless constant,
RL, indicates the shape of the isotherms to be either unfavorable (
RL > 1), linear (
RL = 1), favorable (0 <
RL < 1), or irreversible (
RL = 0) [
32]. In
Figure 11, it was observed that
RL values were determined between 0.9027 and 0.1445 for PVCDS dyes. This indicates that the adsorption was more favorable with the higher the initial dye concentrations than for the lower concentrations. However, the adsorption process is favorable throughout the range of concentrations evaluated.
As seen in
Table 6, the maximum adsorption capacities for VL onto PVCDS for Langmuir and Sips models are 370.31 and 392.14 mg·g
−1, respectively. There are few studies in the literature dealing with VL adsorption. Dezhampanah et al. (2013) [
33], studied the removal of thionine dye (VL) from aqueous solutions using low-cost materials as adsorbent as rice husk. The results showed that VL was adsorbed efficiently in rice husk and the experimental data of equilibrium adsorption were better when adjusted through the Langmuir model. The rice husk presented good adsorption capacity of VL reaching the value of 8.67 mg·g
−1. The values found in this work are higher than those observed by Dezhampanah and this result is related to the significant difference of chemical structure between the lignocellulosic material (rice husk) and the chemically modified PVC. Bulut and Aydin (2006) [
34] investigated the methylene blue adsorption, a dye that has a similar chemical structure to VL, they verified that the maximum adsorption capacity depends strongly on the adsorbent, e.g., the adsorption in rice husk reached 40.58 mg·g
−1 and in active coal, 435 mg·g
−1.
The high adsorption capacity of the PVDCS is related to the chemical structure with the presence of a few sulfonic groups and the hydrophobic character of the polymeric chain, these two aspects, allied to the value of surface area can be the key to the favorable interaction and adsorption of the dye.

 ,
, 


