1. Introduction
With the development of industry, organic matter such as drugs, pesticides, surfactants, and raw chemical materials cause an increasing amount of pollutants in surface water, groundwater, sewage, and drinking water. It is even worse that most of these contaminants are complex and non-biodegradable, and therefore traditional water treatment methods cannot completely remove them. In recent years, photocatalysis has gained increasing attention due to the discovery of water splitting on a semiconductor electrode [
1,
2,
3,
4]. Over the past 20 years, photocatalysis has become a research topic of interest because of its practical applications in air and water remediation, self-cleaning, and self-sterilizing surfaces [
5,
6]. TiO
2, a well-known semiconductor, has been intensively investigated during this time. Some studies showed that TiO
2 represents one of the most promising materials for Surface Enhanced Raman Scattering (SERS), because of its high refractive index, versatile surface functionalization, synergistic coupling to plasmonic nanoparticles, cocatalysts, and so on. Thus it could be used to analyze and monitor the process of photocatalytic degradation [
7,
8,
9]. Meanwhile, TiO
2 with its extraordinary chemical stability, environmentally friendly, and biocompatible characteristics, has been intensively investigated as a benchmark material for many photocatalytic reactions [
10,
11,
12,
13,
14]. However, the application range of TiO
2 is still limited due to its wide band gap (3.2 eV) which requires ultraviolet irradiation for photocatalysts reaction [
10,
15,
16]. As we all know, ultraviolet (UV) light only accounts for 5% of the total solar energy, while visible light and near-infrared (NIR) account for 45% and 48%, respectively.
Many approaches have been adopted to extend the absorption range of TiO
2 towards the visible light region. Some researchers have made attempts to shift the band gap of TiO
2 towards visible light by doping metals [
17], rare earth metal [
18], or non-metals [
19,
20,
21], and by cationic substitutions [
22]. Also, it have been reported that TiO
2 coupling with nanoantennas could stimulate the photon-driven process and enhance the photodegradation rate because of the nanoantenna Surface Plasmon Resonance [
23]. However, these methods may introduce defects such as increased recombination of photogenerated electrons and holes, and result in decreased stability, service life, and photocatalyst efficiency of TiO
2, which is an even more serious problem [
24,
25].
Recently, rare-earth-doped upconversion (UC) nanophosphors have attracted a number of interests for their capability of extending the absorption range of TiO
2. UC luminescence can switch the long-wave radiation into short-wave radiation through multiphoton mechanisms, so that low-energy light can be changed into high-energy light. UC material could convert visible light into UV light. Rare-earth doped fluorides with low photon energies and high quantum efficiency can be used as luminescent upconversion materials [
26]. As a host material, fluorides such as NaYF
4 [
27,
28,
29], YF
3 [
30,
31], and LiYF
4 [
32] have become the hotspot in the research of upconversion luminescence transformation. Fluoride has relatively lower phonon energy and high UC efficiency, which can reduce the loss of non-radiation [
33,
34]. Moreover, fluoride has advantages such as high chemical stabilization, high mechanical strength, and a simple preparation process. Studies have reported that the YF
3 doped with rare-earth ions can emit UV light under visible light excitation [
31,
35]. With a favorable energy level structure and abundant transitions from UV to NIR region at various wavelengths, the rare-earth ion Ho
3+ is one of the most important active ions in upconversion luminescence (UCL) applications [
36,
37]. Therefore in this paper, YF
3:Ho
3+ was selected as an intermediate matrix to absorb visible light and emit UV light which was then transferred to TiO
2, so that high photocatalytic reaction efficiency was realized.
The core-shell structure as a coupling model has the potential to increase luminous efficiency. A series of studies have shown that such methods can be used to improve the use ratio of solar energy. For example, NaYF
4:Yb
3+, Tm
3+@TiO
2 core-shell nanoparticles have been reported to emit UV and visible light under 980 nm excitation and perform with higher efficiencies [
38,
39]. It is reported that NaYF
4 is better than YF
3 as an upconversion nanocrystal host matrix, but it remains difficult to obtain these kinds of hierarchical nanostructures and achieve a uniform TiO
2 coating. There were already some studies that have proven that YF
3 could be coated with TiO
2 successfully and stably [
16,
40,
41]. This paper aims to prepare a YF
3:Ho
3+@TiO
2 core/shell structure which is conducive for a TiO
2 shell to absorb the UV light from UCL [
42].
It has been previously reported that the YF
3:Ho
3+ nanoparticles can be synthesized by a facile hydrothermal method. Such YF
3:Ho
3+ nanoparticles exhibit good upconversion properties, which are conducive to emitting upconversion fluorescence around 288 nm under excitation at 450 nm [
43]. In this work, to realize the good UC properties of YF
3:Ho
3+, a highly efficient photocatalyst was prepared by coating YF
3:Ho
3+ nanoparticles with TiO
2. Therefore, the TiO
2 could use visible light to improve the degradation efficiency of the catalyst. The YF
3:Ho
3+@TiO
2 photocatalyst was prepared in this work by the hydrolysis of tetrabutyltitanate (TBOT) using PVP as the coupling agent. The influences of different dosages of TBOT on the materials’ morphology, size, and photocatalysis efficiency were investigated. In addition, the photocatalysis mechanism of YF
3:Ho
3+@TiO
2 and the apparent kinetics of RhB degradation are discussed in details.
2. Experimental and Methods
2.1. Materials
All chemicals were used as received without further purification. Y2O3 (99.999%, Chengdu Kelong Chemical Co., Ltd., Chengdu, China), Ho2O3 (>99.9%, Shanghai TongNai Environmental Protection Co., Ltd., Shanghai, China), NaF (Chengdu Kelong Chemical Co., Ltd., Chengdu, China), ethanol (Chongqing Chuandong Chemical Group Co., Ltd., Chongqing, China), ethylenediamine tetraacetic acid (EDTA) (Chongqing Boyi Chemical Co., Ltd., Chongqing, China), acetic acid (CH3COOH) (Chongqing Chuandong Chemical Group Co., Ltd., Chongqing, China), and tetrabutyltitanate (TBOT) (Chengdu Kelong Chemical Co., Ltd., Chengdu, China) were of analytical grade.
2.2. Preparation of YF3:Ho3+@TiO2 Photocatalyst
In this paper, YF
3 nanoparticles were first prepared based on Jun’s study [
42,
43], and then the YF
3:Ho
3+@TiO
2 photocatalyst was prepared by hydrolysis of TBOT using PVP as the coupling agent based on Qin’s work. In preparation processes, TBOT (6.0 mL) was first dissolved in ethanol (30.0 mL) and CH
3COOH (2.0 mL), and then the solution was vigorously stirred for 30 min to form precursor A; YF
3:Ho
3+ nanoparticles (0.02 g) were dispersed in ethanol (20.0 mL) and H
2O (4.0 mL) to form precursor B. After that, precursor B was added dropwise into precursor A at a rate of 1 mL/min while stirring for 1 h. After standing for 24 h, the resulting nanoparticles were dried at 105 °C, and then calcined by a heating rate of 2 °C/min to 400 °C for 2 h. The experimental parameters of the TBOT dosage and the hydrolysis reaction time are shown in
Table 1 below.
2.3. Photocatalytic Activity Measurements
In this research, RhB and phenol were used to test the photocatalytic activity of YF3:Ho3+@TiO2. The photocatalytic activity of YF3:Ho3+@TiO2 was evaluated via degradation of RhB and phenol under the irradiation of a 500 W Long arc xenon lamp with a UV cutoff filter (λ > 420 nm) under laboratory conditions using a Hitachi U-3010 UV-Vis spectrophotometer (Hitachi Corp., Tokyo, Japan).
For specific test procedures, first add 0.15 g of photocatalyst material in 500 mL of 5 mg/L solution of rhodamine B (RhB) and 500 mL of 5 mg/L solution of phenol respectively for a dark-reaction for half an hour, so as to achieve adsorption—desorption equilibrium between the pollutants and photocatalyst. Then, place the reaction system 30 cm away from the light source to be irradiated for 10 h. Take out 8 mL of the samples once every 2 h. Finally, perform centrifugation treatment for the samples and then test the absorbance of RhB at 552 nm using UV-Vis. Test the absorbance of phenol at 510 nm using 4-amino antipyrine as the chromogenic reagent under UV-Vis.
2.4. Characterization
The crystal structures of all prepared samples were characterized by X-ray diffraction (XRD) using a Rigaku D/Max-2500pc diffractometer (JEOL Ltd., Tokyo, Japan) with Cu Kα radiation, where the 2θ scanning angle ranged from 10° to 80°. The surface chemical environments were analyzed by X-ray photoelectron spectra (XPS) on a PHI5000 Versa Probe system (JEOL Ltd., Tokyo, Japan) with monochromatic Al Kα X-rays. Scanning electron microscopy (SEM) images were acquired with a JSM-7800F JEOL emission scanning electron microscope (Zeiss, Oberkochen, Germany). Energy dispersive X-ray (EDS) images were acquired with an EDX-100A-4 (Zeiss, Oberkochen, Germany). Transmission electron (TEM) microscopy was carried out on a FEI Tecnai G20 (JEOL Ltd., Tokyo, Japan) operated at an acceleration voltage of 200 kV. UV-Vis diffuse-reflectance spectroscopy (UV-Vis DRS) and UV-Vis absorption spectra were conducted with a Hitachi U-3010 UV-Vis spectrometer (Hitachi Ltd., Tokyo, Japan). The sample for electron spin resonance (ESR) measurement was prepared by mixing β-NaYF4:Ho3+@TiO2 samples in a 50 mM DMPO solution tank (aqueous dispersion for DMPO- OH and methanol dispersion for DMPO-·O2−). Upconversion photoluminescence spectra were recorded using a Horiba Jobin Yvon fluorescence spectrophotometer (Fluorolog-3; excitation source power, 0–450 W, Horiba Scientific Ltd., Tokyo, Japan).
3. Results and Discussion
3.1. X-ray Diffraction (XRD) Pattern Analysis
The phase structures of the materials were characterized by XRD measurements. The XRD patterns of pure TiO
2, YF
3, and YF
3:Ho
3+@TiO
2 with different TBOT dosages are shown in
Figure 1. All the diffractions of the YF
3:Ho
3+@TiO
2 could be assigned to the anatase TiO
2 (JCPDS No. 21-1272). As we all know, among all the crystal types of TiO
2, the anatase TiO
2 has the highest photocatalysis efficiency. Hence, the prepared materials have excellent photocatalytic capacity.
In addition, the XRD shows that only YF3:Ho3+@TiO2 doped with 0.1 mL TBOT coincides weakly with the YF3 standard (JCPDS No. 74-0911), while the others only show the diffraction peak of anatase TiO2. This is mainly because when the dosage of TBOT was too high, the content of TiO2 in the material would be relatively high, making the YF3:Ho3+ content lower than its detection limit. It may also be due to the fact that when YF3:Ho3+ was covered by TiO2, the strong diffraction peak of TiO2 would hide the diffraction peak of YF3:Ho3+, so that the diffraction peak of YF3:Ho3+ would show up only when the dosage of TBOT was reduced to a certain degree.
From the XRD results, we can see that the photocatalyst material YF3:Ho3+@TiO2 is synthesized by the hydrolysis of TBOT. Changing the dosage of the TBOT cannot change the phase and crystal of the UCL material, but can only affect the relative proportion between anatase TiO2 and YF3:Ho3+, thereby affecting the degradation efficiency.
3.2. Morphology and Composition Analysis by Transmission Electron Microscopy (TEM)
3.2.1. TEM
The TEM images of YF
3:Ho
3+@TiO
2 with different dosages of TBOT are shown in
Figure 2a–g, from which we can see that TiO
2 nanoparticles with particle sizes of about 10 nm stick to the UCL material. YF
3:Ho
3+@TiO
2 is overall homogeneous, but in an agglomerated state. The amount of TiO
2 doped on the YF
3:Ho
3+ increases with the increase of the TBOT dosage. When the dosage of TBOT is small, TiO
2 cannot evenly coat the YF
3:Ho
3+, making a part of the YF
3:Ho
3+ still exposed. With the increase of the TBOT dosage, YF
3:Ho
3+ is coated by the TiO
2 particles gradually.
3.2.2. Energy Dispersive X-ray (EDS) Line Scan under High Resolution TEM (HRTEM)
Figure 2h shows the high resolution image of TiO
2 shell coated on the surface of the YF
3.
Figure 2j shows the EDS line scanning profiles which are recorded along the white line as presented in
Figure 2i. The EDX elementary line scanning was used to further determine the composition of the composite, and to prove whether the synthesized materials were of a core-shell structure or not. As shown in
Figure 2j, there are signal detections of both YF
3:Ho
3+ and TiO
2 at point A where the scanning starts. As the scanning goes outside and comes close to point B, the signal of Ti drops while Y increases. At point C, Ti gradually reduces to the minimum level while Y grows to the maximum level. When the scanning reaches the other end of YF
3:Ho
3+ at point D, Y begins to decrease while Ti gradually increases. This is obvious evidence to prove that the synthesized materials have a core-shell structure and the TiO
2 is strongly coupled on YF
3:Ho
3+.
3.3. Chemical States Investigation by X-ray Photoelectron Spectroscopy (XPS)
X-ray photoelectron spectroscopy (XPS) was used to examine the chemical states of the elements on the surface of the YF
3:Ho
3+@TiO
2 core-shell materials.
Figure 3a shows the full survey spectrum which reveals the co-presence of Ti, O, Y, F, and Ho. In
Figure 3b, the binding energy of 462.98 and 457.28 eV, which are respectively labeled as Ti 2p
1/2 and Ti 2p
3/2, are consistent with the typical values reported for TiO
2 [
44]. According to the asymmetric profile of O 1s shown in
Figure 3c, it can be seen that more than one kind of oxygen species exists. It was reported that when the binding energy was around 528.58 eV, the peak corresponded to the characteristic peak of Ti–O–Ti; while if the binding energy was around 530.08 eV, the peak was attributed to H–O. According to
Figure 3d, the three peaks at 156.38, 158.88, and 161.08 eV all corresponded to Y 3d. Element F shows two peaks at 682.78 and 685.28 eV, respectively, which correspond to F 1s (see
Figure 3e). In addition to the main elements in the YF
3 nanoparticles, the doping elements in these nanoparticles were also detected. The peaks at 156.28, 158.78, and 160.88 eV (see
Figure 3f) are attributed to the Ho
3+ ions. XPS results show that rare earth ions have been successfully incorporated into the YF
3 host matrix.
3.4. Optical Spectra Investigation
3.4.1. UV-Vis Diffuse Reflection Spectroscopy
To analyze the optimal absorption wavelength of the synthesized YF
3:Ho
3+@TiO
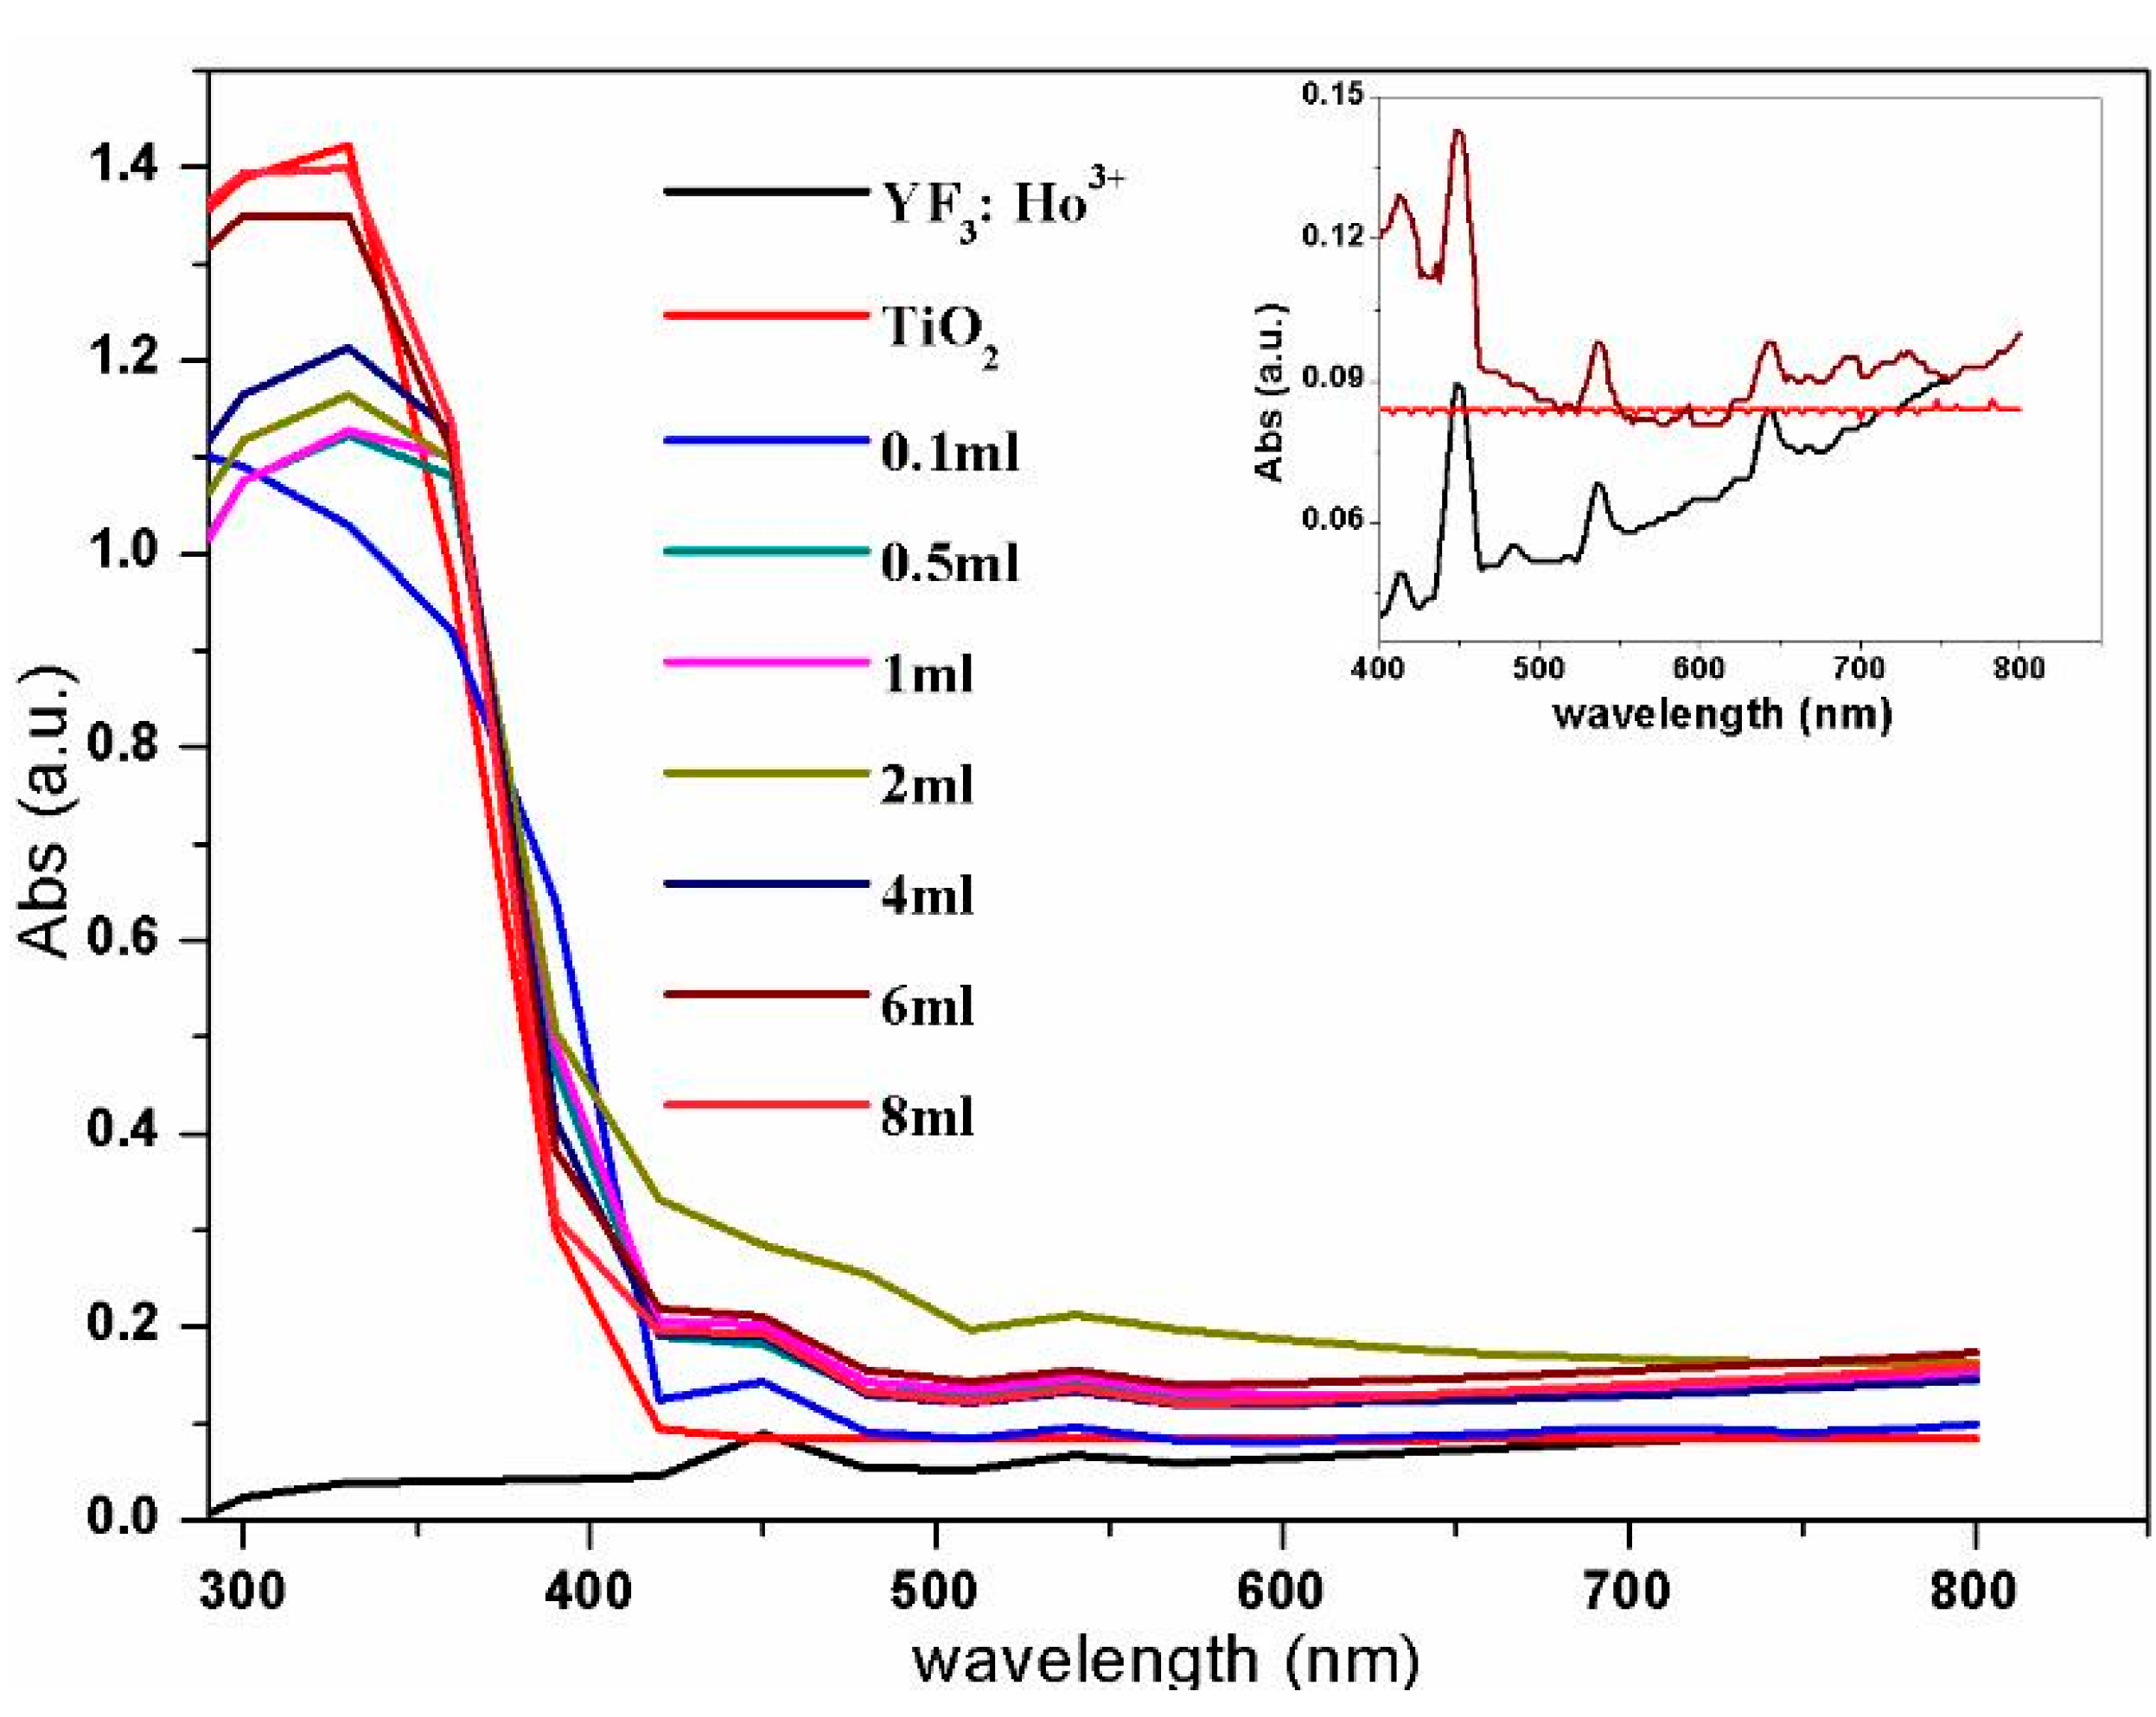
2 material, the UV-Vis diffuse reflection spectroscopy was investigated.
Figure 3 shows the representative spectra of YF
3:Ho
3+@TiO
2 and YF
3:Ho
3+. From the spectrum of YF
3:Ho
3+@TiO
2, we can observe a light absorption edge before 400 nm, which is overlapped with that of TiO
2. Moreover, it confirms that the YF
3:Ho
3+@TiO
2 material can absorb the light with wavelengths between 300 and 700 nm, which is shown in the spectrum of YF
3:Ho
3+. There are three absorption peaks in the visible light region (450 nm, 538 nm, 644 nm), where the intensity of the 450 nm peak is relatively higher. As we can see from
Figure 4, for one wavelength, the stronger the absorption peak’s light absorption ability is, the more suitable that wavelength is for excitation. Hence, 450 nm was selected as the excitation wavelength of YF
3:Ho
3+@TiO
2, which is consistent with the goal of utilizing visible light as the excitation source for UCL materials.
3.4.2. Fluorescence Spectrum Analysis
Figure 5 shows the fluorescence emission spectra of YF
3:Ho
3+@TiO
2 under the visible light excitation at 450 nm, from which we can see that all the prepared samples share the similar upconversion luminescence properties as YF
3:Ho
3+. There is a strong emission peak at 288 nm, which resulted from the transition of the Ho
3+ ion from
5D
4→
5I
8. When YF
3:Ho
3+ is doped with TiO
2, the upconversion luminescence capacity becomes weaker. This may be due to the fact that the UV light emitted by the UCL after absorbing visible light would be absorbed by TiO
2, and moreover, with the increase of the TBOT dosage, the TiO
2 doped on the YF
3:Ho
3+ would hinder the excitation light from arriving at the YF
3:Ho
3+, resulting in reduced excitation light energy for YF
3:Ho
3+ [
45]. In addition, a large number of TiO
2 loaded on the YF
3 surface would also absorb most of the UV light and decrease the excitation intensity of YF
3:Ho
3+.
3.5. Photocatalysis Mechanism of RhB Degradation
According to Jun’s study [
43], there are two upconversion mechanisms for YF
3:Ho
3+, of which one is a two-photon upconversion fluorescence mechanism and the other one is a three-photon upconversion fluorescence mechanism.
To further determine the photocatalysis mechanism of YF
3:Ho
3+@TiO
2, this paper detected the photogenerated radicals during the photocatalysis process by the ESR technique [
46,
47,
48].
For the capacity of generating radicals, such as the DMPO-hydroxyl radical (·OH) and DMPO-superoxide radical (·O
2−), 5,5-dimethyl-1-pyrroline-
N-oxide (DMPO) has been generally used for trapping radicals. According to the results shown in
Figure 6, we can see that the signals of ·OH and ·O
2− are obvious and clear. The intensities of these two radicals’ signals increase considerably after irradiation for 6 min. Hence, the ·OH and ·O
2− are two main oxidative species for the YF
3:Ho
3+@TiO
2 system. Moreover, RhB is speculated to react with these two radicals during its photocatalytic degradation, and the response equation is shown as follows.
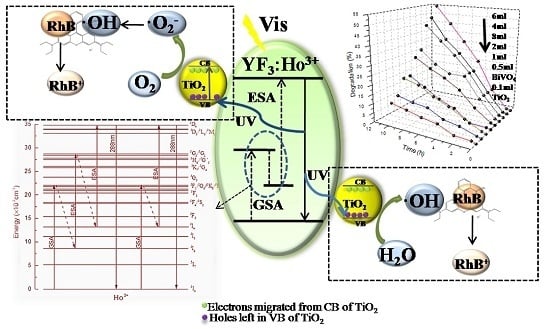
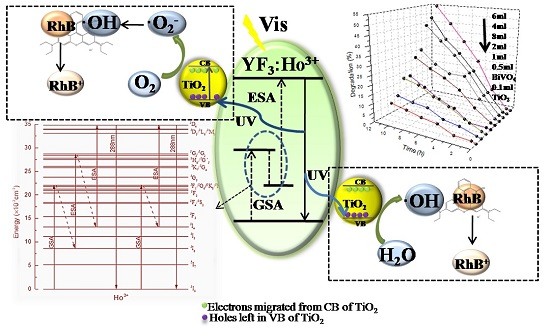
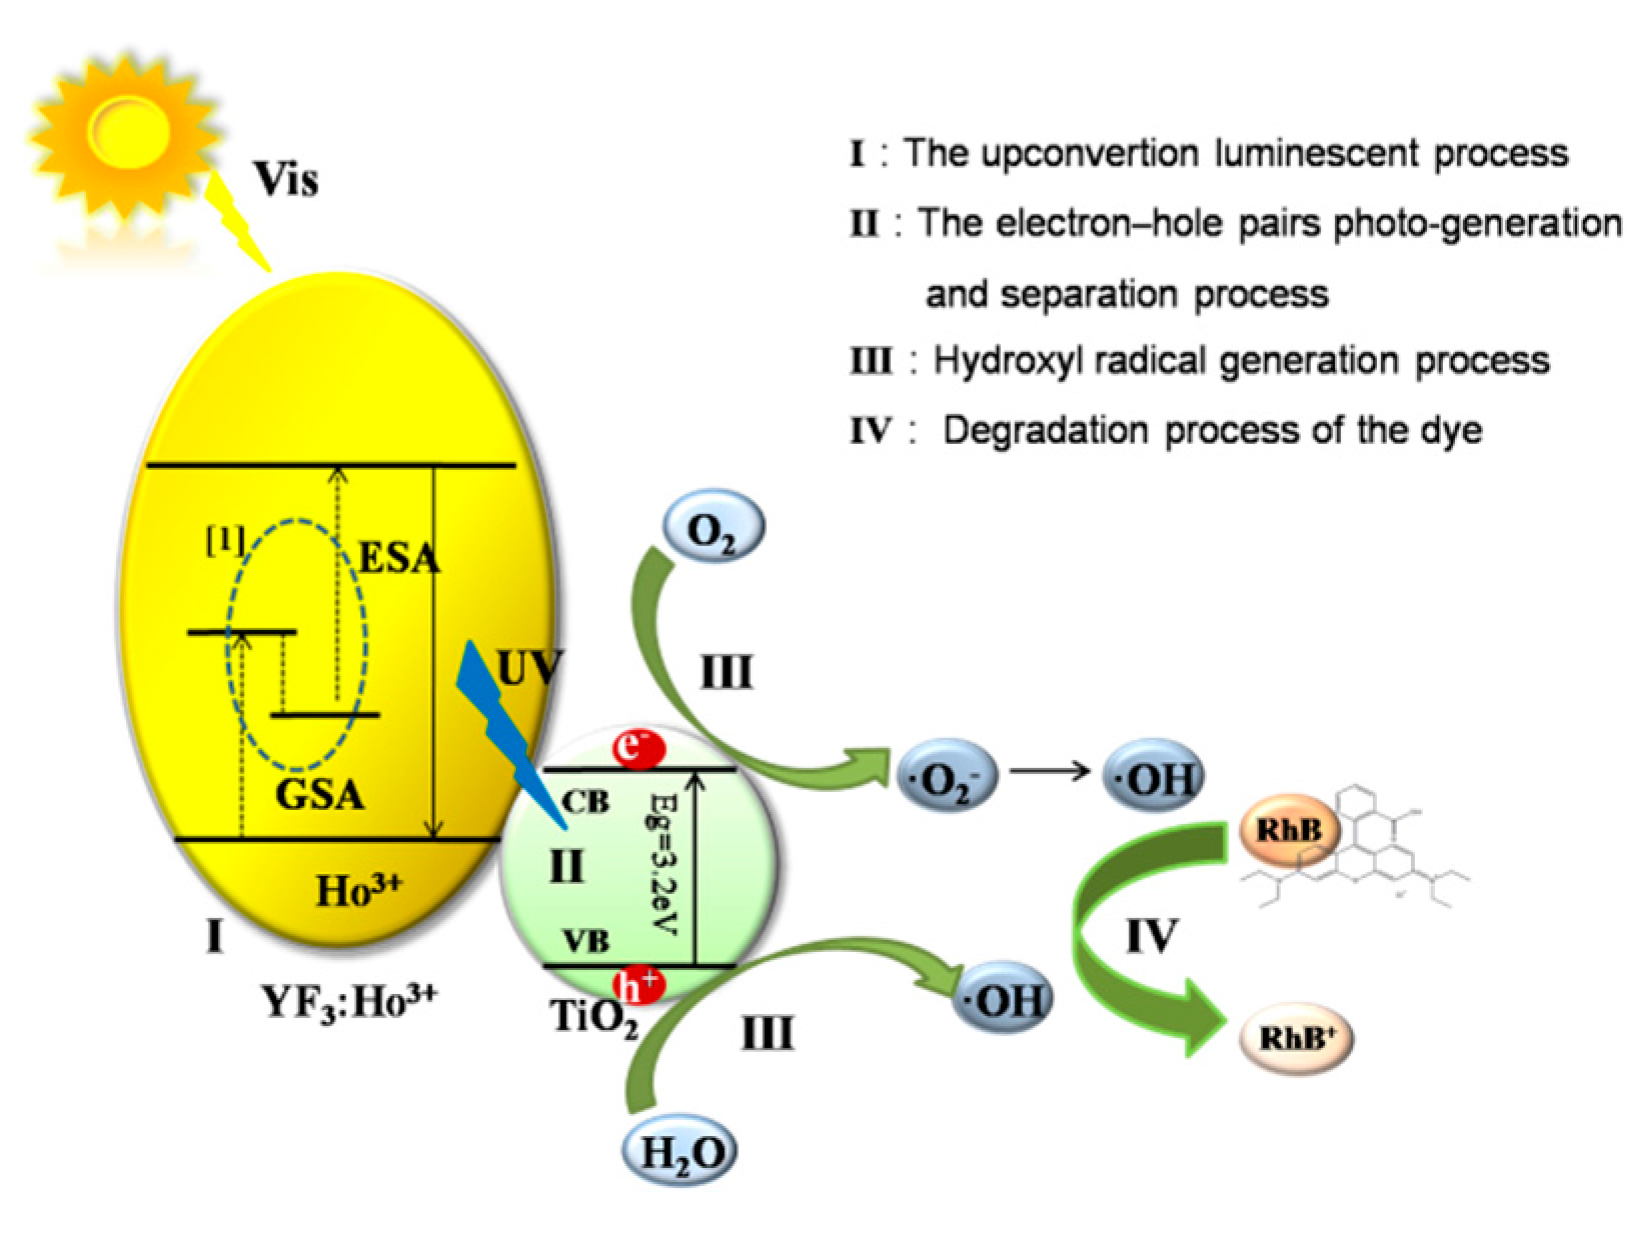
Besides, based on the response equation, this paper also theorizes a possible reaction process shown in
Figure 7. Firstly, the UCL material YF
3:Ho
3+ emits UV light after absorbing visible light (R1). Then, TiO
2 trapped on the UCL surface will generate electron-hole pairs through UV excitation (R2). The excited electrons on the TiO
2 surface react with oxygen to form ·O
2− and HO
2, and then the resulted HO
2 combines with H
+ to form hydrogen peroxide later (H
2O
2; R4). When ·O
2− meets H
2O
2, it will generate ·OH (R5); meanwhile, the photogenerated holes at (R2) will react with H
2O to form ·OH (R3). For the conduction band of TiO
2 located above the RhB redox potential, the oxygen species (·OH, ·O
2−, and H
2O
2) could oxidize the RhB to realize the purpose of RhB’s degradation.
3.6. Photocatalysis Application
Figure 8a,b show the influences of YF
3:Ho
3+@TiO
2 with different dosages of TBOT on RhB and phenol degradation, respectively. All the samples have almost zero adsorption efficiency both for RhB and phenol, wherein the most significant one is less than 1%. For the RhB and phenol, the photocatalytic degradation efficiency first increases then decreases with the increase of the TBOT dosage. When the dosages of TBOT are 6 mL, it can obtain the highest degradation efficiency (67%) of RhB as well as the highest degradation efficiency (34.6%) of phenol. According to the analyses above, this could be due to the fact that when the TBOT dosage increased, more TiO
2 would be doped on the YF
3:Ho
3+, and thus more UV light would be absorbed, resulting in more excited electron-hole pairs and an improved degradation efficiency of RhB and phenol. However, when the dosage of TBOT continued to increase to 8 mL, the degradation efficiency would be decreased for both RhB and phenol. According to the TEM of YF
3:Ho
3+ in
Figure 3, when the dosage reaches 8 mL, the YF
3:Ho
3+ is covered by TiO
2 completely, which will affect the absorption of visible light and the conversion from visible light to UV light, thus reducing the photocatalytic activity of YF
3:Ho
3+@TiO
2.
This paper also tested the photocatalytic efficiency of P25, TiO2 (prepared using a similar method as YF3:Ho3+@TiO2 without YF3:Ho3+), and BiVO4, respectively. For RhB degradation, the results showed that the efficiency of P25 was 12.2%, the efficiency of TiO2 was 17.8%, and the efficiency of BiVO4 was 22.6%. For phenol degradation, the results showed the efficiency of P25 and TiO2 was nearly zero, and the efficiency of BiVO4 was 9.7%, all of which were less than that of YF3:Ho3+@TiO2. Therefore, it can be concluded that the YF3:Ho3+@TiO2 material can make up for the defects of TiO2 (which is unable to have a photocatalytic reaction under visible light irritation), and has a higher photocatalytic efficiency than the common visible light photocatalyst BiVO4.
3.7. Influencing Factors of the Photocatalytic Degradation Reaction
The influencing factors of photocatalytic reaction include photocatalyst dosage (mcata), substrate concentration (C0), and irradiation intensity (E), which are also the three major factors that affect the ka coefficient of the photocatalytic kinetics equation, according to the Langmuir-Hinshelwood equation (other factors are not considered). This paper has studied a series of experiments to figure out how the apparent photocatalytic degradation kinetics change with these three factors.
3.7.1. The effect of mcata
Figure 9 shows how different dosages of YF
3:Ho
3+@TiO
2 affect the photocatalytic efficiency. For the experiment, this paper changes the dosages of the photocatalyst from 0.05 to 0.25 g. And the result shows that with the increasing YF
3:Ho
3+@TiO
2 dosage, the degradation efficiency of RhB first increases and then decreases. This may be due to the fact that the increased photocatalyst dosage not only improved the photon efficiency to generate more photogenerated radicals, but also increased effluent turbidity, causing light scattering to decrease photon efficiency. After fitting, an equation can be obtained as shown below.
If
, i.e.,
, there will be two conditions,
m = 0.05 g–0.15 g and
m = 0.15 g–0.25 g. Through the ln
k-ln
m graph, we can obtain k
1 = 0.76638, b = 0.31835 (R
2 = 0.93077) and k
1 = 0.14273, b = −0.56254 (R
2 = 0.92079). Then there is:
3.7.2. The effect of C0
This paper tested different concentrations of substrate (RhB) for photodegradation.
Figure 10 shows how different concentrations of substrate affect the photocatalytic efficiency. The degradation efficiency of RhB decreases with the increase of the substrate concentration. When the concentration of the substrate is 4 mg/L, the photocatalytic efficiency reaches the highest value, which is 76%, and when it is 8 mg/L, the photocatalytic efficiency reaches the lowest value, which is 56%. This is mainly because when the concentration of the substrate is relatively low, the photocatalyst YF
3:Ho
3+@TiO
2 is in excess, and then the photocatalytic efficiency of RhB will be relatively high. On the contrary, when the concentration of the substrate is high, the photocatalyst YF
3:Ho
3+@TiO
2 is no longer sufficient, and all of the photocatalyst needs to take part in the photodegradation. At this time, while the photodegradation rate is at its highest value, the apparent degradation efficiency will decrease with the increase of the substrate concentration, and thus photodegradation efficiency will be worse. However, when the concentration of the substrate is too high, it will reduce the light transmittance of the solution, thus reducing the photocatalytic activity.
After fitting, an equation can be obtained as shown below.
3.7.3. The effect of irradiation intensity
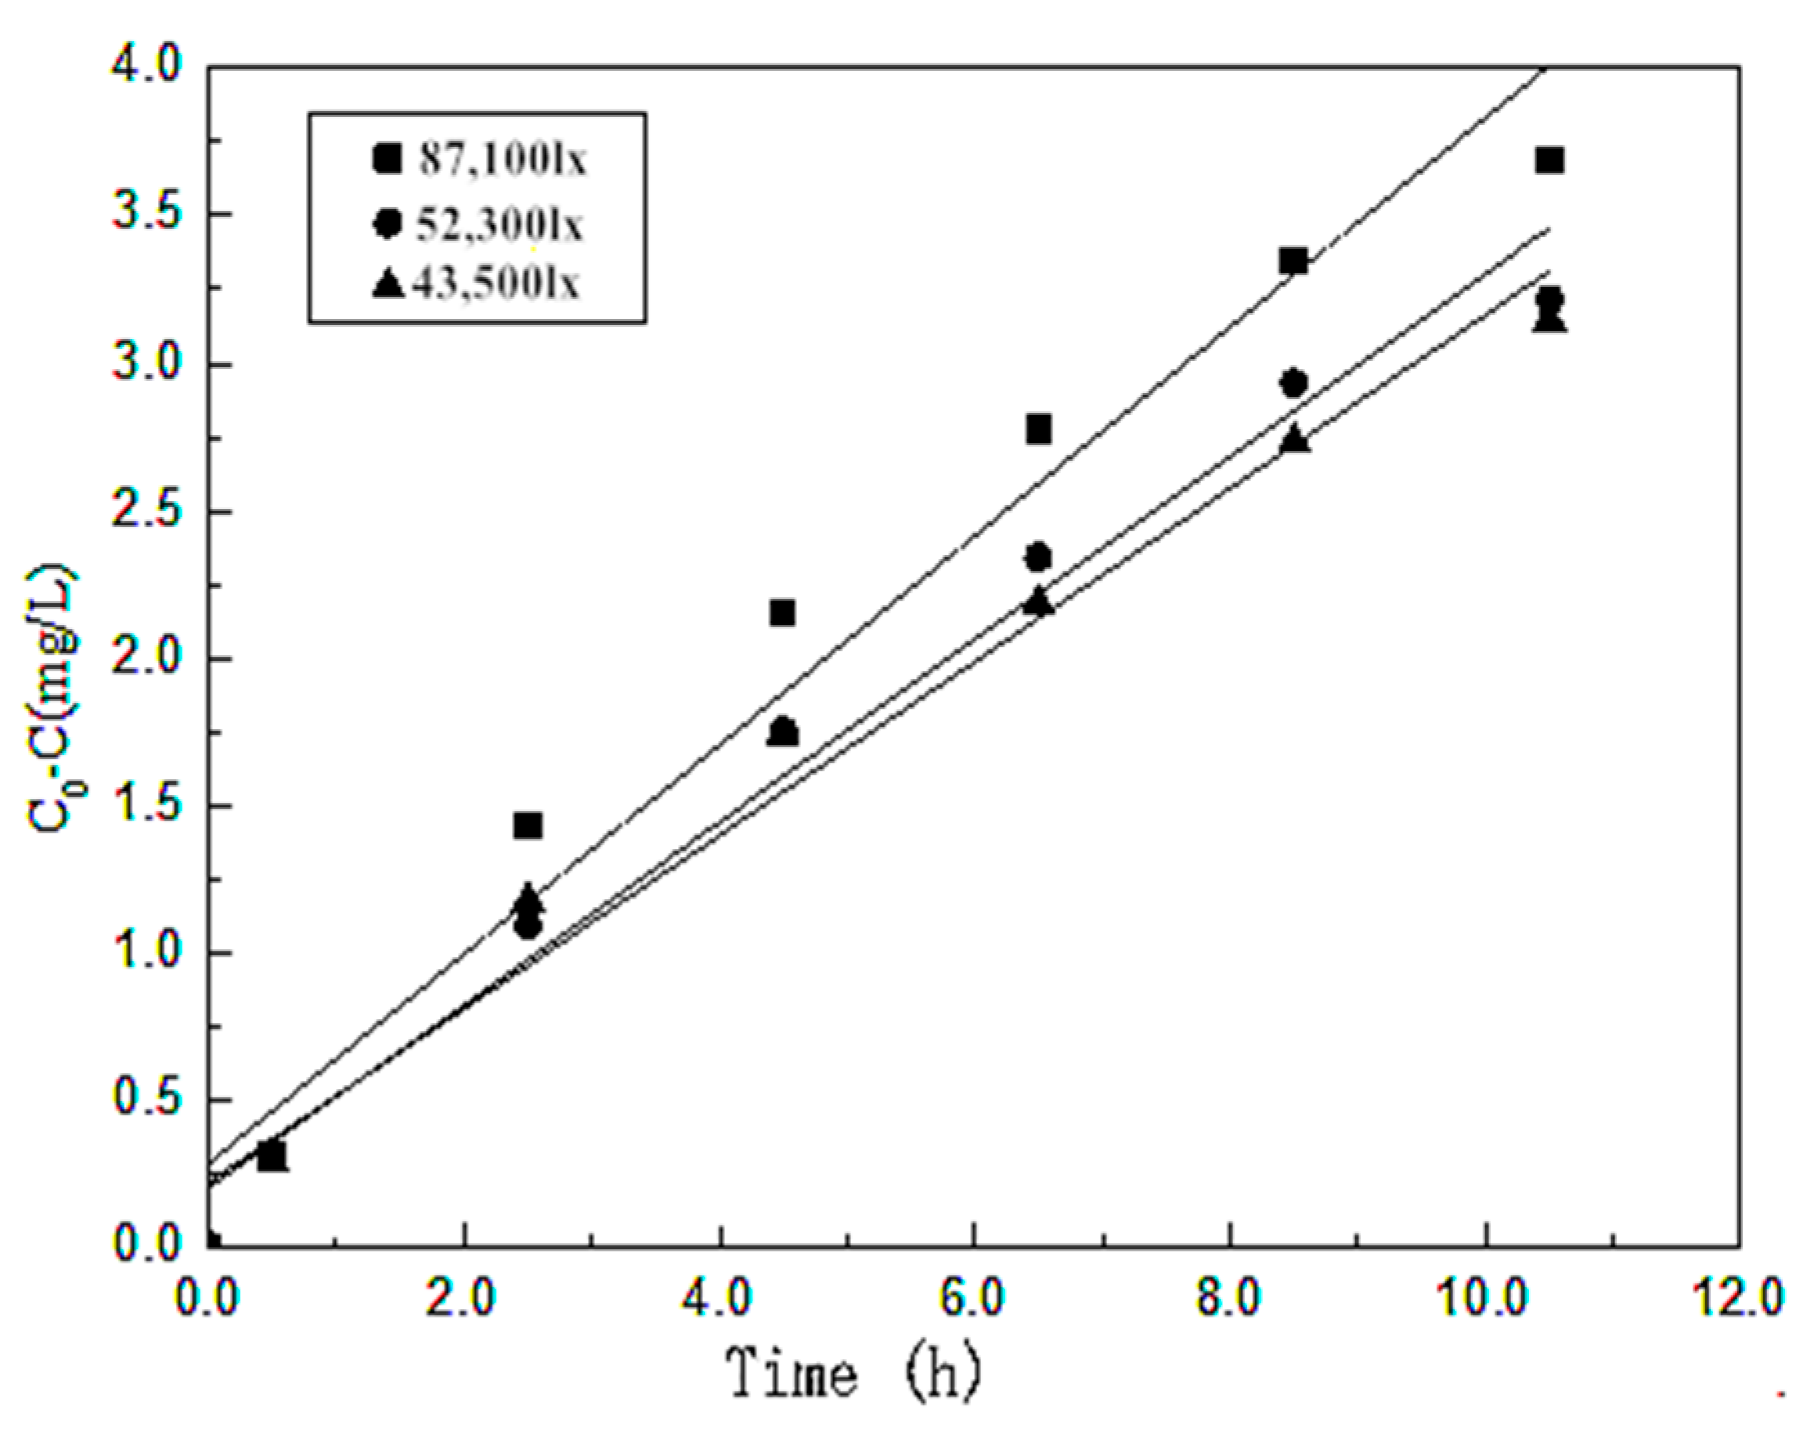
Figure 11 shows how different irradiation intensities affect the photocatalytic efficiency. When the irradiation intensity reaches 141,500 lx, each factor is at its best level, the RhB is degraded completely, and the process is not a zero order reaction. Therefore, in this paper, only the irradiation intensities of 87,100 lx, 52,300 lx, 43,500 lx were considered. With the increase of irradiation intensity, reactions between the photocatalyst and photon will increase and the rate of the photocatalysis reaction will be faster, thus leading to an increased efficiency. After fitting, an equation can be obtained as shown below.
The apparent kinetics model of RhB degradation is
4. Conclusions
To solve the problem of TiO2 having nearly no photocatalytic efficiency under visible light irradiation, a composite photocatalyst material YF3:Ho3+@TiO2 was prepared in this paper using upconversion luminescence technology. Through analyzing the morphology and composition, crystal structure, and optical spectra of YF3:Ho3+@TiO2, it was found that this material had high photocatalytic efficiency under visible light irradiation. In addition, this paper also investigated the influences of different dosages of TBOT on the properties of the photocatalyst.
In summary, YF3:Ho3+@TiO2 can be successfully prepared using a simple hydrothermal method. By analyzing the XRD images, we found that almost all the samples showed the diffraction peak of anatase TiO2 and that the crystal structure of the material did not change with TBOT dosage. TiO2 was uniformly doped on UCL, and the particle size was about 10 nm. The rice-shaped UCL material had good dispersion, of which the particle size was about 100 nm. The change of TBOT dosage would not cause the change of the material morphology, but would cause the change of the amount of TiO2 doped on UCL, resulting in an impact on the photocatalytic activity of YF3:Ho3+@TiO2. The composite material prepared in this paper shared the same upconversion luminescence property with the UCL material prepared by Jun. It confirmed that the material prepared in this paper could absorb 450 nm visible light and emit UV light, with energy transferred from YF3:Ho3+ to anatase TiO2. With the increase of the TBOT dosage, more TiO2 would be doped on the YF3:Ho3+, therefore the excitation light was obstructed, resulting in a lower energy of exciting light. The photocatalytic properties of the YF3:Ho3+@TiO2 was evaluated by the degradation of RhB and compared with those of traditional photocatalysts such as P25, TiO2, and the visible light photocatalyst BiVO4. The results showed that the prepared composite material exhibited better photocatalytic properties as compared with the other three photocatalysts. With the increase of the TBOT dosage, the photocatalytic efficiency of composite YF3:Ho3+@TiO2 first increased and then decreased. When the TBOT dosage was 6 mL, the photocatalytic efficiency reached the highest value, which was 67%. The results of this paper indicated that Ho3+-single-doped hexagonal YF3 could absorb visible light and emit UV light via UC processes. Under UV light irradiation, the composite material YF3:Ho3+@TiO2 could exhibit better photocatalytic properties than that of anatase TiO2, therefore the prepared composite material YF3:Ho3+@TiO2 has promising applications in photocatalysis.


