3.1. Materials
Cyanex 301 (bis(2,4,4-trimethylpentyl)dithiophosphinic acid extractant) and Cyanex 302 (bis(2,4,4-trimethylpentyl)monothiophosphinic acid extractant) were purchased from Cytec (Woodland Park, NJ, USA) and used as supplied without purification; the purity of the extractants is reported to be in the range 80–85%.
Figure S1 shows the chemical structure of the extractants (See
Supplementary Information). Kerosene (Fluka AG, Buchs, Switzerland) was used for diluting the extractants. Alginate was supplied by FMC Biopolymers (Philadelphia, PA, USA): the characteristics of the biopolymer have been previously determined [
61]: the fractions of guluronic and mannuronic residues were: 67/33, respectively. Other reagents (CaCl
2, PbCl
2 etc.) were analytical grade and supplied by Sigma-Aldrich (Saint-Quentin Fallavier, France).
3.2. Encapsulation Procedures
Two procedures were used for the synthesis of EIRs:
The matrix-type EIRs were obtained by the preparation of a stable emulsion associating the aqueous alginate solution and the extractant (diluted in kerosene, changing the extractant/kerosene fractions) and distributing the emulsion in a 0.5 M CaCl2 solution through a nozzle using the Encapsulator E-390 (Büchi, Switzerland).
The mononuclear-type EIRs were prepared with the encapsulator using the concentric nozzles system (the alginate solution is pumped through the shell circuit, while the extractant solution is pumped through the core circuit). The beads were ionotropically gelled in a 0.5 M CaCl2 solution.
The encapsulator uses a combination of “tools” for preventing the aggregation of the beads (electrostatic potential and vibration of the nozzles system) and for enhancing the homogeneity of bead size (size of nozzles, controlled pressure of extrusion, flow rates of emulsion, and flow rates of alginate (shell) and extractant (core) circuits, etc.). The optimization of the extrusion process requires pre-adjustment of the settings of these different tools. The values selected for the different parameters (alginate concentration, flow rates, pressure, vibration frequency, electrostatic potential, nozzle diameters, etc.) are reported in
Table S1 (See
Supplementary Information). For example, the acidity and the viscosity of Cyanex 301 and Cyanex 302 extractants are substantially different: (a) Cyanex 302 is more viscous than Cyanex 301 (19.5 vs. 7.8 kg·m
−1·s
−1, respectively); and (b) Cyanex 301 has a lower pk
a than Cyanex 302 (2.61 vs. 5.63, respectively) [
51].
The stable emulsion was prepared by mixing 130 mL of alginate solution (1.5%, w/w) with 70 mL of extractant during 10 min (using an UltraTurrax at the speed of 11,000 rpm). The proportion of each extractant was modified to prepare microcapsules with different loadings (25–75% v/v in kerosene). The microcapsules were maintained in the coagulation solution one day before being rinsed with 0.1 M HCl solution. They were stored in 0.1 M HCl, in order to prevent possible degradation of the microcapsules.
3.3. Characterization of Encapsulated Materials
Optical photographs were obtained using a Leica Wild M10 microscope (Leica, Wetzlar, Germany). The morphology and the distribution of elements in the materials were determined with a Scanning Electron Microscope coupled with Energy Dispersive X-ray analysis (SEM-EDX). SEM observations were performed using an Environmental Scanning Electron Microscope (ESEM) Quanta FEG 200 (FEI, Thermo Fisher Instruments, FEI France, Merignac, France), equipped with an OXFORD Inca 350 Energy Dispersive X-ray (EDX) microanalysis system (Oxford Instruments, Abingdon, United Kingdom). The use of environmental SEM allowed for the direct observations of materials, without previous metallization of the samples. The topography of the samples was observed using secondary electron flux while the backscattered electrons were used for the identification and localization of heavy metals at the surface of the materials (by phase contrast). SEM-EDX facilities were used for the detection of elements and their semi-quantitative analysis: for example using P element as the tracer of the extractants. The standard accelerating voltage was set at 12.5 kV. The samples were analyzed on freshly cut sections.
SEM and SEM-EDX characterization was performed on freeze-dried materials. The freeze-drying has a strong degrading impact on the structure of the beads: the extractants tend to flow out the beads that lose their structure. As a consequence SEM and SEM-EDX analyses were only performed on metal-loaded matrix-type EIR (a cross-section of mononuclear EIR is also presented).
The concentration of the extractant in the beads was determined by mineralization of the EIRs and P element analysis. A fixed amount of EIR (close to 30 mg, wet weight) was mixed with 2 mL of sulfuric acid under heating (with reflux) for 20 min. After decreasing the temperature, 1 mL of hydrogen peroxide (30% w/w) was added under heating for another 15 min. When necessary, 1 mL of hydrogen peroxide was added again, until complete discoloration of the solution (which passed from yellowish to uncolored). Finally, the volume of digested material was adjusted to 25 mL with Milli-Q water and the final solution was analyzed by ICP-AES (inductively coupled plasma atomic emission spectrometry, ICP Jobin-Yvon Horiba JY Activa-M, Longjumeau, France) for P content (P being the tracer of the extractants).
3.4. Sorption Procedures
Sorbent particles were used as wet material. A fixed amount of EIR (m, g) was mixed with a known volume (V, L) of Pb(II) solution (initial concentration C0, mg·Pb·L−1) prepared in HCl solutions (fixed concentration) under agitation (150 rpm). Relevant experimental conditions are systematically reported in the caption of the figures. After filtration (membrane filtration unit: 1 µm pore size) the samples were analyzed for residual metal concentration (Ceq, mg·Pb·L−1) by ICP-AES, and the mass balance equation was used for calculating the concentration of the metal in the sorbent (q, mg·Pb·g−1): q = (C0 − Ceq)V/m. Sorbent dosage (SD = m/V), extractant content, and metal concentration in the sorbent are reported considering the wet basis.
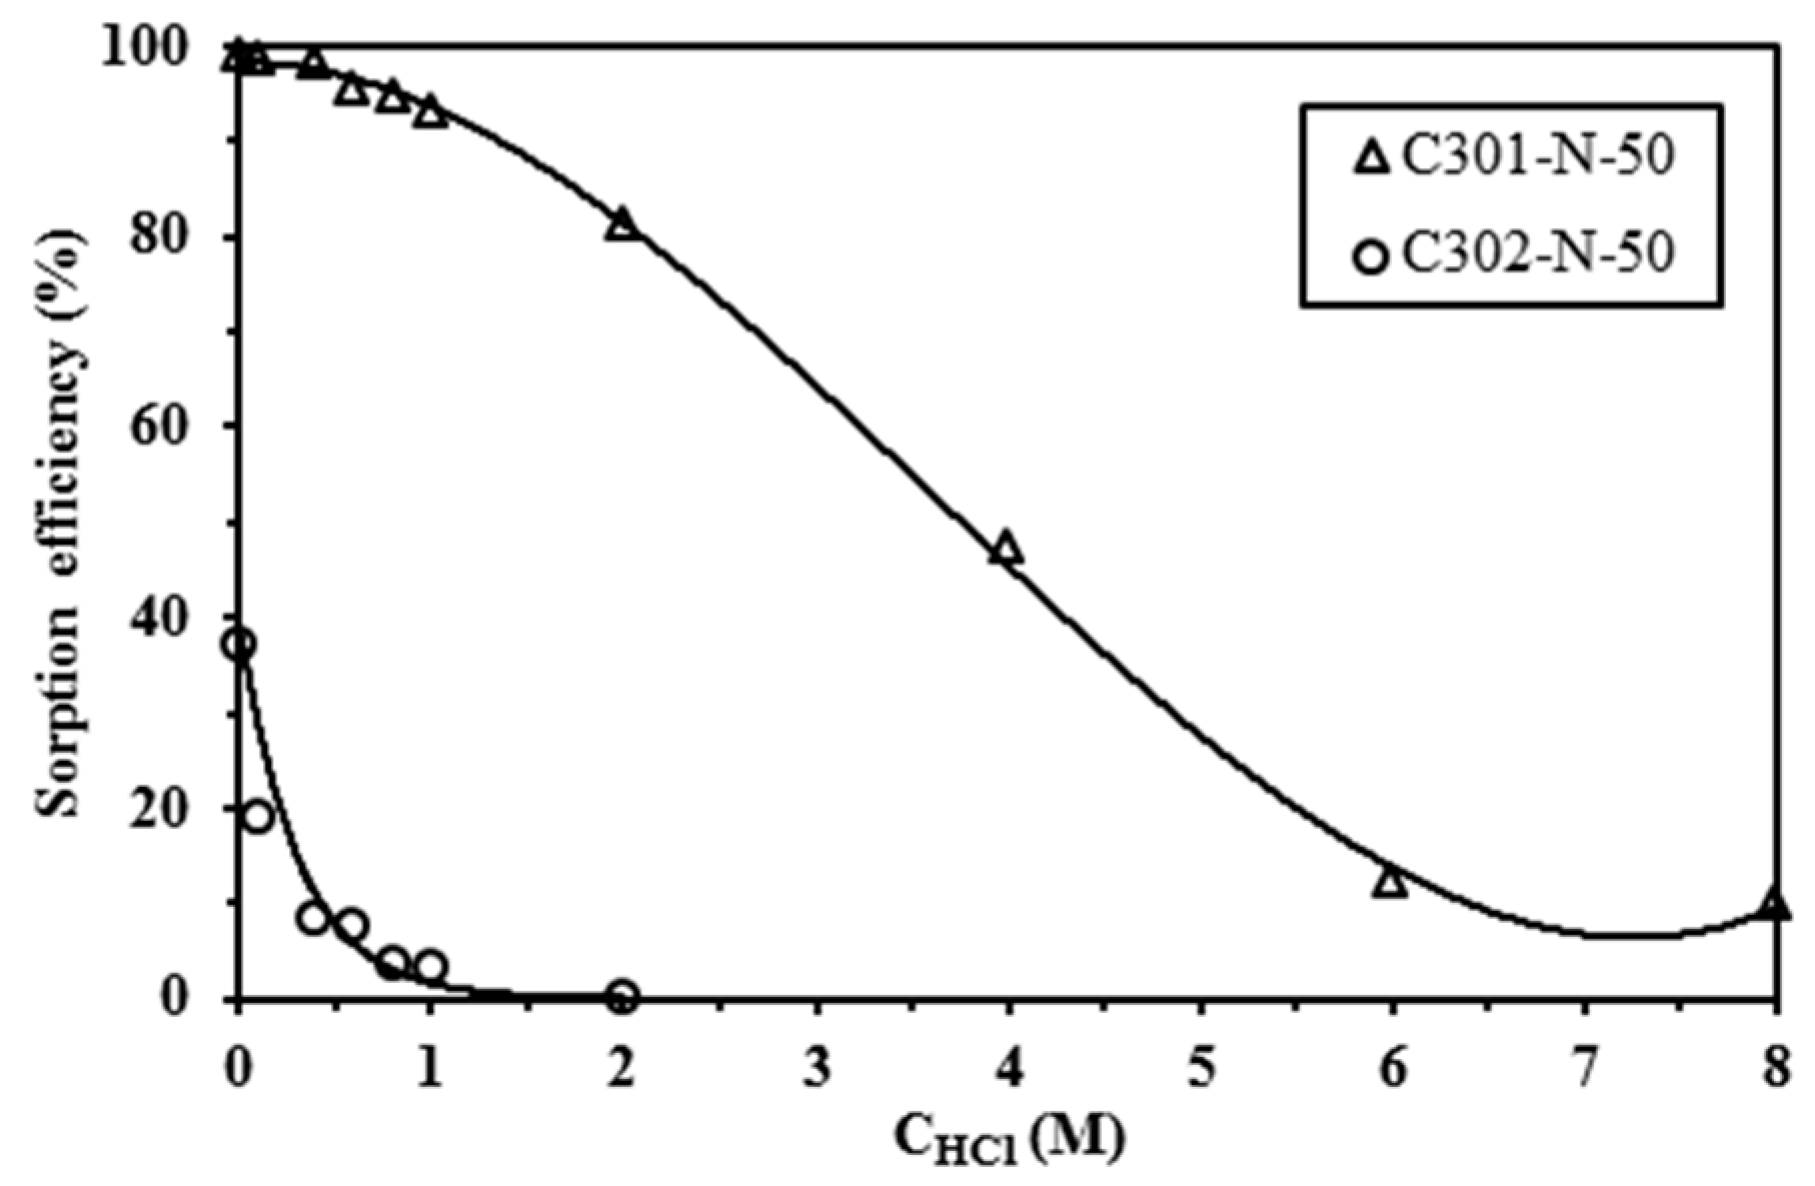
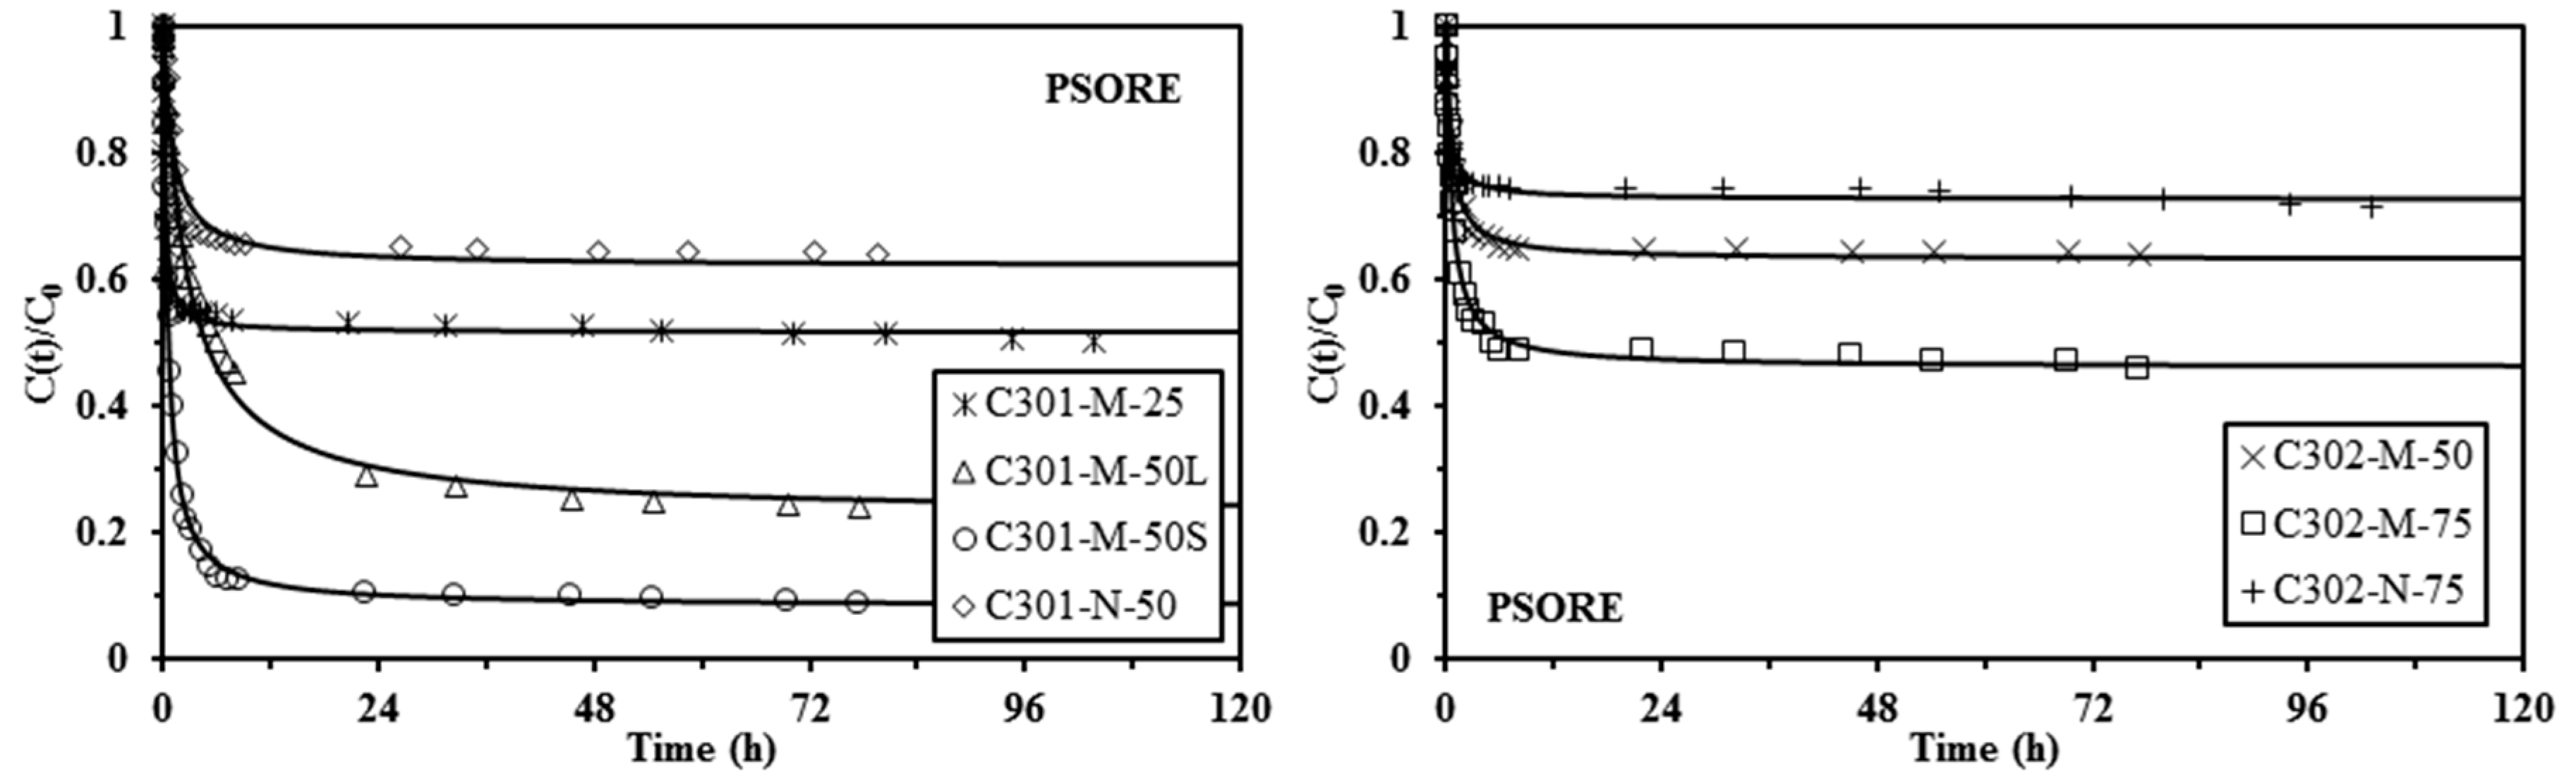
Sorption isotherms were obtained in 0.1 M HCl by contact of the sorbent with lead solutions varying the initial concentration between 0 and 300 mg·Pb·L−1 (sorbent dosage: 2 g·L−1, except for C302-N-75 with SD: 4 g·L−1), and the contact time was set to 4 days with a temperature close to 20 °C. Uptake kinetics were obtained using 170 mg·Pb·L−1 solutions (in 0.1 M HCl solutions) with a sorbent dosage of 2 g·EIR·L−1 and withdrawing samples at fixed contact times. Detailed experimental conditions are systematically reported in the caption of the figures.
Sorption processes are more adequate for the treatment of dilute solutions compared to solvent extraction and precipitation that are more appropriate for the recovery or removal of metal ions from concentrated effluents. When the solution is too concentrated the concentrating factor expected from the steps of sorption and desorption is too low to make the process competitive. The sorption process is generally meaningful for the treatment of concentrations below 200 mg·L−1. In the present study, the concentrations were selected close to 50 mg·L−1 for the study of pH effect and 170 mg·L−1 for the study of uptake kinetics, although higher concentrations were used for establishing the sorption isotherms and determining the maximum sorption capacities.
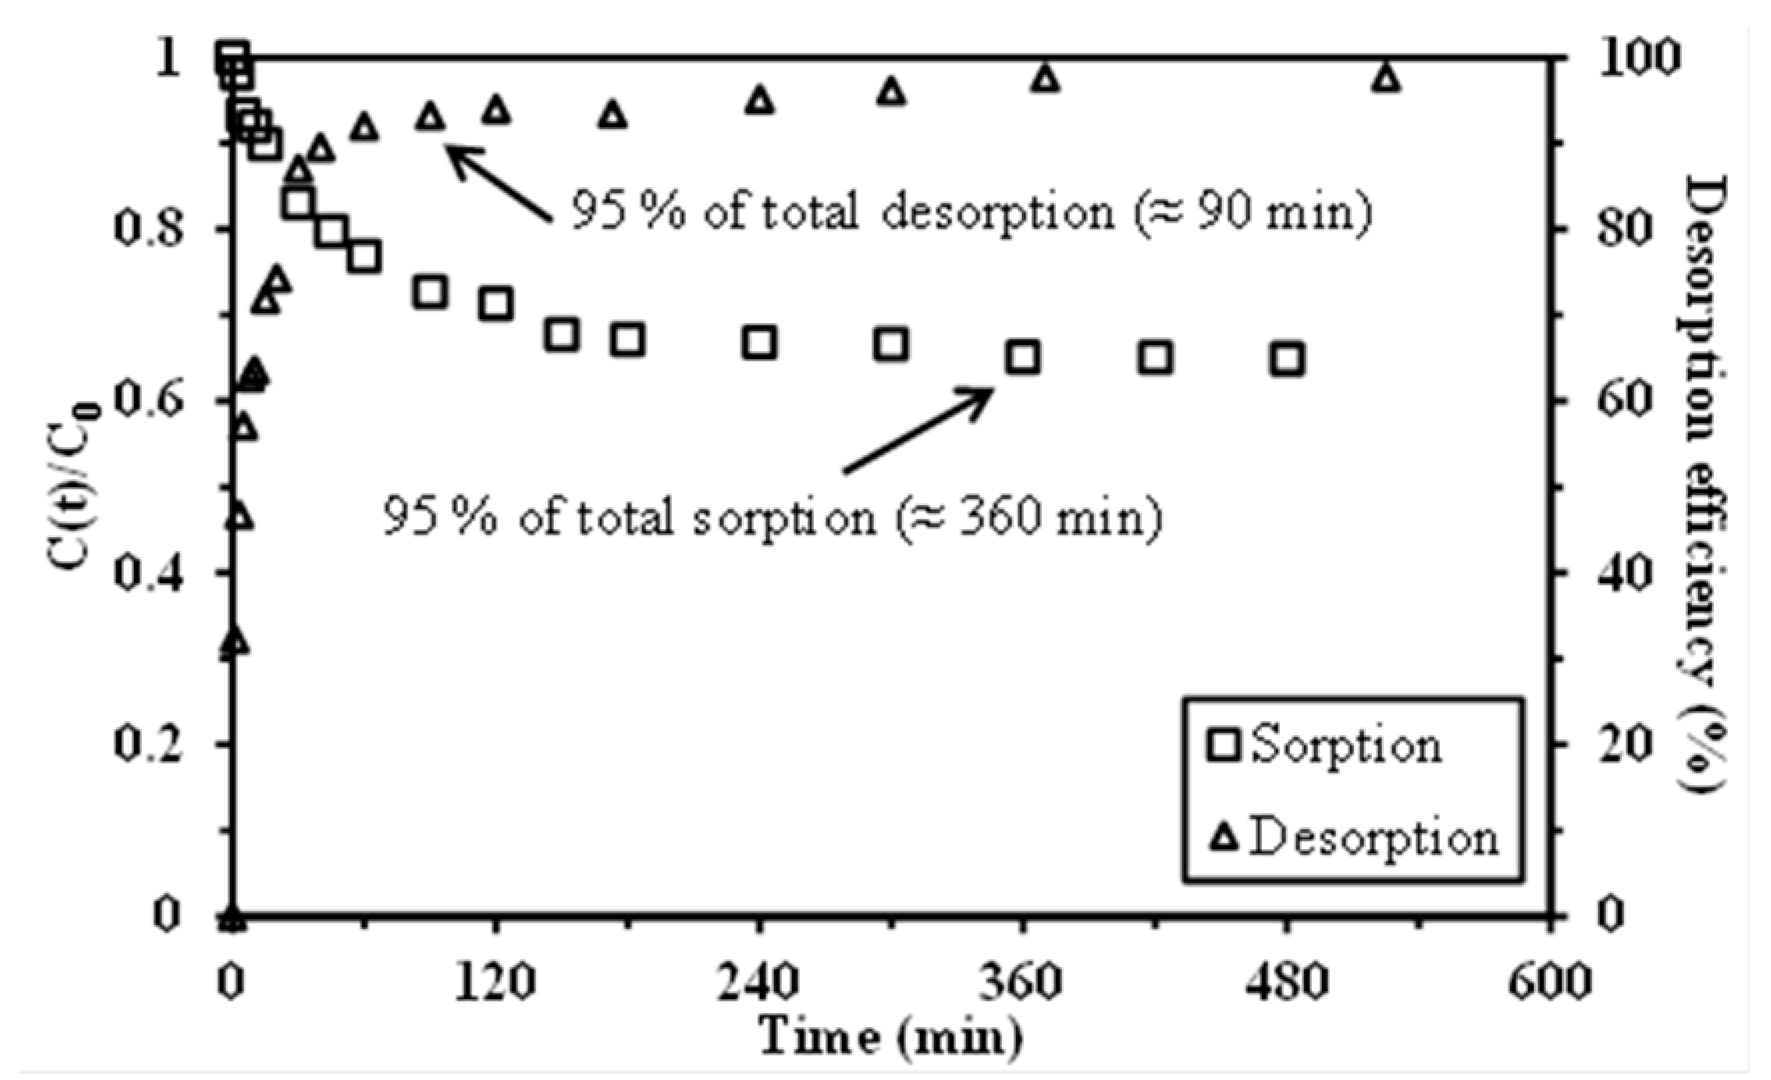
Desorption was performed by mixing an amount of 20 mg of EIR with 10 mL of Pb(II) solution (0.1 M HCl, initial metal concentration: 130 or 200 mg Pb(II) L−1) for 24 h. The residual concentration, measured by ICP-AES after resin separation, served to determine the amount of metal bound to the resin. The metal loaded resin was mixed for 24 h with 10 mL of different eluents: 0.1 M HNO3 solution, 1 M HNO3 solution, and 1 M thiourea in 1 M HCl solution. After resin separation, the metal concentration in the eluent was determined by ICP-AES, and the amount of lead desorbed was used for calculating the Pb desorption efficiency. For the study of resin recycling, a rinsing step was carried out, using a 0.01 M HCl solution, before using the resin for the next sorption step. For the evaluation of sorption/desorption cycles, the same procedure was used for three cycles. Desorption kinetics were also investigated. The sorbent was loaded with Pb(II) by contact of 1 g of sorbent with 500 mL of 200 mg Pb(II) L−1 solutions (in 0.1 M HCl solution) at room temperature under 150 rpm agitation for 24 h. After solid/liquid separation the Pb(II)-loaded capsules were maintained for 24 h, at room temperature, under agitation (at 150 rpm) with 500 mL of 1 M HNO3 solutions. Samples were collected at different contact times and the Pb(II) concentration was determined by ICP-AES for calculating the desorption efficiency: DE(%) = 100(1 − q(t)/q0).
3.5. Sorption Modeling
Sorption processes are controlled by a series of mechanisms such as the proper reaction rate and resistance to bulk diffusion, to film diffusion, and to intraparticle diffusion [
62]. In most cases, appropriately mixing the suspension makes the resistance to bulk diffusion negligible and contributes to reducing the impact of resistance to film diffusion. Previous studies on extractant impregnated resins [
30], and composite materials associating alginate and extractants [
63], or ionic liquids [
64] have confirmed the predominating impact of resistance to intraparticle diffusion on the control of uptake kinetics. A more complete discussion of the mechanisms that control uptake kinetics is presented in the
Supplementary Information with the integration of a homogeneous diffusion model and shrinking core model with resistance to film diffusion, resistance to intraparticle diffusion, and with control by the chemical reaction rate [
55,
65,
66].
The intraparticle diffusion coefficient (
De, effective diffusivity, m
2·min
−1) was determined using the Crank equation (Equation (2)), assuming the solid to be initially free of metal, and the kinetics to be controlled by resistance to intraparticle diffusion [
67]:
q(t) and
qeq are the concentrations of the metal in the resin at time t and equilibrium, respectively,
r is the radius of the particle, and
qn non-zero roots of the equation:
with
The Mathematica™ software (version.4, Wolfram, Wolfram France, Paris, France) was used for the determination of the intraparticle diffusion coefficient, De, and for the simulation of the experimental data (represented by the continuous line on the figures).
In addition, the pseudo-first order rate equation (PFORE; i.e., the Lagergren equation) and the pseudo-second order rate equation (PSORE) have been tested for the modeling of the experimental uptake kinetics [
68]. These models have been initially designed for the modeling of reaction kinetics in homogeneous systems. However, these models are also frequently used for describing kinetic profiles in solid/liquid separation. As a consequence, the kinetic parameters should be considered as an apparent rate constant: indeed, the contribution of diffusion mechanisms is fully integrated in the apparent rate constants.
PFORE:
after integration (with appropriate boundary condition:
q(0) = 0)
or
k1 (min
−1) is the apparent rate constant for the PFORE.
PSORE:
after integration (with appropriate boundary condition: q(0) = 0)
k2 (g·mg
−1·min
−1) is the apparent rate constant for the PSORE.
In order to avoid possible statistical bias (which may occur when using linear regression with linearized equations) the parameters of the models (i.e., qeq,calc and k1 for PFORE, qeq,calc and k2 for PSORE) were obtained by non-linear regression using the Mathematica® software package.
Equilibrium distribution of the solute between liquid and solid phases is usually described by the sorption isotherm (plot of
qeq vs.
Ceq). Many equations have been developed for modeling sorption isotherms: the most commons are the Langmuir and the Freundlich equations [
62]. While the Langmuir equation is a mechanistic equation, the Freundlich equation is an empirical power-type function. The Langmuir equation assumes the sorption to occur as a monolayer at the surface of the sorbent through homogeneous interactions with the solute (homogeneous energy of sorption between reactive groups and solute molecule), and without interactions between sorbed molecules. Based on the shape of the sorption isotherms (see below), which are characterized by an asymptotic saturation trend, the equilibrium will be preferentially described by the Langmuir equation (Equation (5)):
where
qm (mg·Pb·g
−1) is the sorption capacity at saturation of the monolayer (to be compared with the experimental maximum sorption capacity) and
b (L·mg
−1) is the affinity coefficient (i.e., ratio between the sorption and desorption rate coefficients).


