Electron Beam Welding of IN792 DS: Effects of Pass Speed and PWHT on Microstructure and Hardness


 , ,
, ,  ,
, 

Abstract
:1. Introduction
2. Material and Methods
3. Results and Discussion
3.1. The Base Metal
3.2. EB Welding Without Pre-Heating
3.3. EB Welding with Pre-Heating
3.4. Effect of Post Welding Heat Treatments
4. Conclusions
Author Contributions
Conflicts of Interest
References
- Betteridge, W.; Heslop, J. The Nimonic Alloys, and Other Nickel-Base High-TempratureAlloys; Hodder Arnold: New York, NY, USA, 1974. [Google Scholar]
- Tresa Pollock, M.; Sammy, T. Nickel-Based Superalloys for Advanced Turbine Engines: Chemistry, Microstructure, and Properties. J. Propuls. Power 2006, 22, 361–374. [Google Scholar] [CrossRef]
- Sims, C.T.; Stoloff, N.S.; Hagel, W.C. Superalloys II: High-Temperature Materials for Aerospace and Industrial Power; Wiley: New York, NY, USA, 1986. [Google Scholar]
- Reed, R.C. The Superalloys: Fundamentals and Applications; Cambridge University Press: Cambridge, UK, 2006. [Google Scholar]
- Locq, D.; Walder, A.; Marty, M.; Caron, P. Development of New PM Superalloys for High Temperature Applications; Proceeding of EUROMAT, Intermetallics and Superalloys; WILEY-VCH Verlag Gmbh: Weinheim, Germany, 2000; Volume 10. [Google Scholar]
- Monjati, H.; Jahazi, M.; Bahrami, R.; Yue, S. The influence of heat treatment conditions on γ’ characteristics i Udimet® 720. Mater. Sci. Eng. A 2004, 373, 286–293. [Google Scholar] [CrossRef]
- Ges, A.M.; Fornaro, O.; Palacio, H.A. Coarsening behaviour of a Ni-base superalloy under different heat treatment conditions. Mater. Sci. Eng. A 2007, 458, 96–100. [Google Scholar] [CrossRef]
- Deodati, P.; Montanari, R.; Tassa, O.; Ucciardello, N. Single crystal PWA 1483 superalloy: Dislocation rearrangement and damping phenomena. Mater. Sci. Eng. A 2009, 521–522, 102–105. [Google Scholar] [CrossRef]
- David, S.A.; Vitek, J.M.; Babu, S.S.; Boatner, L.A.; Reed, R.W. Welding of nickel base superalloy single crystals. Sci. Technol. Weld. Join. 1997, 2, 79–88. [Google Scholar] [CrossRef]
- Ojo, O.A.; Richards, N.L.; Chaturvedi, M.C. Microstructural study of weld fusion zone of TIG welded IN 738LC nickel-based superalloy. Scr. Mater. 2004, 51, 683–688. [Google Scholar] [CrossRef]
- Henderson, M.B.; Arrell, D.; Heobel, M.; Larsson, R.; Marchanty, G. Nickel-based superalloy welding practices for industrial gas turbine applications. Sci. Technol. Weld. Join. 2013, 9, 13–21. [Google Scholar] [CrossRef]
- Jensen, M.V.R.S.; Dye, D.; James, K.E.; Korsunsky, A.M.; Roberts, S.M.; Reed, R.C. Residual stresses in a welded superalloy disc: Characterization using synchrotron diffraction and numerical process modeling. Metall. Mater. Trans. A 2002, 33, 2921–2931. [Google Scholar] [CrossRef]
- Duvall, D.S.; Owezarski, W.A.; Paulonis, D.F. Transient liquid phase bonding: A new method for joining heat resistant alloys. Weld. J. 1974, 53, 203–214. [Google Scholar]
- Hoppin, G.S.; Berry, T.F. Activated diffusion bonding. Weld. J. 1970, 11, 505–509. [Google Scholar]
- Lescourgues, J. The application of RBD process to the deposition of anti-wear alloys. In Proceedings of the AGARD Specialist Meeting, Oberammergau, Germany, 9–13 September 1985. [Google Scholar]
- Zapirain, F.; Zubiri, F.; Garciandía, F.; Tolosa, I.; Chueca, S.; Goiria, A. Development of laser welding of Ni based superalloys for aeronautic engine applications (experimental process and obtained properties). Phys. Procedia 2011, 12, 105–112. [Google Scholar] [CrossRef]
- Chen, G.Q.; Zhang, B.; Lu, T.; Feng, J.C. Causes and control of welding cracks in electron-beam-welded superalloy GH4169 joints. Trans. Nonferrous Met. Soc. China 2013, 23, 1971–1976. [Google Scholar] [CrossRef]
- Rush, M.T.; Colegrove, P.A.; Zhang, Z.; Courtot, B. An investigation into cracking in nickel-base superalloy repair welds. Adv. Mater. Res. 2010, 89–91, 467–472. [Google Scholar] [CrossRef]
- Liu, X.B.; Yu, G.; Guob, J.; Gu, Y.J.; Pang, M.; Zheng, C.Y.; Wang, H.H. Research on laser welding of cast Ni-based superalloy K418 turbo disk and alloy steel 42CrMo shaft. J. Alloys Compd. 2008, 453, 371–378. [Google Scholar] [CrossRef]
- Wang, H.S.; Huang, C.Y.; Ho, K.S.; Deng, S. Microstructure Evolution of Laser Repair Welded René 77 Nickel-Based Superalloy Cast. J. Mater. Trans. 2011, 52–12, 2197–2204. [Google Scholar] [CrossRef]
- Tillack, D.J. Welding superalloys for aerospace applications. Weld. J. 2007, 86, 28–32. [Google Scholar]
- Attar, H.; Bönisch, M.; Calin, M.; Zhang, L.C.; Scudino, S.; Eckert, J. Selective laser melting of in situ titanium–titanium boride composites: Processing, microstructure and mechanical properties. Acta Mater. 2014, 76, 13–22. [Google Scholar] [CrossRef]
- Attar, H.; Calin, M.; Zhang, L.C.; Scudino, S.; Eckert, J. Manufacture by selective laser melting and mechanical behavior of commercially pure titanium. Mater. Sci. Eng. A 2014, 593, 170–177. [Google Scholar] [CrossRef]
- Attar, H.; Ehtemam-Haghighi, S.; Kent, D.; Okulov, I.V.; Wendrock, H.; Bönisch, M.; Volegov, A.S.; Calin, M.; Eckert, J.; Dargusch, M.S. Nanoindentation and wear properties of Ti and Ti-TiB composite materials produced by selective laser melting. Mater. Sci. Eng. A 2017, 688, 20–26. [Google Scholar] [CrossRef]
- Zhang, J.; Singer, R.F. Hot tearing of nickel-based superalloys during directional solidification. Acta Mater. 2002, 50, 1869–1879. [Google Scholar] [CrossRef]
- Zhang, J. Effect of Ti and Ta on hot cracking susceptibility of directionally solidified Ni-based superalloy IN792. Scr. Mater. 2003, 48, 677–681. [Google Scholar] [CrossRef]
- Vincent, R. Precipitation around welds in the nickel-base superalloy INCONEL 718. Acta Metall. 1985, 33, 1205–1216. [Google Scholar] [CrossRef]
- Huang, C.A.; Wang, T.H.; Lee, C.H.; Han, W. A study of the heat-affected zone (HAZ) of an Inconel 718 sheet welded with electron-beam welding (EBW). Mater. Sci. Eng. 2005, 398, 275–281. [Google Scholar] [CrossRef]
- Ferro, P.; Zambon, A.; Bonollo, F. Investigation of electron-beam welding in wrought Inconel 706, experimental and numerical analysis. Mater. Sci. Eng. A 2005, 392, 94–105. [Google Scholar] [CrossRef]
- Montanari, R.; Varone, A.; Barbieri, G.; Soltani, P.; Kaciulis, S. Welding of IN792DS superalloy by electron beam. Surf. Interface Anal. 2016, 48, 483–487. [Google Scholar] [CrossRef]
- Cullity, B.D. Elements of X-ray Diffraction; Addison-Wesley Publishing Company, Inc.: Boston, MA, USA, 1978. [Google Scholar]
- Yang, J.; Zheng, Q.; Zhang, H.; Sun, X.; Guan, H.; Hu, Z. Effects of heat treatments on the microstructure of IN792 alloy. Mater. Sci. Eng. A 2010, 527, 1016–1021. [Google Scholar] [CrossRef]
- Ehtemam Haghighi, S.; Janghorban, K.; Izadi, S. Structural evolution of Fe-50% Al powders during mechanical alloying and subsequent annealing process. J. Alloys Compd. 2010, 495, 260–264. [Google Scholar] [CrossRef]
- Behrouzghaemi, S.; Mitchell, R. Morphological changes of γ’ precipitates in superalloy IN738LC at various cooling rates. Mater. Sci. Eng. A 2008, 498, 266–271. [Google Scholar] [CrossRef]
- Baldan, A. Review Progress in Ostwald ripening theories and their applications to nickel-base superalloys. Part I: Ostwald ripening theories. J. Mater. Sci. 2002, 37, 2171–2202. [Google Scholar] [CrossRef]
- Baldan, A. Review Progress in Ostwald ripening theories and their applications to the γ’ precipitates in nickel-base superalloys. Part II: Nickel-base superalloys. J. Mater. Sci. 2002, 37, 2379–2405. [Google Scholar] [CrossRef]
- Zhang, W.; Liu, L.; Fu, H. Effect of cooling rate on MC carbide in directionally solidified nickel-based superalloy under high thermal gradient. China Foundry 2012, 9, 11–14. [Google Scholar]
- Seo, S.M.; Kim, I.S.; Lee, J.H.; Jo, C.Y.; Miyahara, H.; Ogi, K. Microstructural evolution in directionally solidified Ni-base superalloy IN792 + Hf. J. Mater. Sci. Technol. 2008, 24, 110–114. [Google Scholar]
- Sun, W.R.; Hu, Z.Q.; Lee, J.H.; Cheo, S.M.; Choe, S.J. Influence of solidification rate on precipitation and microstructure of directional solidification IN792 + Hf superalloy. J. Mater. Res. 1999, 14, 3873–3881. [Google Scholar] [CrossRef]
- Kozar, R.W.; Suzuki, A.; Milligan, W.W.; Schirra, J.J.; Savage, M.F.; Pollock, T.M. Strengthening mechanisms in polycrystalline multimodal nickel-base superalloys. Metall. Mater. Trans. A 2009, 40, 1588–1603. [Google Scholar] [CrossRef]
- Strunz, P.; Petrenec, M.; Gasser, U. Precipitate microstructure evolution in low-cycle fatigued Inconel superalloys. In Proceedings of the 15th International Small-Angle Scattering Conference, Sydney, Australia, 18–23 November 2012. [Google Scholar]
- Strunz, P.; Petrenec, M.; Polák, J.; Gasser, U.; Farkas, G. Formation and dissolution of γ’ precipitates in IN792 superalloy at elevated temperatures. Metals 2016, 6, 37. [Google Scholar] [CrossRef]


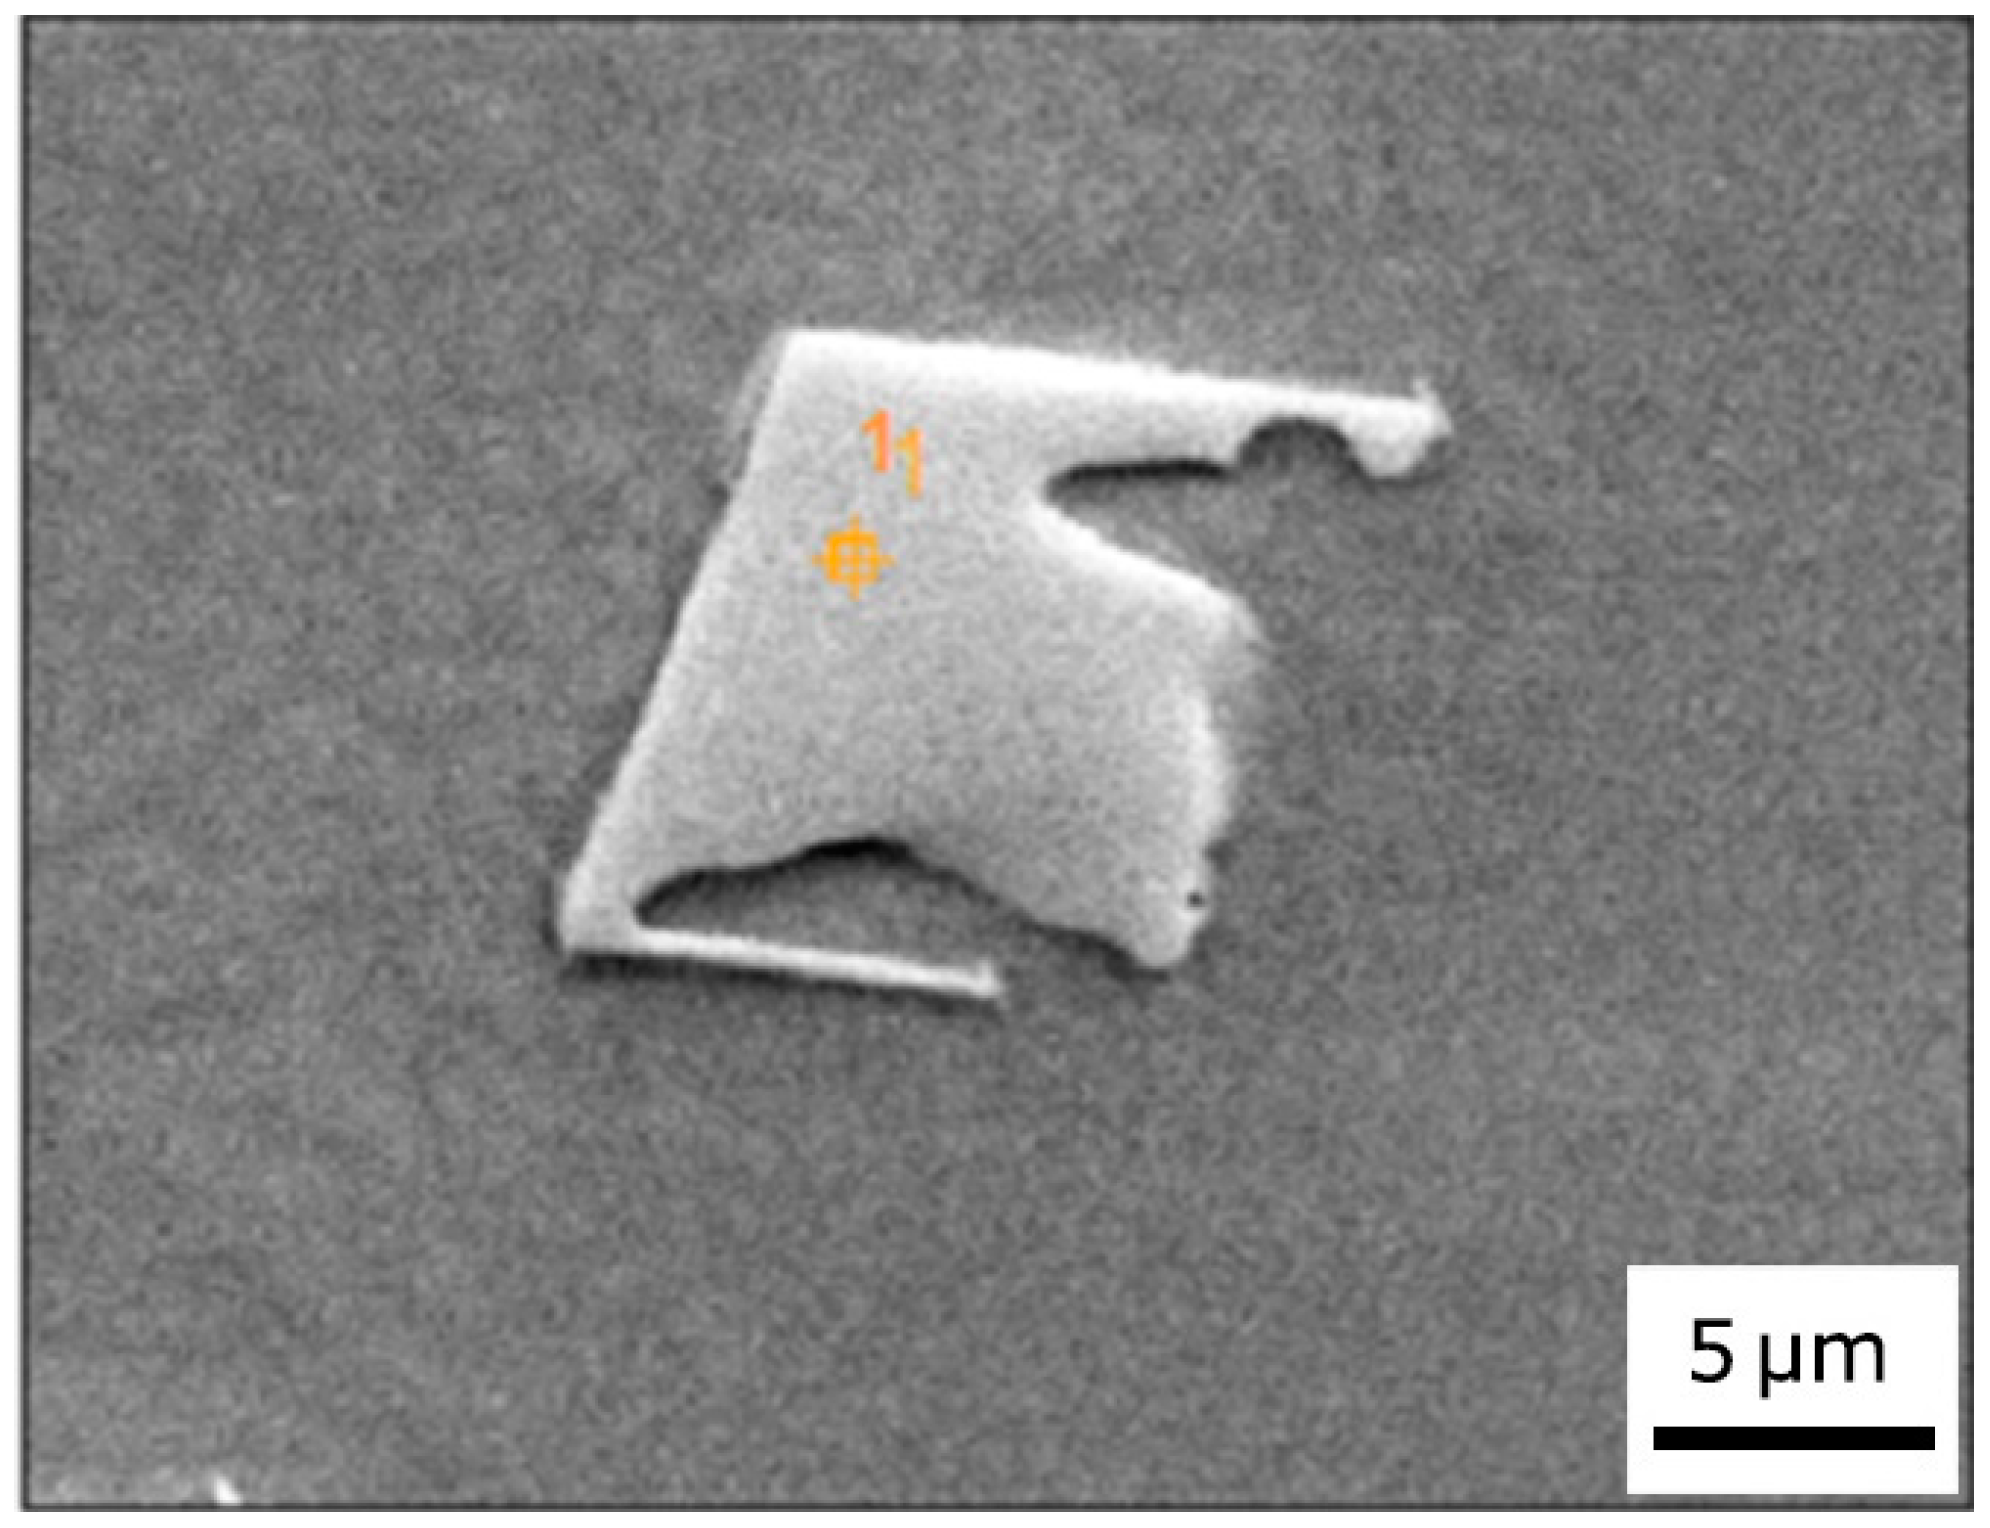
| Elements | Al | Ti | Cr | Co | Ni | Mo | Ta | W |
|---|---|---|---|---|---|---|---|---|
| Composition (at %) | 2.27 (±0.36) | 46.74 (±0.65) | 1.56 (±0.22) | 0.83 (±0.09) | 5.14 (±0.57) | 2.69 (±0.19) | 38.66 (±0.52) | 2.12 (±0.37) |


| C | Al | Ti | Cr | Co | Mo | W | Ta | Ni |
|---|---|---|---|---|---|---|---|---|
| 0.39 | 8.88 | 4.46 | 14.07 | 9.13 | 1.16 | 1.56 | 1.46 | To balance |
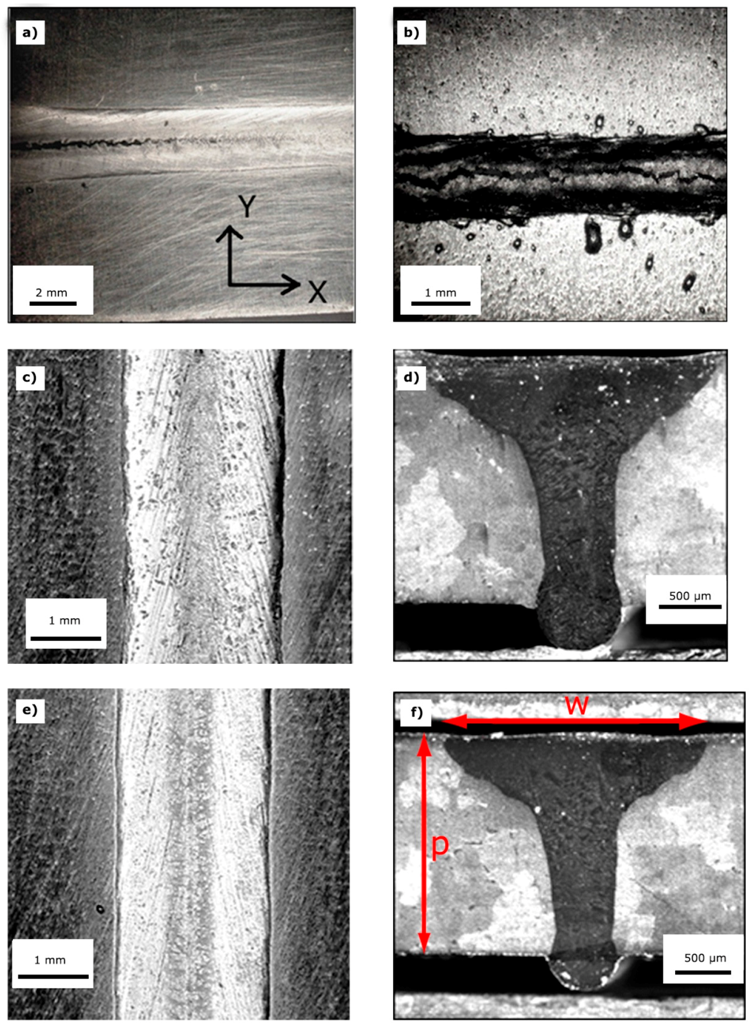
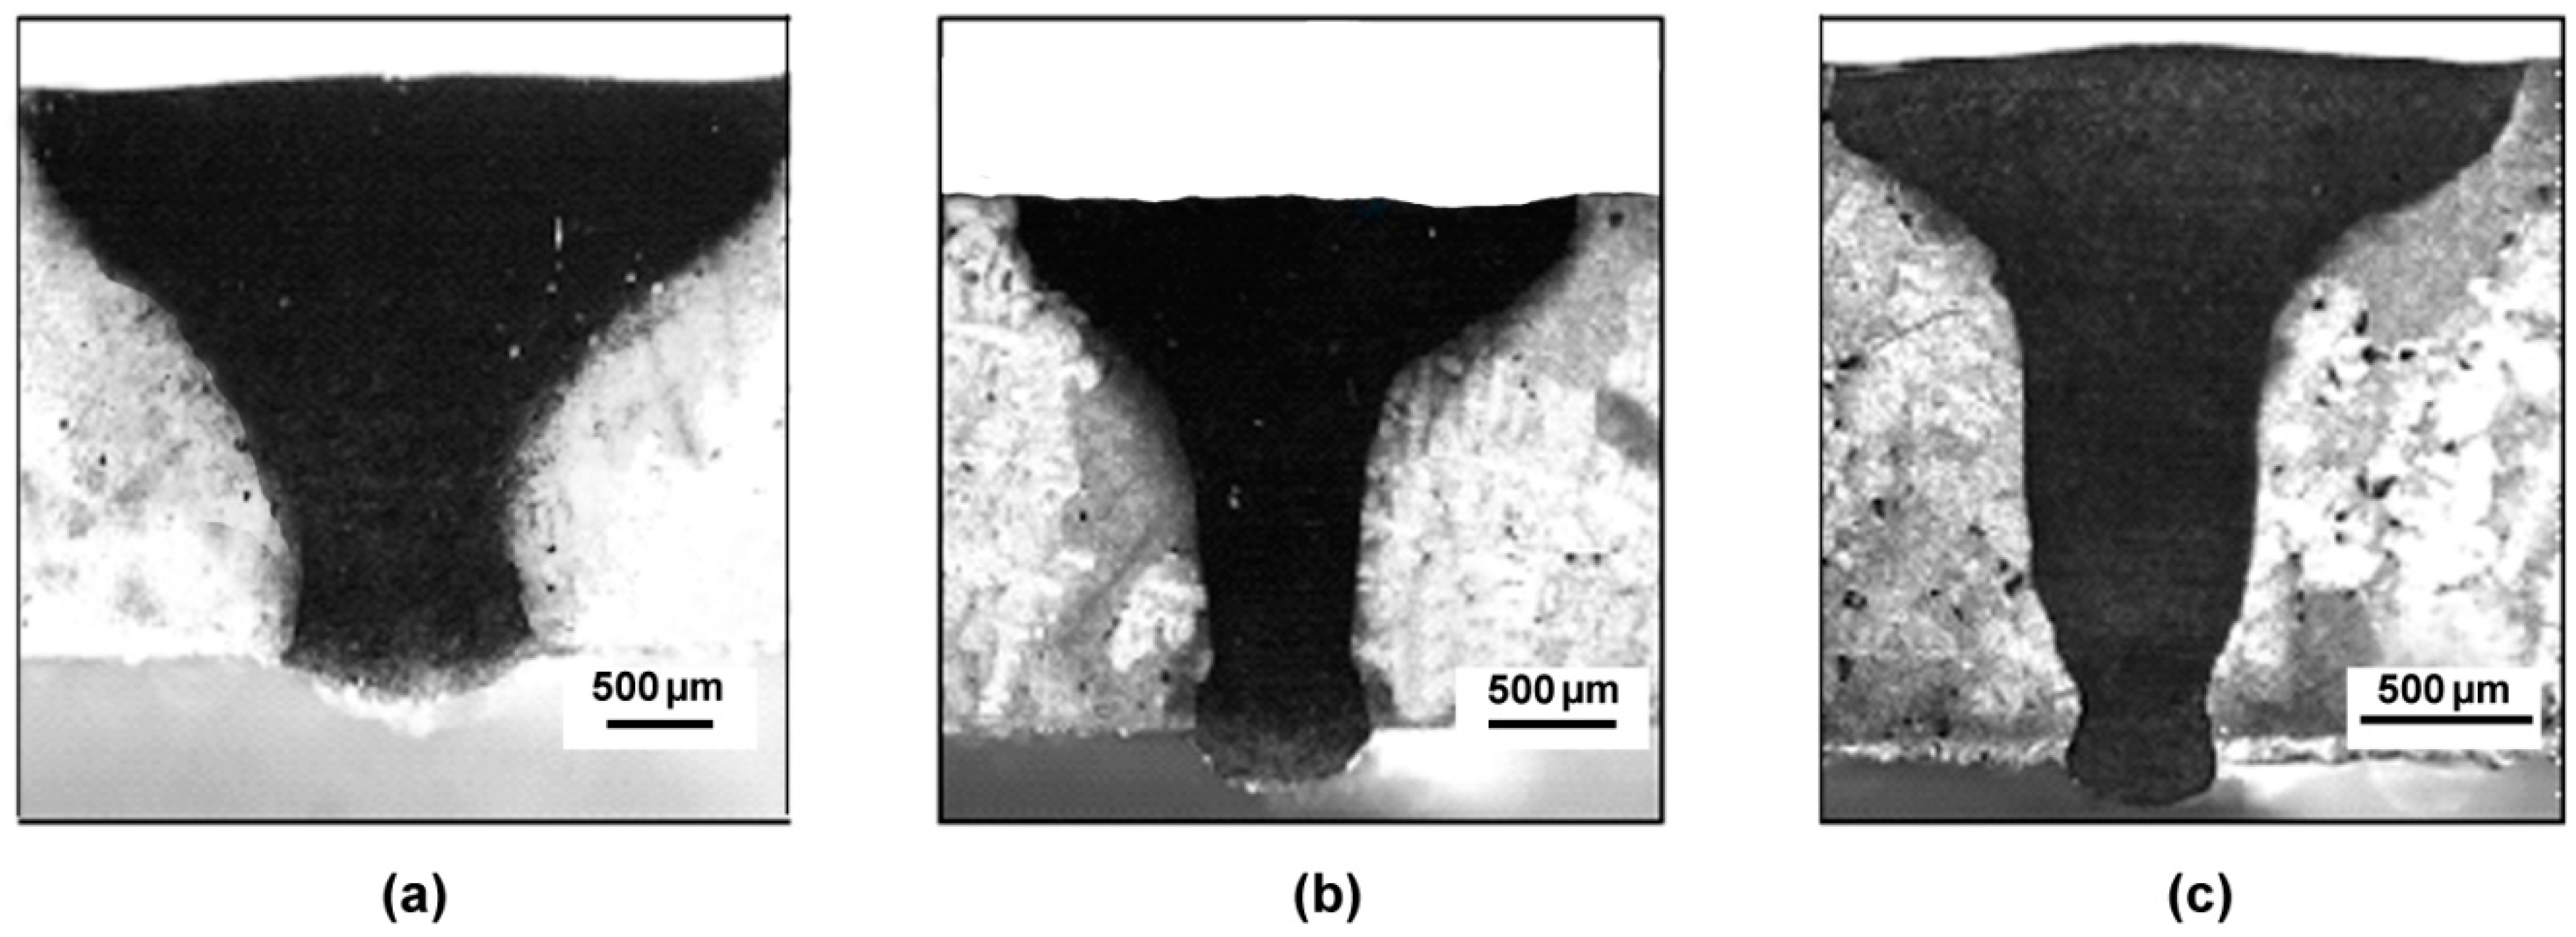
| PHT (°C) | Pass Speed (m/min) | Maximum Width w (mm) | Aspect Ratio p/w |
|---|---|---|---|
| 200 | 1.0 | 3.0 | 0.50 |
| 200 | 1.5 | 2.4 | 0.79 |
| 200 | 2.0 | 2.4 | 1.00 |
| 300 | 1.5 | 3.5 | 0.54 |
| 300 | 2.0 | 2.3 | 0.86 |
| 300 | 2.5 | 2.0 | 1.02 |
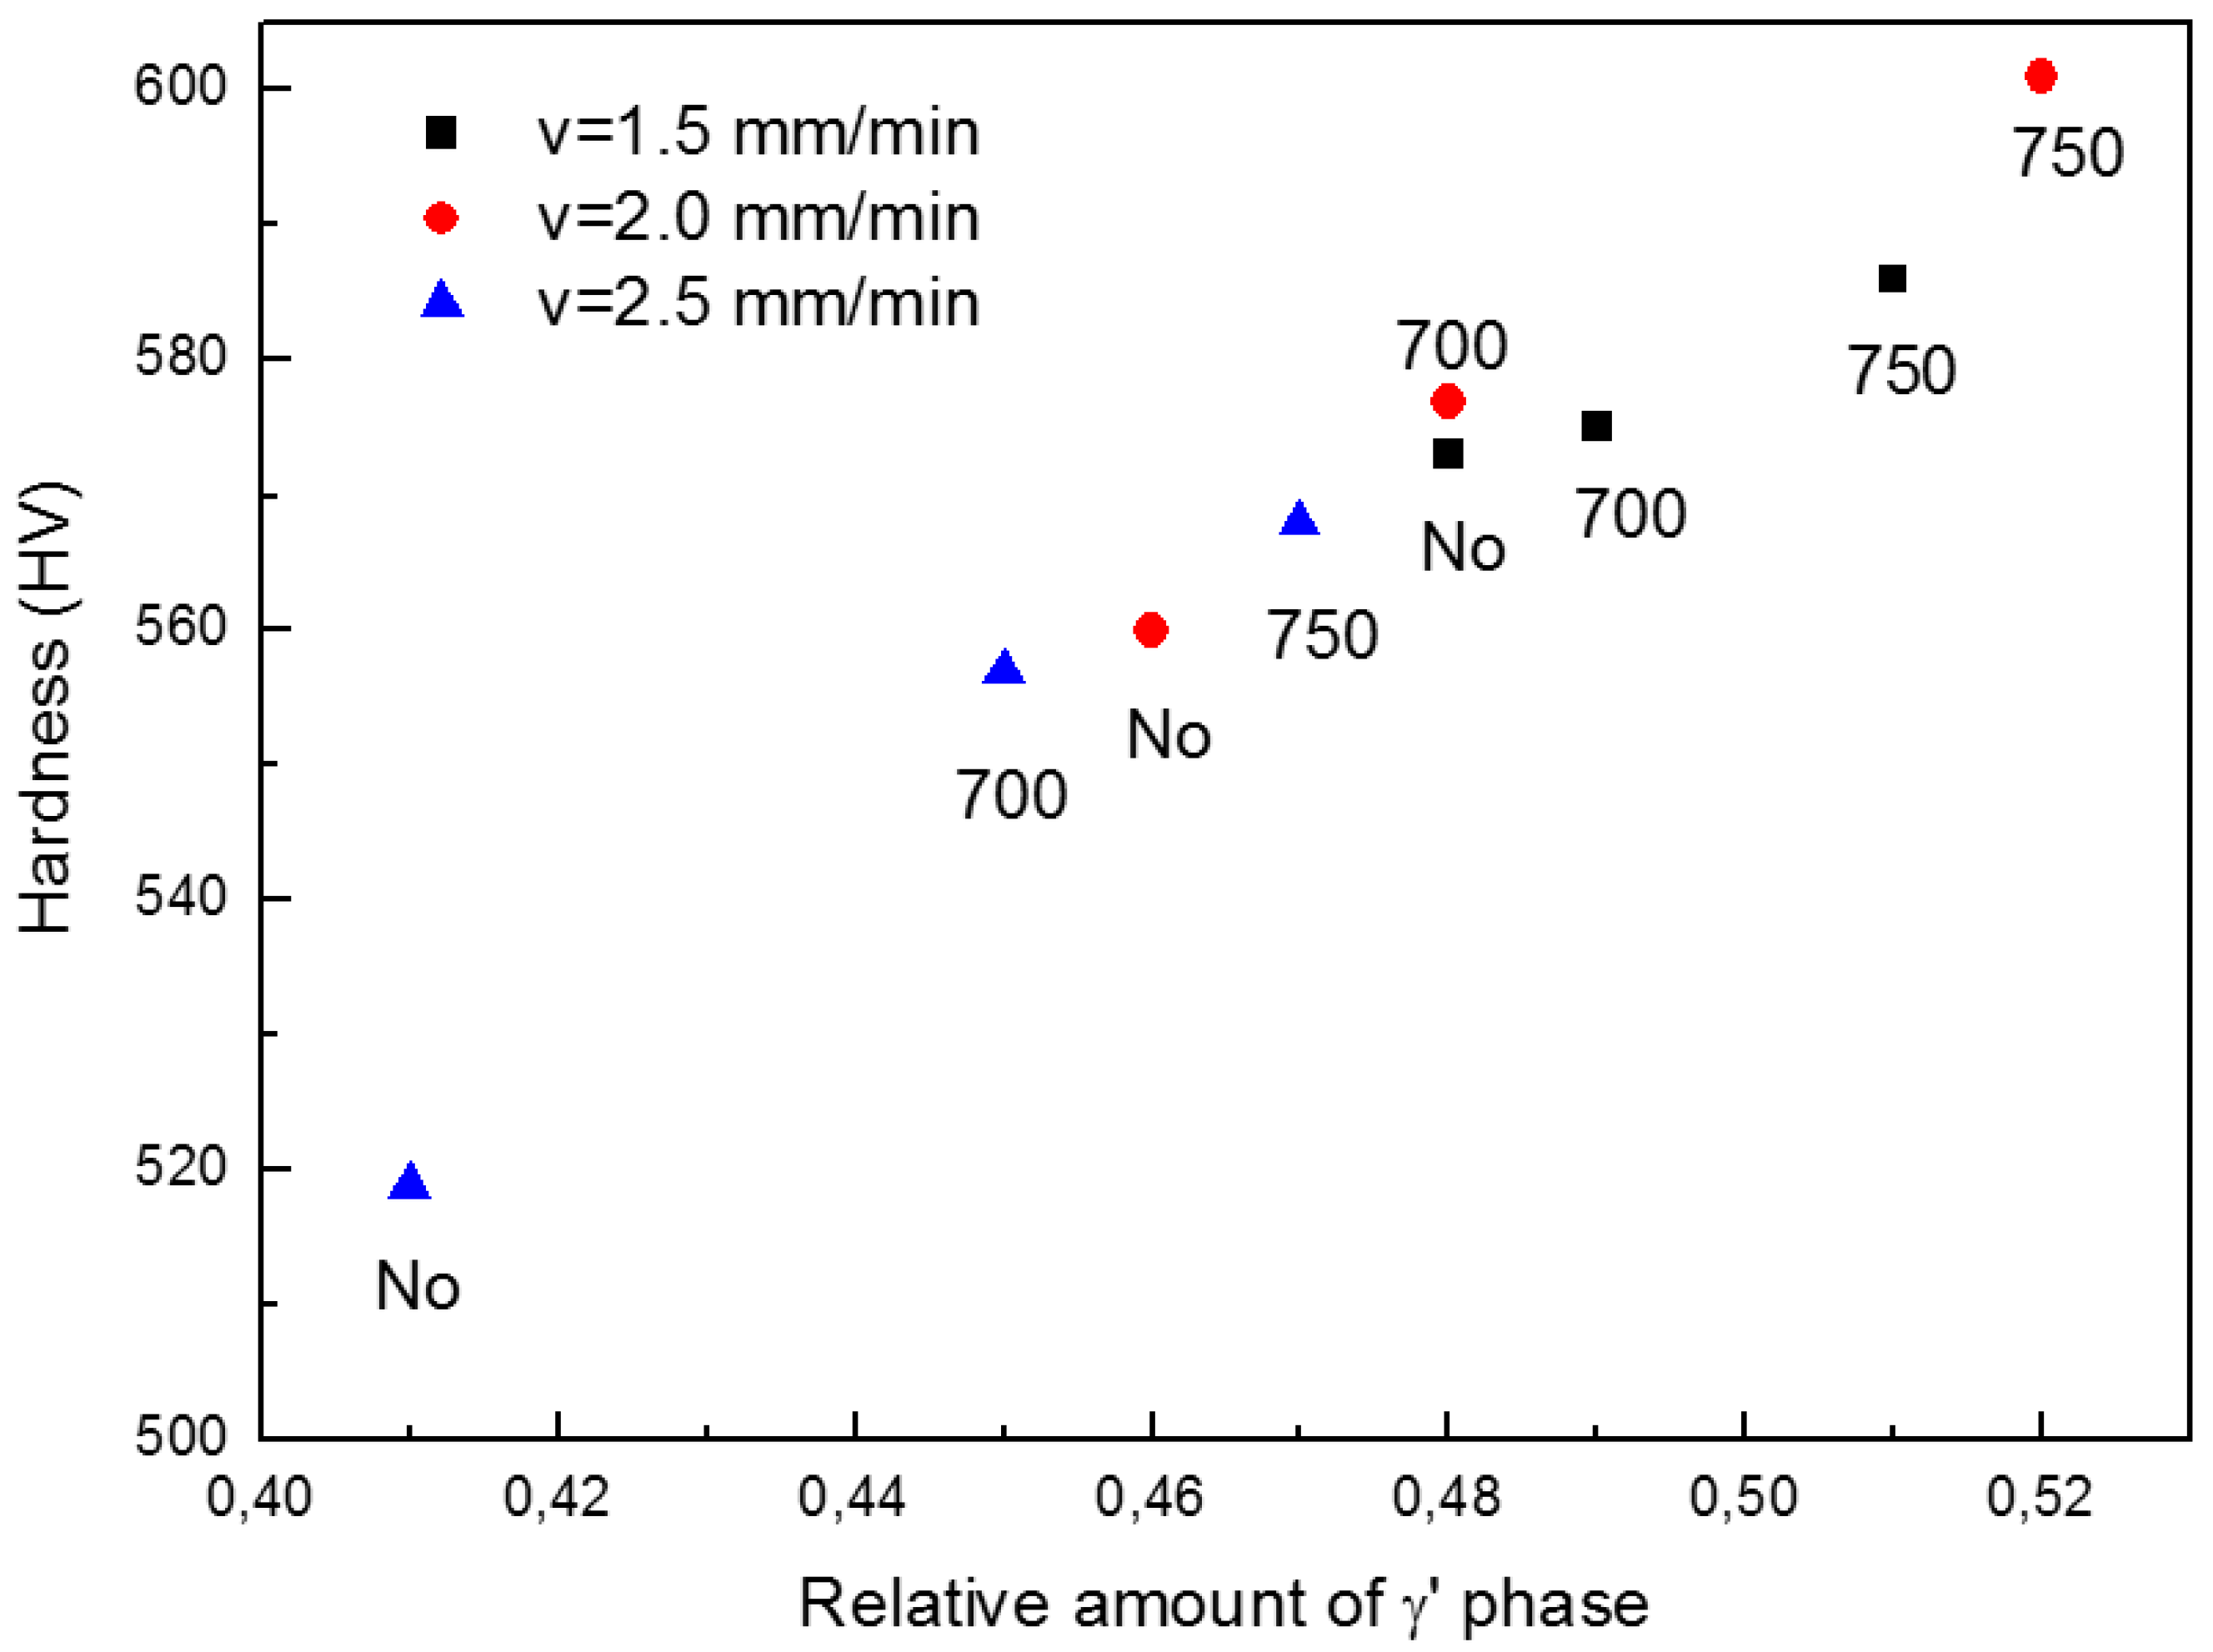
| Welding Pass Speed (m/min) | PHT (°C) | PWHT (°C) | Relative Amount of γ’ Phase in MZ | Hardness in MZ (HV) |
|---|---|---|---|---|
| 1.5 | 300 | No | 0.48 ± 0.06 | 573 ± 25 |
| 1.5 | 300 | 700 | 0.49 ± 0.06 | 575 ± 20 |
| 1.5 | 300 | 750 | 0.51 ± 0.06 | 586 ± 14 |
| 2.0 | 300 | No | 0.46 ± 0.05 | 560 ± 20 |
| 2.0 | 300 | 700 | 0.48 ± 0.05 | 577 ± 20 |
| 2.0 | 300 | 750 | 0.52 ± 0.06 | 601 ± 20 |
| 2.5 | 300 | No | 0.41 ± 0.06 | 519 ± 15 |
| 2.5 | 300 | 700 | 0.45 ± 0.06 | 557 ± 15 |
| 2.5 | 300 | 750 | 0.47 ± 0.06 | 568 ± 20 |
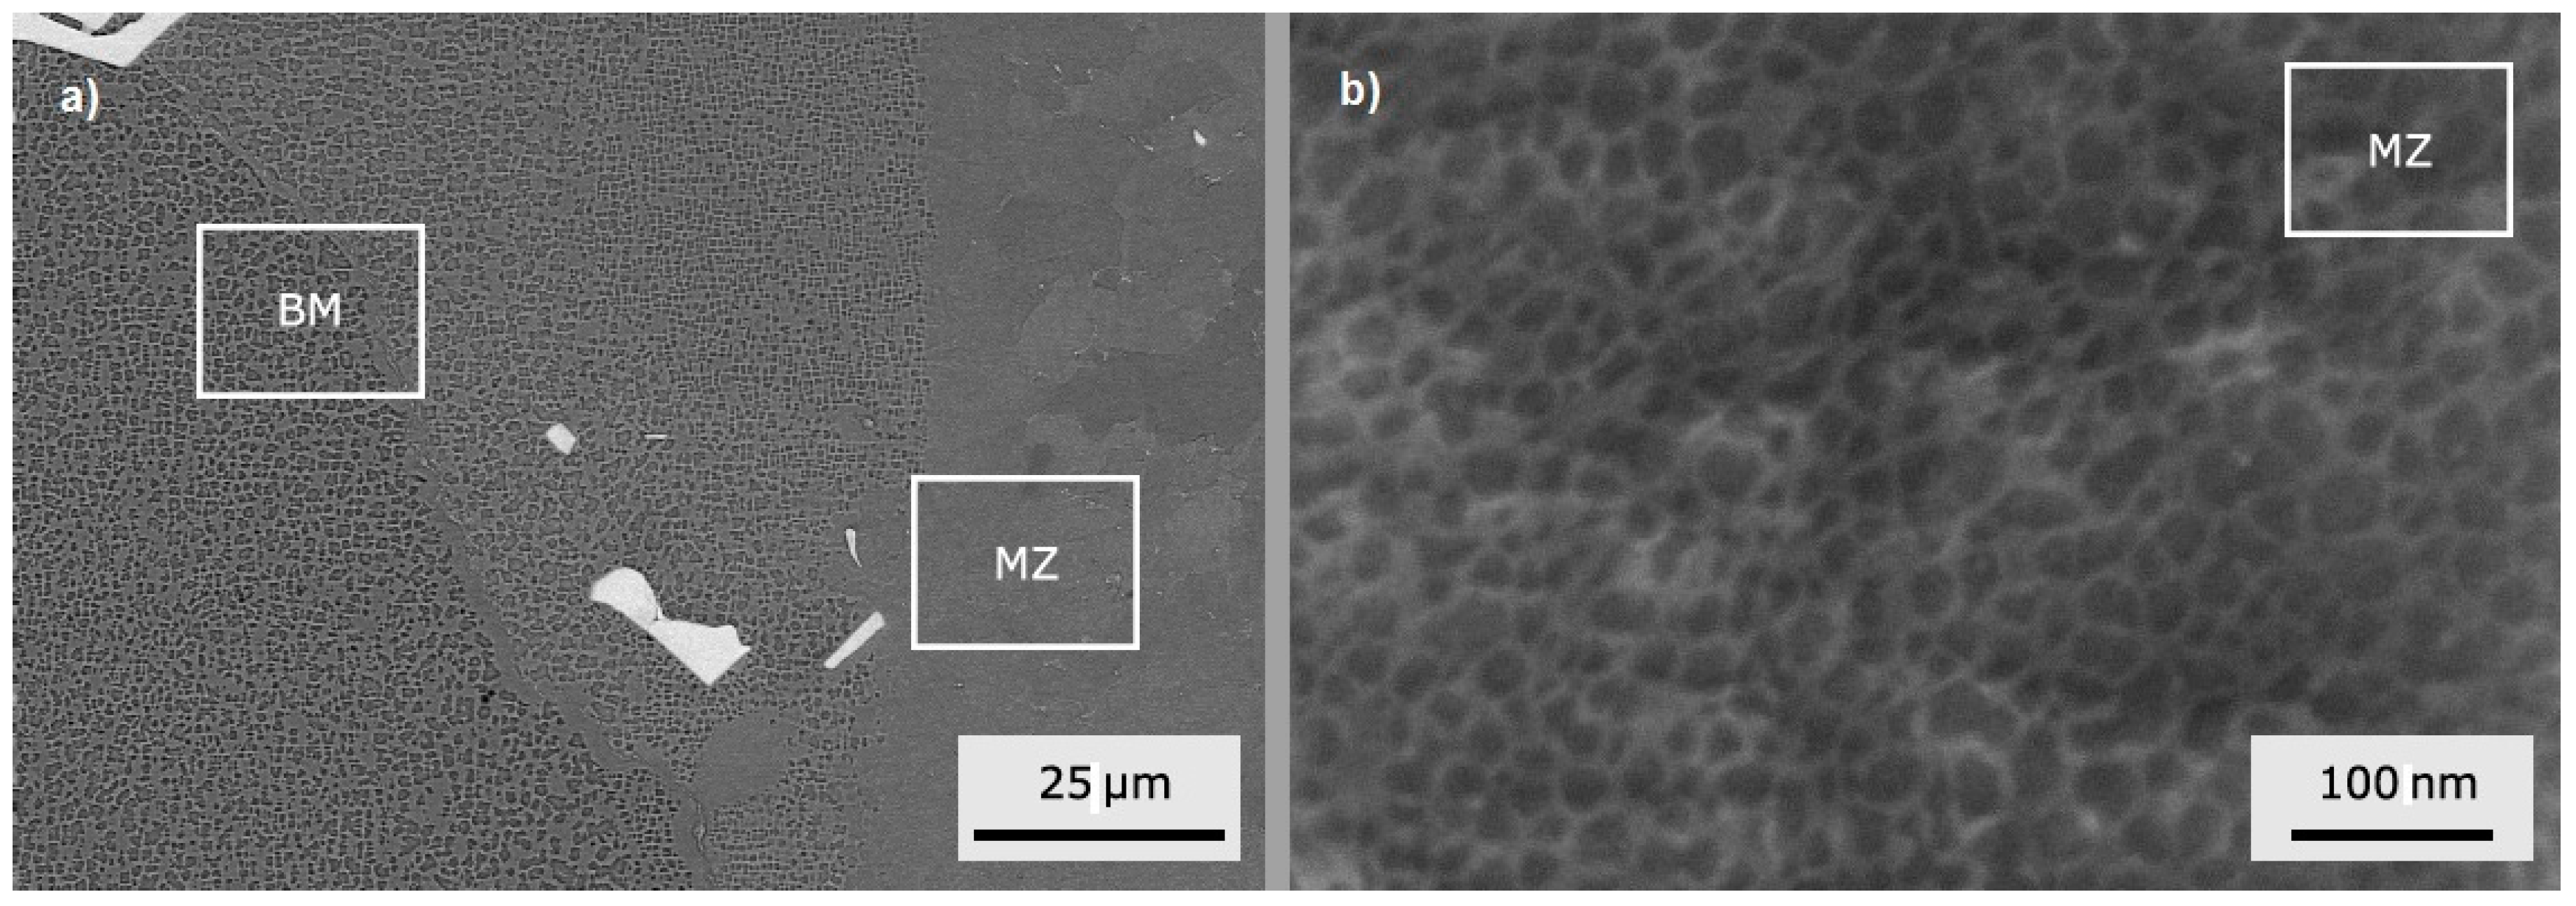
| Material Without PWHT-at (%) | |||||||||
|---|---|---|---|---|---|---|---|---|---|
| - | Phase | Al | Ti | Cr | Co | Ni | Mo | Ta | W |
| BM | γ’ | 18.00 (±2.23) | 6.14 (±0.39) | 5.63 (±1.66) | 5.82 (±0.62) | 60.35 (±1.46) | 0.61 (±0.25) | 2.25 (±0.19) | 1.20 (±0.46) |
| γ | 7.43 (±0.94) | 4.53 (±0.46) | 15.10 (±1.52) | 9.17 (±0.40) | 58.89 (±1.34) | 1.47 (±0.23) | 1.59 (±0.36) | 1.81 (±0.09) | |
| MZ 1.5 m/min | Chinese script (CS) structures | 13.12 (±1.14) | 10.89 (±0.34) | 3.89 (±0.22) | 4.39 (±0.13) | 61.80 (±1.02) | 1.05 (±0.18) | 3.45 (±0.22) | 1.42 (±0.30) |
| γ + γ’ | 6.46 (±0.17) | 4.58 (±0.48) | 10.89 (±0.26) | 8.87 (±1.32) | 64.20 (±1.52) | 1.47 (±0.25) | 1.90 (±0.51) | 1.63 (±0.04) | |
| HAZ 1.5 m/min | γ’ | 17.06 (±1.12) | 7.33 (±0.17) | 3.17 (±0.22) | 5.15 (±0.19) | 63.52 (±0.93) | 0.54 (±0.06) | 2.26 (±0.19) | 0.97 (±0.16) |
| γ | 8.95 (±1.45) | 6.45 (±0.14) | 11.99 (±0.21) | 5.15 (±0.13) | 63.30 (±1.48) | 1.06 (±0.16) | 1.24 (±0.10) | 1.85 (±0.36) | |
| MZ 2 m/min | CS structures | 13.23 (±1.05) | 7.67 (±0.86) | 4.73 (±0.41) | 5.69 (±0.27) | 63.21 (±1.31) | 0.75 (±0.10) | 3.50 (±0.34) | 1.17 (±0.11) |
| γ + γ’ | 7.42 (±0.24) | 3.74 (±0.56) | 13.33 (±0.26) | 9.17 (±0.13) | 61.94 (±0.32) | 0.89 (±0.06) | 1.51 (±0.08) | 2.01 (±0.28) | |
| HAZ 2 m/min | γ’ | 14.19 (±0.55) | 7.66 (±0.23) | 4.56 (±0.20) | 5.69 (±0.18) | 63.91 (±0.78) | 0.49 (±0.02) | 2.53 (±0.21) | 0.98 (±0.13) |
| γ | 7.44 (±0.51) | 4.23 (±0.44) | 14.53 (±0.33) | 9.49 (±0.28) | 59.58 (±1.85) | 1.24 (±0.74) | 1.57 (±0.24) | 1.97 (±0.38) | |
| PWHT 2 h/750 °C-at (%) | |||||||||
|---|---|---|---|---|---|---|---|---|---|
| - | Phase | Al | Ti | Cr | Co | Ni | Mo | Ta | W |
| MZ 1.5 m/min | CS structures | 11.27 (±2.10) | 5.46 (±1.40) | 12.53 (±1.25) | 7.81 (±0.60) | 54.88 (±2.64) | 2.06 (±1.15) | 4.30 (±2.61) | 1.69 (±0.63) |
| γ + γ’ | 9.18 (±0.80) | 4.69 (±0.77) | 13.20 (±0.13) | 8.89 (±0.49) | 59.49 (±1.43) | 1.15 (±0.18) | 1.84 (±0.30) | 1.56 (±0.16) | |
| HAZ 1.5 m/min | γ’ | 19.33 (±8.23) | 6.41 (±0.95) | 4.35 (±0.59) | 5.50 (±0.37) | 60.81 (±6.79) | 0.32 (±0.06) | 2.17 (±0.44) | 1.12 (±0.15) |
| γ | 9.29 (±4.04) | 4.37 (±0.80) | 13.90 (±2.17) | 9.08 (±0.94) | 58.94 (±3.40) | 1.12 (±0.23) | 1.61 (±0.33) | 1.69 (±0.42) | |
| MZ 2 m/min | CS structures | 10.82 (±0.89) | 8.41 (±1.26) | 12.54 (±0.83) | 7.91 (±0.78) | 51.48 (2.16) | 2.17 (±0.34) | 4.81 (±0.91) | 1.86 (±0.09) |
| γ + γ’ | 9.22 (±2.85) | 3.93 (±0.48) | 13.22 (±0.31) | 9.08 (±0.35) | 60.06 (±2.48) | 1.00 (±0.17) | 1.66 (±0.20) | 1.33 (±0.40) | |
| HAZ 2 m/min | γ’ | 16.83 (±1.62) | 5.91 (±0.37) | 8.60 (±2.25) | 6.62 (±0.16) | 57.67 (±4.68) | 0.96 (±0.48) | 2.28 (±0.07) | 1.13 (±0.09) |
| γ | 7.54 (±0.86) | 4.01 (±0.09) | 16.38 (±0.71) | 9.74 (±0.38) | 57.73 (±1.07) | 1.34 (±0.20) | 1.41 (±0.27) | 1.84 (±0.18) | |
| MZ 2.5 m/min | CS structures | 8.81 (±0.96) | 12.90 (±0.97) | 14.85 (±0.64) | 6.89 (±0.66) | 41.74 (±2.04) | 3.58 (±0.15) | 8.52 (±2.88) | 2.72 (±0.96) |
| γ | 10.17 (±0.53) | 3.97 (±0.97) | 13.61 (±0.66) | 9.16 (±0.53) | 58.87 (±0.64) | 1.03 (±0.13) | 1.43 (±0.30) | 1.76 (±0.30) | |
| HAZ 2.5 m/min | γ’ | 18.13 (±3.05) | 5.72 (±1.27) | 6.56 (±4.87) | 5.90 (±1.69) | 59.42 (±4.76) | 0.71 (±0.38) | 2.19 (±0.47) | 1.37 (±0.41) |
| γ | 7.60 (±2.06) | 3.95 (±0.23) | 15.34 (±1.48) | 9.61 (±0.28) | 59.28 (±3.39) | 1.15 (±0.27) | 1.30 (±0.08) | 1.78 (±0.30) | |
© 2017 by the authors. Licensee MDPI, Basel, Switzerland. This article is an open access article distributed under the terms and conditions of the Creative Commons Attribution (CC BY) license (http://creativecommons.org/licenses/by/4.0/).
Share and Cite
Angella, G.; Barbieri, G.; Donnini, R.; Montanari, R.; Richetta, M.; Varone, A. Electron Beam Welding of IN792 DS: Effects of Pass Speed and PWHT on Microstructure and Hardness. Materials 2017, 10, 1033. https://doi.org/10.3390/ma10091033
Angella G, Barbieri G, Donnini R, Montanari R, Richetta M, Varone A. Electron Beam Welding of IN792 DS: Effects of Pass Speed and PWHT on Microstructure and Hardness. Materials. 2017; 10(9):1033. https://doi.org/10.3390/ma10091033
Chicago/Turabian StyleAngella, Giuliano, Giuseppe Barbieri, Riccardo Donnini, Roberto Montanari, Maria Richetta, and Alessandra Varone. 2017. "Electron Beam Welding of IN792 DS: Effects of Pass Speed and PWHT on Microstructure and Hardness" Materials 10, no. 9: 1033. https://doi.org/10.3390/ma10091033
APA StyleAngella, G., Barbieri, G., Donnini, R., Montanari, R., Richetta, M., & Varone, A. (2017). Electron Beam Welding of IN792 DS: Effects of Pass Speed and PWHT on Microstructure and Hardness. Materials, 10(9), 1033. https://doi.org/10.3390/ma10091033