Structural, Elastic, Electronic and Optical Properties of SrTMO3 (TM = Rh, Zr) Compounds: Insights from FP-LAPW Study


 , ,
, , 
Abstract
1. Introduction
2. Computational Details
3. Results and Discussions
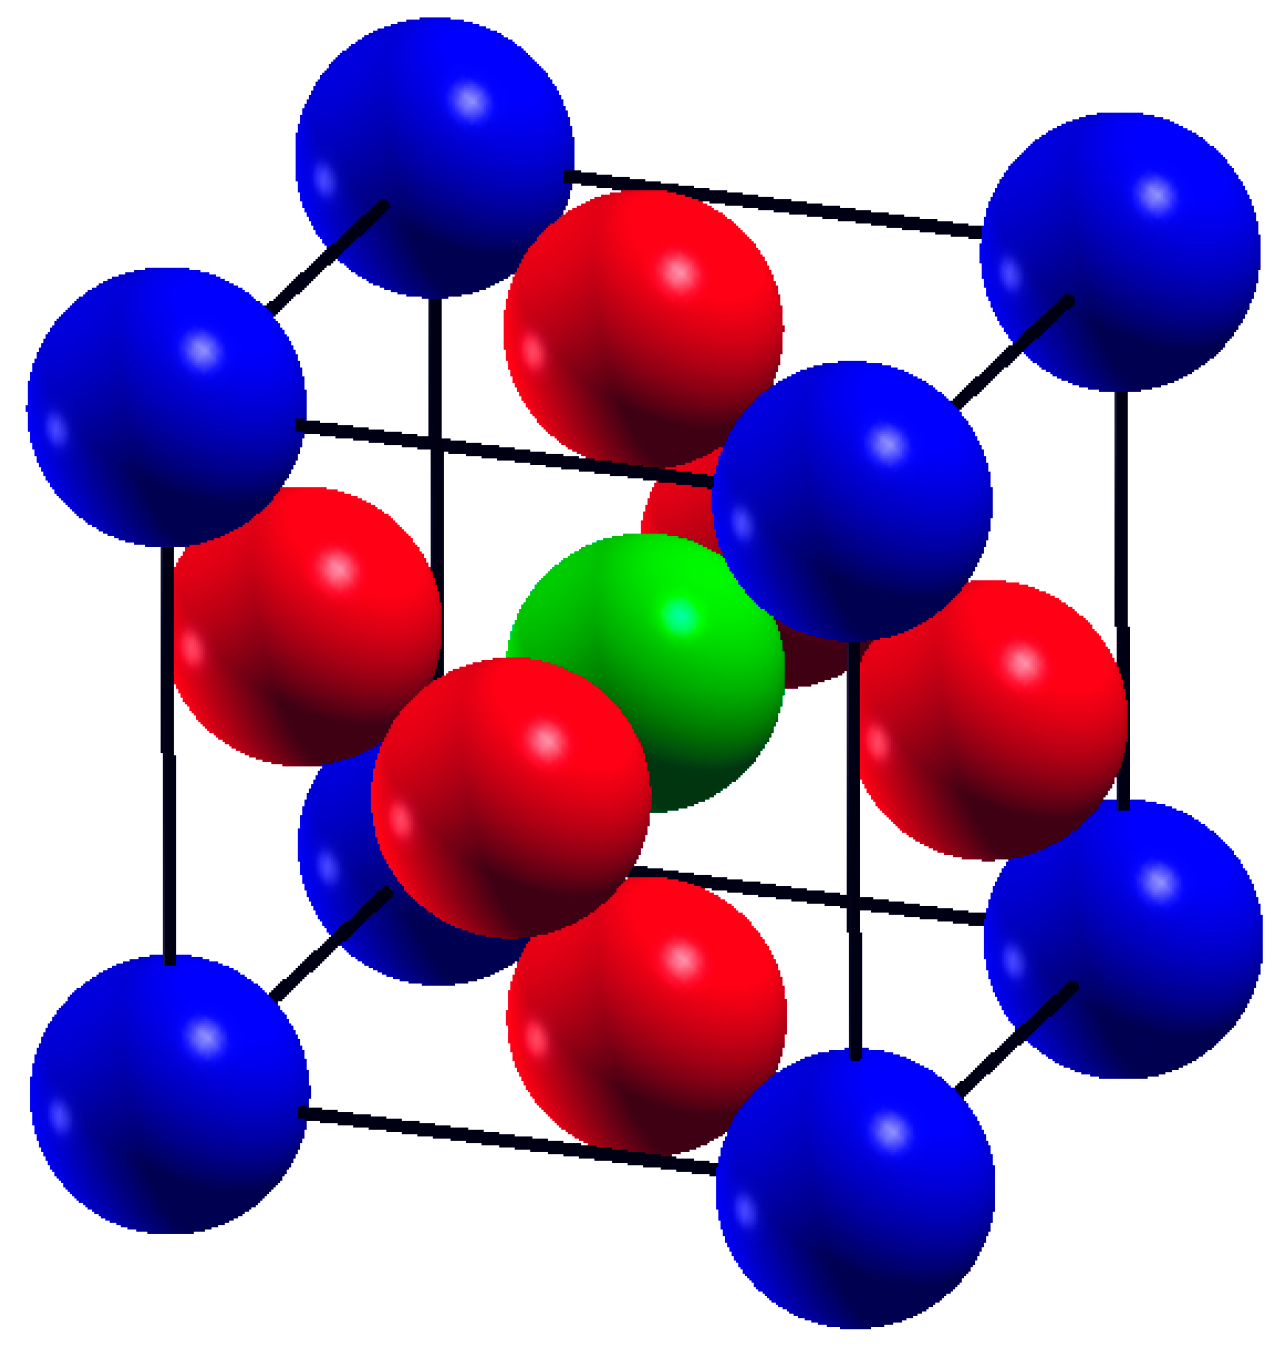
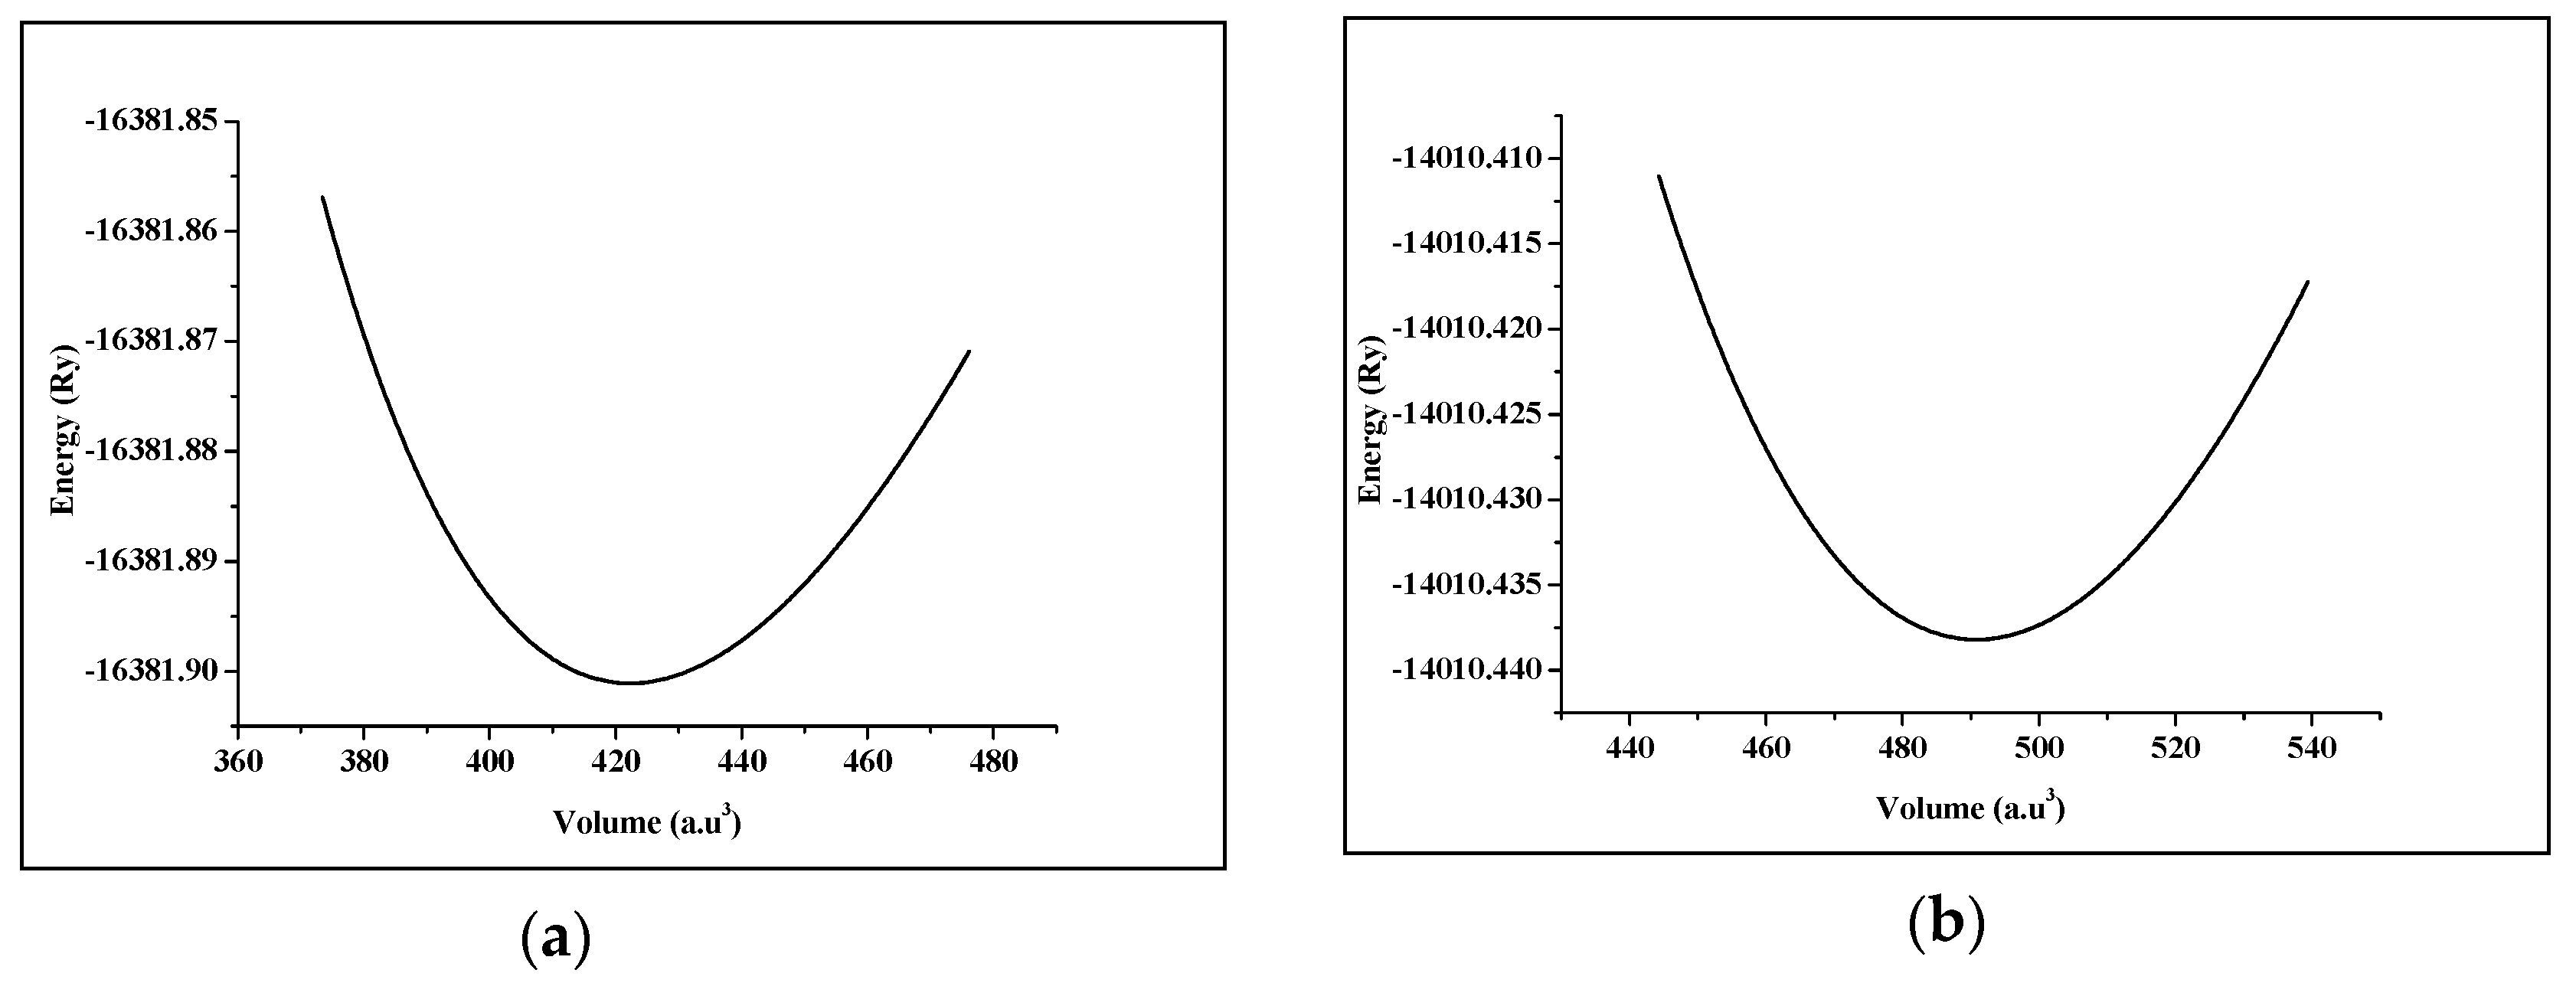
3.1. Structural Properties
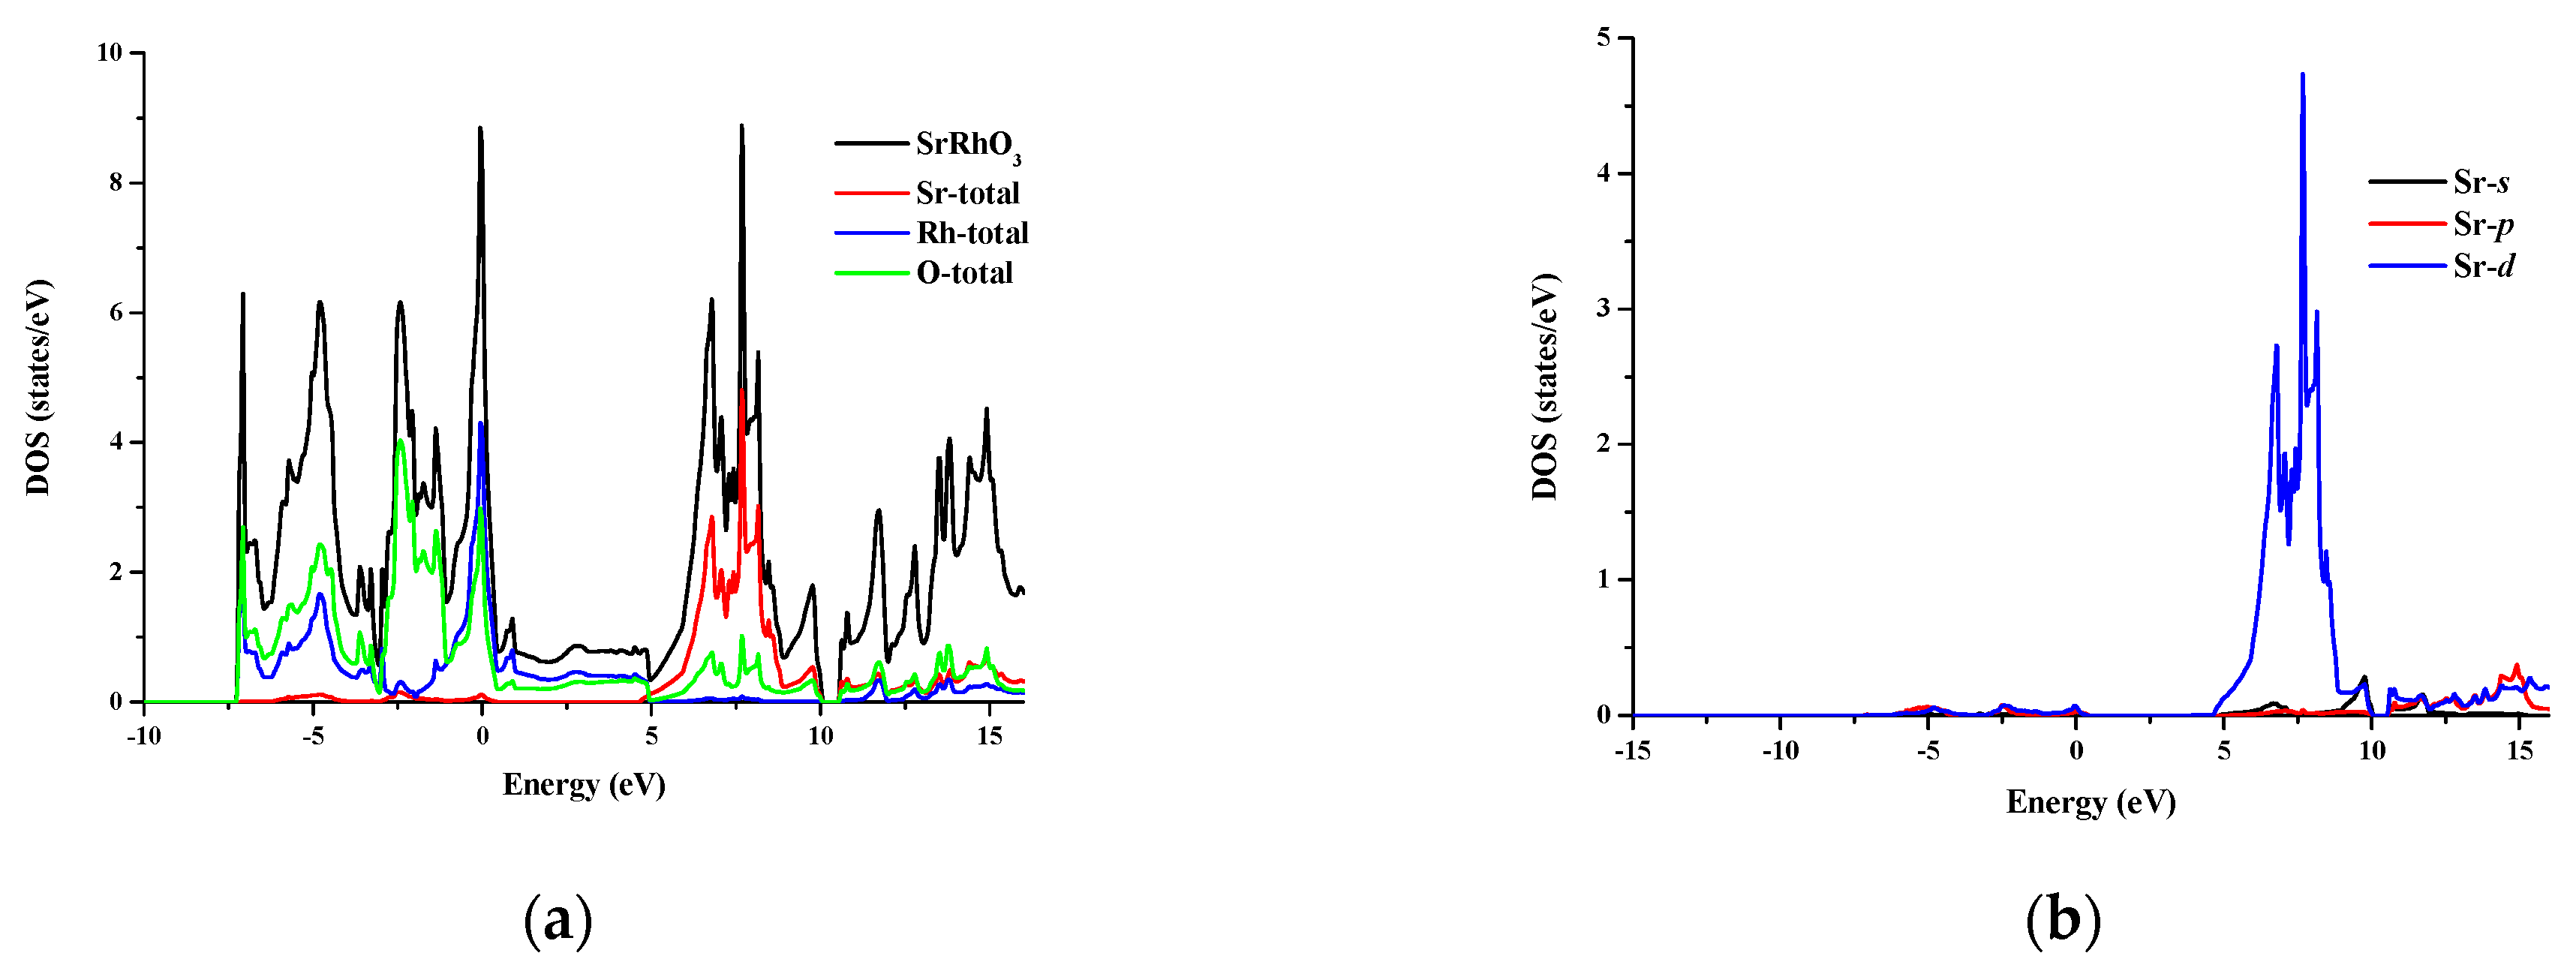
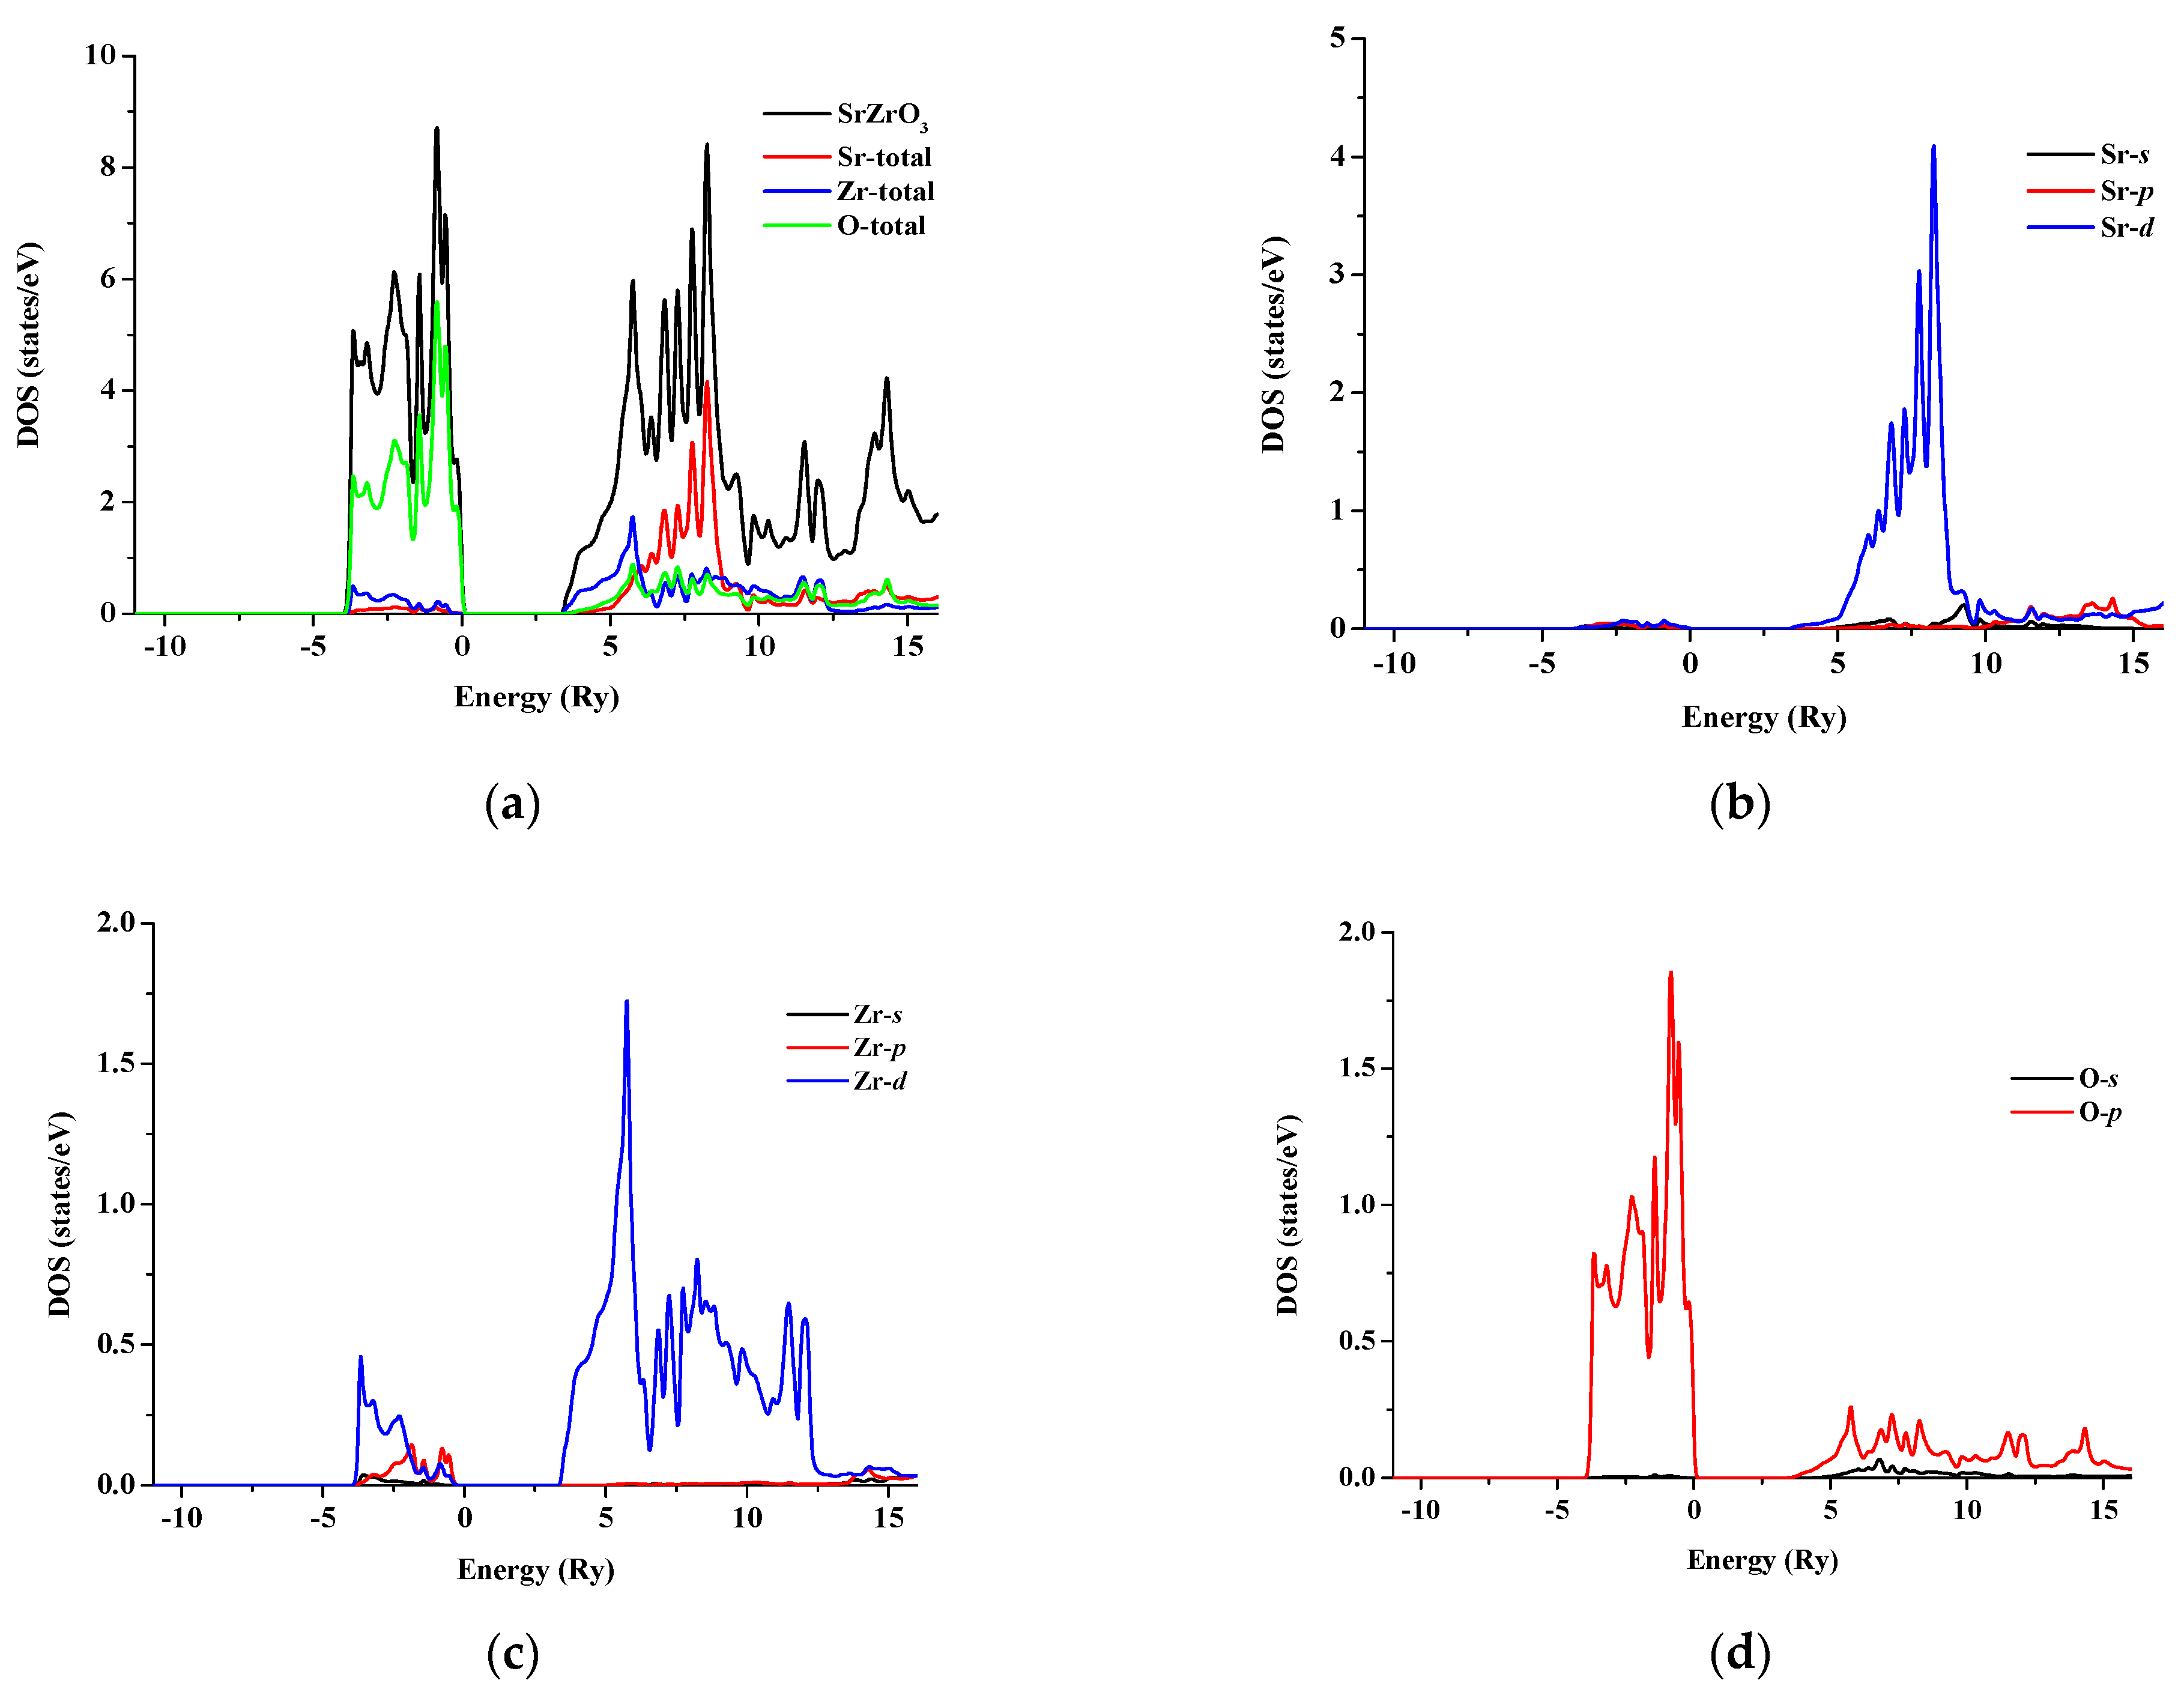
3.2. Electronic Properties
3.3. Elastic Properties
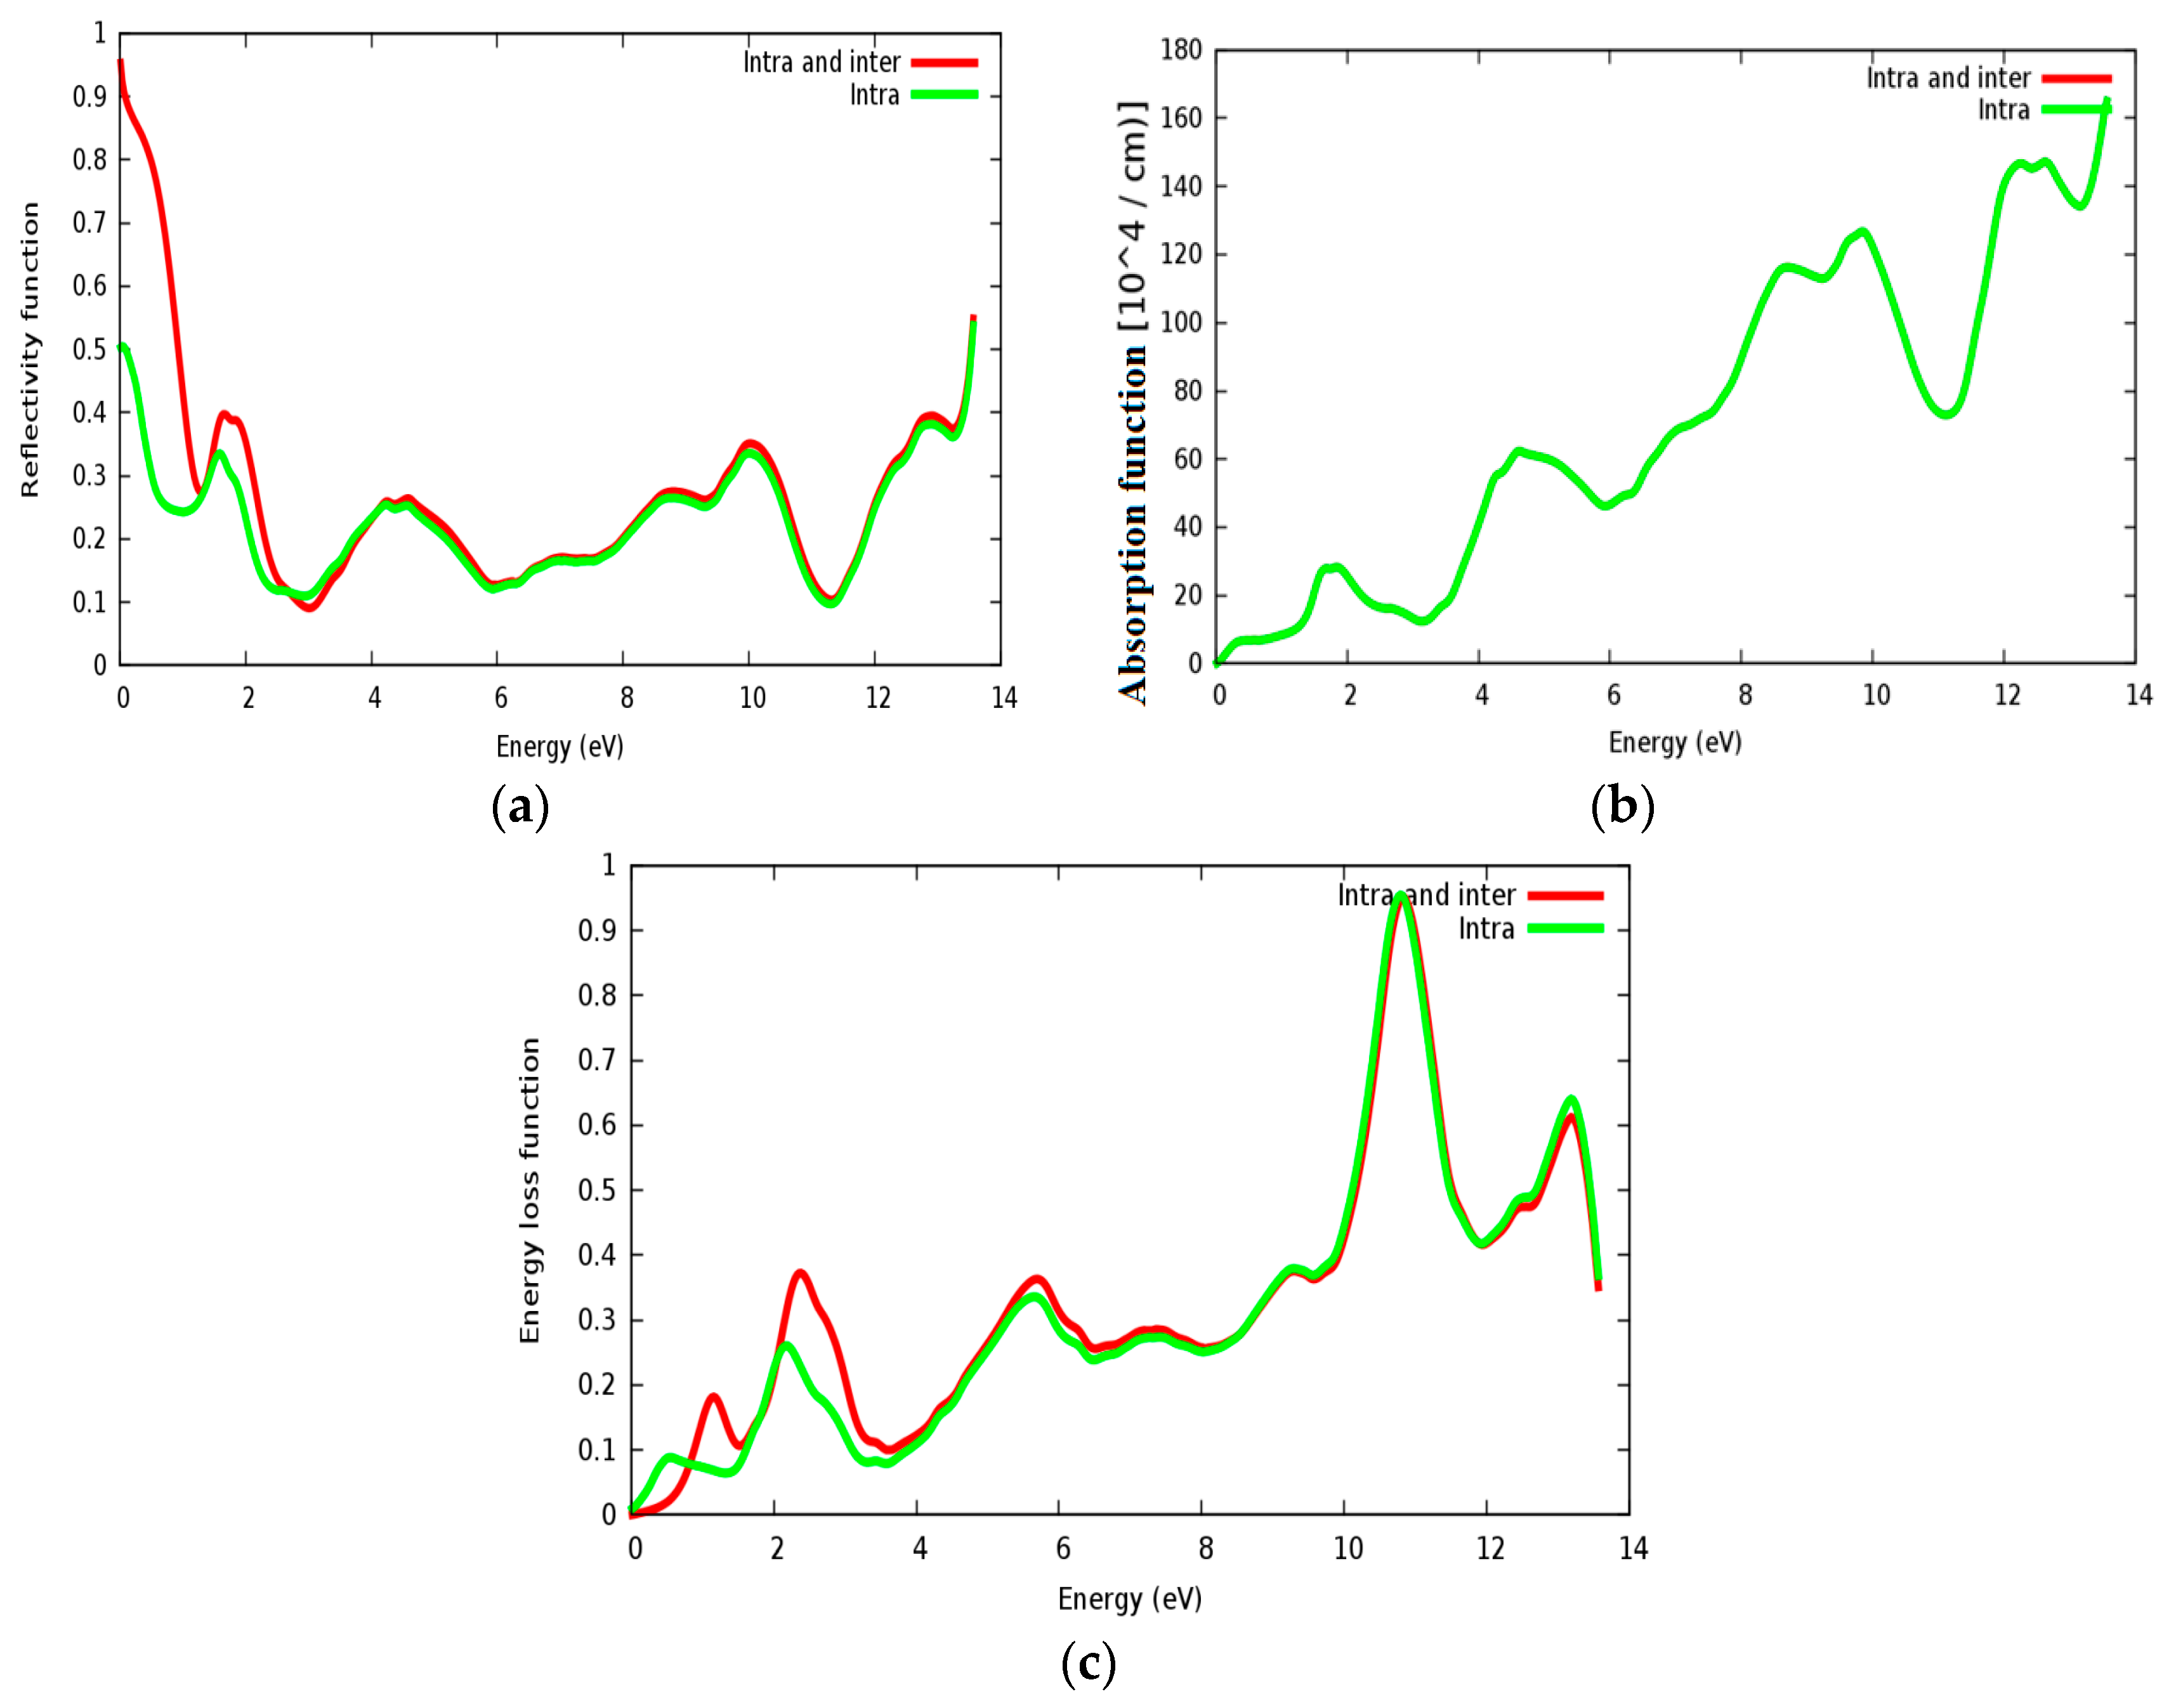
3.4. Optical Properties
4. Conclusions
Author Contributions
Funding
Acknowledgments
Conflicts of Interest
References
- Bouadjemi, B.; Bentata, S.; Abbad, A.; Benstaali, W.; Bouhafs, B. Half-metallic ferromagnetism in PrMnO3 perovskite from first principles calculations. Solid State Commun. 2013, 168, 6–10. [Google Scholar] [CrossRef]
- Rahaman, M.Z.; Rahman, M.A.; Sarker, M.A.R. Prediction of a new transition metal oxide MgRhO3 with SrTiO3-type structure: Stability, structure and physical characteristics Chin. J. Phys. 2017, 55, 1489–1494. [Google Scholar]
- Yamaura, K.; Huang, Q.; Young, D.P.; Arai, M.; Takayama-Muromachi, E. Electronic properties of the novel 4d metallic oxide SrRhO3. Phys. B Phys. Condens. Matter 2003, 329–333, 820–821. [Google Scholar] [CrossRef]
- Saha, S.; Sinha, T.P.; Mookerjee, A. Structural and optical properties of paraelectric SrTiO3. J. Phys. Condens. Matter 2000, 12, 3325. [Google Scholar] [CrossRef]
- Johnsson, M.; Lemmens, P. Crystallography and chemistry of perovskites. In Handbook of Magnetism and Advanced Magnetic Materials; Kronmüller, H., Parkin, S., Eds.; John Wiley & Sons: Hoboken, NJ, USA, 2007. [Google Scholar]
- Pena, M.A.; Fierro, J.L. Chemical structures and performance of perovskite oxides. Chem. Rev. 2001, 101, 1981–2018. [Google Scholar] [CrossRef] [PubMed]
- Ghebouli, B.; Ghebouli, M.A.; Chihi, T.; Fatmi, M.; Boucetta, S.; Reffas, M. First-principles study of structural, elastic, electronic and optical properties of SrMO3 (M = Ti and Sn). Solid State Commun. 2009, 149, 2244–2249. [Google Scholar] [CrossRef]
- Sakhya, A.; Maibam, J.; Saha, S.; Chanda, S.; Dutta, A.; Sharama, B.; Thapa, R.K.; Sinha, T.B. Electronic structure and elastic properties of ATiO3 (A = Ba, Sr, Ca) perovskites: A first principles study. Indian J. Pure Appl. Phys. 2015, 53, 102–109. [Google Scholar]
- Van Roosmalen, J.A.M.; van Vlaanderen, P.; Cordfunke, E.H.P. On the structure of SrZrO3. J. Solid State Chem. 1992, 101, 59–65. [Google Scholar] [CrossRef]
- Boudali, A.; Khodja, M.D.; Amrani, B.; Bourbie, D.; Amara, K.; Abada, A. First-principles study of structural, elastic, electronic, and thermal properties of SrTiO3 perovskite cubic. Phys. Lett. A 2009, 373, 879–884. [Google Scholar] [CrossRef]
- Blaha, P.; Schwarz, K.; Madsen, G.K.H.; Kvasnicka, D.; Luitz, J. WIEN2k: An Augmented Plane Wave plus Local Orbitals Program for Calculating Crystal Properties; Vienne University of Technology: Vienna, Austria, 2001. [Google Scholar]
- Daga, A.; Sharma, S.; Sharma, K.S. First principle study of cubic SrMO3 perovskites (M = Ti, Zr, Mo, Rh, Ru). J. Mod. Phys. 2011, 2, 812–816. [Google Scholar] [CrossRef]
- Ali, M.L.; Rahaman, M.Z. The structural, elastic, electronic and optical properties of cubic perovskite SRVO3 compound: An ab initio study. Int. J. Mater. Sci. Appl. 2016, 5, 202–206. [Google Scholar]
- Ali, M.L.; Rahaman, M.Z. Variation of the physical proprties of four transition metal oxides SrTMO3 (TM = Rh, Ti, Mo, Zr) under pressure: An ab initio study. J. Adv. Phys. 2017, 6, 197–205. [Google Scholar] [CrossRef]
- CASTEP Guide. Materials Studio 8.0; BIOVIA: San Diego, CA, USA, 2010; pp. 261–262.
- Shende, R.V.; Krueger, D.S.; Rosetti, G.A.; Lombardo, S.J. Strontium zirconate and strontium titanate ceramics for high-voltage applications: Synthesis, processing, and dielectric properties. J. Am. Ceram. Soc. 2001, 84, 1648–1650. [Google Scholar] [CrossRef]
- Singh, D.J. Prospects for quantum criticality in perovskite SrRhO3. Phys. Rev. B 2003, 67, 054507. [Google Scholar] [CrossRef]
- Blaha, P.; Schwarz, K.; Sorantin, P.; Trickey, S.B. Full-potential, linearized augmented plane wave programs for crystalline systems. Comput. Phys. Commun. 1990, 59, 399–415. [Google Scholar] [CrossRef]
- Monkhorst, H.J.; Pack, J.D. Special points for Brillouin-zone integrations. Phys. Rev. B 1976, 13, 5188. [Google Scholar] [CrossRef]
- Perdew, J.P.; Burke, K.; Ernzerhof, M. Generalized gradient approximation made simple. Phys. Rev. Lett. 1996, 77, 3865. [Google Scholar] [CrossRef] [PubMed]
- Becke, A.; Johnson, E.R. A simple effective potential for exchange. J. Chem. Phys. 2006, 124, 221101. [Google Scholar] [CrossRef] [PubMed]
- Murnaghan, F.D. The compressibility of media under extreme pressures. Proc. Natl. Acad. Sci. USA 1944, 30, 244–247. [Google Scholar] [CrossRef] [PubMed]
- Lee, Y.S.; Lee, J.S.; Noh, T.W.; Byun, D.Y.; Yoo, K.S.; Yamaura, K.; Takayama-Muromachi, E. Systematic trends in the electronic structure parameters of the 4d transition-metal oxides SrMO3 (M = Zr, Mo, Ru, and Rh). Phys. Rev. B 2003, 67, 113101. [Google Scholar] [CrossRef]
- Smith, A.J.; Welch, A.J.E. Some mixed metal oxides of perovskite structure. J. Acta Crystallogr. 1960, 13, 653–656. [Google Scholar] [CrossRef]
- Ligny, D.D.; Richet, P. High-temperature heat capacity and thermal expansion of SrTiO3 and SrZrO3 perovskites. Phys. Rev. B 1996, 53, 3013. [Google Scholar] [CrossRef]
- Mete, A.; Shaltaf, R.; Ellialtioglu, S. Electronic and structural properties of a 4d perovskite: Cubic phase of SrZrO3. Phys. Rev. B 2003, 68, 035119. [Google Scholar] [CrossRef]
- Bader, R.F.W. Atoms in Molecules: A Quantum Theory; Oxford University Press: Oxford, UK, 1990. [Google Scholar]
- Luana, V.; Costales, A.; Pendas, A.M. Ions in crystals: The topology of the electron density in ionic materials. II. The cubic alkali halide perovskites. Phys. Rev. B 1997, 55, 4285. [Google Scholar] [CrossRef]
- Mori-Sánchez, P.; Pendás, A.M.; Luaña, V. A classification of covalent, ionic, and metallic solids based on the electron density. J. Am. Chem. Soc. 2002, 124, 14721–14723. [Google Scholar] [CrossRef]
- Becke, A.D.; Edgecombe, K.E. A simple measure of electron localization in atomic and molecular systems. J. Chem. Phys. 1990, 92, 5397–5403. [Google Scholar] [CrossRef]
- Sun, Z.; Music, D.; Ahuja, R.; Schneider, J.M. Electronic origin of shearing in M2AC (M = Ti, V, Cr, A = Al, Ga). J. Phys. Condens. Matter 2005, 17, 7169–7176. [Google Scholar] [CrossRef]
- IRelast Package. Cubic-elastic_13.2; Part of the Commercial Code WIEN2k. Available online: http://susi.theochem.tuwien.ac.at/ (accessed on 1 September 2018).
- Born, M. On the stability of crystal lattices. I. Math. Proc. Camb. Philos. Soc. 1940, 36, 160–172. [Google Scholar] [CrossRef]
- Born, M.; Huang, K. Dynamical Theory of Crystal Lattices; Oxford University Press: Oxford, UK, 1956. [Google Scholar]
- Hill, R. The elastic behaviour of a crystalline aggregate. Proc. Phys. Soc. Sect. A 1952, 65, 349. [Google Scholar] [CrossRef]
- Voigt, W. Lehrbuch der Kristallphysik (mit Ausschluss der Kristalloptik); B.G. Teubner: Berlin, Germany, 1910; pp. 1850–1919. [Google Scholar]
- Reuss, A. Berechnung der fließgrenze von mischkristallen auf grund der plastizitätsbedingung für einkristalle. Z. Angew. Math. Mech. 1929, 9, 49–58. [Google Scholar] [CrossRef]
- Terki, R.; Feraoun, H.; Bertrand, G.; Aourag, H. Full potential calculation of structural, elastic and electronic properties of BaZrO3 and SrZrO3. Basic Solid State Phys. 2005, 242, 1054–1062. [Google Scholar] [CrossRef]
- Teter, D.M. Computational alchemy: The search for new superhard materials. MRS Bull. 2013, 23, 22–27. [Google Scholar] [CrossRef]
- Pugh, S.F. XCII. Relations between the elastic moduli and the plastic properties of polycrystalline pure metals. Philos. Mag. 1954, 45, 823–843. [Google Scholar] [CrossRef]
- Pettifor, D.G. Theoretical predictions of structure and related properties of intermetallics. Mater. Sci. Technol. 1992, 8, 345. [Google Scholar] [CrossRef]
- Frantsevich, I.N.; Voronov, F.F.; Bokuta, S.A. Elastic Constants and Elastic Moduli of Metals and Insulators Handbook; Frantsevich, I.N., Ed.; Naukova Dumka: Kiev, Ukraine, 1983; p. 60. [Google Scholar]
- Zener, C. Elasticity and Anelasticity of Metals; University of Chicago Press: Chicago, IL, USA, 1948. [Google Scholar]
- Tvergaard, V.; Hutshinson, J.W. Microcracking in ceramics induced by thermal expansion or elastic anisotropy. J. Am. Ceram. Soc. 1988, 71, 157–166. [Google Scholar] [CrossRef]
- Ehrenreich, H.; Cohen, M.H. Self-consistent field approach to the many-electron problem. Phys. Rev. 1959, 115, 786. [Google Scholar] [CrossRef]
- Hedin, L. New Method for Calculating the One-Particle Green’s function with application to the electron-gas problem. Phys. Rev. A 1965, 139, A796. [Google Scholar] [CrossRef]
- Fox, M. Optical Properties of Solids; Oxford University Press: Oxford, UK, 2001. [Google Scholar]
- Abeles, F. Optical Properties of Solids; American Elsevier: Atlanta, GA, USA, 1972. [Google Scholar]
- Wang, H.; Wang, Y.; Cao, X.; Zhang, L.; Feng, M.; Lan, G. Simulation of electronic density of states and optical properties of PbB4O7 by first-principles DFT method. Phys. Status Solidi B 2009, 246, 437–443. [Google Scholar] [CrossRef]
- He, Y.; Zeng, T. First-principles study and model of dielectric functions of silver nanoparticles. J. Phys. Chem. C 2010, 114, 18023–18030. [Google Scholar] [CrossRef]
- Koontz, R.; Blokhina, G.; Gold, S.; Krasnykh, A. High dielectric constant materials for pulsed energy storage capacitors. In Proceedings of the 1998 Annual Report Conference on Electrical Insulation and Dielectric Phenomena (Cat. No. 98CH36257), Atlanta, GA, USA, 25–28 October 1998. [Google Scholar]


| Compound | a (Å) | B (GPa) | B’ | |
|---|---|---|---|---|
| SrRhO3 | Present work | 3.976 | 162.55 | 5.97 |
| Experimental work | 3.92 [23] | – | – | |
| Other theoretical work | 3.932 [12] 4.074 [14] | – | – | |
| SrZrO3 | Present work | 4.176 | 153.25 | 3.98 |
| Experimental work | 4.109 [24] | 150 [25] | – | |
| Other theoretical work | 4.076 [12] 4.177 [14] | – | – | |
| Present Work | Other Theoretical Work | |
|---|---|---|
| PBE-GGA | mBJ-GGA | |
| 3.69 eV | 4.53 eV | 3.37 eV [26] |
| Compound | C11 | C12 | C44 | B | SH | B/SH | Y | ν | A | |
|---|---|---|---|---|---|---|---|---|---|---|
| SrZrO3 | Present work | 319.61 | 72.54 | 88.05 | 154.90 | 102.2 | 1.52 | 248.62 | 0.23 | 0.71 |
| Theory [38] | 338.60 | 71.00 | 77.00 | 160.00 | 118.8 | 1.35 | 247.64 | 0.20 | 0.58 | |
| Theory [14] | 299.16 | 72.57 | 72.58 | 124.76 | 74.81 | 1.67 | 241.34 | 0.25 | 0.64 | |
| SrRhO3 | Present work | 239.53 | 131.17 | 100.27 | 167.29 | 78.32 | 2.14 | 203.25 | 0. 30 | 1.85 |
| Theory [14] | 196.25 | 99.9 | 46.28 | 132.01 | 47.02 | 2.81 | 126.11 | 0.34 | 0.96 | |
© 2018 by the authors. Licensee MDPI, Basel, Switzerland. This article is an open access article distributed under the terms and conditions of the Creative Commons Attribution (CC BY) license (http://creativecommons.org/licenses/by/4.0/).
Share and Cite
Shawahni, A.M.; Abu-Jafar, M.S.; Jaradat, R.T.; Ouahrani, T.; Khenata, R.; Mousa, A.A.; Ilaiwi, K.F. Structural, Elastic, Electronic and Optical Properties of SrTMO3 (TM = Rh, Zr) Compounds: Insights from FP-LAPW Study. Materials 2018, 11, 2057. https://doi.org/10.3390/ma11102057
Shawahni AM, Abu-Jafar MS, Jaradat RT, Ouahrani T, Khenata R, Mousa AA, Ilaiwi KF. Structural, Elastic, Electronic and Optical Properties of SrTMO3 (TM = Rh, Zr) Compounds: Insights from FP-LAPW Study. Materials. 2018; 11(10):2057. https://doi.org/10.3390/ma11102057
Chicago/Turabian StyleShawahni, Areej M., Mohammed S. Abu-Jafar, Raed T. Jaradat, Tarik Ouahrani, Rabah Khenata, Ahmad A. Mousa, and Khaled F. Ilaiwi. 2018. "Structural, Elastic, Electronic and Optical Properties of SrTMO3 (TM = Rh, Zr) Compounds: Insights from FP-LAPW Study" Materials 11, no. 10: 2057. https://doi.org/10.3390/ma11102057
APA StyleShawahni, A. M., Abu-Jafar, M. S., Jaradat, R. T., Ouahrani, T., Khenata, R., Mousa, A. A., & Ilaiwi, K. F. (2018). Structural, Elastic, Electronic and Optical Properties of SrTMO3 (TM = Rh, Zr) Compounds: Insights from FP-LAPW Study. Materials, 11(10), 2057. https://doi.org/10.3390/ma11102057