3.2.1. Hydration Kinetic Model
A hydration kinetic model is often used to analyze the influence of various factors on the reaction rate and reaction direction during the hydration process, in order to reveal its control mechanism [
22]. The Krstulovic–Dabic model assumes that three basic processes take place during the early hydration of the cement-based materials, namely nucleation and crystal growth (NG), phase boundary reaction (I), and diffusion (D) [
23]. The three control processes may occur simultaneously, and can also occur alone or in pairs, but the hydration rate of the overall process depends on the one which reacts slowest. That is, the slowest reaction controls the reaction rate and mechanism at an early stage [
24]. The Krstulovic–Dabic model also gives the basic kinetic equations to describe the three dominating processes of these three control processes as follows:
where
α is hydration degree;
,
,
is the reaction rate constant corresponding to the hydration processes NG, I, and D;
t is hydration time;
t0 is the time when the induction period ends;
R is the ideal gas constant;
n is the crystal growth index that reflects the geometrical crystal growth, 1 ≤
n ≤ 2 [
25].
When
α is differentiated with respect to
t in the equations above, the hydration rate of each process is obtained as follows:
where
,
, and
represent the hydration processes NG, I, and D, respectively.
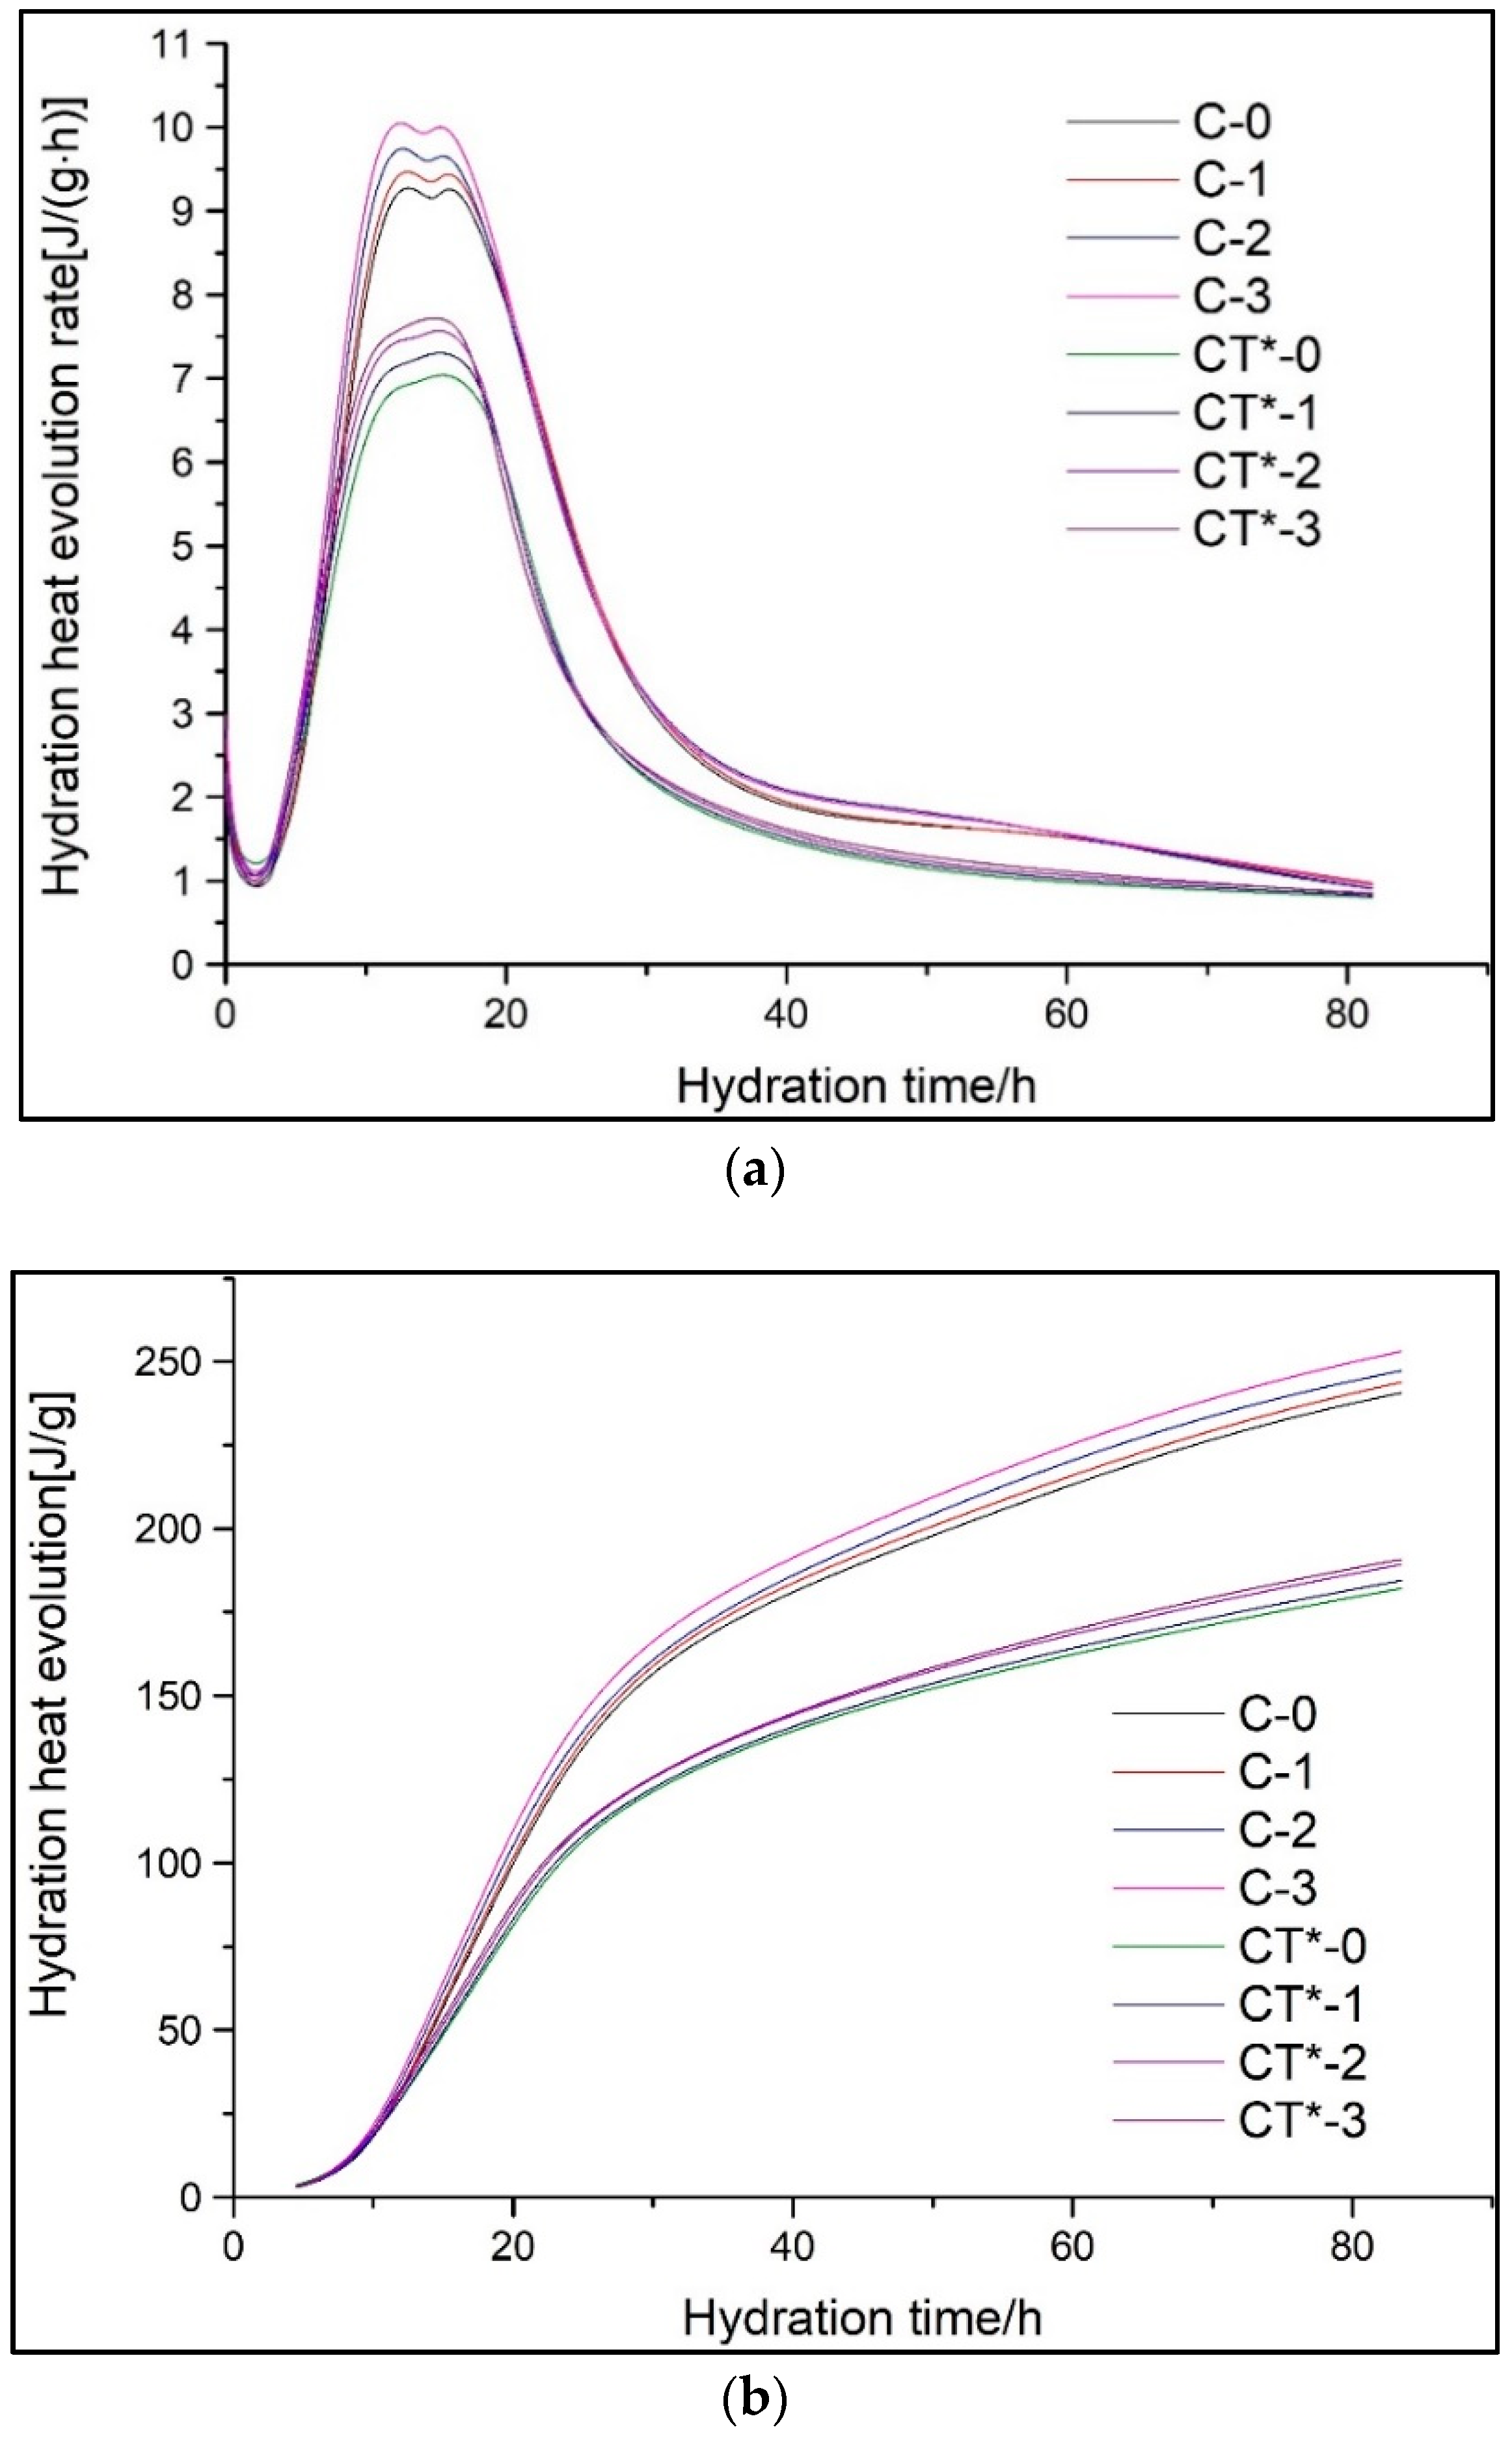
Based on the total hydration emission
and the rate of hydration evolution d
Q/d
t obtained by isothermal conduction calorimetry, the hydration degree
α and hydration rate d
α/d
t required for the kinetic simulation of hydration process are determined by the following equations [
26]:
where this newly defined
Q(
t) is the heat released from the end of the induction period. Due to the fact that the dissolution progress is so fast that it is not always possible to be detected. Meanwhile, the induction period is also thought to make a small contribution to the total heat. Therefore, this simulation is conducted from the beginning of the second peak, namely the ending of the induction period [
27];
Qmax is the total hydration heat when the reaction has completely finished and is obtained by using the Knudsen extrapolation Equation (9) to linearly fit the hydration heat evolution curves [
28]: where
t50 is the time required for half of
Qmax.
3.2.2. Hydration Process Simulation of CTs
In order to obtain the hydration kinetic equations of CTs, the
Qmax and hydration degree
α(
t) is determined by Equations (7) and (9), respectively and successively at first, as shown in
Figure 8. Then, the kinetic parameters
and
n during the nucleation and crystal growth (NG) process could be calculated by substituting
α(
t) into Equation (1) and linearly fitting the double logarithmic curve of
, as shown in
Figure 9.
for I process and
for the D process can also be derived by plugging
α(
t) into Equations (2) and (3) and fitting the double logarithmic curve
linearly. Finally, the hydration kinetic expressions,
,
and
characterizing the hydration rate of the NG, I, and D processes as a function of the hydration degree
α, are acquired. The relationships of
,
,
and
with
are also shown in
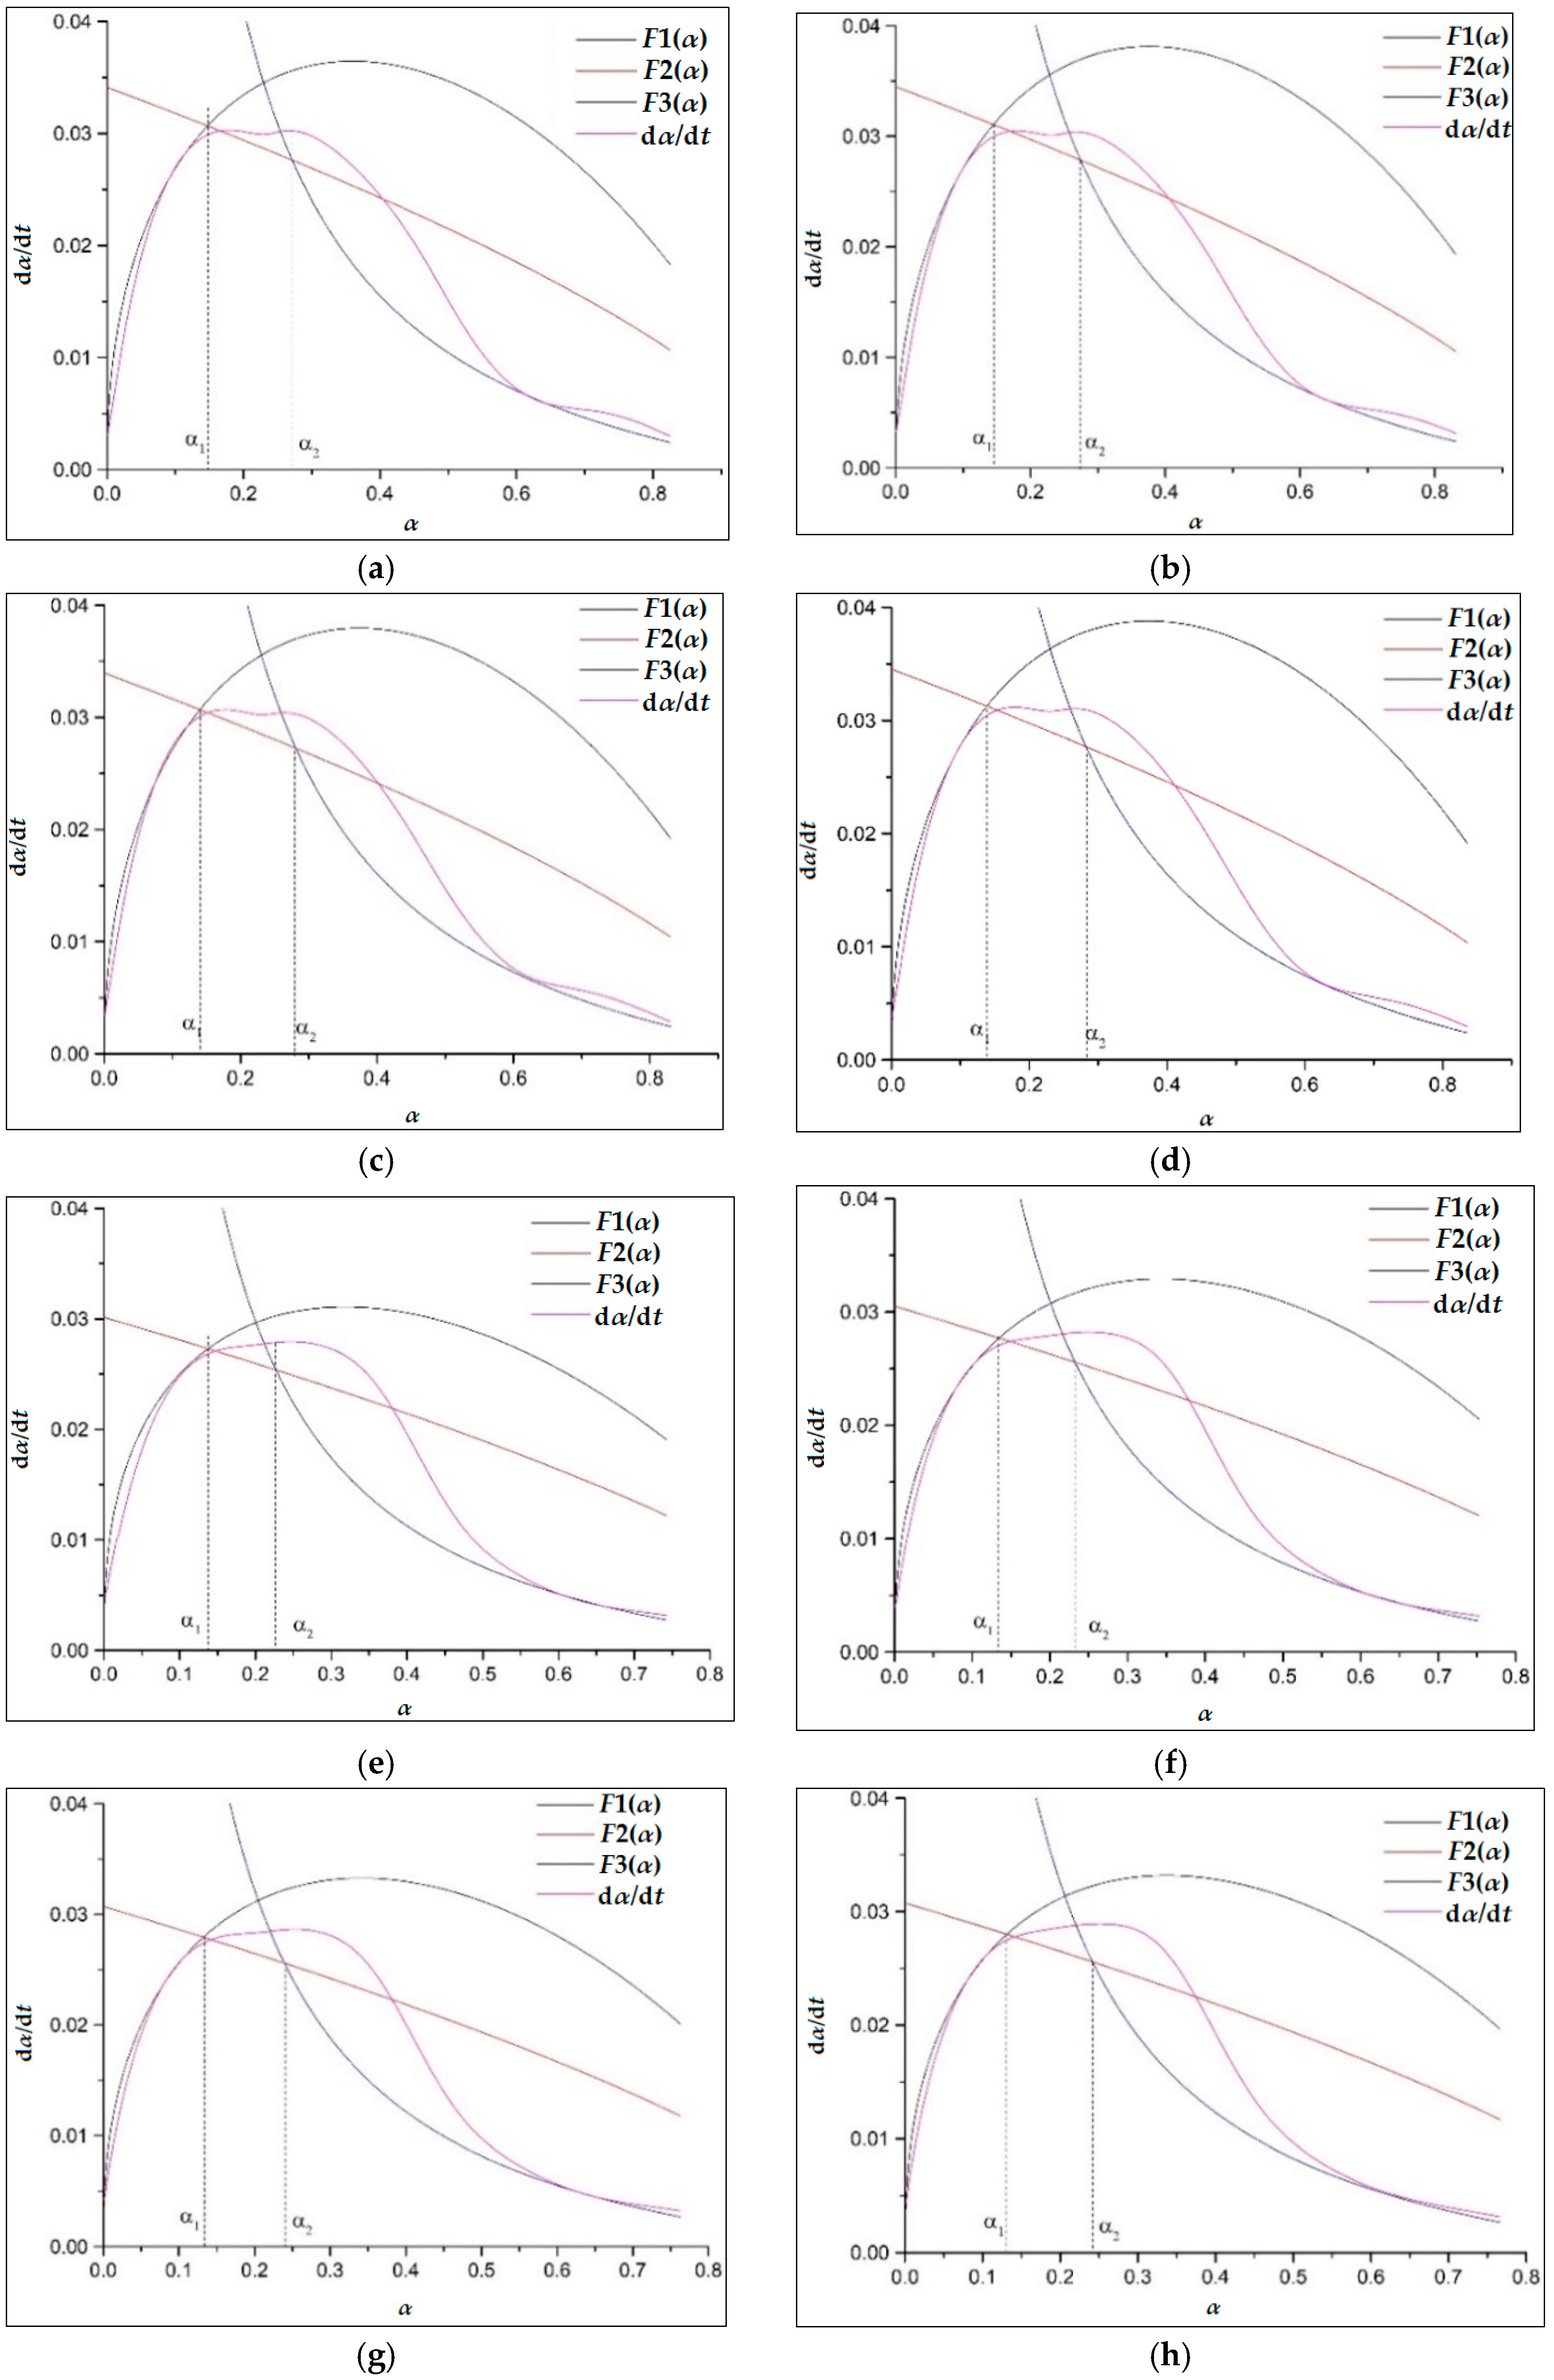
Figure 10. The intersection point
is the turning point from NG to I, and
is the turning points from I to D.
From
Figure 10, it can be seen that the practical hydration curves of
can be segmentally simulated by the theoretical curves, i.e.,
,
, and
. It means that the hydration kinetic model could basically simulate the hydration process of all samples and the hydration undergoes three processes, namely NG, I, and D, in order. The hydration of the composite system is controlled by multiple reaction mechanisms instead of a single one.
Cement reacts with water primarily, and Ca(OH)
2 becomes supersaturated in a few minutes and then the hydrates grow from a fixed number of nuclei [
29]. For the cement–CT binder, CT particles can also serve as nucleation sites for hydrates in addition to cement grains. After that, the hydration products grow rapidly on the limited number of nuclei [
30,
31]. As a result, the NG process dominates the hydration process. Owing to the continued replenishment of Ca
2+ dissolved from unhydrated particles to supply the hydration reaction, the supersaturation state of Ca
2+ remains constant. The reaction mainly occurs at the boundary between the solid hydrates and the liquids. At that time, the phase-boundary-controlled I process plays the leading role [
32]. As the hydration process continues, the hydration products increase. In the meantime, a large amount of water is consumed. The ability of water and ions to reach the surface of the unhydrated particles through the hydrated layer also becomes difficult. Therefore, the diffusion process, D, becomes the dominant process.
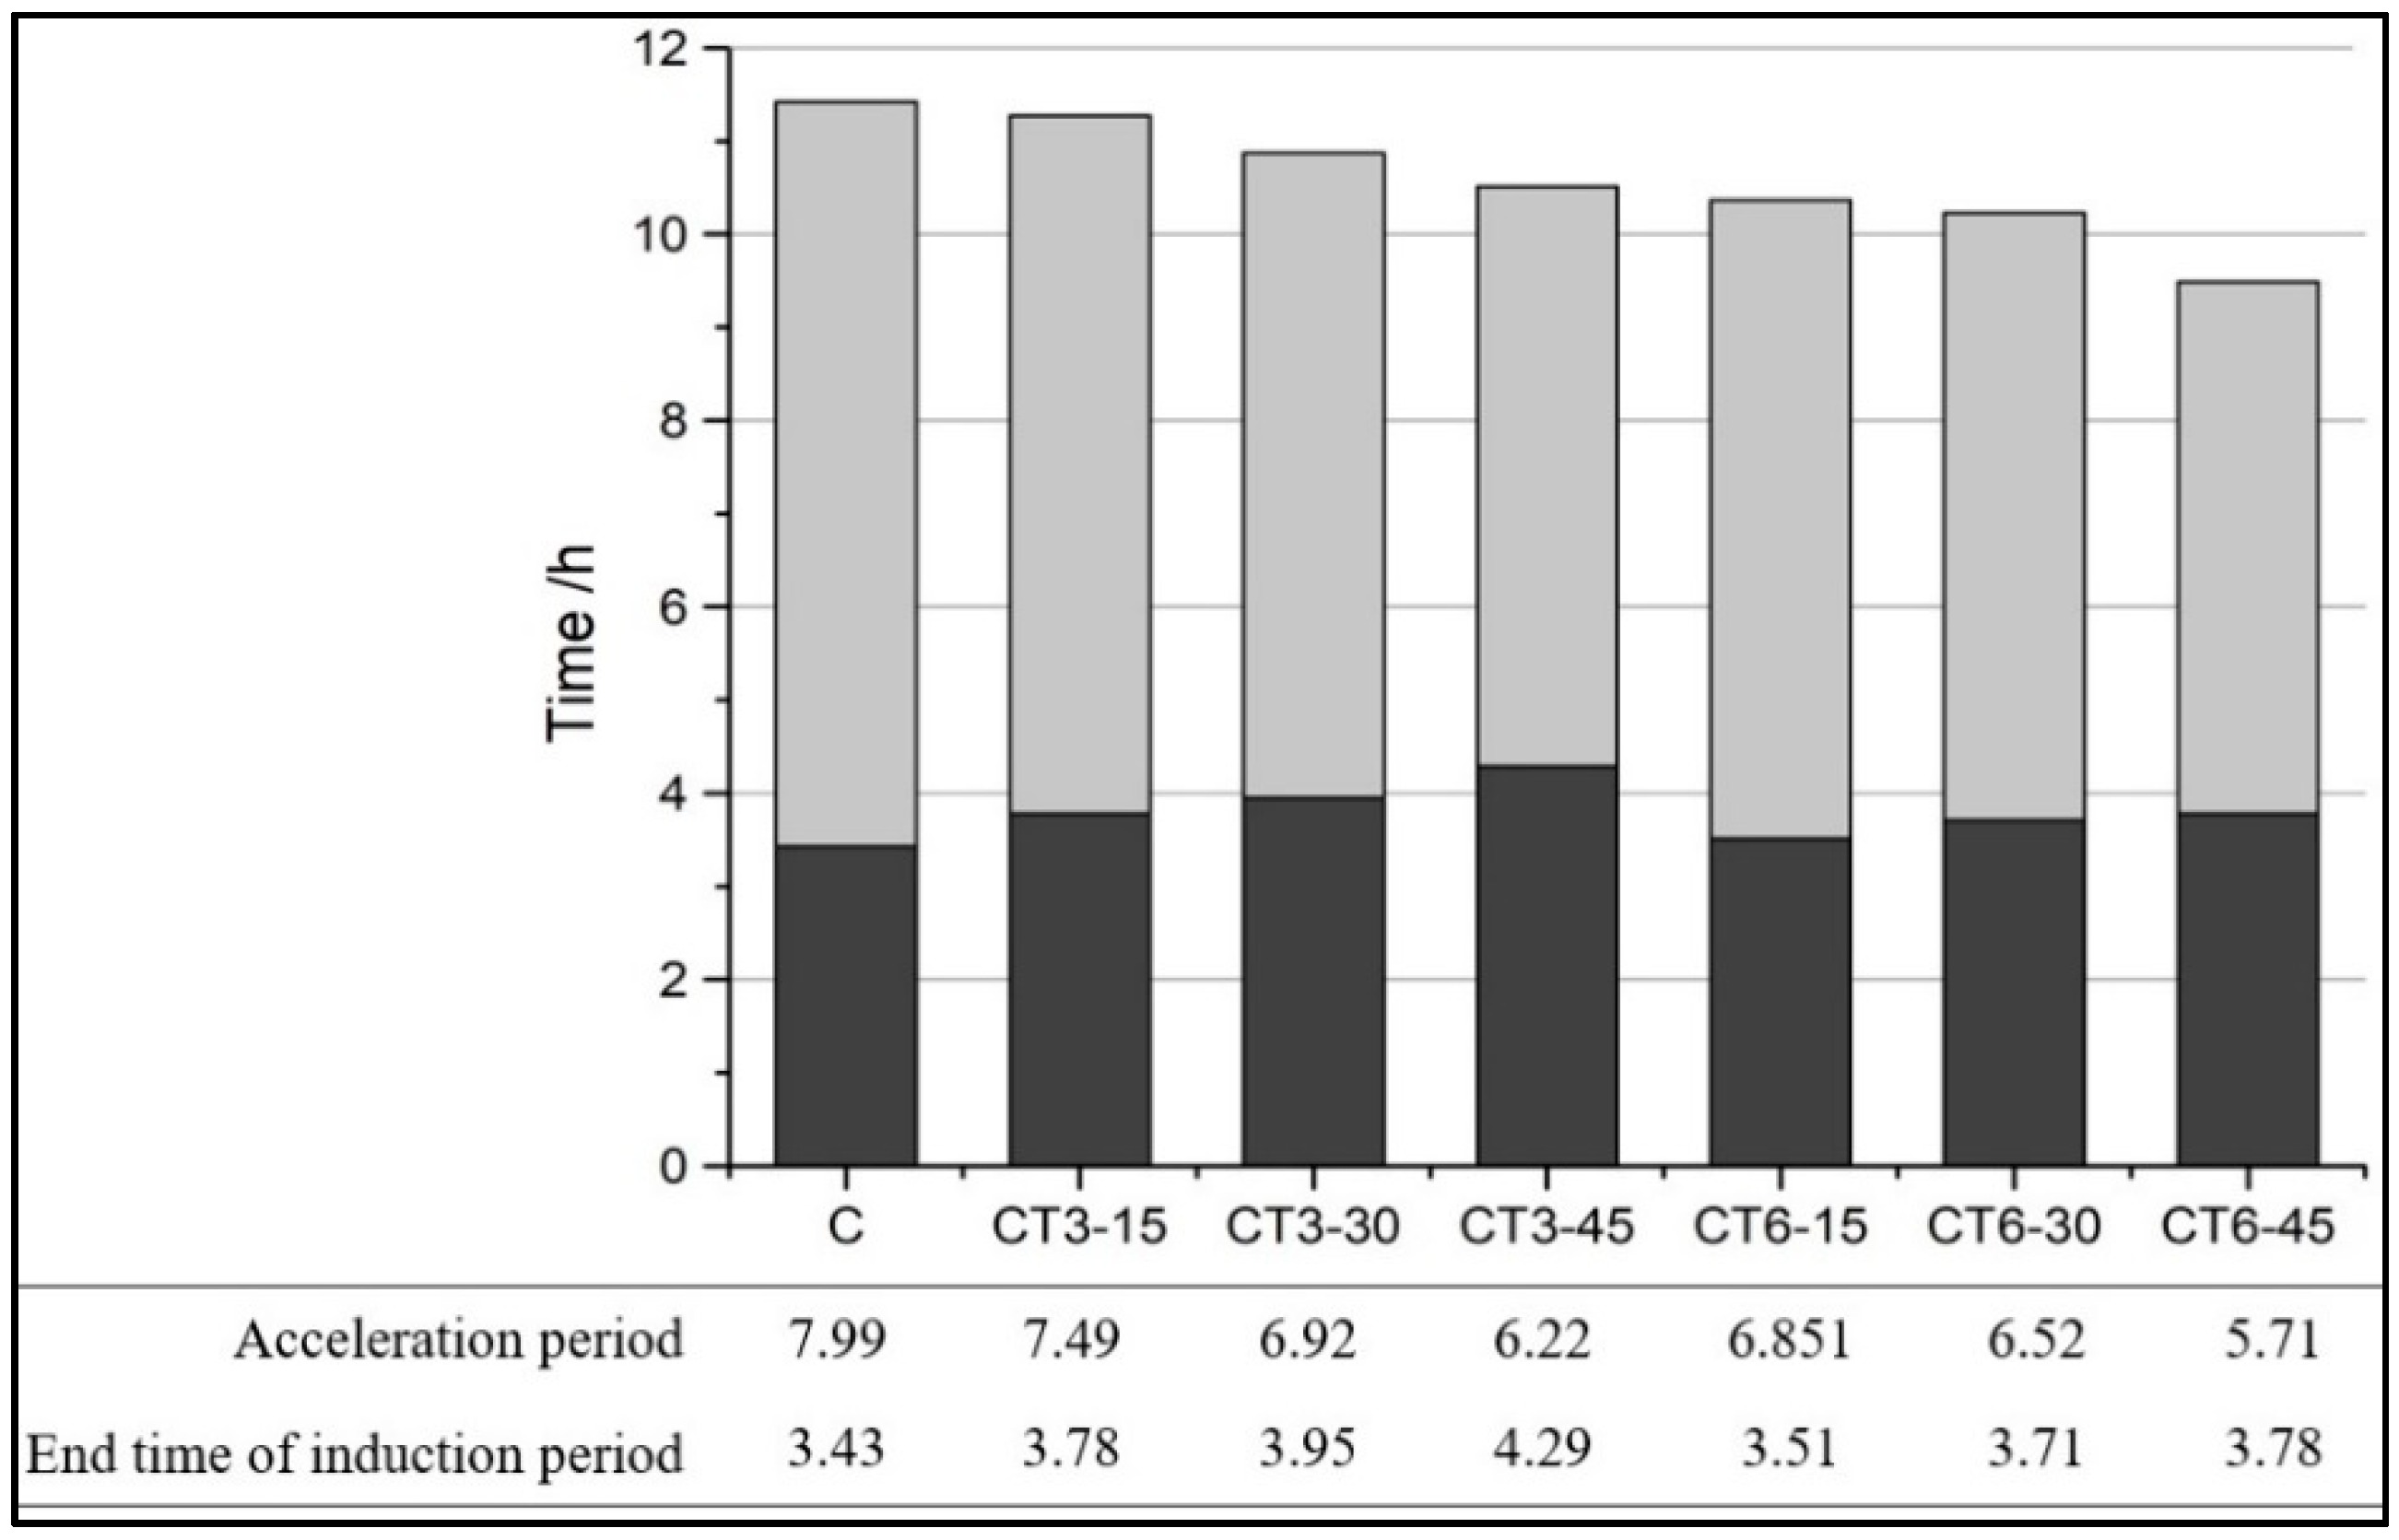
The kinetic parameters of the hydration process of sample CTs are listed in
Table 5. The value of reaction order
n reduces with the increase of CT dosage while improving with the increase of CT fineness, which indicates that high fineness may affect the crystal growth geometry. The rate of chemical reaction during the NG process is very fast. The rate of the NG process is about 4–5 times the rate of the I process, and about 20 times the rate of the D process. The hydration reaction during the NG process is an autocatalytic reaction. The continuous growth of the crystal nucleus leads to the increase of their boundaries, which in turn accelerates the hydration reaction of the NG process. Therefore, the hydration reaction during the NG process is fairly fast. However, the hydration reaction during the I process is mainly controlled by the ion concentration, crystal area, and growth space for hydrates. In comparison with the NG process, a lot of reactants and water are consumed and a large amount of hydration products are formed during the I process, leading to the ion concentration to decline and the growth space for hydration products to narrow. Thus, the hydration rate of the I process is much lower than that of the NG process. With the development of hydration, the hydration reaction proceeds to the D process. During this process, massive dense C-S-H is formed due to the hydration of cement and the pozzolanic reaction of CT, which wraps on the surface of unreacted particles and makes the ion immobility difficult. As a result, the hydration rate during the D process is even lower than that during the I process.
As shown in
Table 5,
decreases with the increase of CT dosage, implying that CT affects the nucleation and growth of hydrates. During the NG process, the reaction amount of CT is usually considered negligible because of its low pozzolanic activity [
32]. With the increase of CT content, the cement dosage decreases, leading to the decrease of the pH value and the solubility of amorphous silicon as well as the growth rate of the crystal nucleus. Therefore, the growth rate during the NG process reduces with the increase of CT content. For the I process, the trend of the hydration rate,
, is consistent with that of
. The reaction rate of CT is much lower than that of cement. The amount of CT accounts for a large proportion of the increase in CT content, which leads to the reduction of the
value. For the D process, a similar trend of
is observed. A large amount of hydration products have been formed and the reaction becomes stable at this stage. On the one hand, the higher the content of cement is, the more intense the preceding hydration reaction and the denser the hydration products will be; therefore, the more difficult the ion mobility will be. Thus, the hydration reaction of the D process is weakened. On the other hand, a higher content of cement will greatly strengthen the overall hydration reaction of the cementitious system. When the positive effect leading to the improvement of the cement dosage and decrease of the CT content outweighs the negative, the whole reaction rate during the D process will decrease with the incorporation of CT.
It is also noted that the hydration duration for both the NG process and I process is shortened with the increase of CT content, indicating that the hydration reaction of the composite binder containing CT transforms from the NG to I process and from the I to D process at a lower hydration degree with the increase of CT content. The replacement of cement by CT increases the effective water to cement ratio and provides more space for hydration products during the early hydration stage. Meanwhile, CT with high fineness can also act as nucleation sites for hydration products during the NG process [
19]. Therefore, the controlling effect of the NG and I process is strengthened, which leads to a sharp exothermic rate and narrow hydration duration.
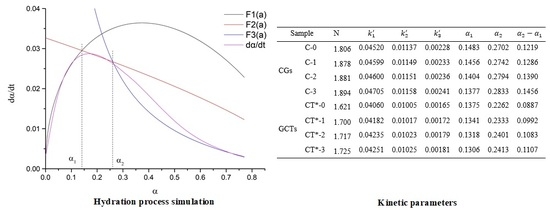
3.2.3. Hydration Process Simulation of Composite Cementitious System Containing GO
Figure 11 shows the simulated and practical hydration exothermic curves of composite cementitious materials containing GO and CT. It is observed that curves,
, and
, simulate the experimental hydration curves well, which validates that the hydration of both the cement-GO system (CGs) and cement-GO-CT system (GCTs) has a complicated process with a multiple reaction mechanism. In particular, the hydration process of CGs and GCTs after the induction period are the NG, I, and D processes in turn. Moreover, the hydration mechanism of the composite systems with GO is similar to that without it (C-0, CT*-0).
The kinetic parameters of the hydration process of composite cementitious materials are given in
Table 6. The duration of the NG process is shortened while the I process is prolonged. For the CG system, the value of
decreases from 0.1483 to 0.1377 while
. increases from 0.2702 to 0.2833 while GO content increases from 0 to 0.03%. With regard to the GCTs system, the value of
decreases from 0.1375 to 0.1306, while
increases from 0.2262 to 0.2413 along with the increase in the GO content from 0 to 0.03%. It illustrates that GO promotes the nucleation and crystal growth process by acting as nucleation sites, and leads to a higher reaction rate but a shorter duration of the NG process. This also be confirmed by the fact that
increases with the GO content. However, the hydration process during the I process is prolonged with the increase of GO dosage. It may be because GO improves the overall quantity of nucleation sites for crystal growth. In this case, the boundaries between the growing crystals and the solutions may also increase, leading to a longer duration to finish the I process. It also can be observed that the values of
and
of GCTs are even less than those of CGs. It is also confirmed that the replacement of CT leads to a short hydration duration.
Overall, based on the data in
Table 5 and
Table 6, the hydration rates,
,
, and
of the three controlling processes of the composite cementitious system decrease with the increase of CT content, but improve slightly with the increase of CT fineness. Although CT exerts an adverse effect on the early hydration, this can be slightly compensated for by the increase of CT fineness and can be overturned by the incorporation of GO. GO evidently accelerates the hydration of composite materials with the fact that
,
, and
gradually increase with GO dosage. Additionally, with the increase of CT dosage as well as its fineness, the NG and I process are gradually shortened. GO enhances the controlling effect of the NG process of the cementitious systems with or without CT, thus promoting the early hydration.


