A New Method for Estimating the Clamping Force of Shrink Sleeve Labels


Abstract
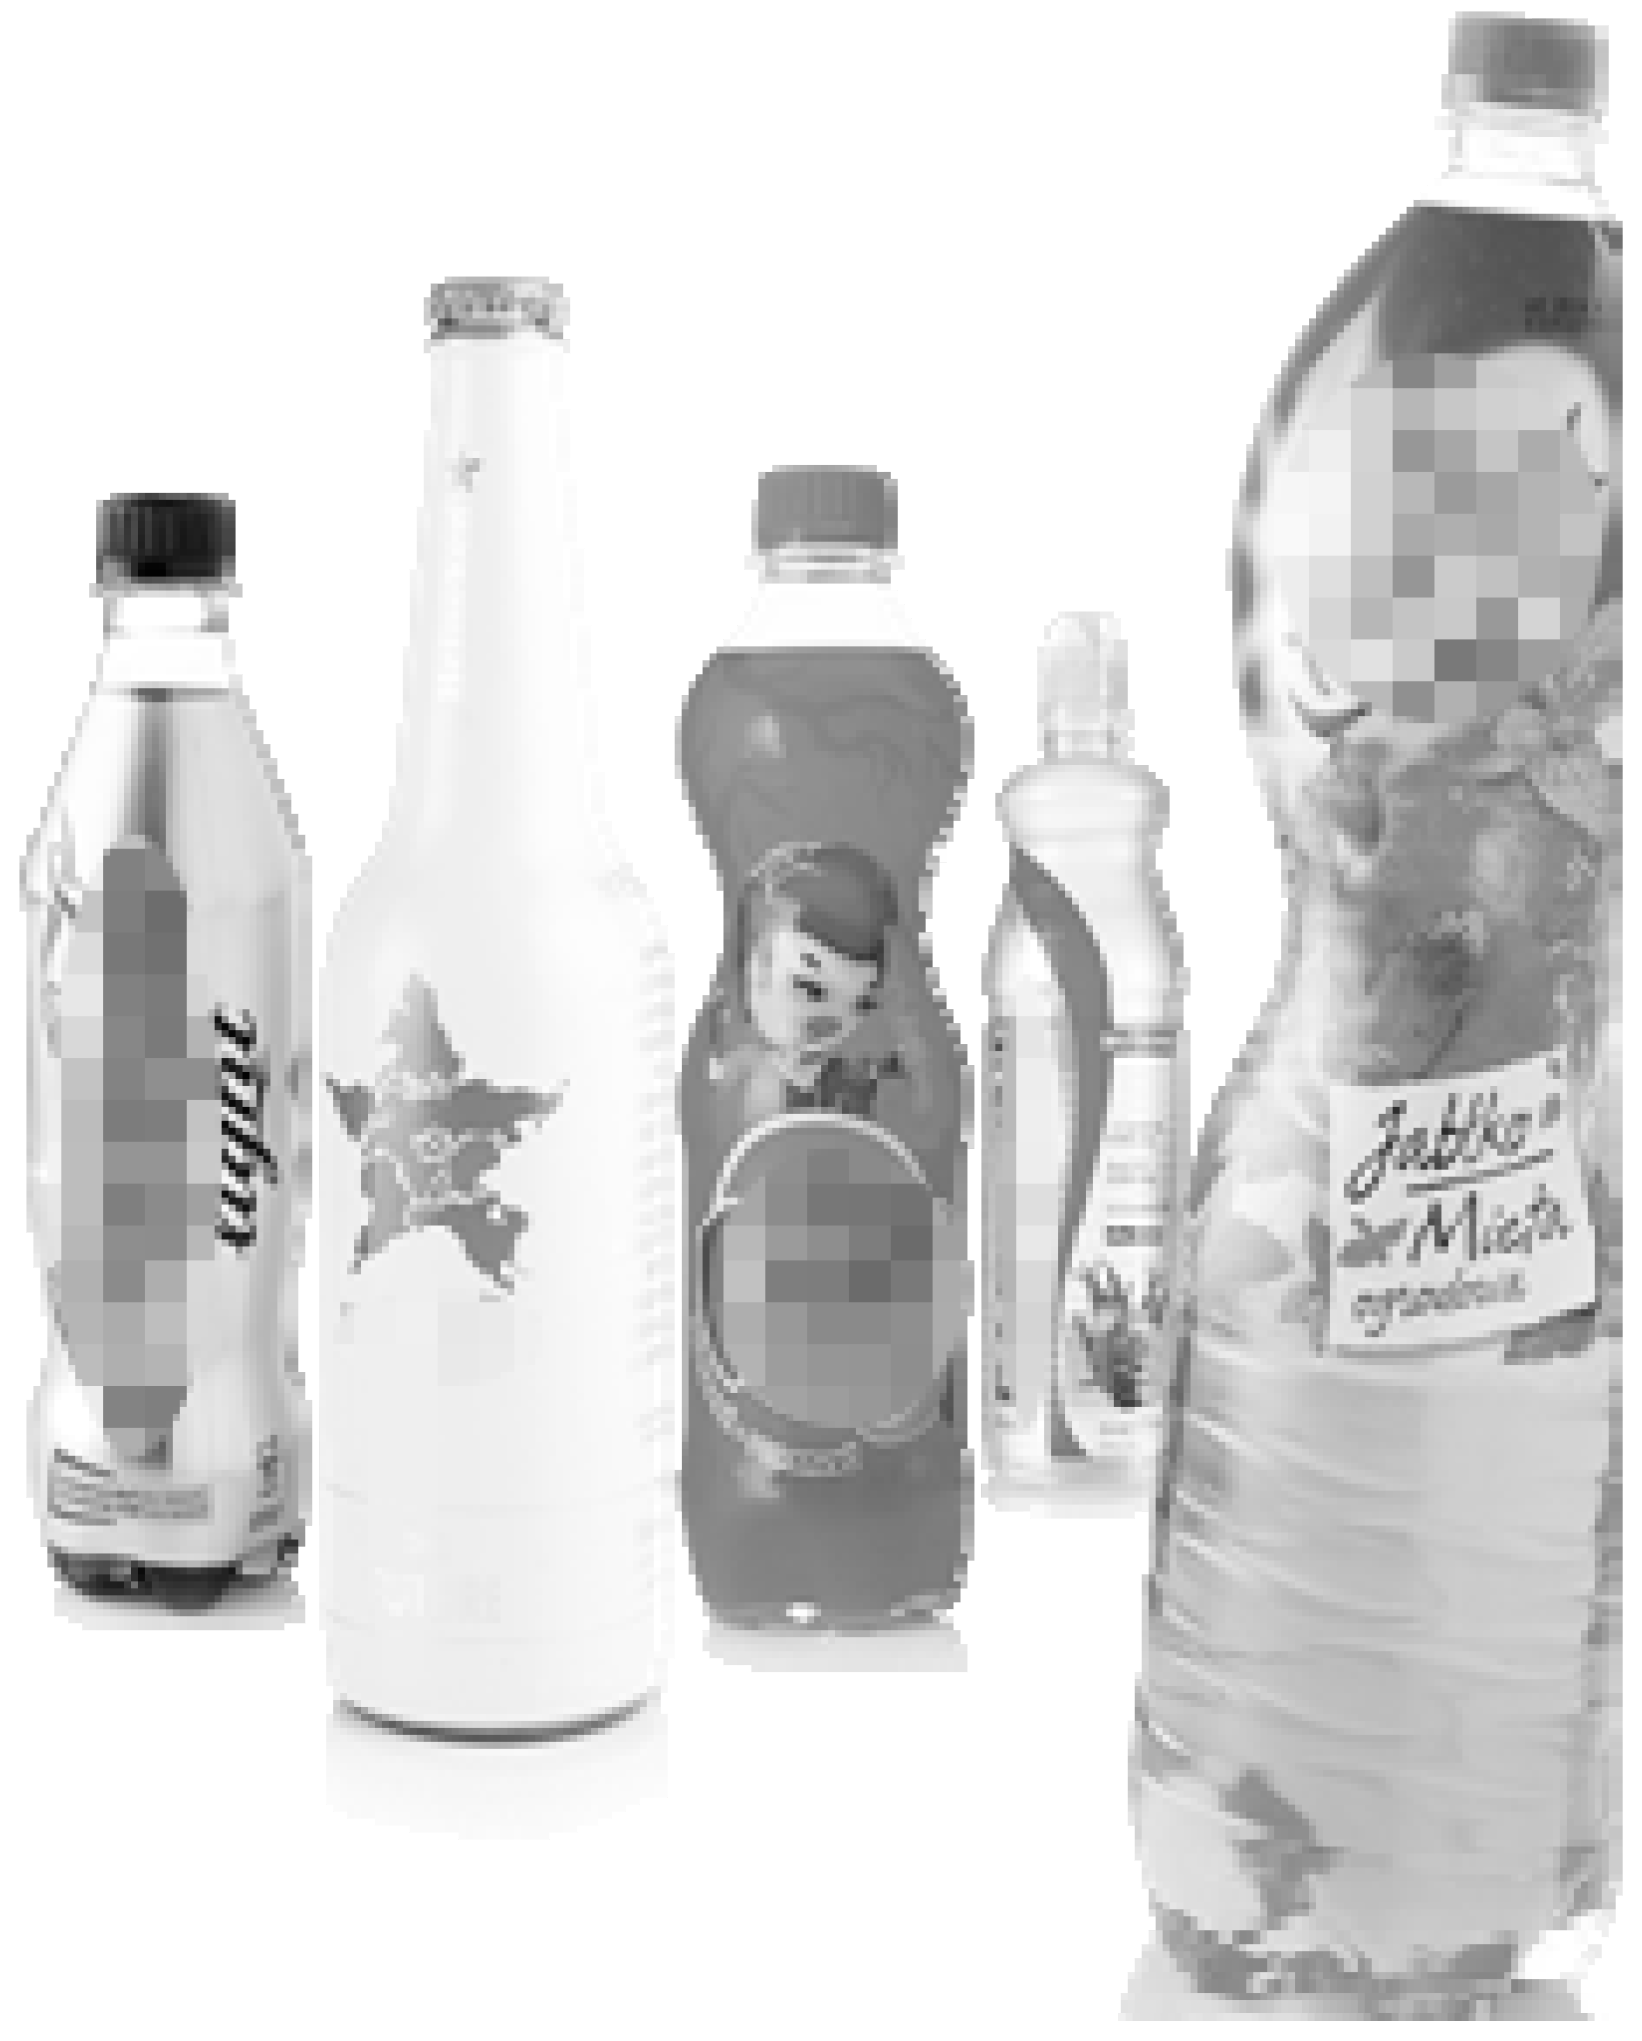
:1. Introduction
- excellent visual effects;
- greater design options when compared to traditional printing methods;
- the possibility of covering the entire surface of containers even with complicated, unusual shapes, for which it would be difficult to adapt self-adhesive labels;
- saving costs compared to using many labels on the container;
- additional benefits resulting from the possibility of securing the entire container;
- the possibility of printing also on the inner part of the sleeve;
- ensuring complete resistance to abrasion of prints by printing the inside of the sleeve;
- increasing the brands’ impact through excellent presentation at sales points;
- ideal properties to adapt to marketing campaigns, such as so-called multipacks;
- possibility of making perforations, breakable parts, coupons, etc.;
- cost-effective low-volume printing in flexographic technology.
2. Materials and Methods
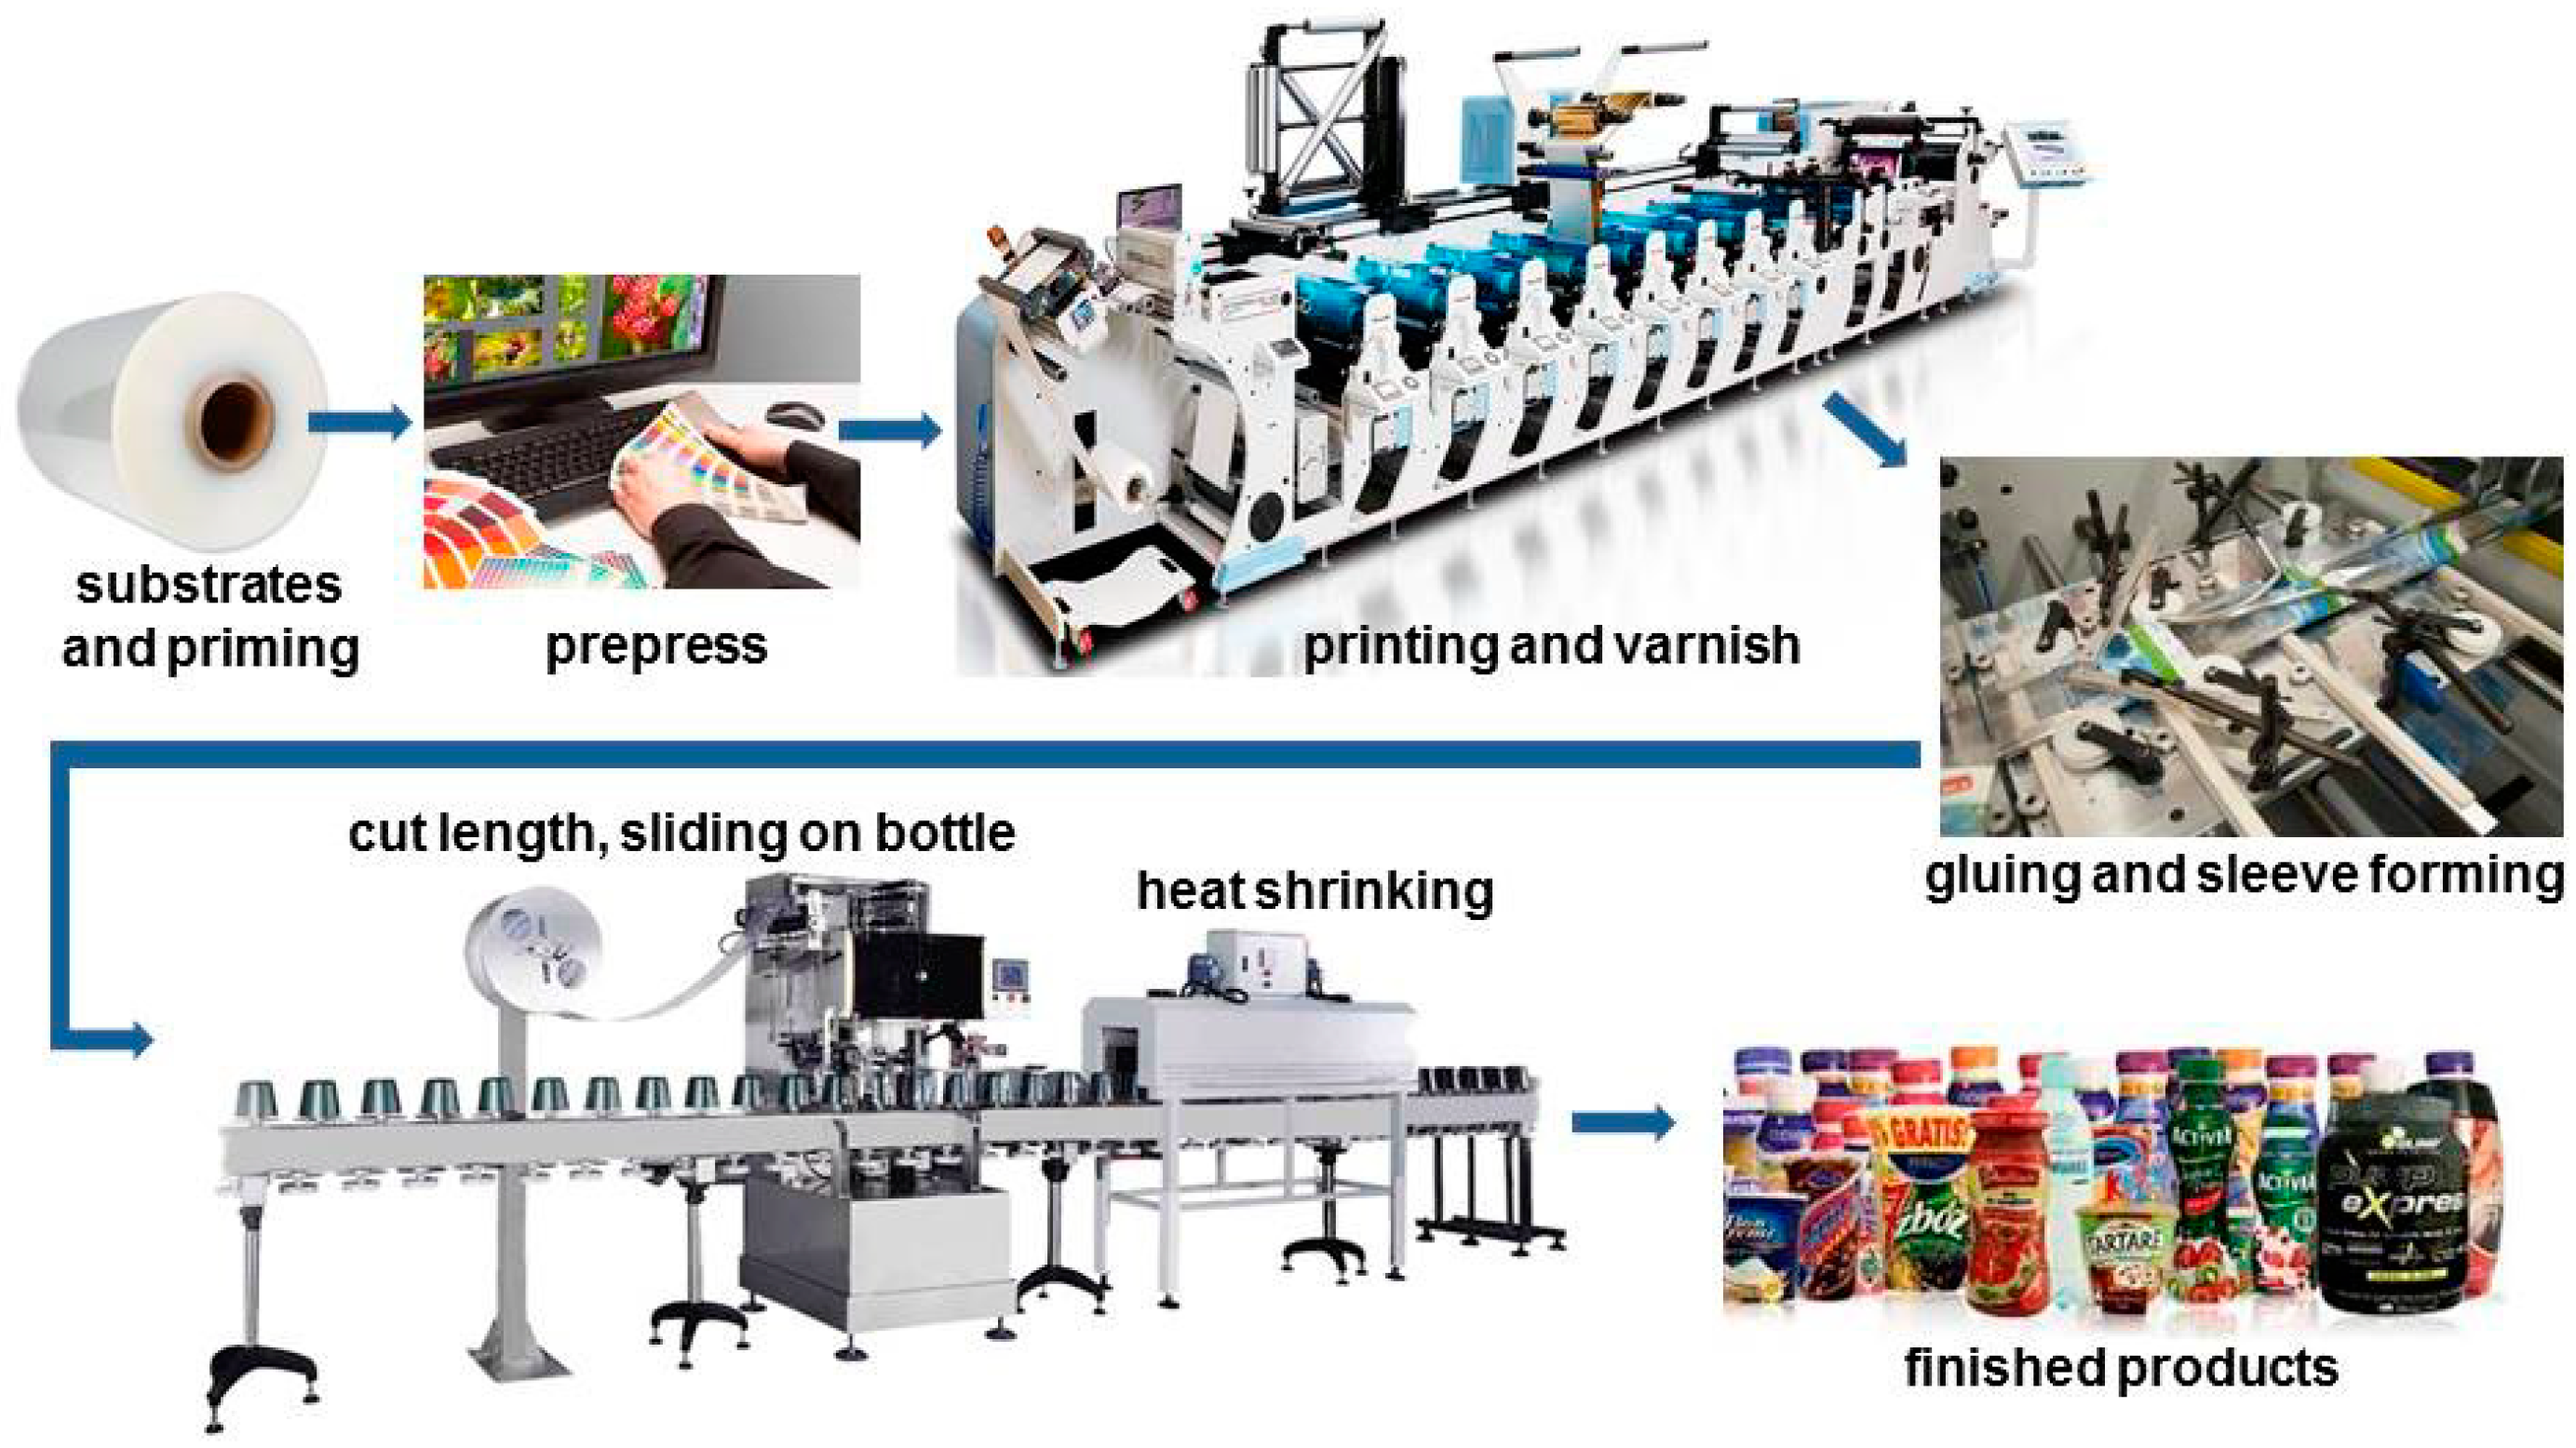
2.1. Production Process of a Heat-Shrink Label
- low price and availability worldwide;
- high gloss and transparency;
- high strength and elasticity—the shape of the packaged products do not warp and provides good formability;
- high shrinkage at low temperatures in a wide range of shrinkage ratios;
- cold resistance, making it suitable for labeling products stored at low temperatures.
2.2. Measurement Method
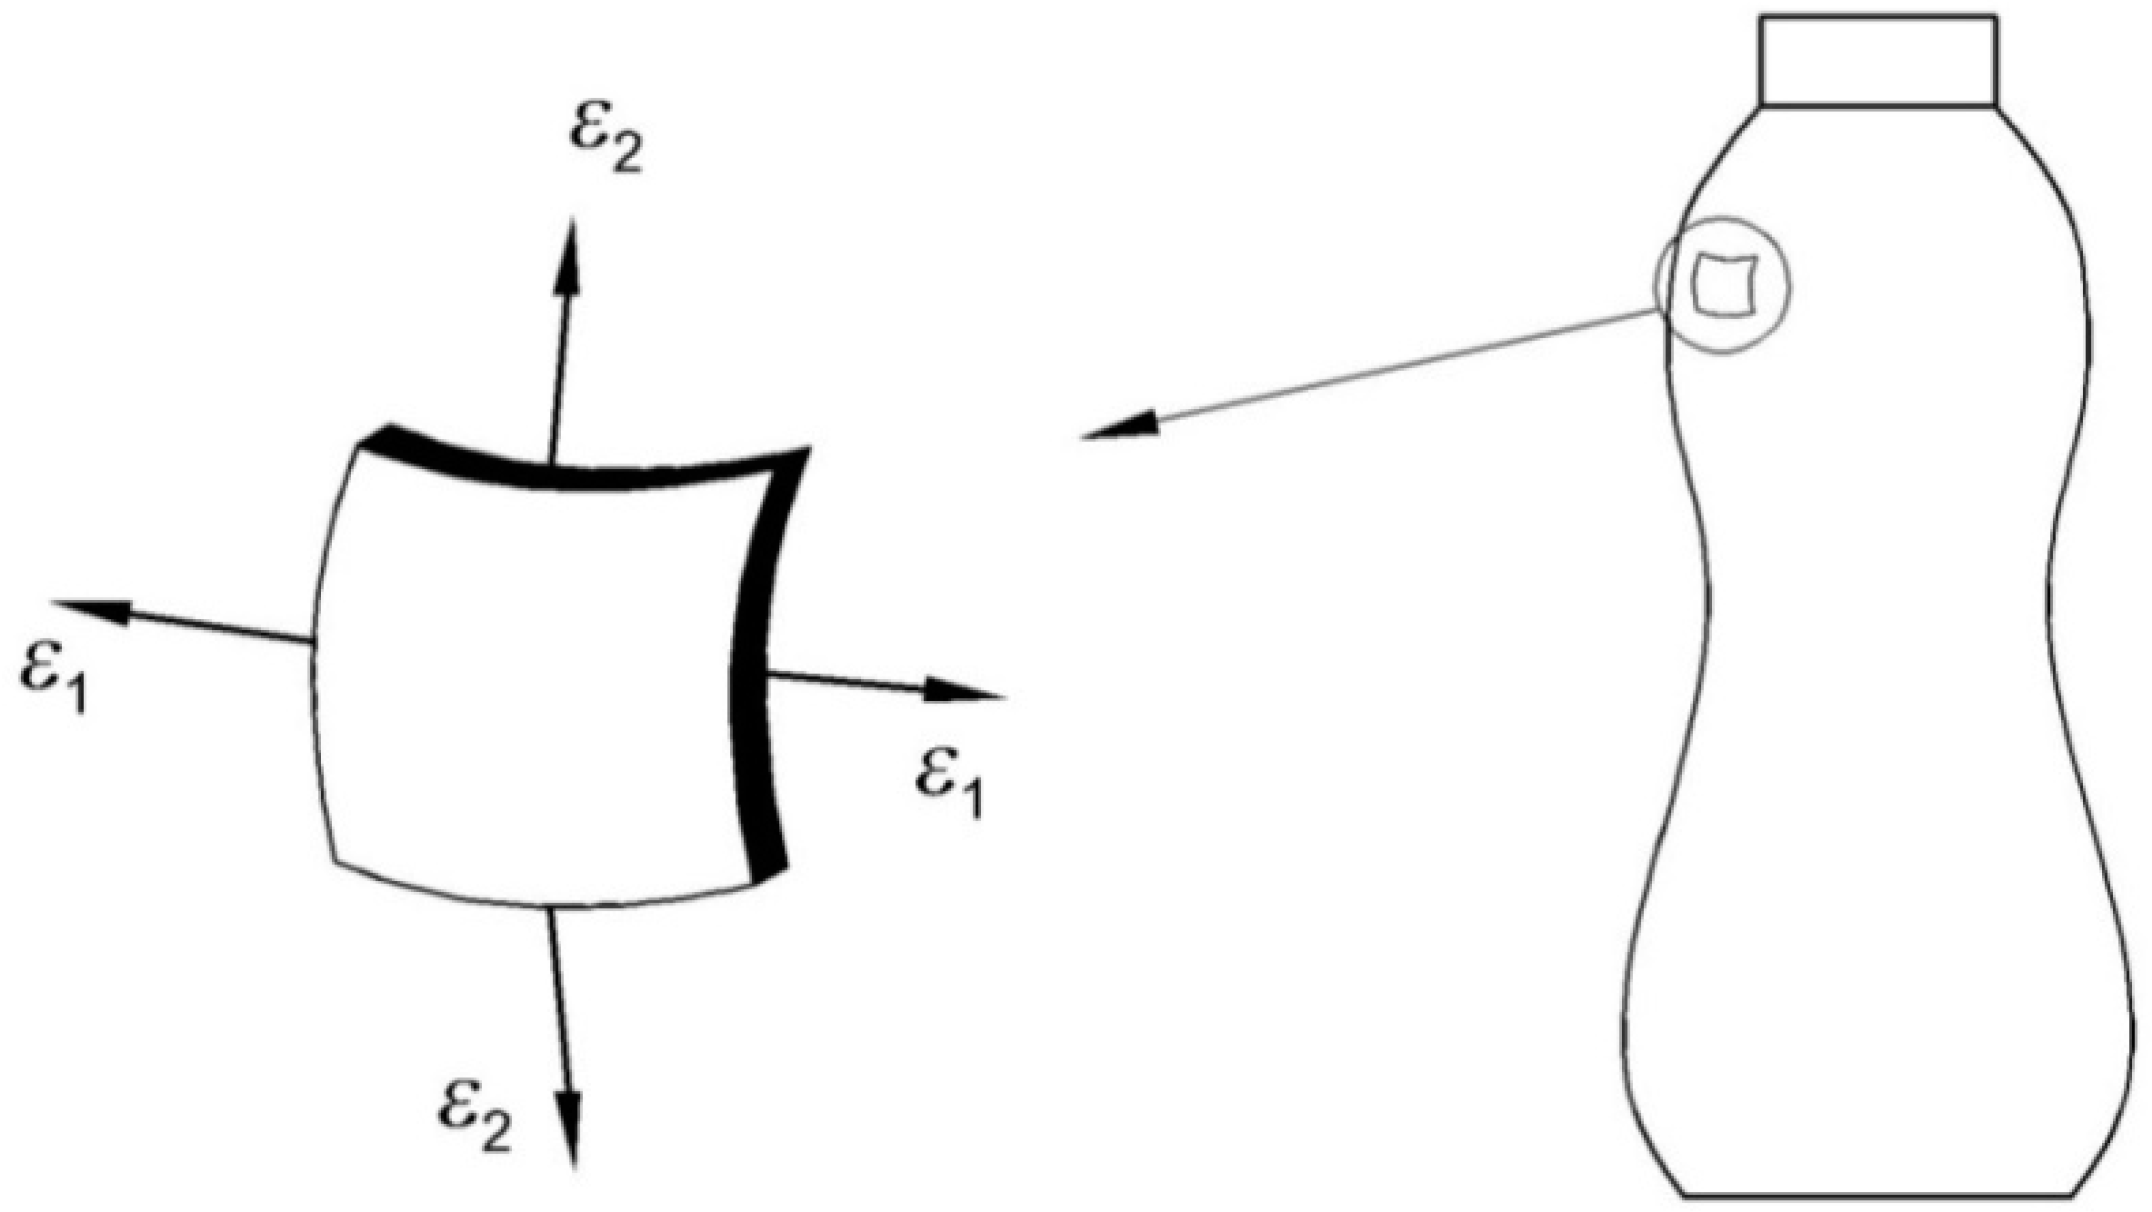
2.2.1. Axially Symmetrical Thin-Walled Vessels
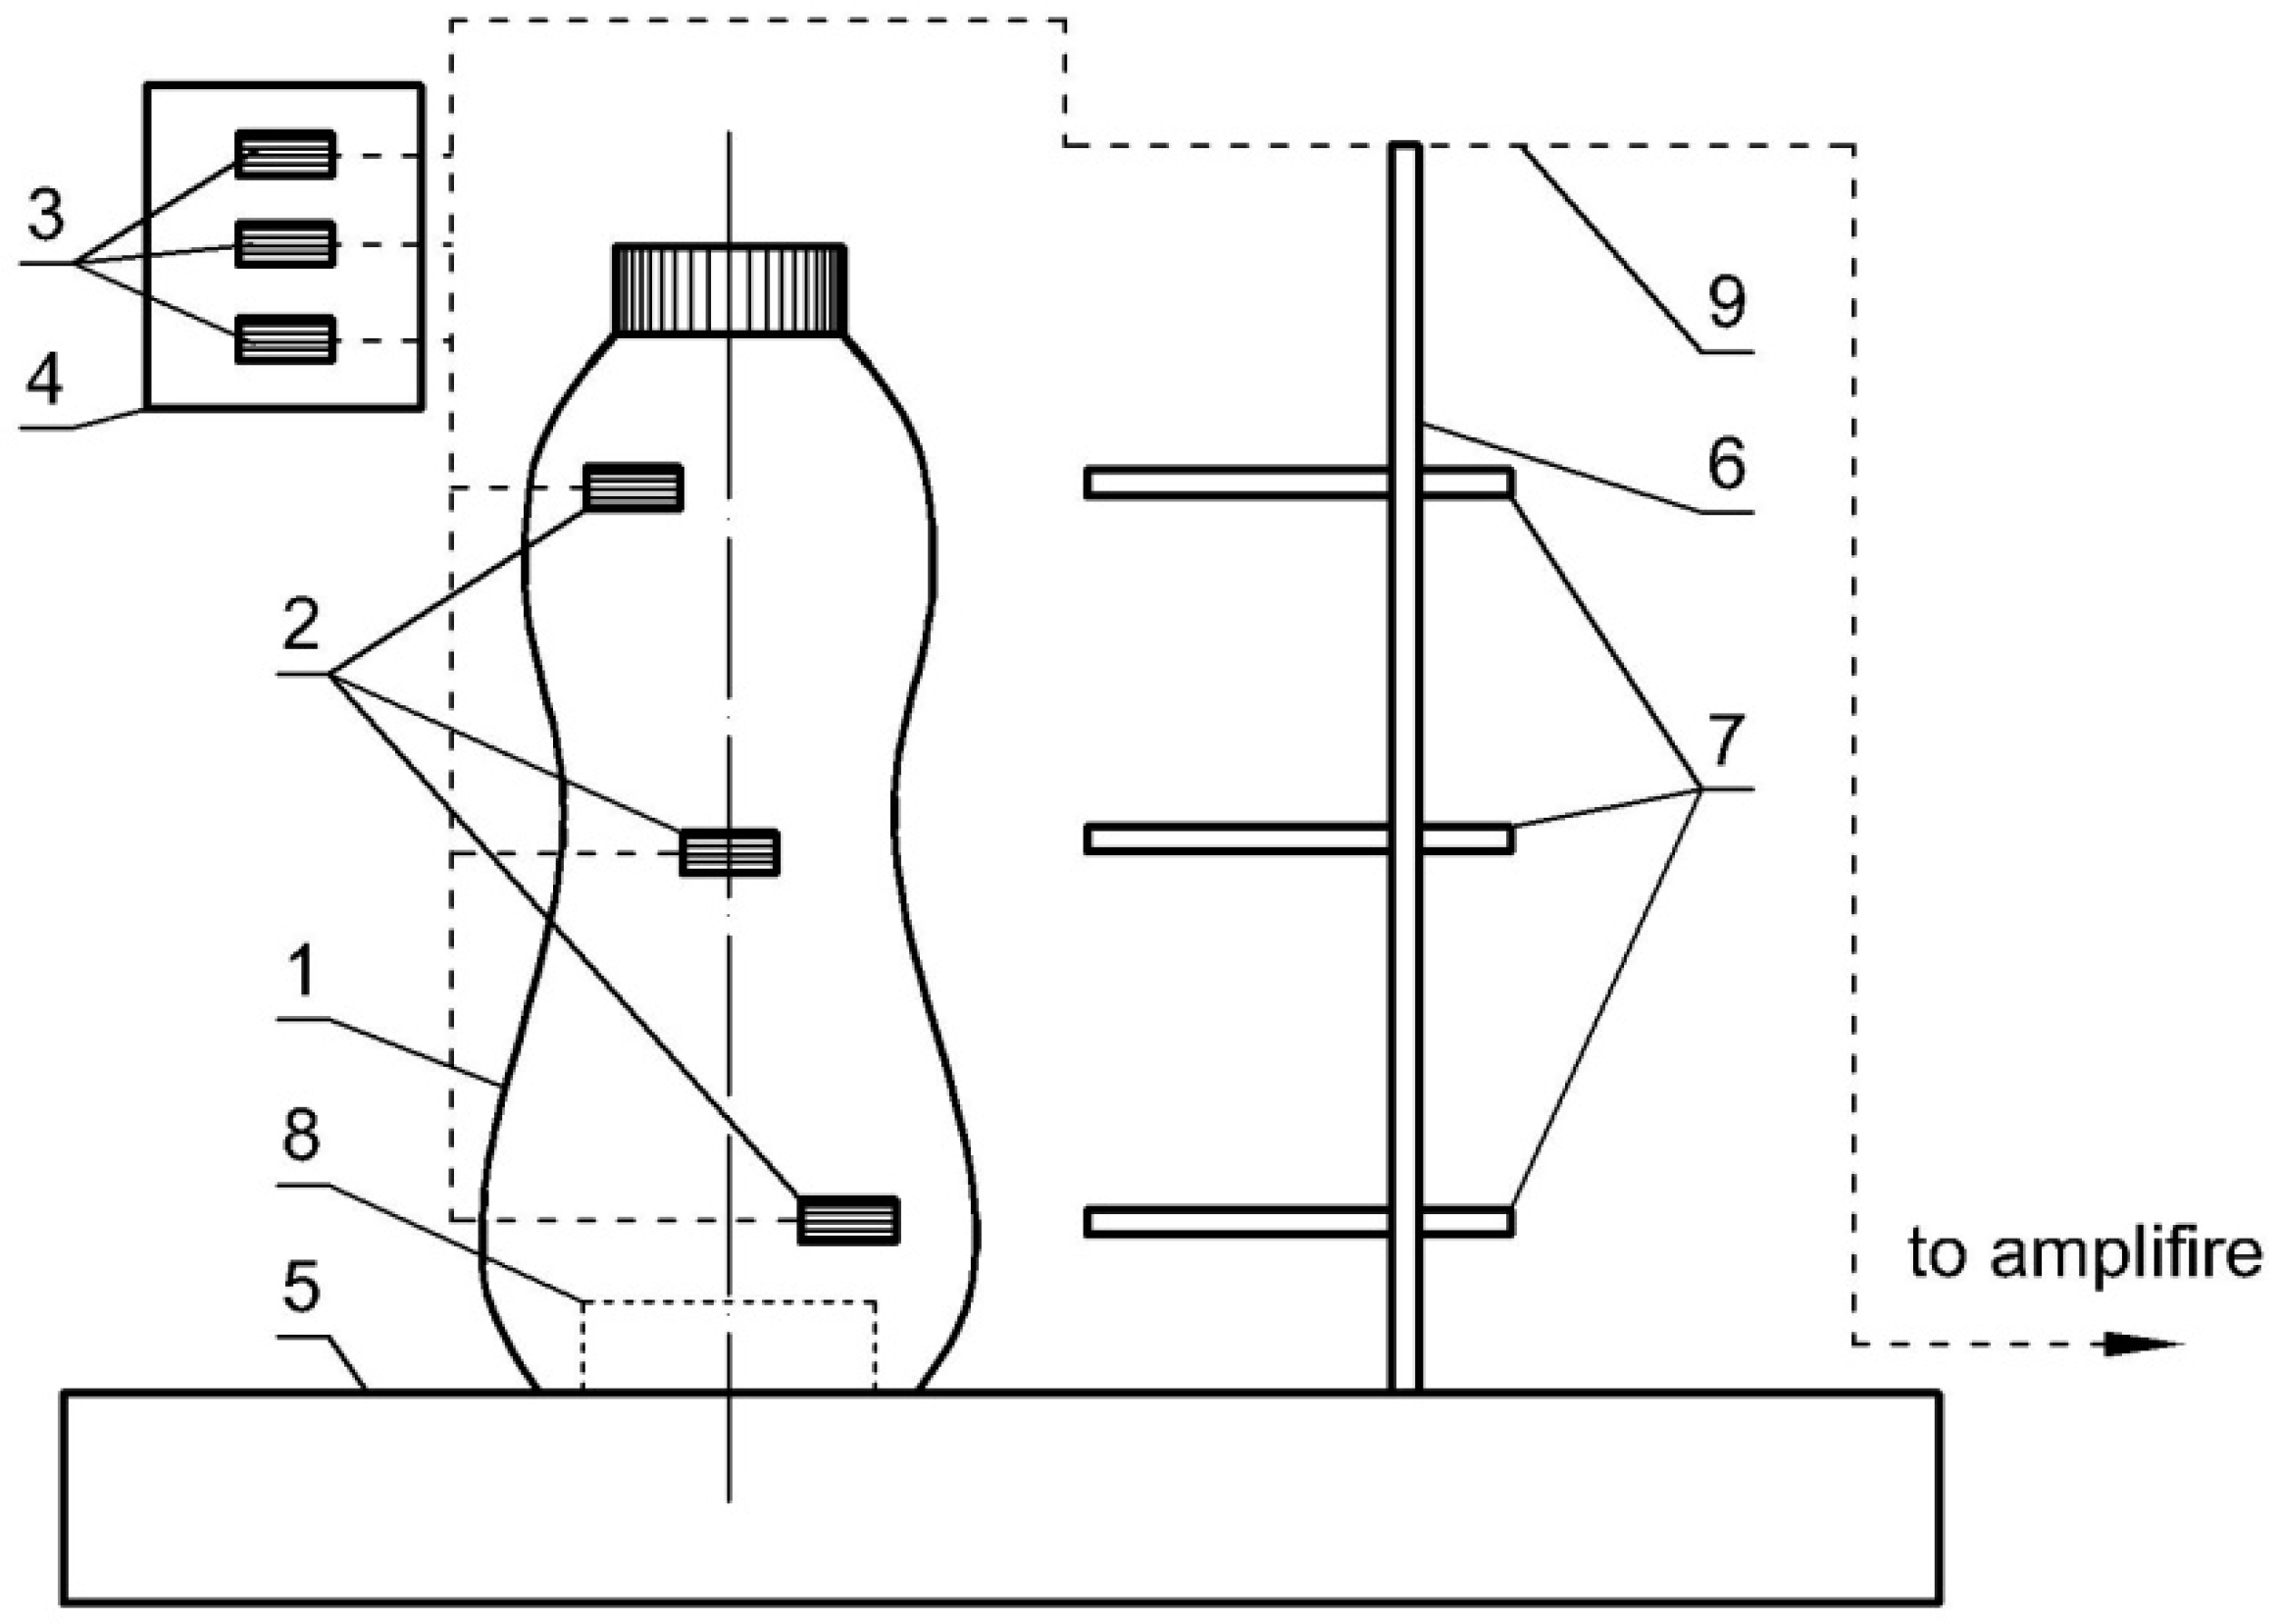
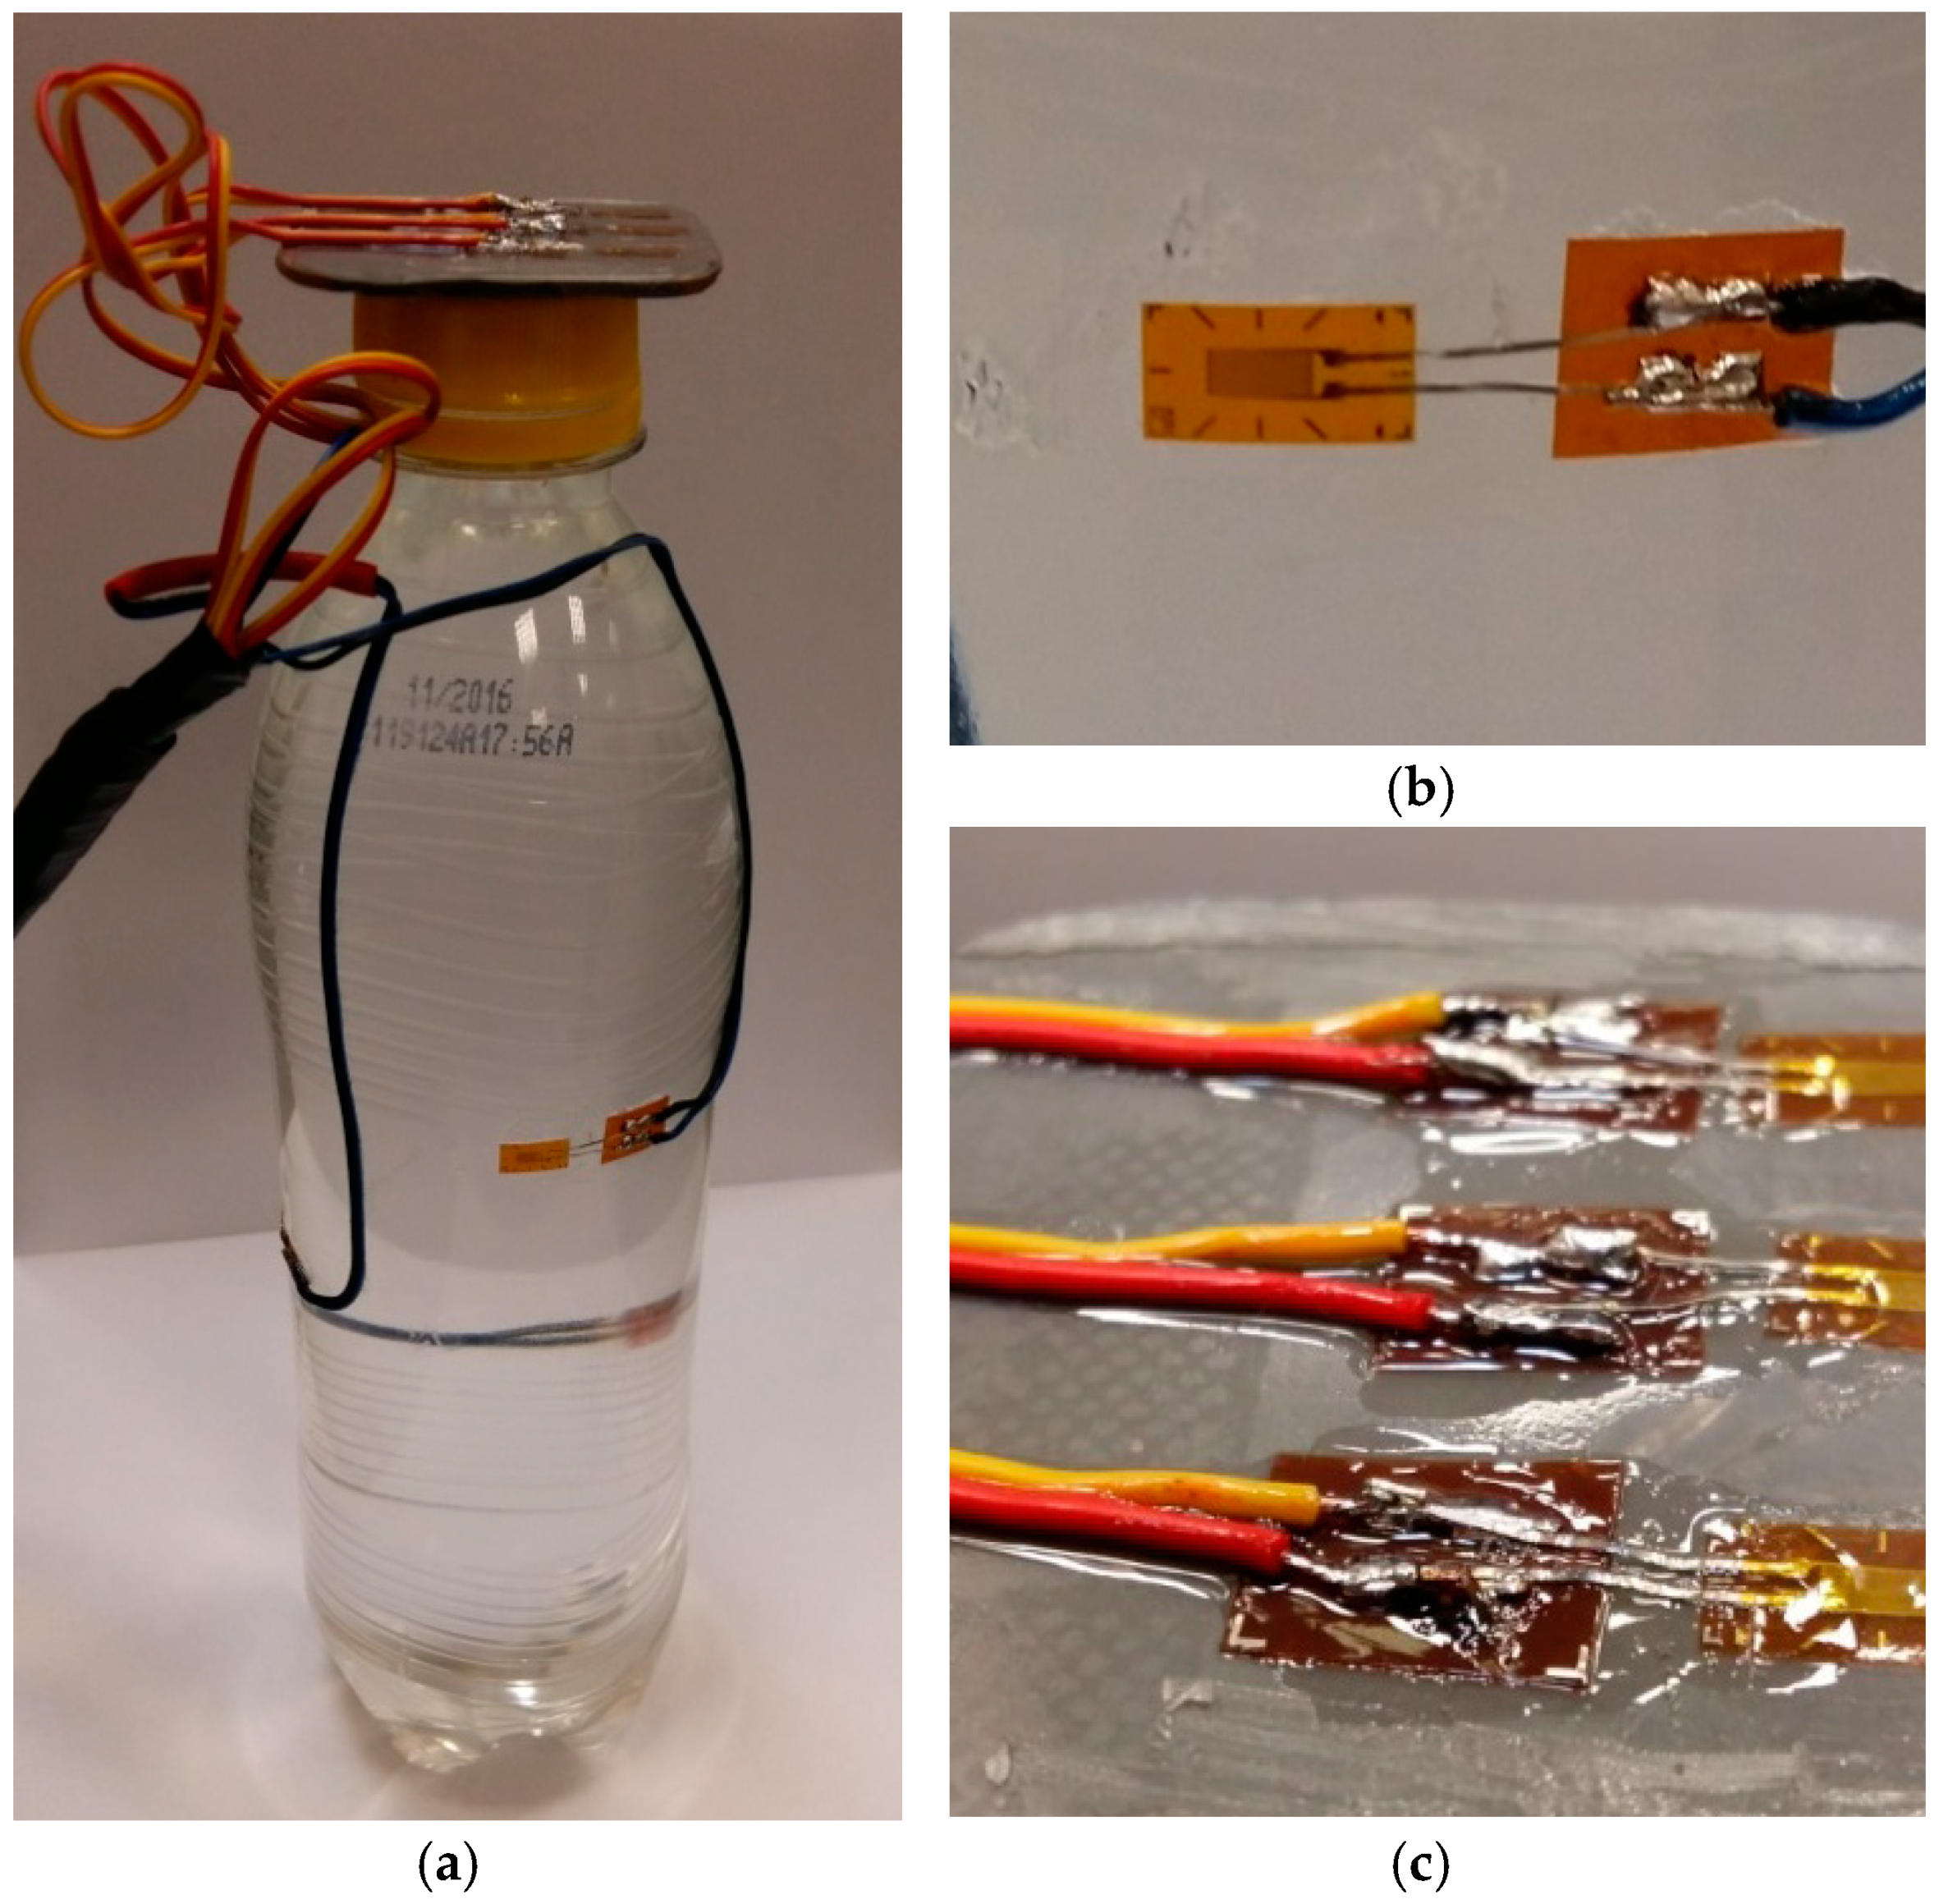
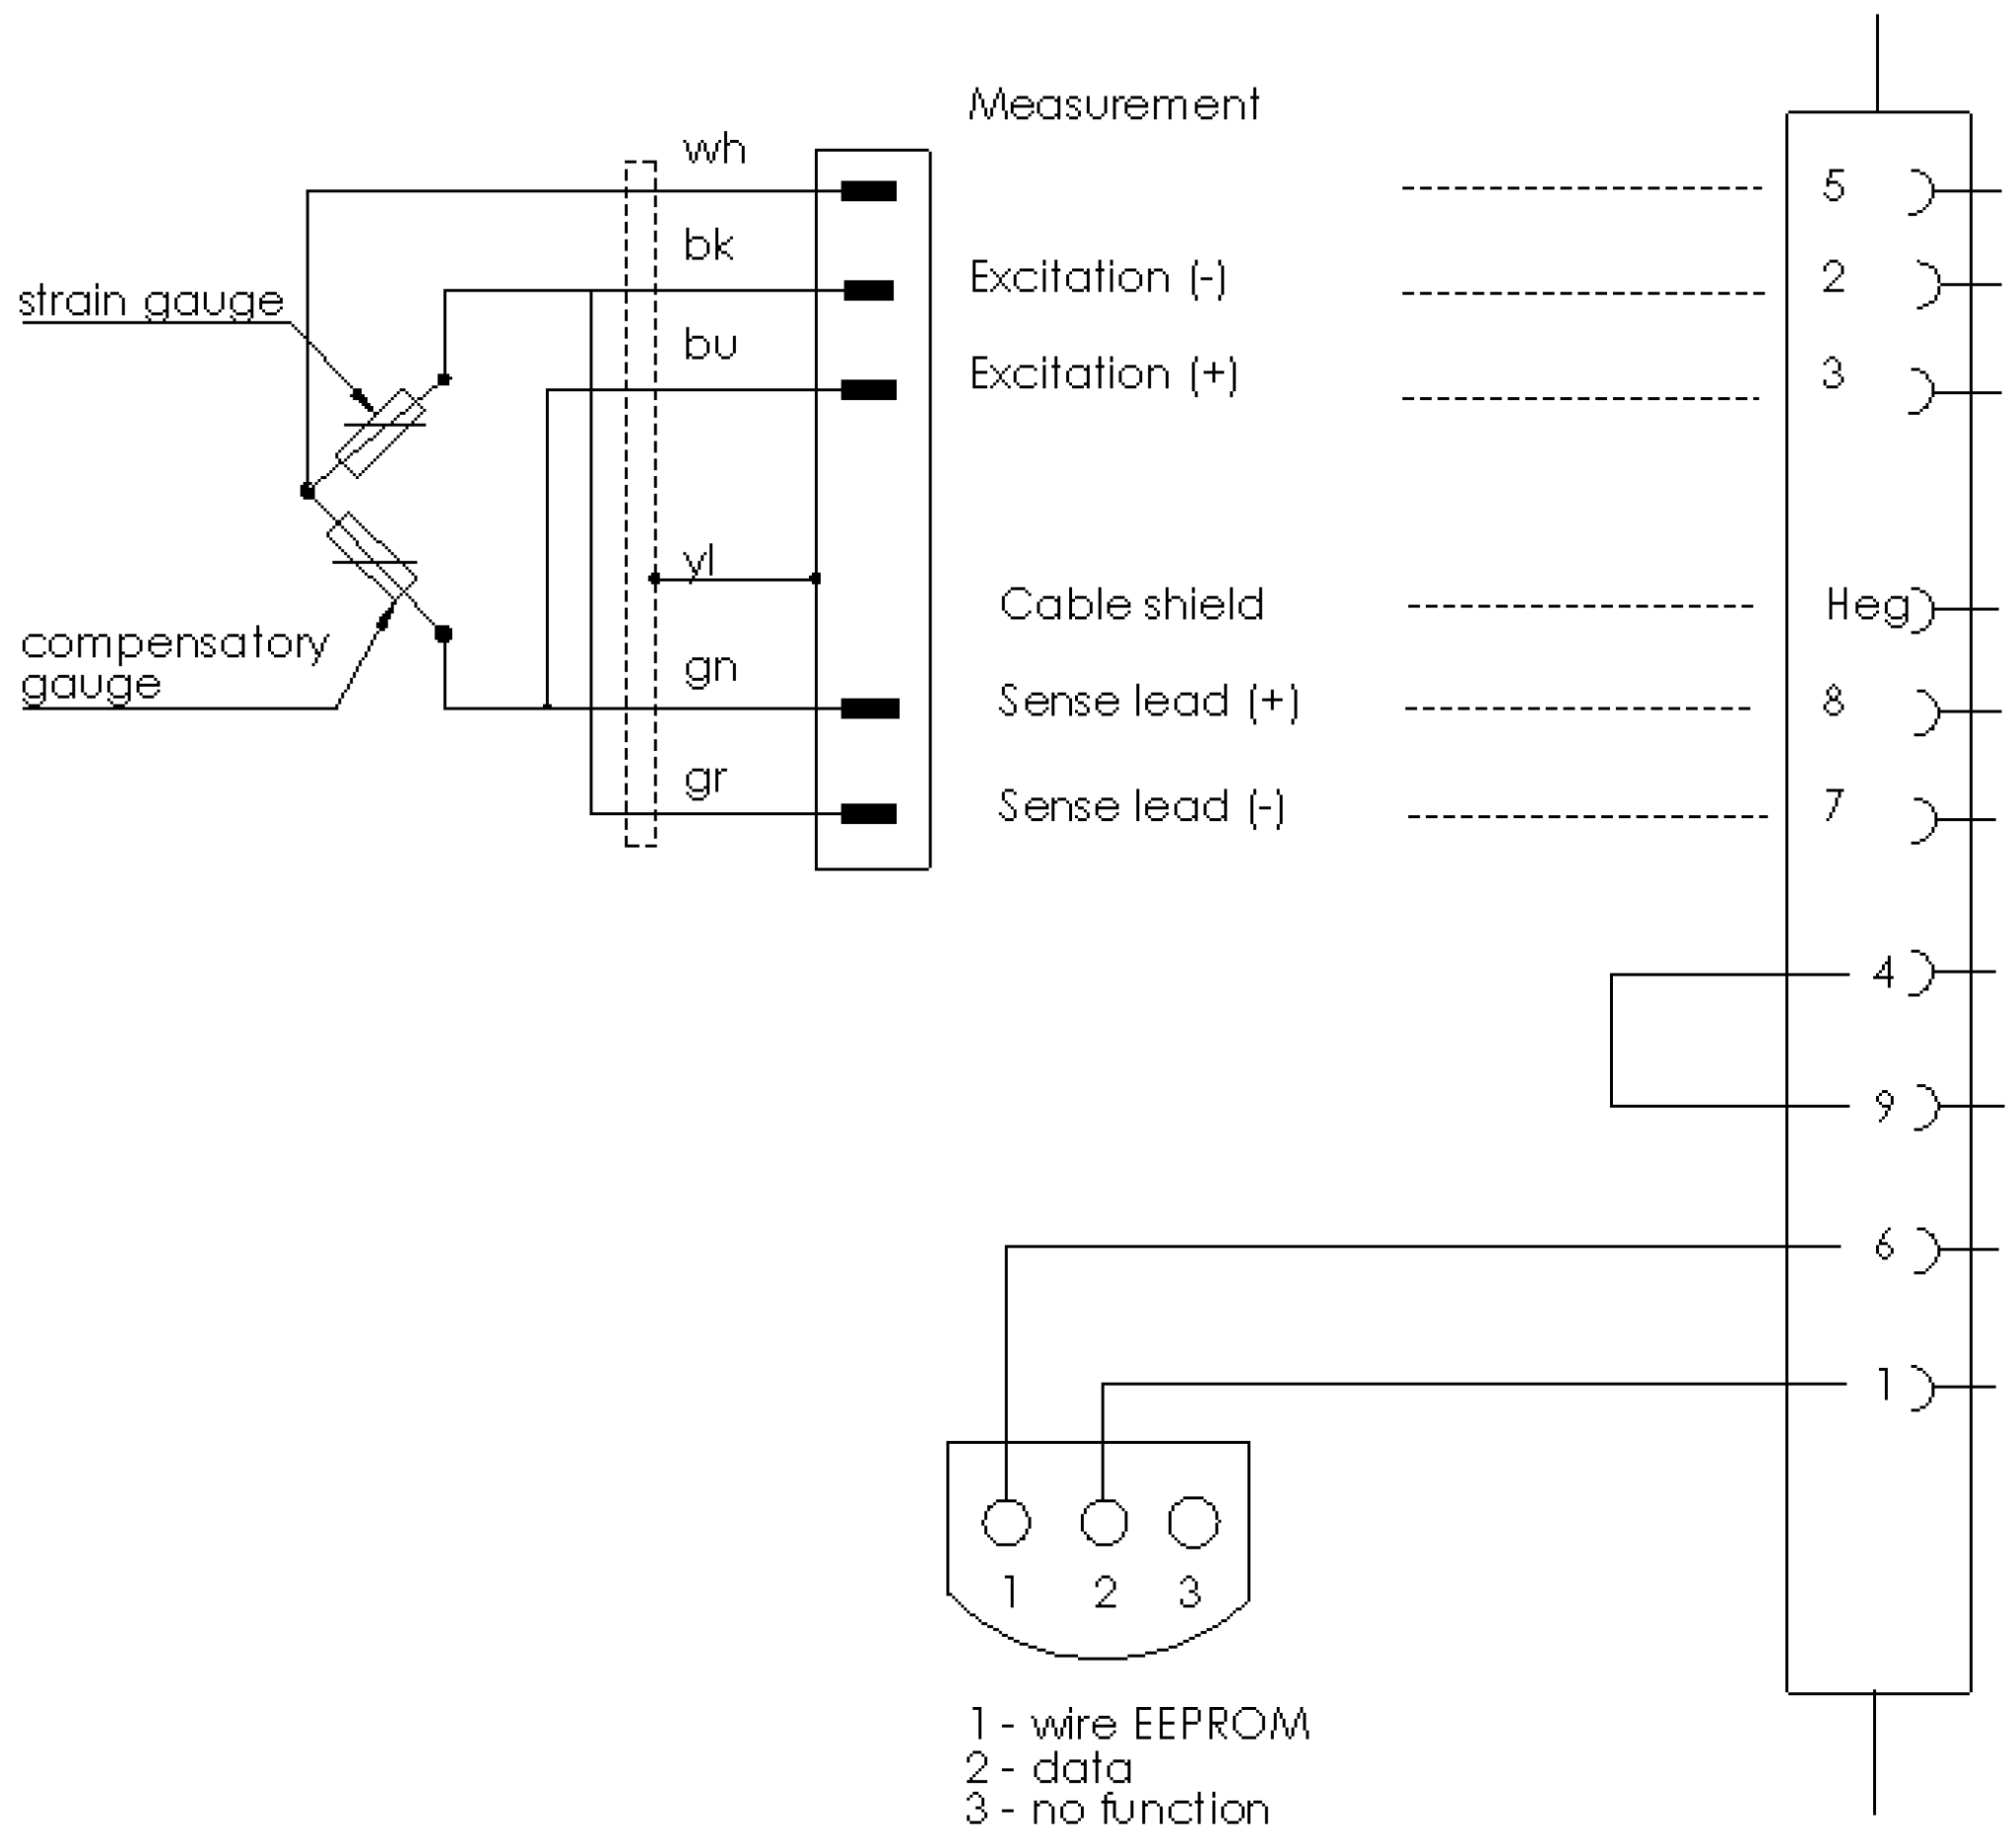
2.2.2. Electrical Resistance Strain Gauge Measurement
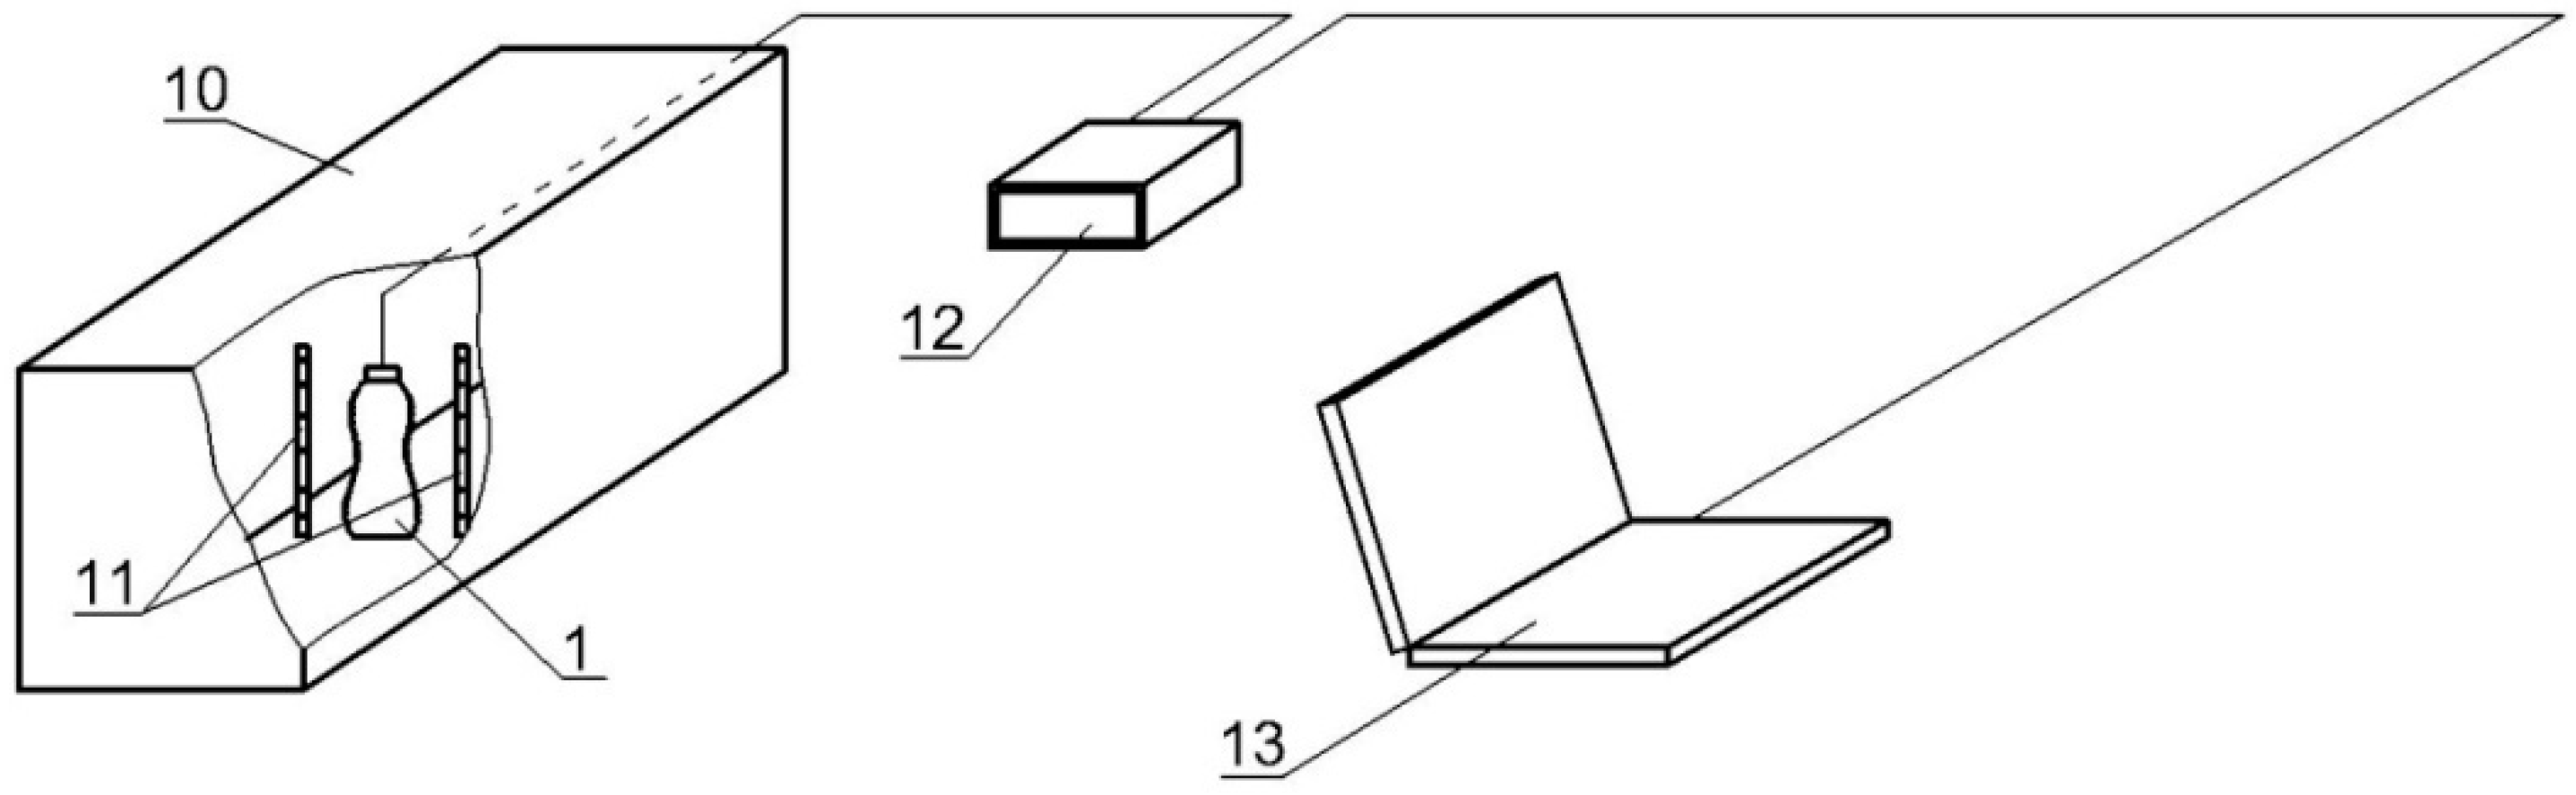
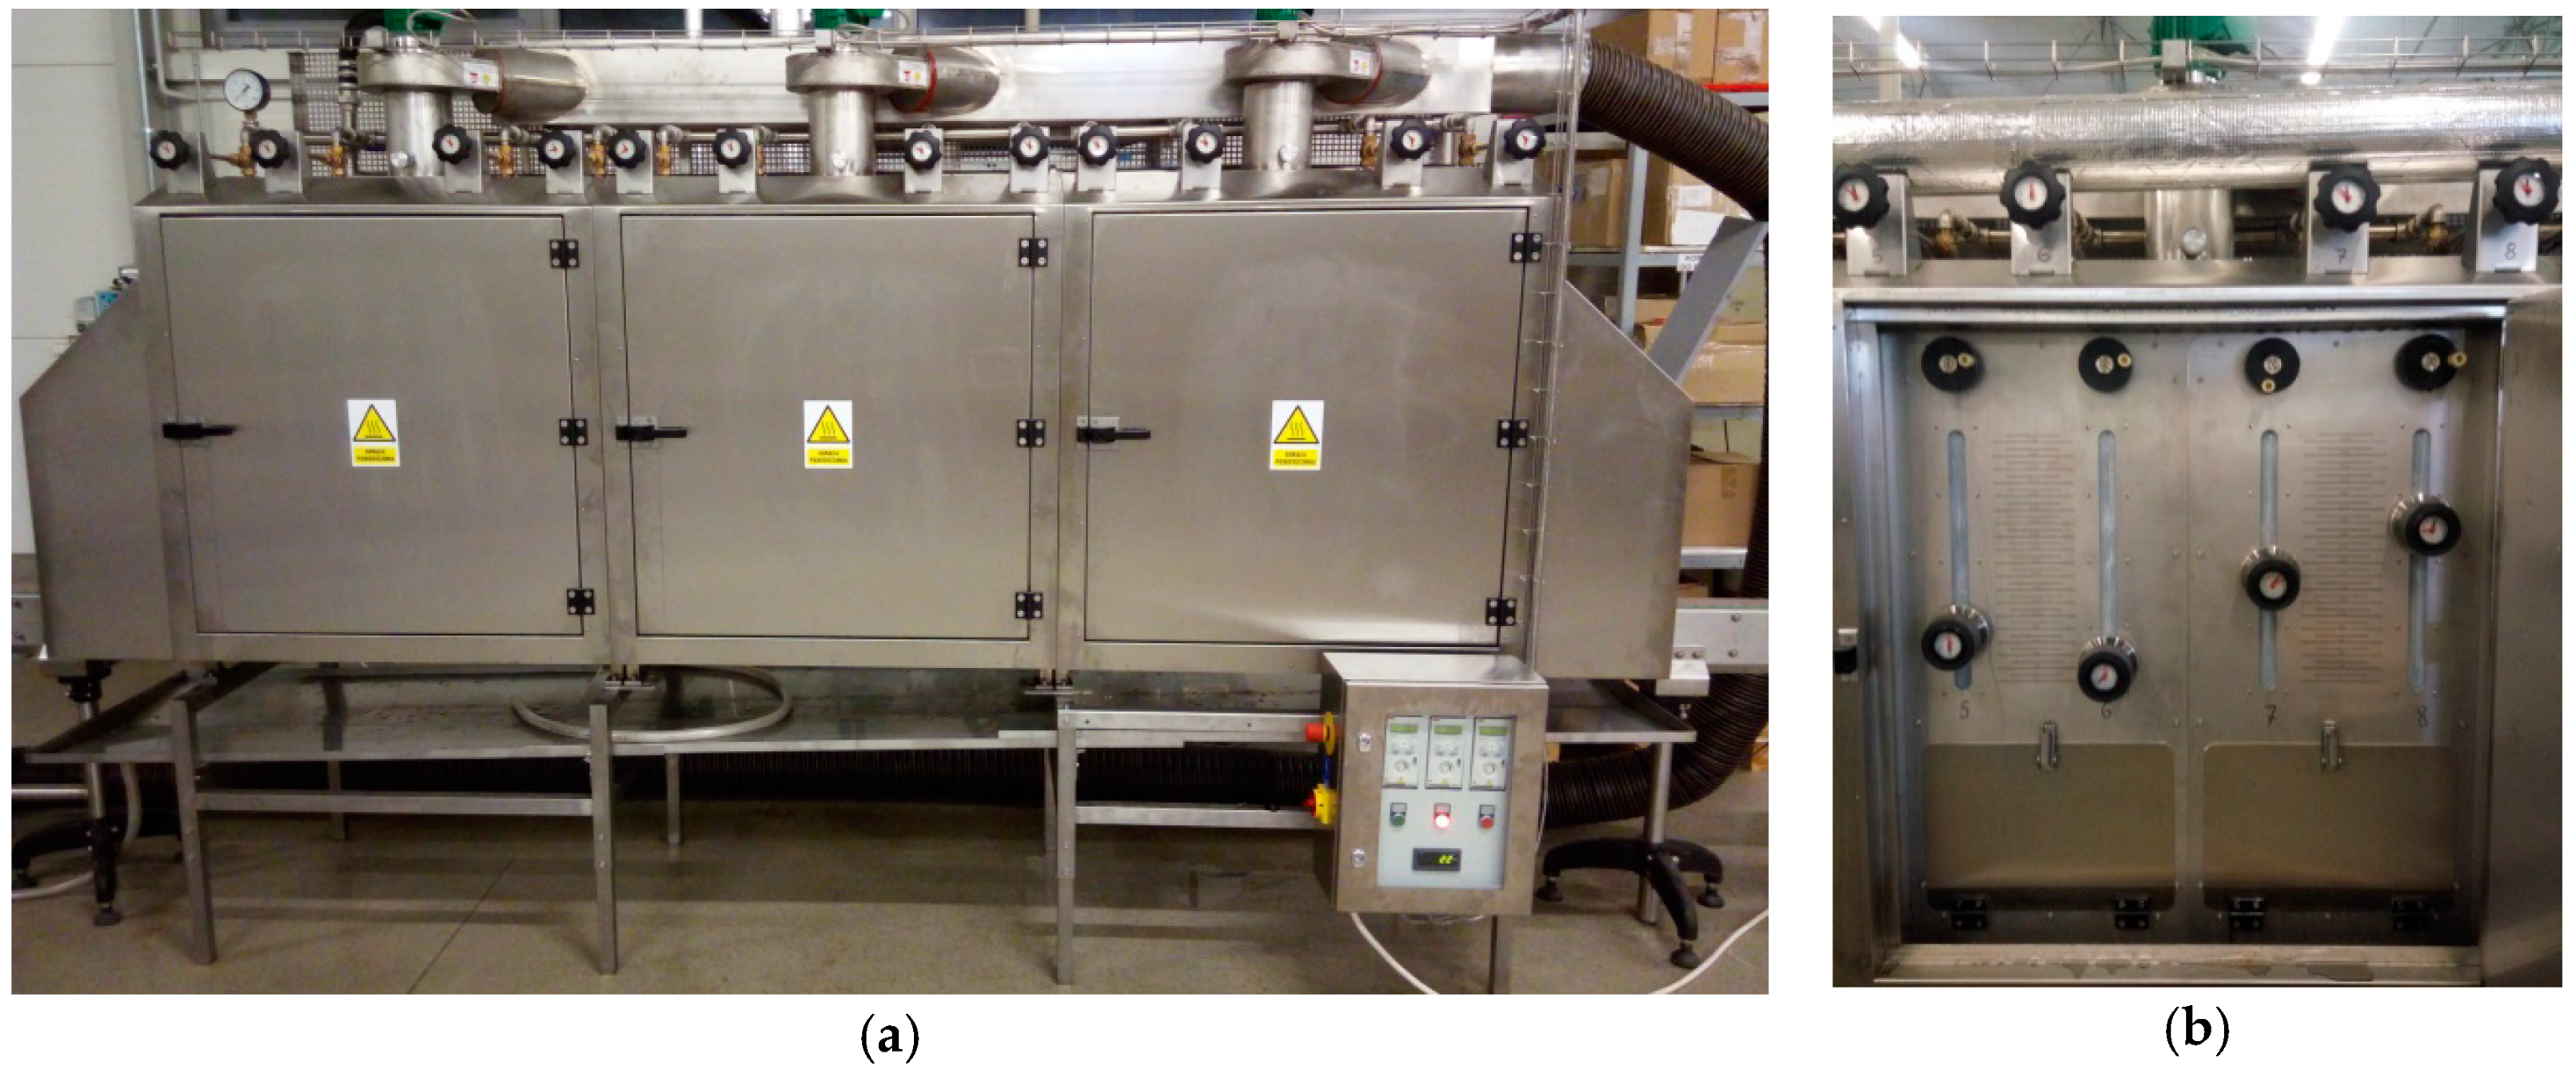
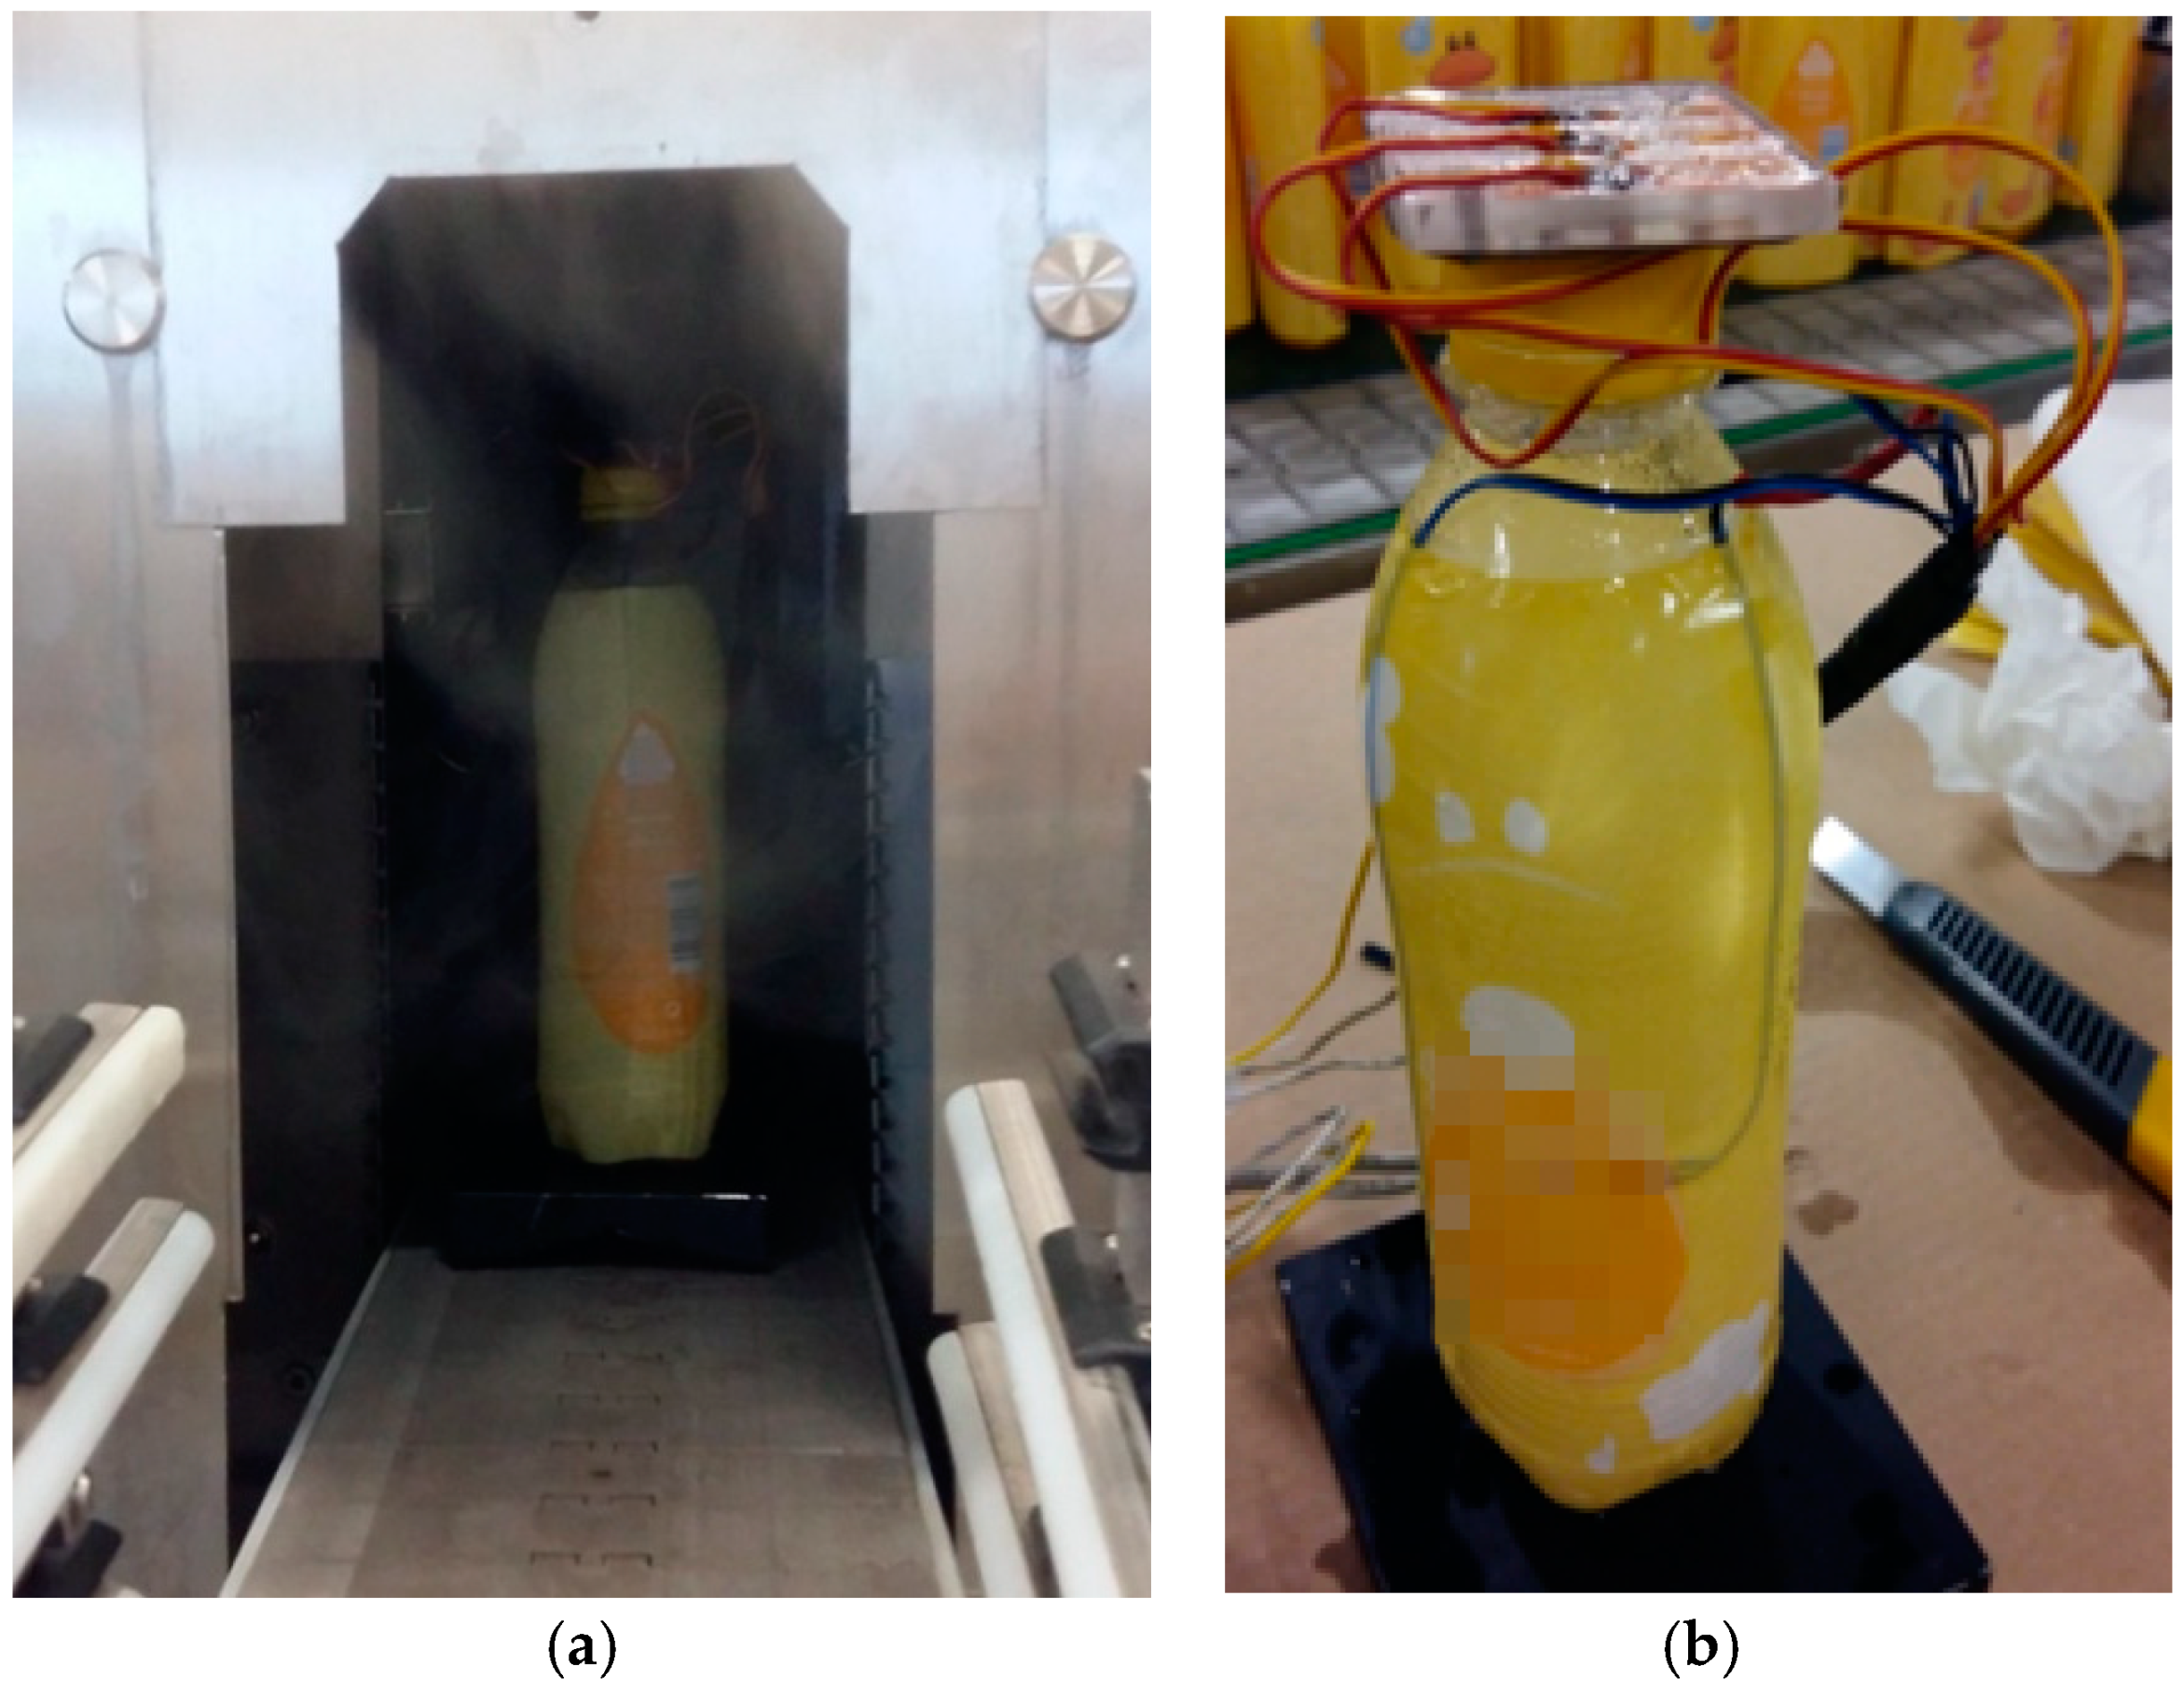
2.2.3. Test Stand
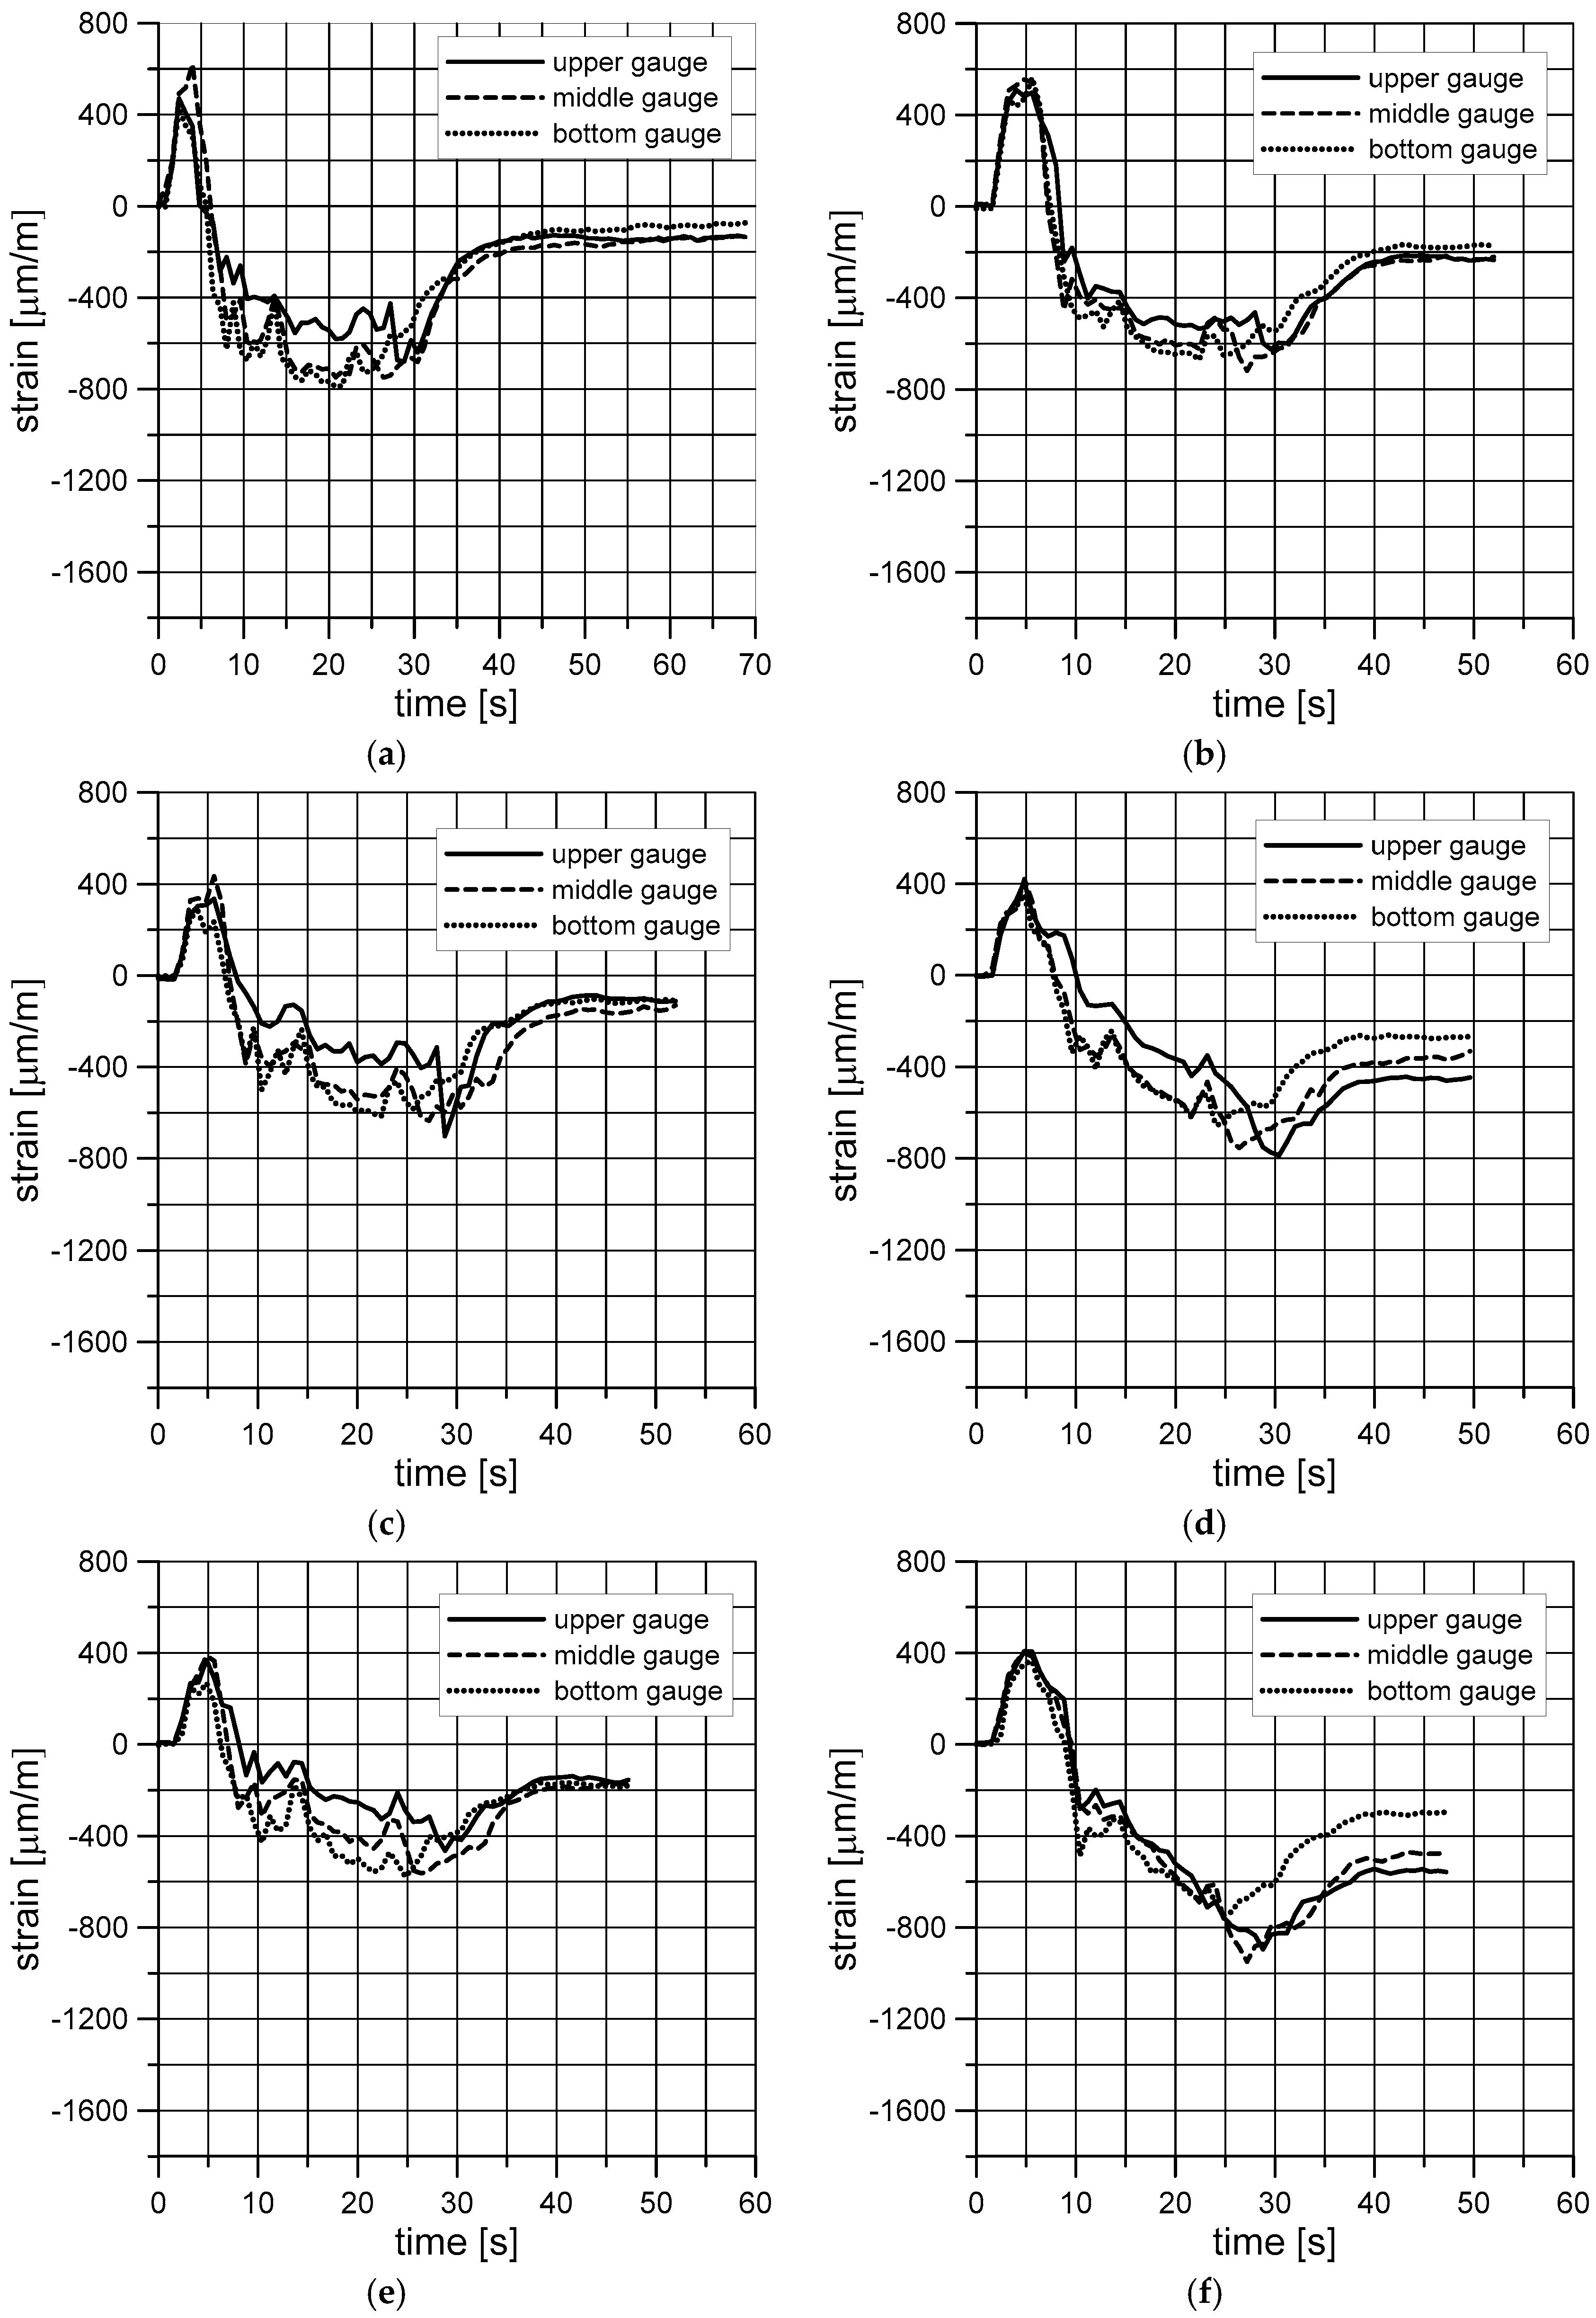
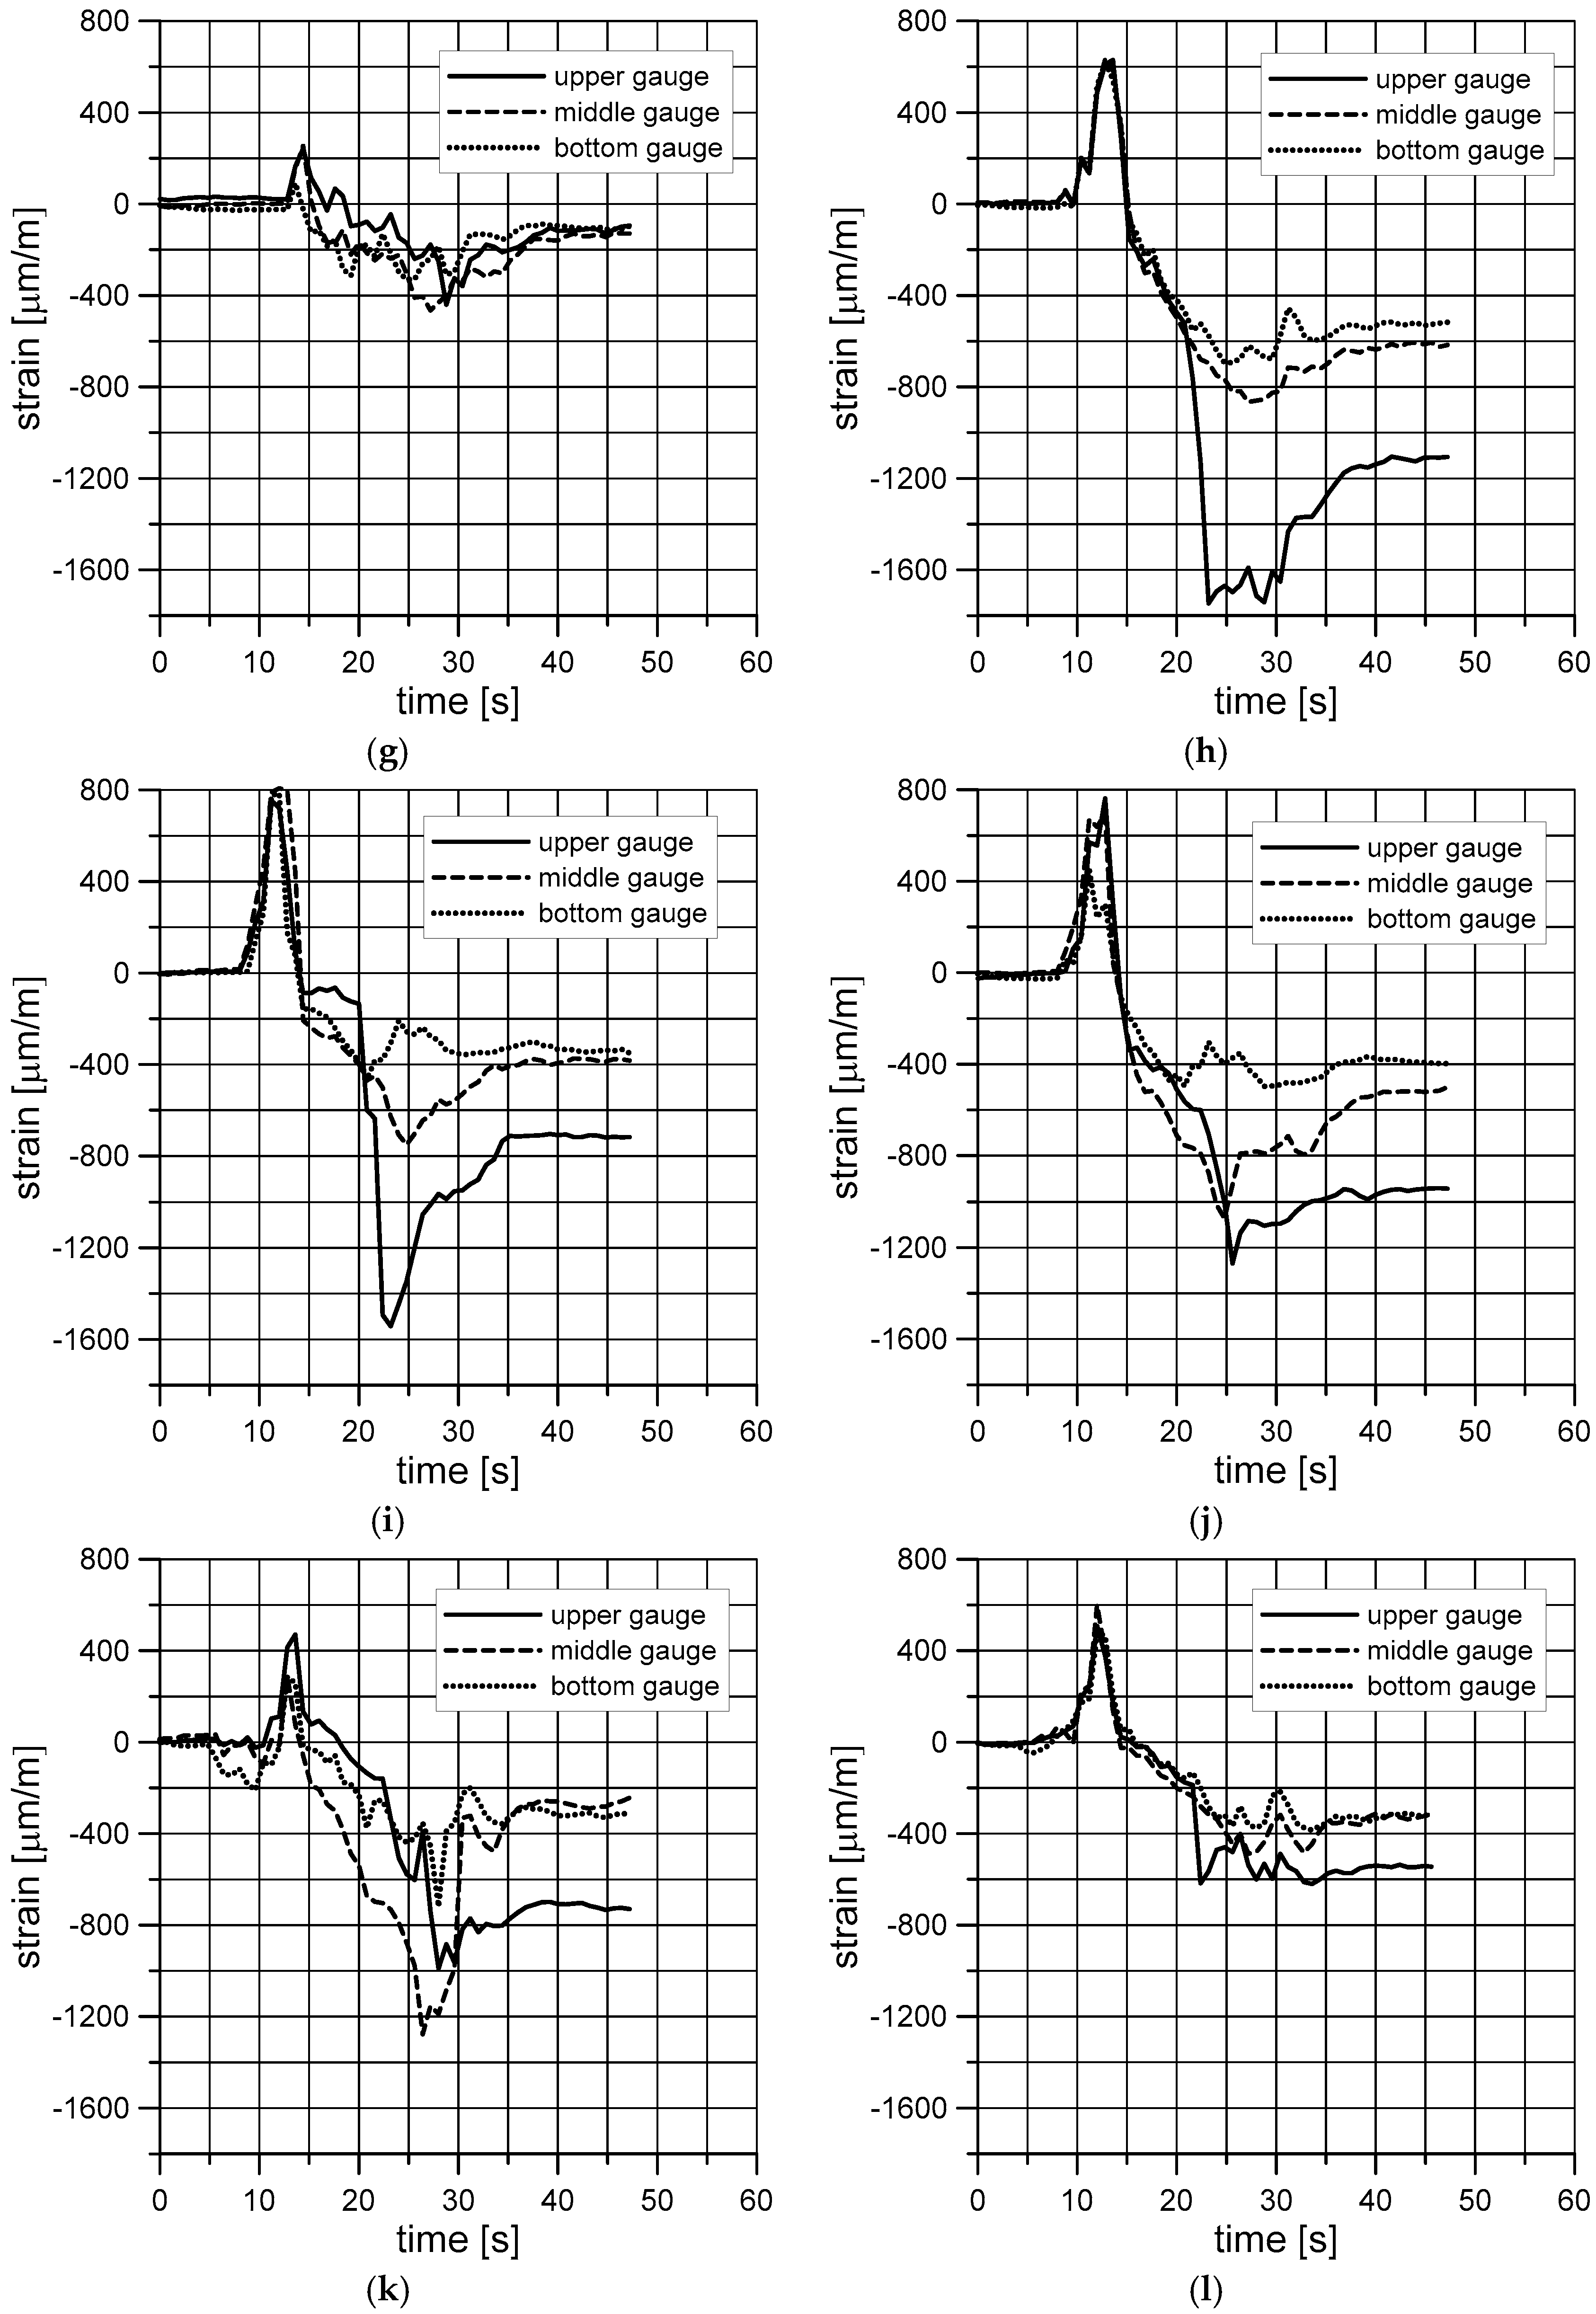
3. Results
4. Discussion
5. Conclusions
Author Contributions
Funding
Acknowledgments
Conflicts of Interest
References
- Izdebska, J. Applications of printed materials. In Printing on Polymers; Izdebska, J., Thomas, S., Eds.; Elsevier: Philadelphia, PA, USA, 2016; pp. 371–388. [Google Scholar]
- Raheem, D. Application of plastics and paper as food packaging materials? An overview. Emir. J. Food Agric. 2013, 25, 177. [Google Scholar] [CrossRef]
- Rudnik, E. Compostable properties and packaging applications. In Plastic Films in Food Packaging; Ebnesajjad, S., Ed.; Elsevier: Cambridge, MA, USA, 2013; pp. 217–248. [Google Scholar]
- Averous, L.; Moro, L.; Dole, P.; Fringant, C. Properties of thermoplastic blends: STARCH–polycaprolactone. Polymer 2000, 41, 4157–4167. [Google Scholar] [CrossRef]
- Matzinos, P.; Tserki, V.; Kontoyiannis, A.; Panayiotou, C. Processing and characterization of starch/polycaprolactone products. Polym. Degrad. Stab. 2002, 77, 17–24. [Google Scholar] [CrossRef]
- Mo, X.; Sun, X.S.; Wang, Y. Effects of molding temperature and pressure on properties of soy protein polymers. J. Appl. Polym. Sci. 1999, 73, 2595–2602. [Google Scholar] [CrossRef]
- Srinivasa, P.C.; Tharanathan, R.N. Chitin/Chitosan—safe, ecofriendly packaging materials with multiple potential uses. Food Rev. Int. 2007, 23, 53–72. [Google Scholar] [CrossRef]
- Tserki, V.; Matzinos, P.; Pavlidou, E.; Vachliotis, D.; Panayiotou, C. Biodegradable aliphatic polyesters. Part I. Properties and biodegradation of poly(butylene succinate-co-butylene adipate). Polym. Degrad. Stab. 2006, 91, 367–376. [Google Scholar] [CrossRef]
- Tserki, V.; Matzinos, P.; Pavlidou, E.; Panayiotou, C. Biodegradable aliphatic polyesters. Part II. Synthesis and characterization of chain extended poly(butylene succinate-co-butylene adipate). Polym. Degrad. Stab. 2006, 91, 377–384. [Google Scholar] [CrossRef]
- Wang, X.L.; Yang, K.K.; Wang, Y.Z. Properties of starch blends with biodegradable polymers. J. Macromol. Sci. Part C Polym. Rev. 2003, 43, 385–409. [Google Scholar] [CrossRef]
- Zhang, J.; Mungara, P.; Jane, J. Mechanical and thermal properties of extruded soy protein sheets. Polymer 2001, 42, 2569–2578. [Google Scholar] [CrossRef]
- Zhang, X.; Do, M.D.; Hoobin, P.; Burgar, I. The phase composition and molecular motions of plasticized wheat gluten-based biodegradable polymer materials studied by solid-state NMR spectroscopy. Polymer 2006, 47, 5888–5896. [Google Scholar] [CrossRef]
- Szusta, J.; Karakaş, Ö.; Tomczyk, A. Experimental investigation of thin films with various overprints used for packaging labels. Theor. Appl. Fract. Mech. 2018, 97, 467–477. [Google Scholar] [CrossRef]
- Patterson, R.; Kandelbauer, A.; Muller, U.; Lammer, H. Crosslinked thermoplastics. In Handbook of Thermoset Plastics; Goodman, S.H., Dodiuk-Kenig, H., Eds.; Elsevier: Philadelphia, PA, USA, 2014; pp. 697–737. [Google Scholar]
- Makuuchi, K.; Cheng, S. Radiation Processing of Polymer Materials and Its Industrial Applications; John Wiley & Sons: Hoboken, NJ, USA, 2012. [Google Scholar]
- Breil, J. Biaxially oriented films for packaging applications. In Plastic Films in Food Packaging; Ebnesajjad, S., Ed.; Elsevier: Philadelphia, PA, USA, 2013; pp. 53–70. [Google Scholar]
- Kondratov, A.P.; Varepo, I.G.; Nagornova, I.V.; Ermakova, I.N. Transparent Layered Materials Based on Variable Color Polyolefins. Procedia Eng. 2015, 113, 423–428. [Google Scholar] [CrossRef]
- Schäfer, C.G.; Viel, B.; Hellmann, G.P.; Rehahn, M.; Gallei, M. Thermo-cross-linked Elastomeric Opal Films. ACS Appl. Mater. Interfaces 2013, 5, 10623–10632. [Google Scholar] [CrossRef] [PubMed]
- Timoshenko, S.; Goodier, J.N. Theory of Elasticity; McGraw-Hill: New York, NY, USA, 1951. [Google Scholar]
- Watson, B.R. Bonded electrical resistance strain gages. In Springer Handbook of Experimental Solid Mechanics; Sharpe, W.N., Ed.; Springer: New York, NY, USA, 2008; pp. 283–334. [Google Scholar]


| Measure Series | Valve Settings for Individual Steam Sections | |||||||||||
|---|---|---|---|---|---|---|---|---|---|---|---|---|
| 1 | 2 | 3 | 4 | 5 | 6 | 7 | 8 | 9 | 10 | 11 | 12 | |
| 1 | 2.5 | 2.5 | 2.5 | |||||||||
| 2 | 5 | 5 | 5 | |||||||||
| 3 | 7 | 7 | 7 | |||||||||
| 4 | 0 | 2.5 | 2.5 | |||||||||
| 5 | 0 | 2.5 | 0 | |||||||||
| 6 | 2 | 4 | 7 | |||||||||
| 7 | 7 | 4 | 2 | |||||||||
© 2018 by the authors. Licensee MDPI, Basel, Switzerland. This article is an open access article distributed under the terms and conditions of the Creative Commons Attribution (CC BY) license (http://creativecommons.org/licenses/by/4.0/).
Share and Cite
Szusta, J.; Tomczyk, A.; Karakaş, Ö. A New Method for Estimating the Clamping Force of Shrink Sleeve Labels. Materials 2018, 11, 2544. https://doi.org/10.3390/ma11122544
Szusta J, Tomczyk A, Karakaş Ö. A New Method for Estimating the Clamping Force of Shrink Sleeve Labels. Materials. 2018; 11(12):2544. https://doi.org/10.3390/ma11122544
Chicago/Turabian StyleSzusta, Jarosław, Adam Tomczyk, and Özler Karakaş. 2018. "A New Method for Estimating the Clamping Force of Shrink Sleeve Labels" Materials 11, no. 12: 2544. https://doi.org/10.3390/ma11122544
APA StyleSzusta, J., Tomczyk, A., & Karakaş, Ö. (2018). A New Method for Estimating the Clamping Force of Shrink Sleeve Labels. Materials, 11(12), 2544. https://doi.org/10.3390/ma11122544