Article

Influence of Building Direction on the Oxidation Behavior of Inconel 718 Alloy Fabricated by Additive Manufacture of Electron Beam Melting

1
School of Materials Science and Engineering, Central South University, Changsha 410083, China
2
State Key Lab for Powder Metallurgy, Central South University, Changsha 410083, China
3
Yuanmeng Precision Technology (Shenzhen) Institute, Shenzhen 518055, China
*
Authors to whom correspondence should be addressed.
Materials 2018, 11(12), 2549; https://doi.org/10.3390/ma11122549
Submission received: 27 November 2018 / Revised: 11 December 2018 / Accepted: 12 December 2018 / Published: 14 December 2018
(This article belongs to the Section Corrosion)

Abstract

:
This research was aimed at investigating the high temperature oxidation behavior of Inconel 718 superalloy fabricated by electron beam melting with the building direction of 0°, 55° and 90° deviation from the Z axis of cylindrical samples. Columnar γ-fcc phase with preferred crystal orientations was found in all specimens. With the temperature ranging from 700 to 1000 °C, the 0° sample, symbolized by the lowest grain boundary density, and largest grain size, reveals the best oxidation performance. It is concluded that the building direction has more impact on the amount of grain boundary density than crystal orientation, which determined the oxidation resistance.

Graphical Abstract

1. Introduction

Nickel-based superalloys are a kind of precipitate hardening alloys, predominantly strengthened by γ′ phase (Ni3(Al, Ti, Nb), L12) and/or γ″ phase (Ni3Nb, D022) [1], and have been extensively applied in the aerospace industry, especially in the hot sections of aero turbine engines, due to their great high-temperature strength and extraordinary corrosion resistance etc. [2,3]. Nickel-based superalloys have been manufactured in a large number of methods, such as wrought, cast, and powder metallurgy (normally with Hot Isostatic Pressing (HIP) treatment) etc., and can give rise to satisfactory performances in various aspects [4,5,6,7,8]. With the rapid development of the aerospace industry, higher temperature and more reliable Inconel 718 components of the modern industry is in great demand. Poor oxidation resistance of any thermo-resistance component can cause a potential risk to its service reliability leading to a shorter service life. Hence, degradation by high temperature oxidation is a main reason for the failure of hot-section turbine blades [9]. Additionally, the need for complex shapes of turbine blades is increasing. Consequently, the net shape forming methods, in particular the 3D printing technologies or also called additive manufacturing (AM) techniques, have attracted the attention of manufacturers [10].
Compared to the traditional AM technique of selected laser melting (SLM), electron beam melting (EBM) is particularly famous for its flexible abilities to build different sections with fewer defects or cracks because of its high-power and fast scanning electron beam [11]. During this process, the materials are deposited layer-by-layer followed by a rapid cooling, giving rise to different microstructures and mechanical properties compared to the conventional methods. Besides, the preheating process is unique for the EBM process, due to uneven temperature distribution of the forming zone and electric charge excessively accumulating on metal powder surface, the crimp deformation of forming layer and blowing powder appear easily. Using the high-speed deflection characteristic of electron beam scanning, before the melting sintering, the metal powder was heated to 900 °C. The preheating process has three advantages, such as improving the conductivity of powder to help the electrons flow out of the build bed, minimizing thermal gradient to reduce the internal stress in the build part and maintaining a uniform temperature in the build part. Presently, EBM has been attracting wide attention because of its ability to be applied to advanced metal alloys, such as cobalt-based alloy [12,13,14], nickel-based alloy [15], titanium and titanium-based alloy [16,17], stainless steels [18,19], etc. [20,21,22].
Due to the uniqueness of the EBM process, for example, directional solidification by scanning electron beam and successive stacking of layered 2D slices, single-crystal like structures can be obtained. Superalloys fabricated by EBM with such microstructure characteristics demonstrate superior mechanical performance. In a recent study of superalloys produced by electron beam melting (EBM), a columnar, [200] textured γ grains with a large number of low angle boundaries were observed [23]. With different angles between the cylindrical axis and Z axis, the products have unique microstructure along with mechanical properties. As reported by Sun et al., the microstructure and high-temperature tensile properties of Inconel 718 (In718) alloys fabricated by EBM demonstrated strong build direction dependence [24]. However, the relation between high temperature oxidation property and build direction has not been investigated yet.
Therefore, in the present paper, three kinds of EBM-In718 alloy specimens with the direction of 0°, 55° and 90° deviation from the Z axis were prepared. The high temperature oxidation behavior of In718 alloys produced by EBM with different building directions was studied for the first time. The association between the anisotropic microstructure and the resultant oxidation performance was clarified in detail.

2. Materials and Experiments
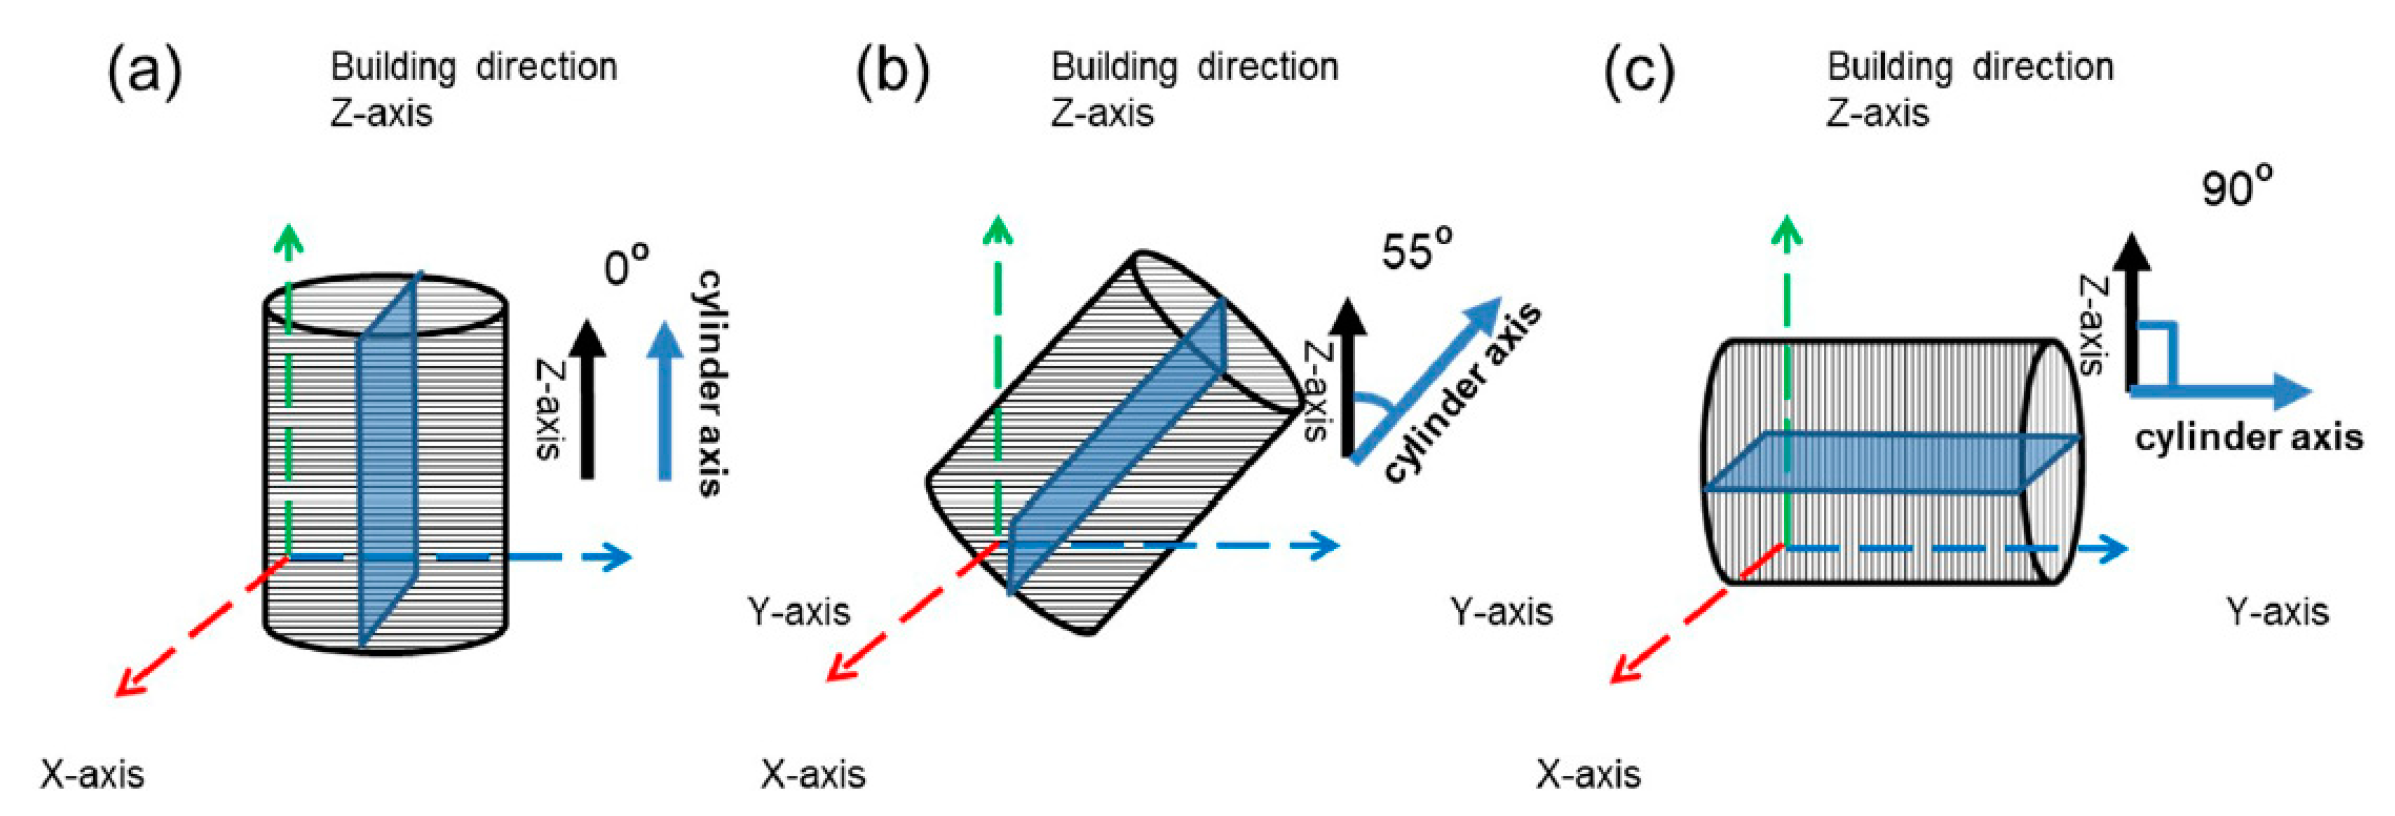
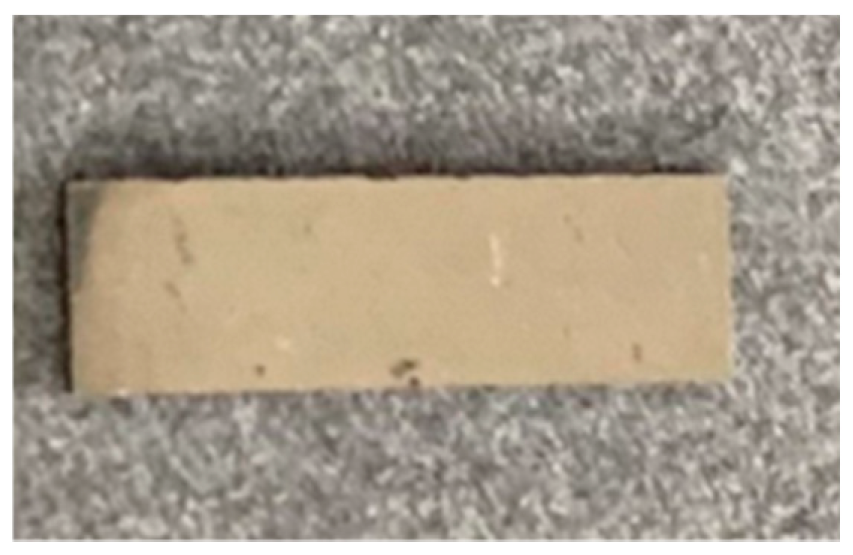
2.1. Materials

Three kinds of Inconel 718 rods with the dimension of 15 mm in diameter and 85 mm in height varying in building direction were manufactured by an Arcam A2 EBM system (Arcam AB, Mölndal, Sweden) with gas atomized powder. Table 1 lists the detailed chemical composition of Inconel 718 alloy powder.
Figure 1 shows the schematic figures of the Inconel 718 rod cylindrical orientations corresponding to the electron-scanning direction and the stacking direction during the EBM process. The specimens were built with the 0°, 55° and 90° deviation angle from the building direction, and are expressed as the 0°, 55° and 90° specimens, separately.
Figure 2 shows the 5 × 10 × 2 mm3 sheet specimens cut from the middle sections of the Inconel 718 rods via wire electrical discharge machining (WEDM, DK7740F, Sihai CNC machine tool factory, Taizhou, China), (the shadow areas in Figure 1). The surface and edges of all specimens were abraded on a series of # 800-2000 grit silicon carbide papers and then polished with alumina suspensions for 15 min. Then, the specimens were cleaned in ethanol by ultrasonic wave cleaner. Finally, all specimens were washed twice using ultra-pure water and dried with an air pump, then put in the electric vacuum drying oven at 70 °C for 2 h. Therefore, the mirror-polished specimens were already prepared for the high temperature oxidation experiments. To characterize the microstructure of the three kinds of specimens, all specimens were polished with OP-S solution for 30 min.

2.2. Isothermal Oxidation Test

Isothermal oxidation was conducted at various temperatures 700, 800, 900 and 1000 °C using a muffle furnace in air for 2, 4, 12, 24, 48, 72 and 100 h, respectively. The specimens were placed tilted in a corundum crucible to make sure that the contact area with the crucible is smallest. After exposure, the specimens were taken out of the box furnace along with the crucibles and then rapidly cooled to room temperature.

2.3. Microstructure Characterization

X-ray diffraction (XRD) investigations of the three kinds of specimens before and after the isothermal oxidation tests were performed with a Co anode (λ = 1.79020 Å) in a Bruker D8 Diffraction Advance (Billerica, MA, USA) at room temperature. During the XRD process, each specimen was scanned with a scanning rate of 8°/min from 20° to 80°. The initial grain structures of the specimens were examined using electron backscatter diffraction (EBSD, FEI XL30S, FEI Company, Hillsboro, OR, USA). The EBSD analysis was conducted at step size of 1.5 μm with the accelerating voltage up to 30 kV. From the EBSD results, including inverse polar figure (IPF) map, phase distribution map, image quality (IQ) map, grain size and grain boundary density of all the specimens were obtained using orientation imaging microscopy (OIM) software from EDAX (TSL-OIM 5.0, Tex SEM Laboratories, Provo, UT, USA). The surface morphology and the chemical composition of the three kinds of specimens before and after the isothermal oxidation tests were performed with a NOVA scanning electron microscope (SEM, NOVA NANO SEM 230, FEI Company, Hillsboro, OR, USA) with an Oxford Instruments energy-dispersive X-ray spectroscopy (EDS) detector. The cross-sectioning of the oxidized specimens were performed with a diamond saw. Additionally, postprocessing of the cross-sectional specimens was done with a series of alpha alumina suspensions.

3. Results

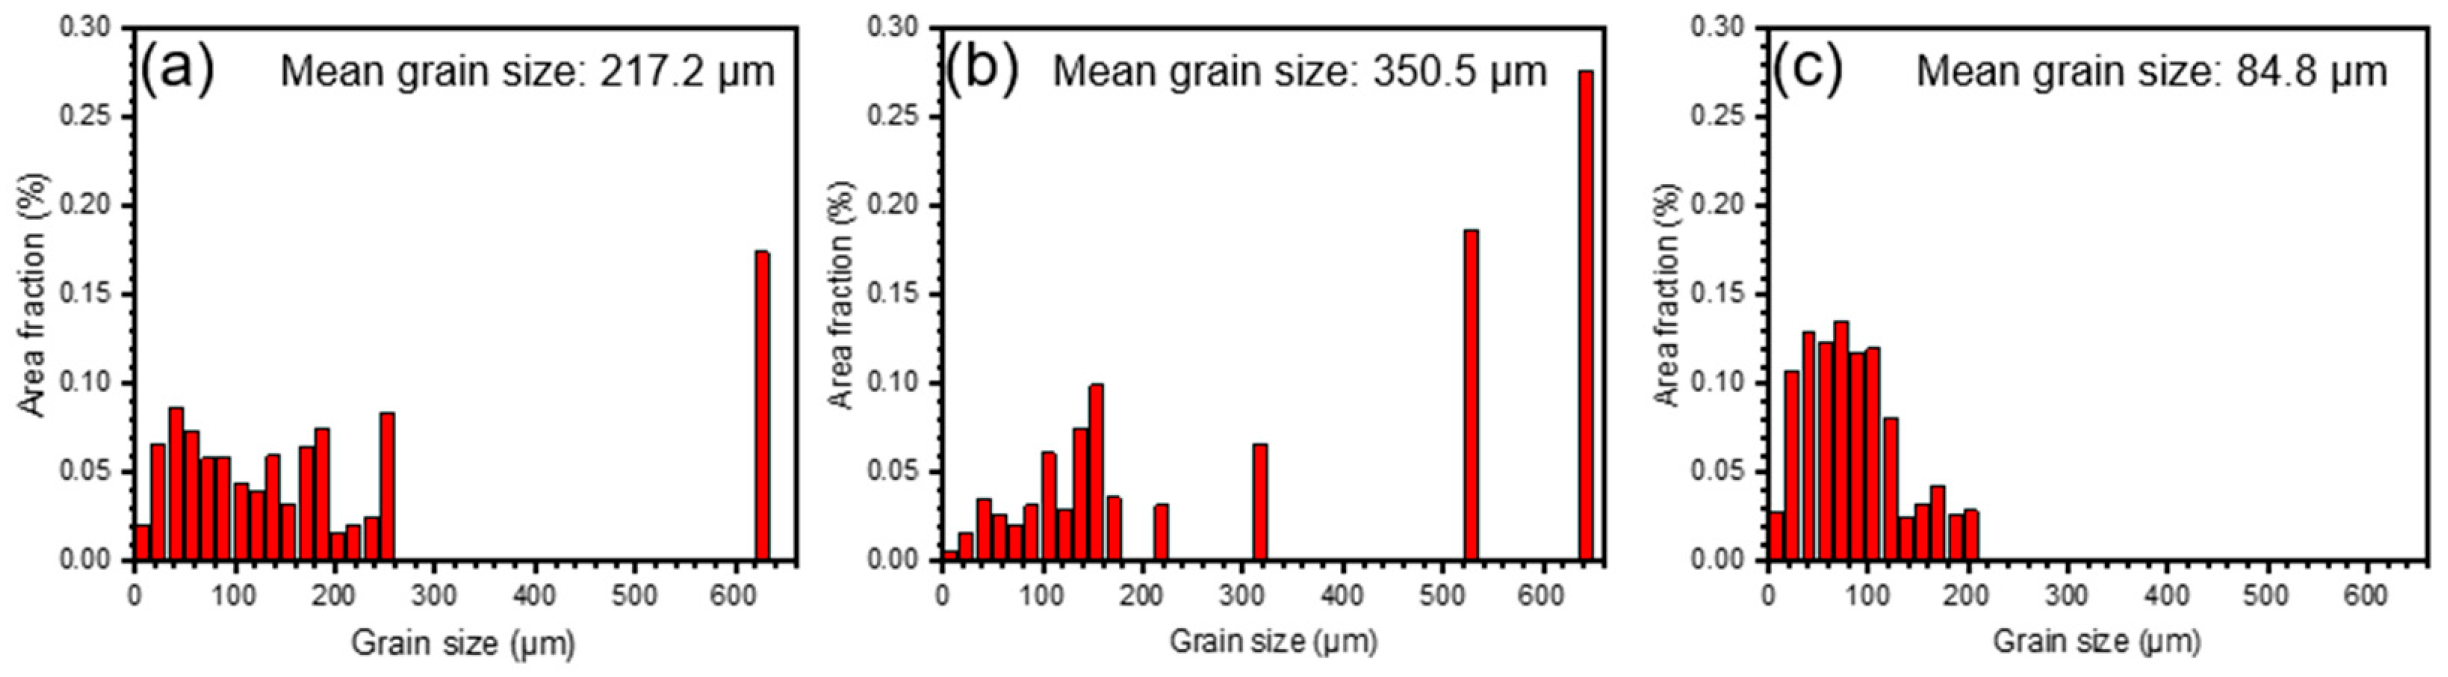
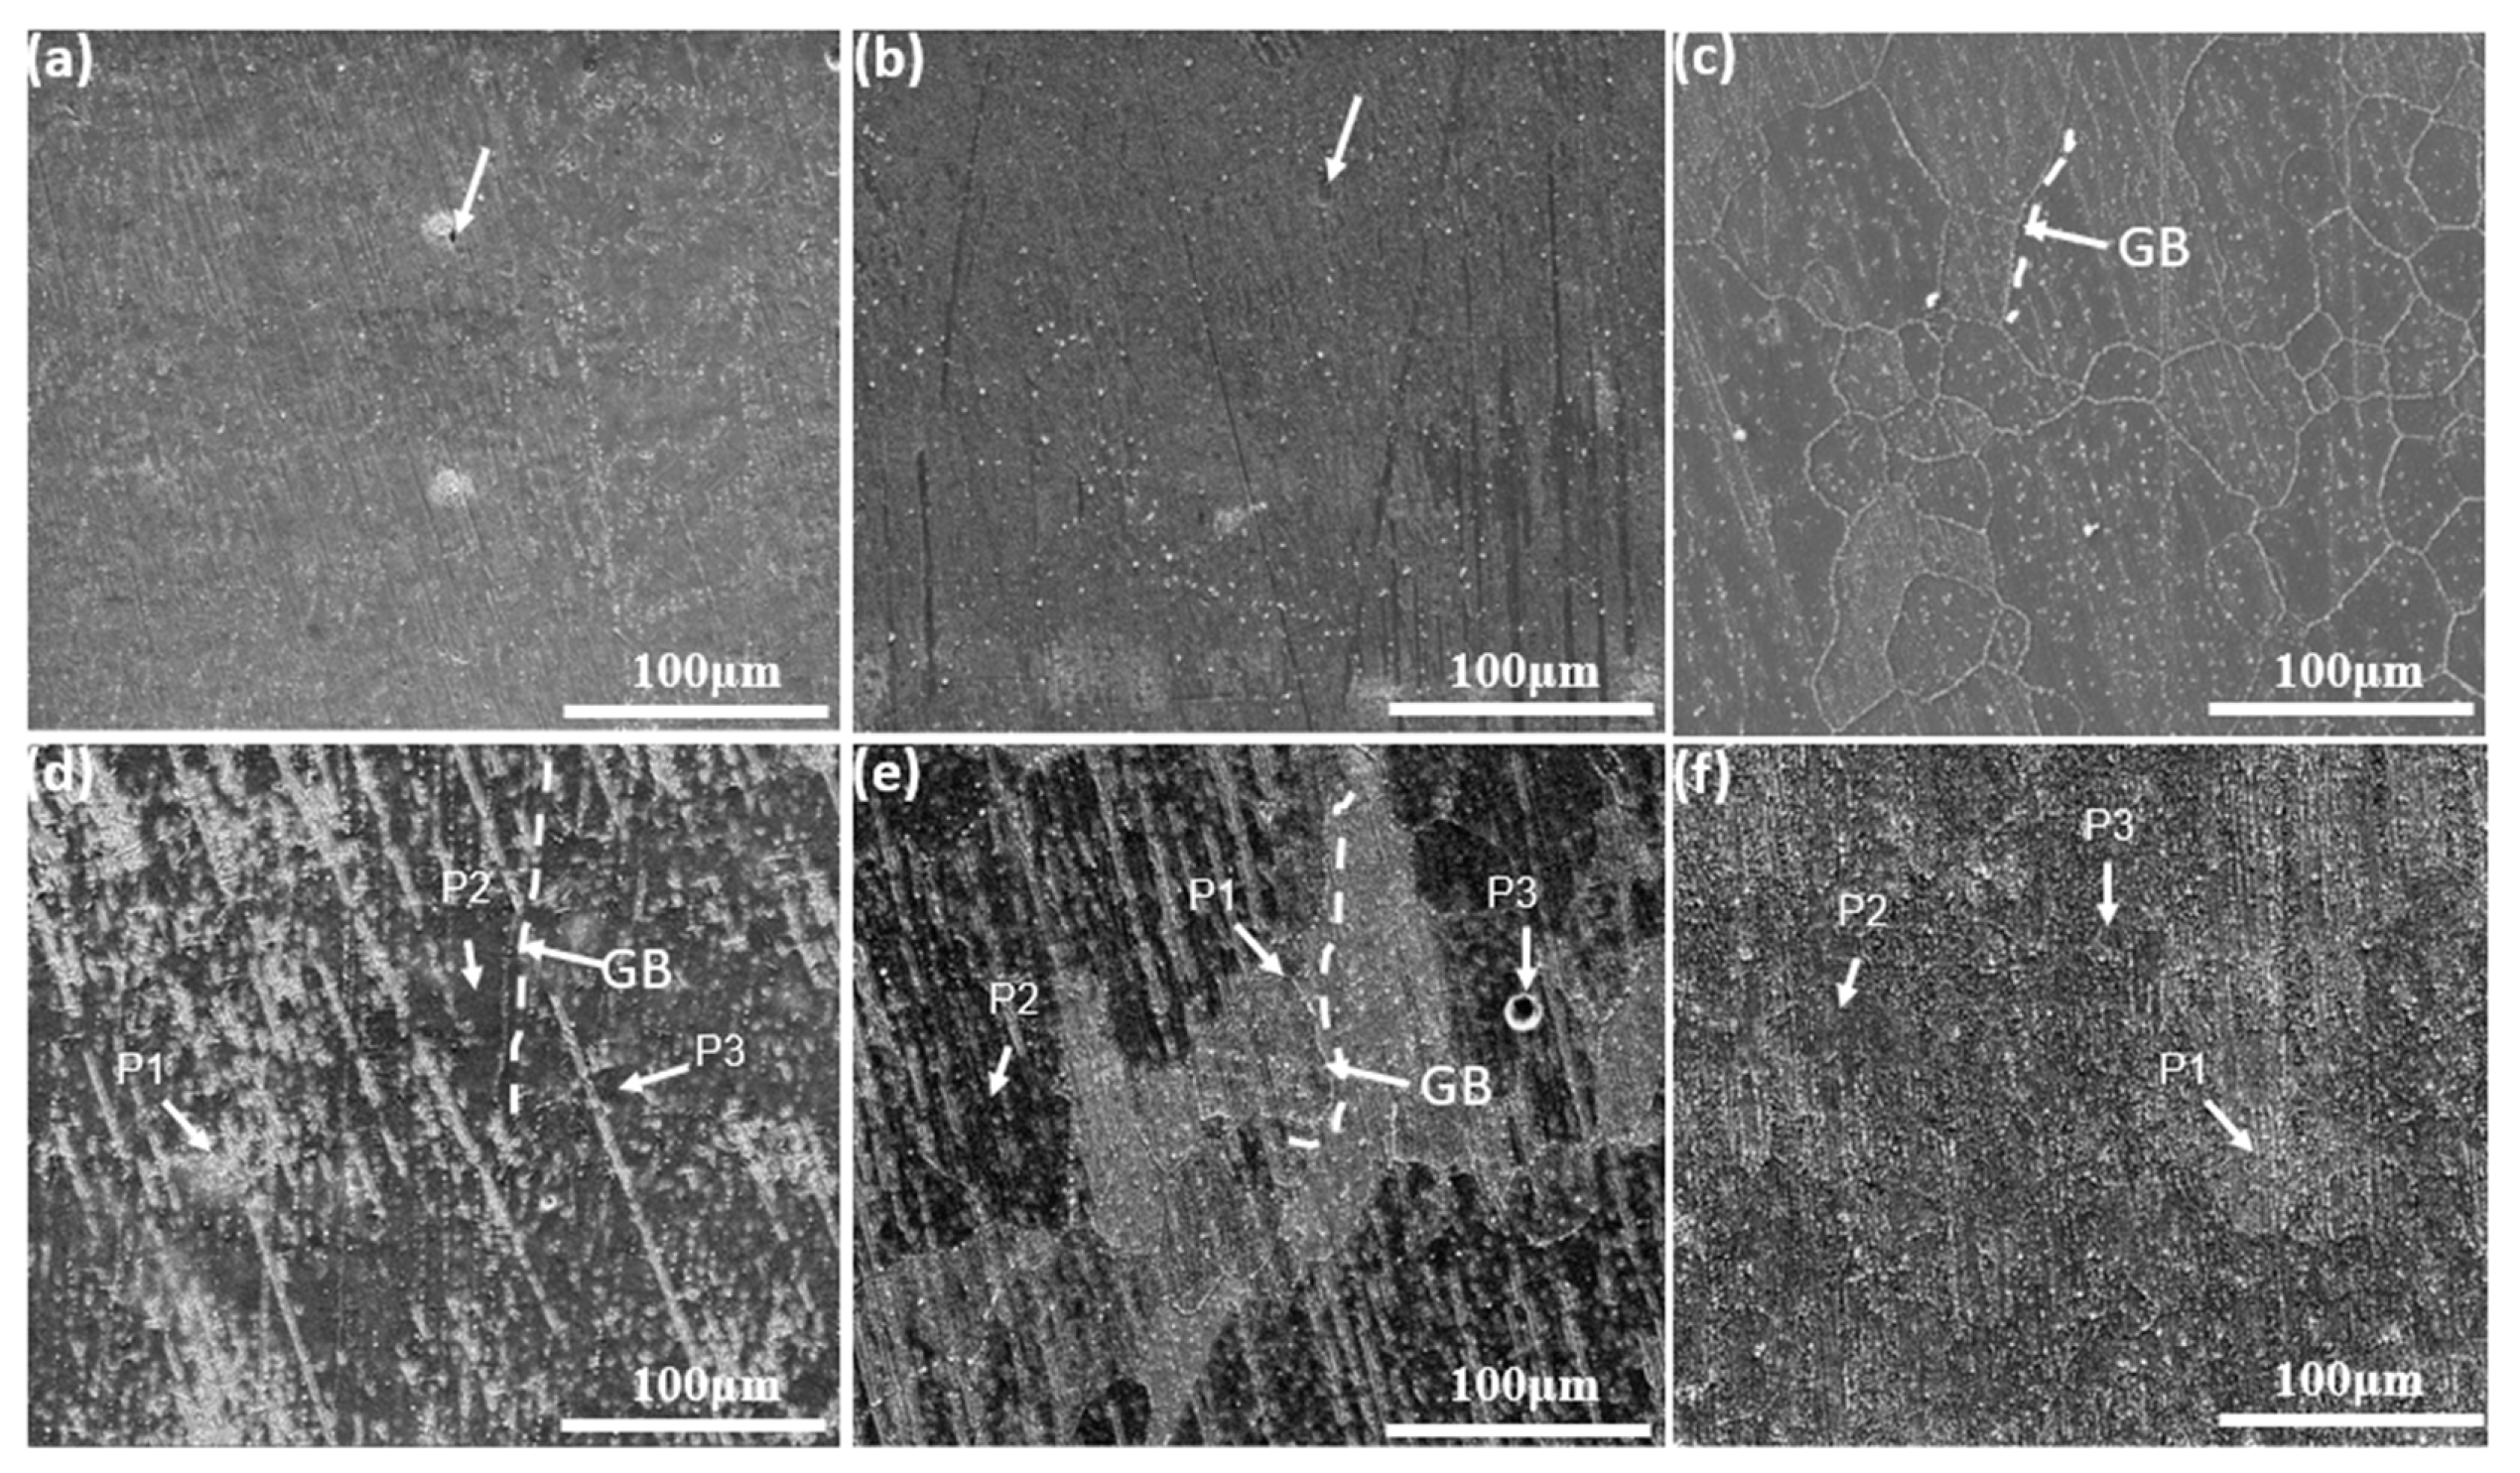
3.1. Alloy Characteristics

The XRD patterns of the as-EBM-In718 alloy specimens are exhibited in Figure 3. As the results show, the XRD pattern are indexed, belonging to the face centered cubic (FCC) structure of γ-phase of all the specimens. No additional phase was detected in the XRD results. Furthermore, distinct difference of texture can be observed from the noteworthy variation in peak intensity in various building directions. A strong (100) texture can be seen in the 0° specimen and the 55° specimen reveals a maximum peak at (110) and a weakest peak at (100). What is more, the 90° specimen has a maximum peak at (111), indicating the strong building direction-dependence of the microstructure.
As shown in Figure 4a–c, three kinds of specimens demonstrate different grain morphology from the IPF maps. The IPF maps illustrate the strong (001) texture in the 0° sample, (110) texture in 55° sample, and (001), (110) and (111) texture in 90° sample, which are in accord with the XRD results. The image quality (IQ) maps overlapped with the corresponding phase (Figure 4d–f) show the location of the grain boundaries clearly, in which the light grey lines stand for the low angle grain boundaries (LAB) (2° ≤ θ < 15°) and the black ones represent high angle grain boundaries (HAB) (15° ≤ θ). In the three kinds of specimens, a major γ-fcc phase and a large number fraction of LAB are noted in 55° sample. As the grain size distributions (Figure 5) show, the grain size is completely different from one kind of specimen to another. The mean grain size is increased in the order of 90° < 0° < 55°.The calculated grain boundary length density and cumulative grain boundary length density versus misorientation angle are shown in Figure 6. The grain boundary density mainly concentrates on low misorientation angle range (2° to 15°) for all the specimens. In addition, the distributions of grain boundary length density vary with misorientation angle, which illustrate that the grain boundary densities are in an order opposite to the mean grain size of the specimens.

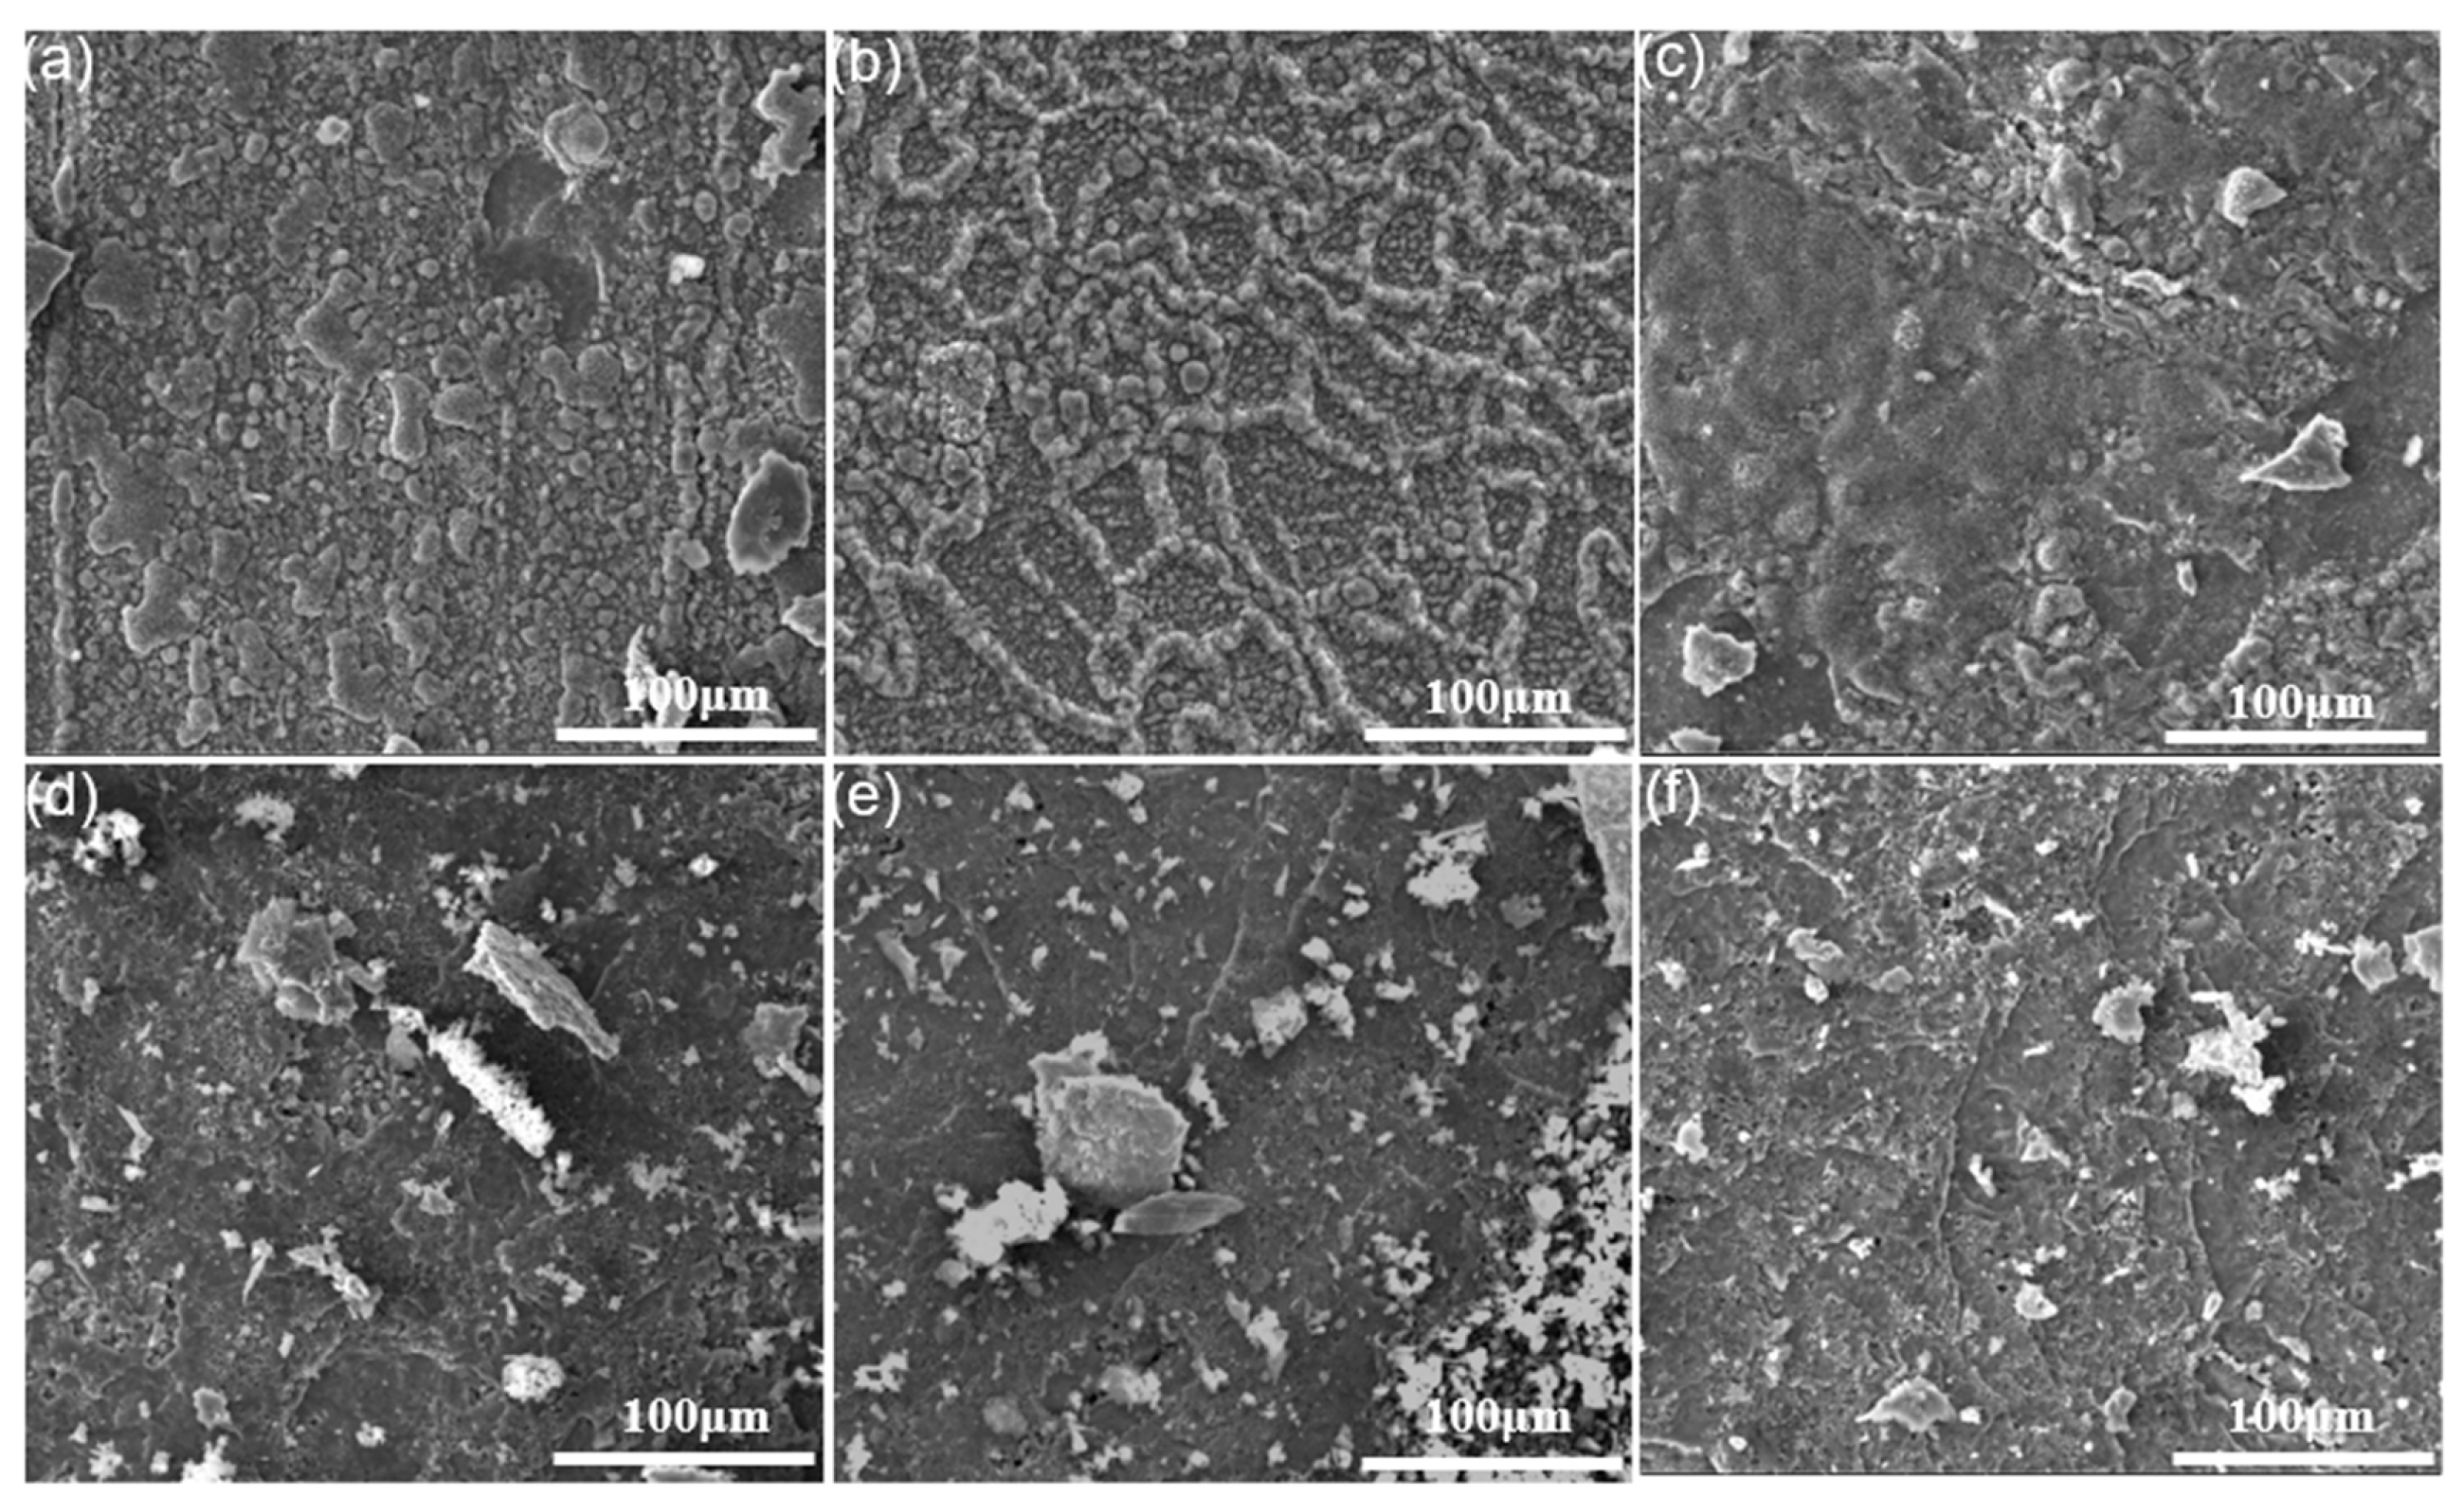
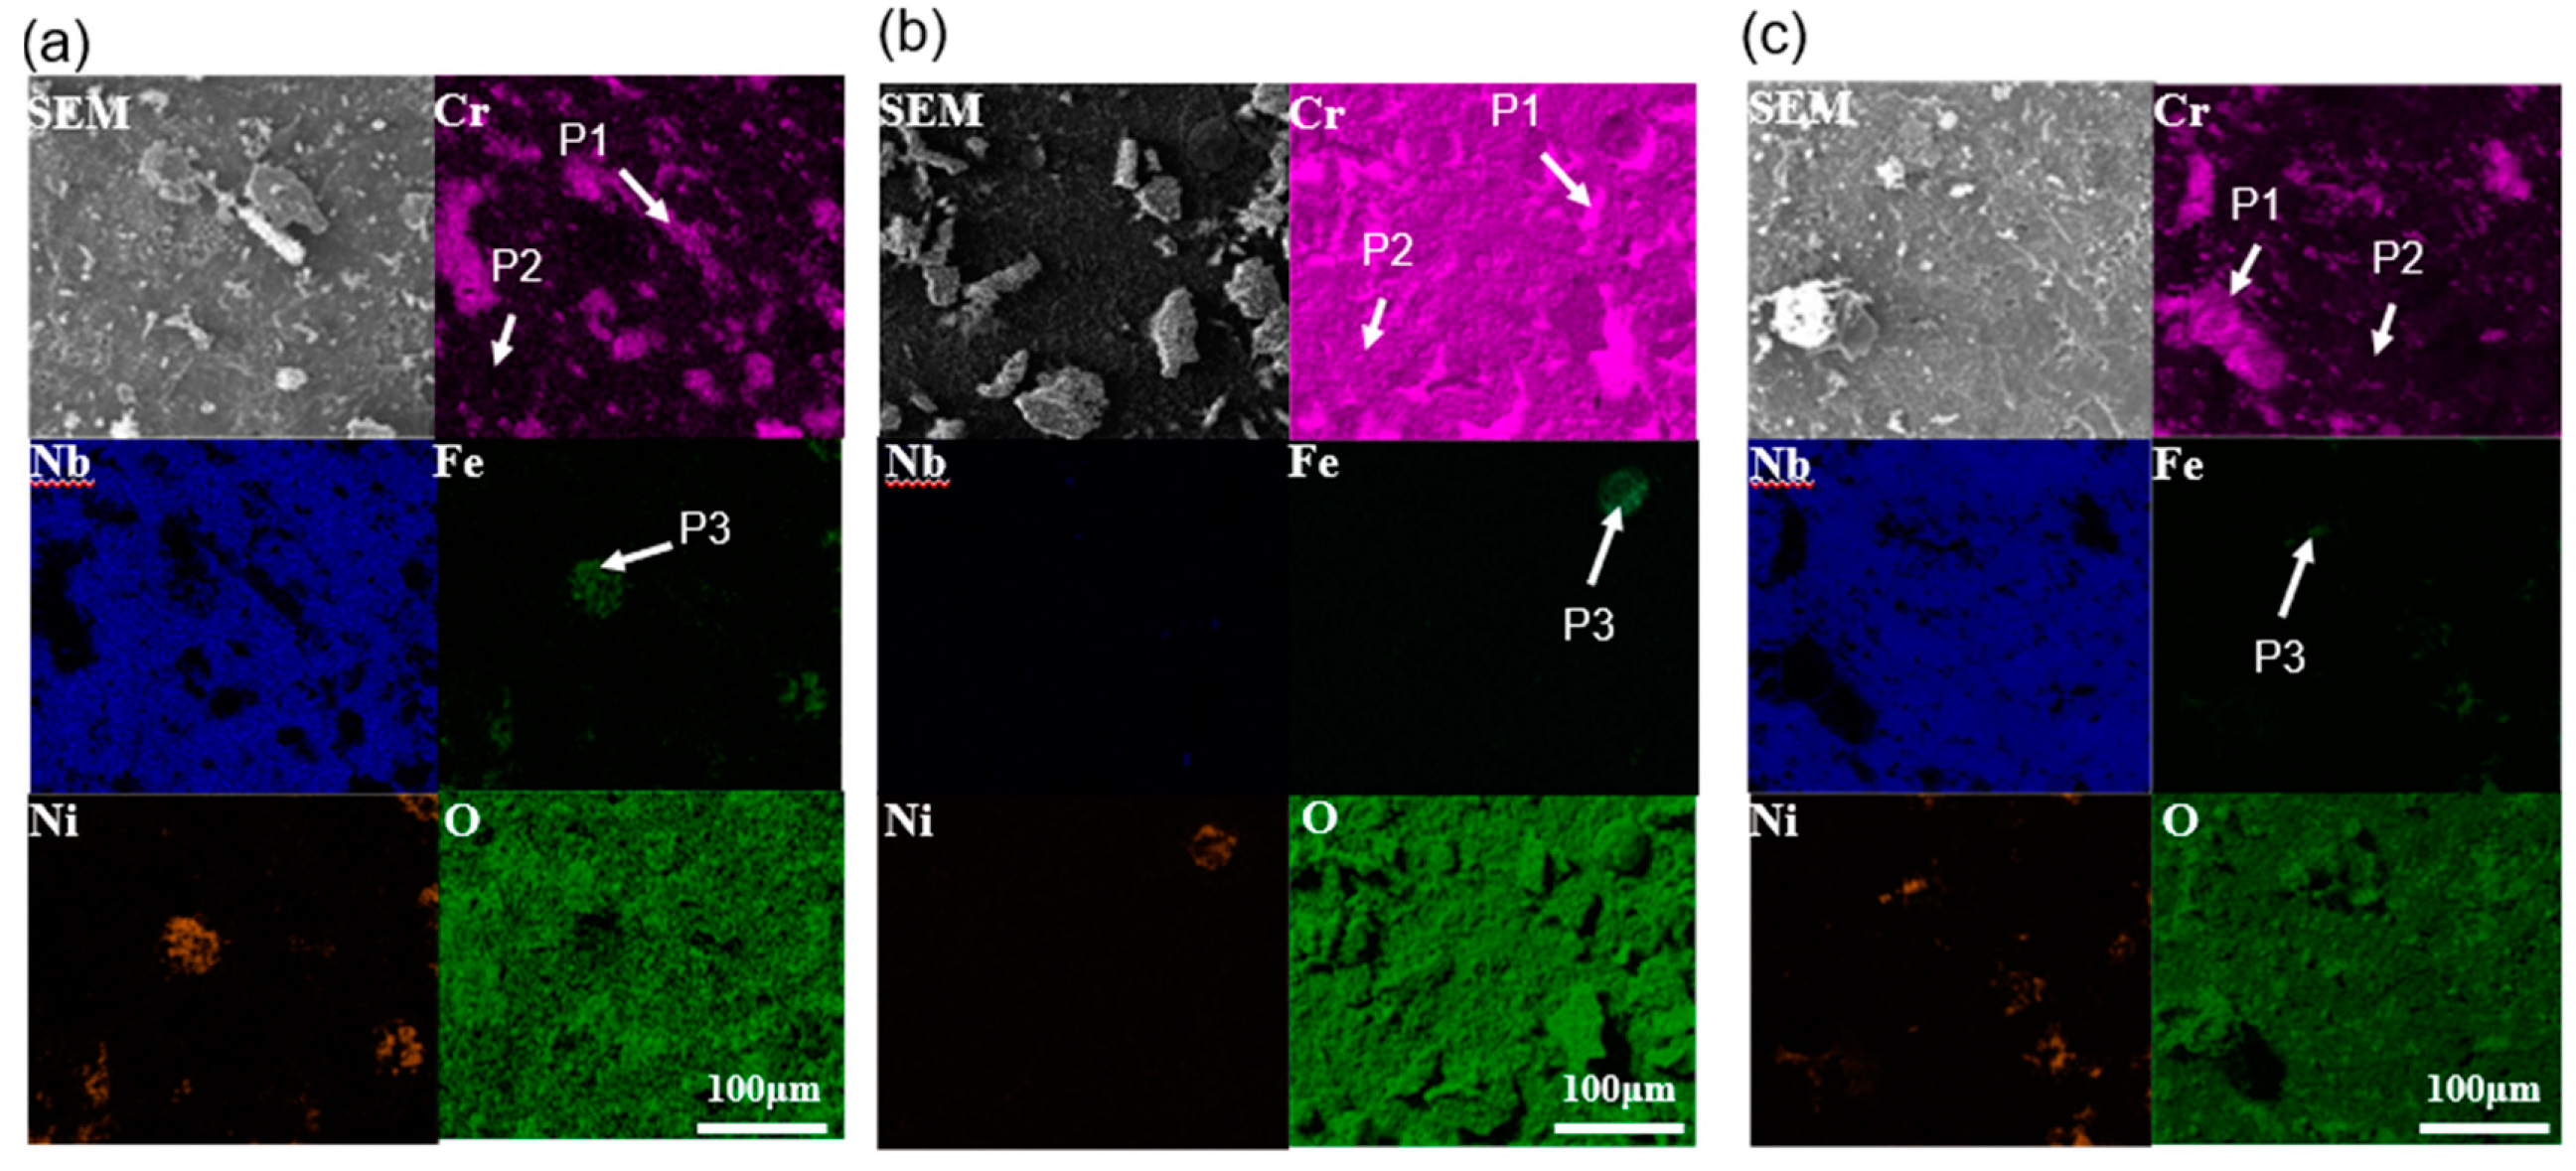
3.2. Characterization of Oxide Scales

After oxidation for less than 4 h at low temperatures (700 °C), light blue is observed in all sample surfaces irrespective of deviation angle. The surfaces turned dark blue after persisted oxidation (more than 24 h). Nevertheless, oxidation at a higher temperature generated darker surfaces, indicating that the composition of the oxide scale depends on the temperature and time of oxidation. Figure 7 shows the surface morphologies of all the specimens oxidized at 700 °C for 4 and 100 h by secondary mode. After oxidation for 4h, the surface of the 90° EBM-In718 alloy specimens (Figure 7c) was much rougher than those of the 0° and 55° specimens (Figure 7a,b). The oxides of 90° specimens were clearly concentrated at grain boundaries (dash lines). Thin and smooth oxide scale can only be observed on 0° and 55° specimens. In addition, the oxide scales of the 0° and 55° specimens (Figure 7d,e) grows not so obviously, while those of the 90° specimens (Figure 7f) became thicker when the oxidation time increased to 100h. From Figure 7d,e, we can see that the oxides were slightly enriched at grain boundaries. At the same time, the grain boundaries of 90° specimens are not distinct. As shown in Figure 7a,b, small pores (indicated by white arrows) appeared on the 0° and 55° specimen surfaces after oxidization at 700 °C for 4 h. These pores on both 0° and 55° specimens were almost invisible when oxidized for 100 h, as shown in Figure 7d,e.
When the oxidation temperature was up to 1000 °C, the spallation of the oxide scale on all alloys (Figure 8) was more severe than that of the oxide scale at 700 °C (Figure 7). Still, no matter what the oxidation time was, the 90° sample always had a rougher and thicker surface. Figure 9 shows the EDS elemental distribution maps after the specimens oxidized at 1000 °C for 100 h. Contrary to the thin oxide scales of the 0° and 55° specimens oxidized at 700 °C (Figure 7d,e), the specimens oxidized at 1000 °C presented apparent spallation (Figure 9a,b), indicating a reasonably high degradation rate at this temperature. From the EDS results, the oxide scales were generally composed of Cr oxides and Nb oxides.
EDS point analysis identified the compositions of P1 in Figure 7 and Figure 9 as 40–48 at. % O and 25–38 at. % Cr, indicating that the areas consisted of Cr2O3. At P2, 22–36 at. % O and 35–52 at. % Nb shows that the main composition of the oxide scales was NbO. As for P3, the oxide scales were composed of Ni and Fe oxides. Results of the EDX point analysis at P1, P2, and P3 are listed in Table 2 for all specimens. Based on the chemical compositions results, there was noteworthy Nb segregation, although Ni and Fe were depleted compared to the base metal. Thus, most NbO in P2 was grown underneath the Cr2O3 layer, which is much more obvious in the 0° and 90° specimens (Figure 7d,f and Figure 9a,c).
The higher-magnification oxide scales images of the three kinds of specimens oxidized at 700 and 1000 °C for 100 h respectively, are shown in Figure 10. Short columnar oxide grains can be seen on the oxide scales after oxidized at 700 °C. Besides, the size of the oxide grains distributed evenly, while the oxide grains of the 55° specimens were the smallest and the most compact in the three specimens (Figure 10b). Nevertheless, no apparent difference in the morphology of the oxide scale was seen among all the specimens (Figure 10d–f) oxidized at 1000 °C. All specimens were characterized by compact leaflike oxide scales.

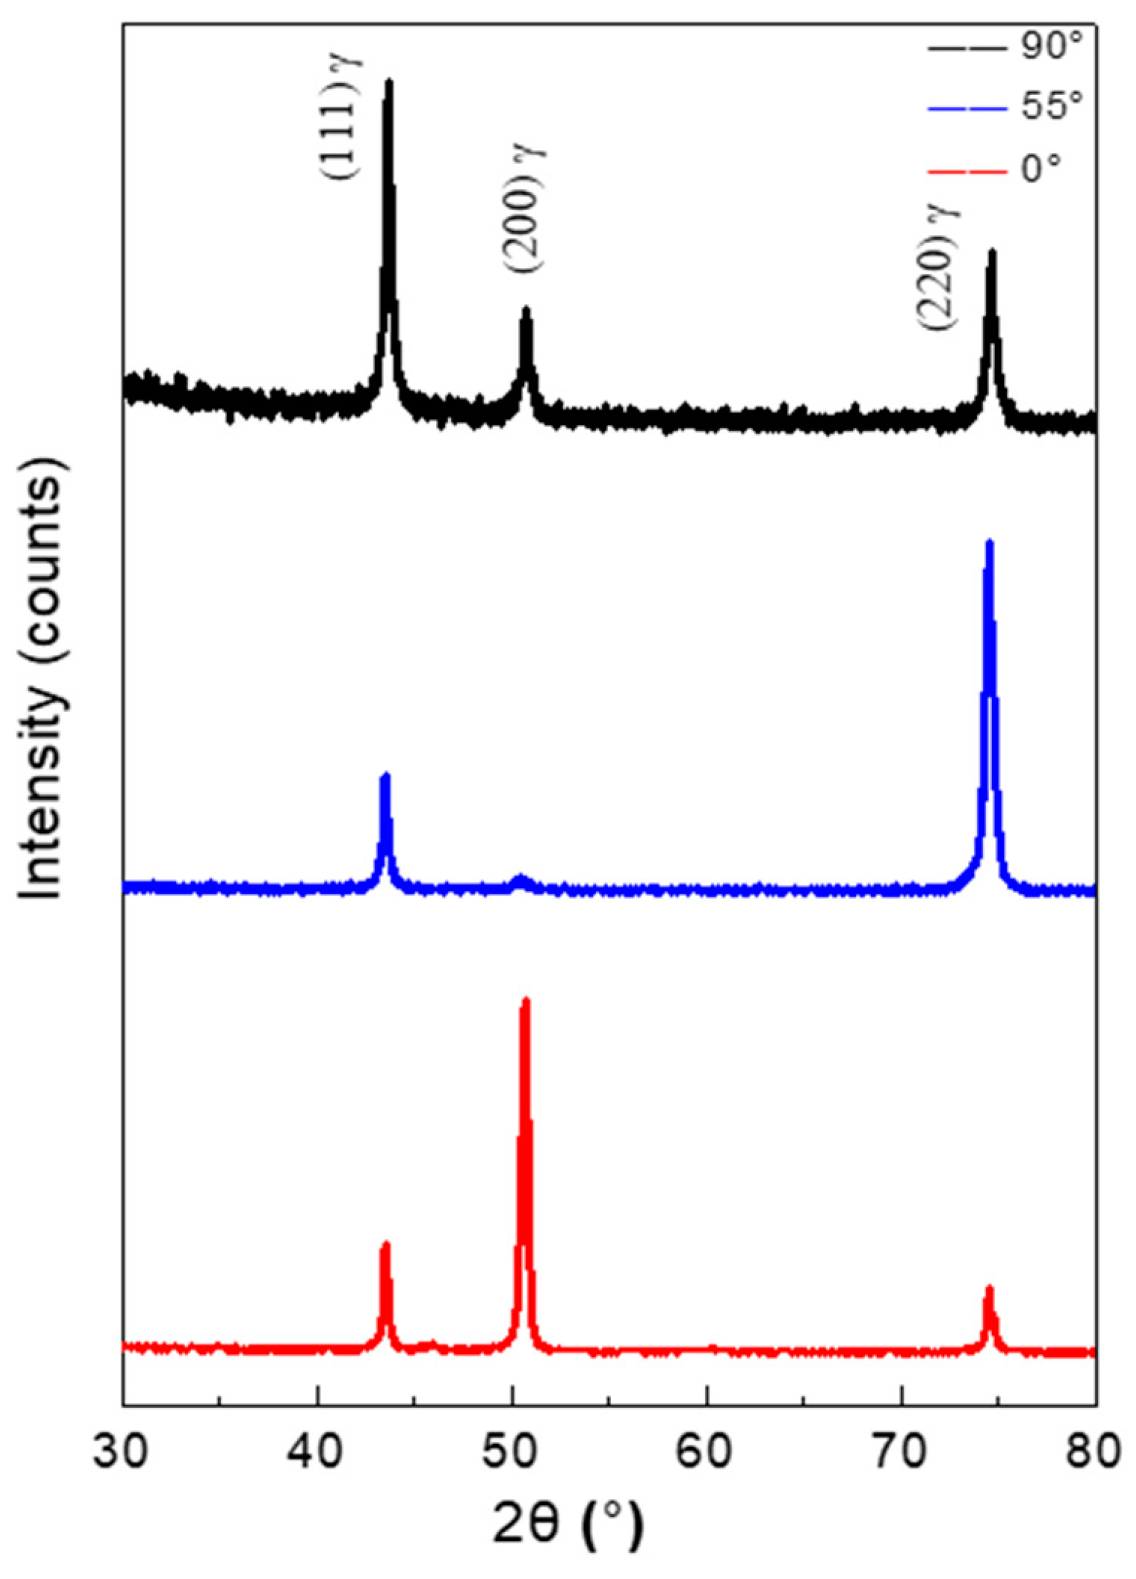
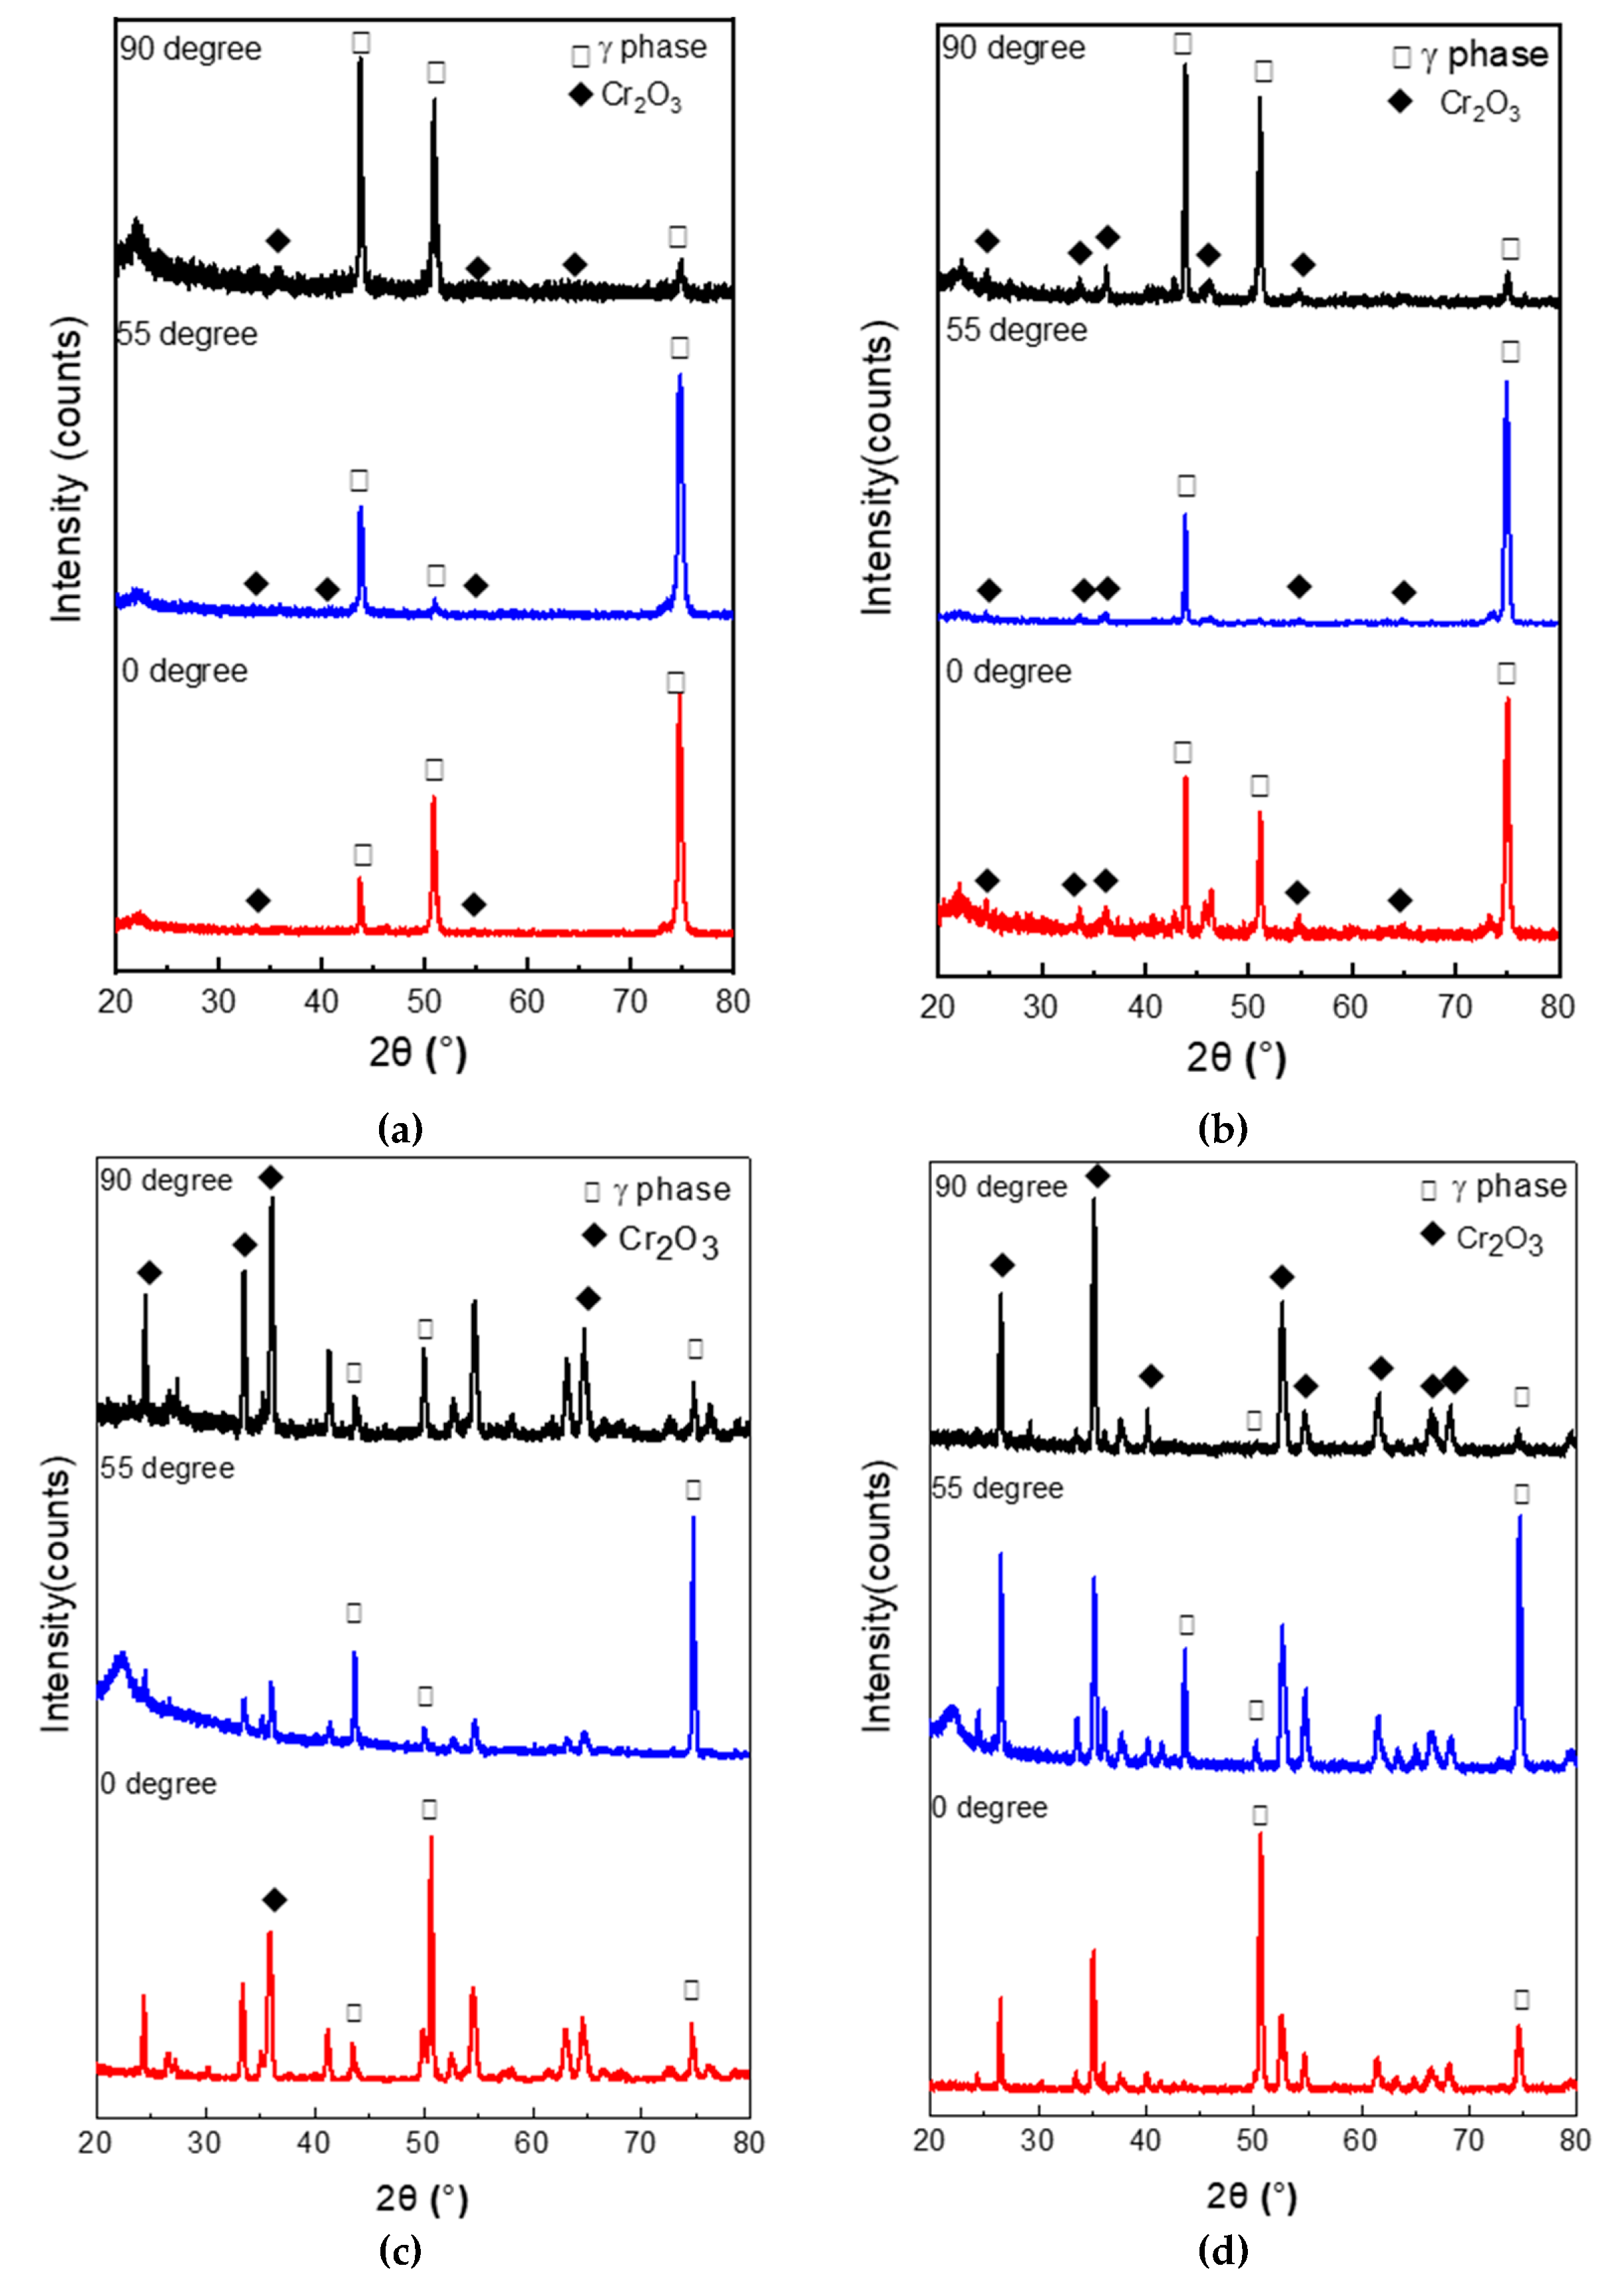
3.3. Phase Analysis of Oxide Scales

The XRD analysis shown in Figure 11a–d presents the oxides of the three kinds of specimens after being oxidized at 700 and 1000 °C for 4 and 100 h, respectively. The results indicate that the oxides formed a protective oxide Cr2O3, even when the alloy was oxidized only for 4 h, at 700 °C. When the specimens were oxidized for a short time and low temperature, the alloy substrate accounted for the major proportion according to relative peak intensity in the three specimens. Besides, as shown in Figure 11b–d, the higher the temperature and the longer the time, the stronger the intensity of Cr2O3. Combining the previous EDS results with the XRD analysis, the presence of NbO was not examined by XRD in the 0° and 55° specimens, perhaps owing to the low concentration of NbO underneath the oxide scales or the thick Cr2O3 scale over the NbO scale.

3.4. Cross-Section Profiles

Oxide scale thicknesses of the three kinds of specimens at various temperatures and oxidation times were analyzed by SEM. The SEM images of cross-sectional specimens after oxidation ranging from 700 to 1000 °C for 100 h are shown in Figure 12. The oxide scale defects like cracks and spallation were observed frequently in both 0° specimens and 90° specimens. Furthermore, the formation of defects (cracks or pores) at the interface between the oxide layer and alloy substrate in the two specimens was detected frequently. For 55° specimens, continuous oxide scales without crack were examined, no matter what the oxidation condition was. No apparent separation at the oxide-scale-alloy interface was detected. Figure 13 shows the elemental distribution maps of the cross-sectional 55° specimens under the condition of 1000 °C for 100 h. The outermost layer of oxide scales primarily consisted of Cr oxides, from the XRD results, we could conclude that Cr oxides are a Cr2O3 film. Additionally, Nb oxides and Mo oxides were present below the Cr2O3 film.

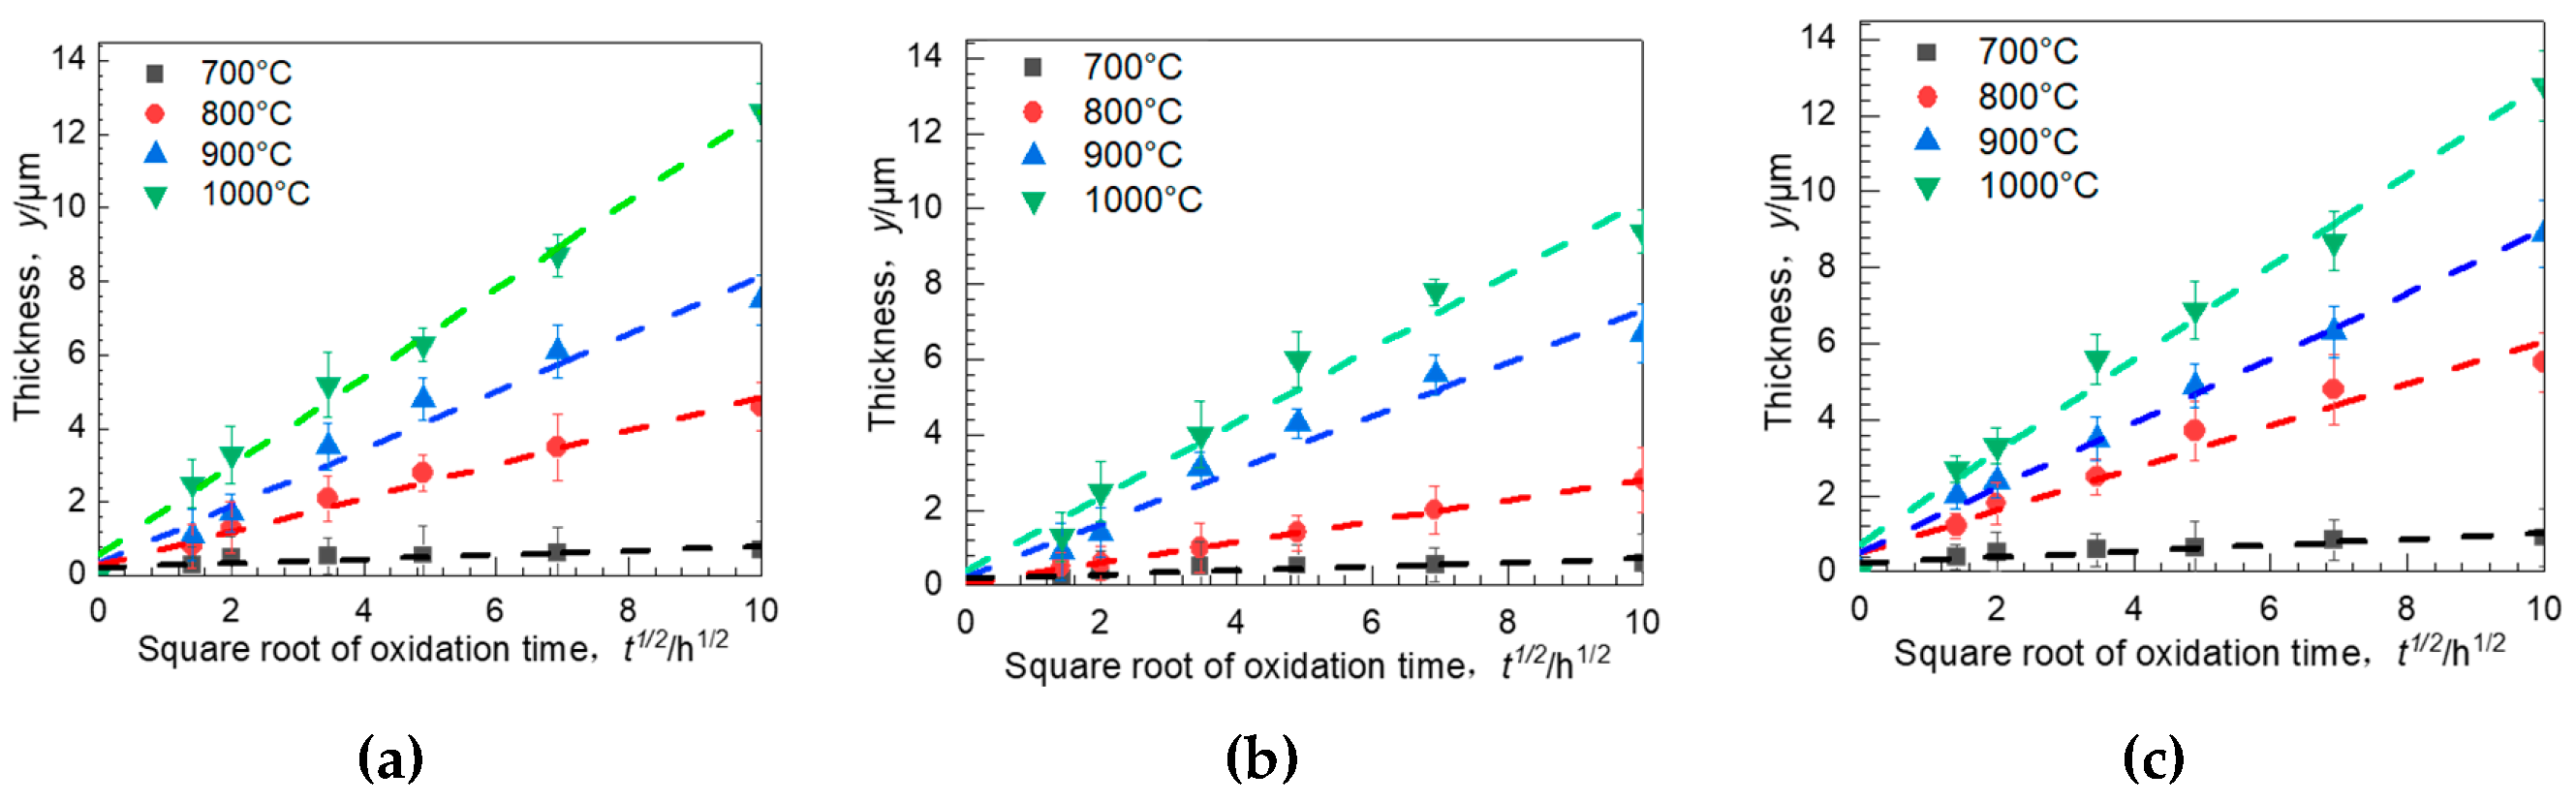
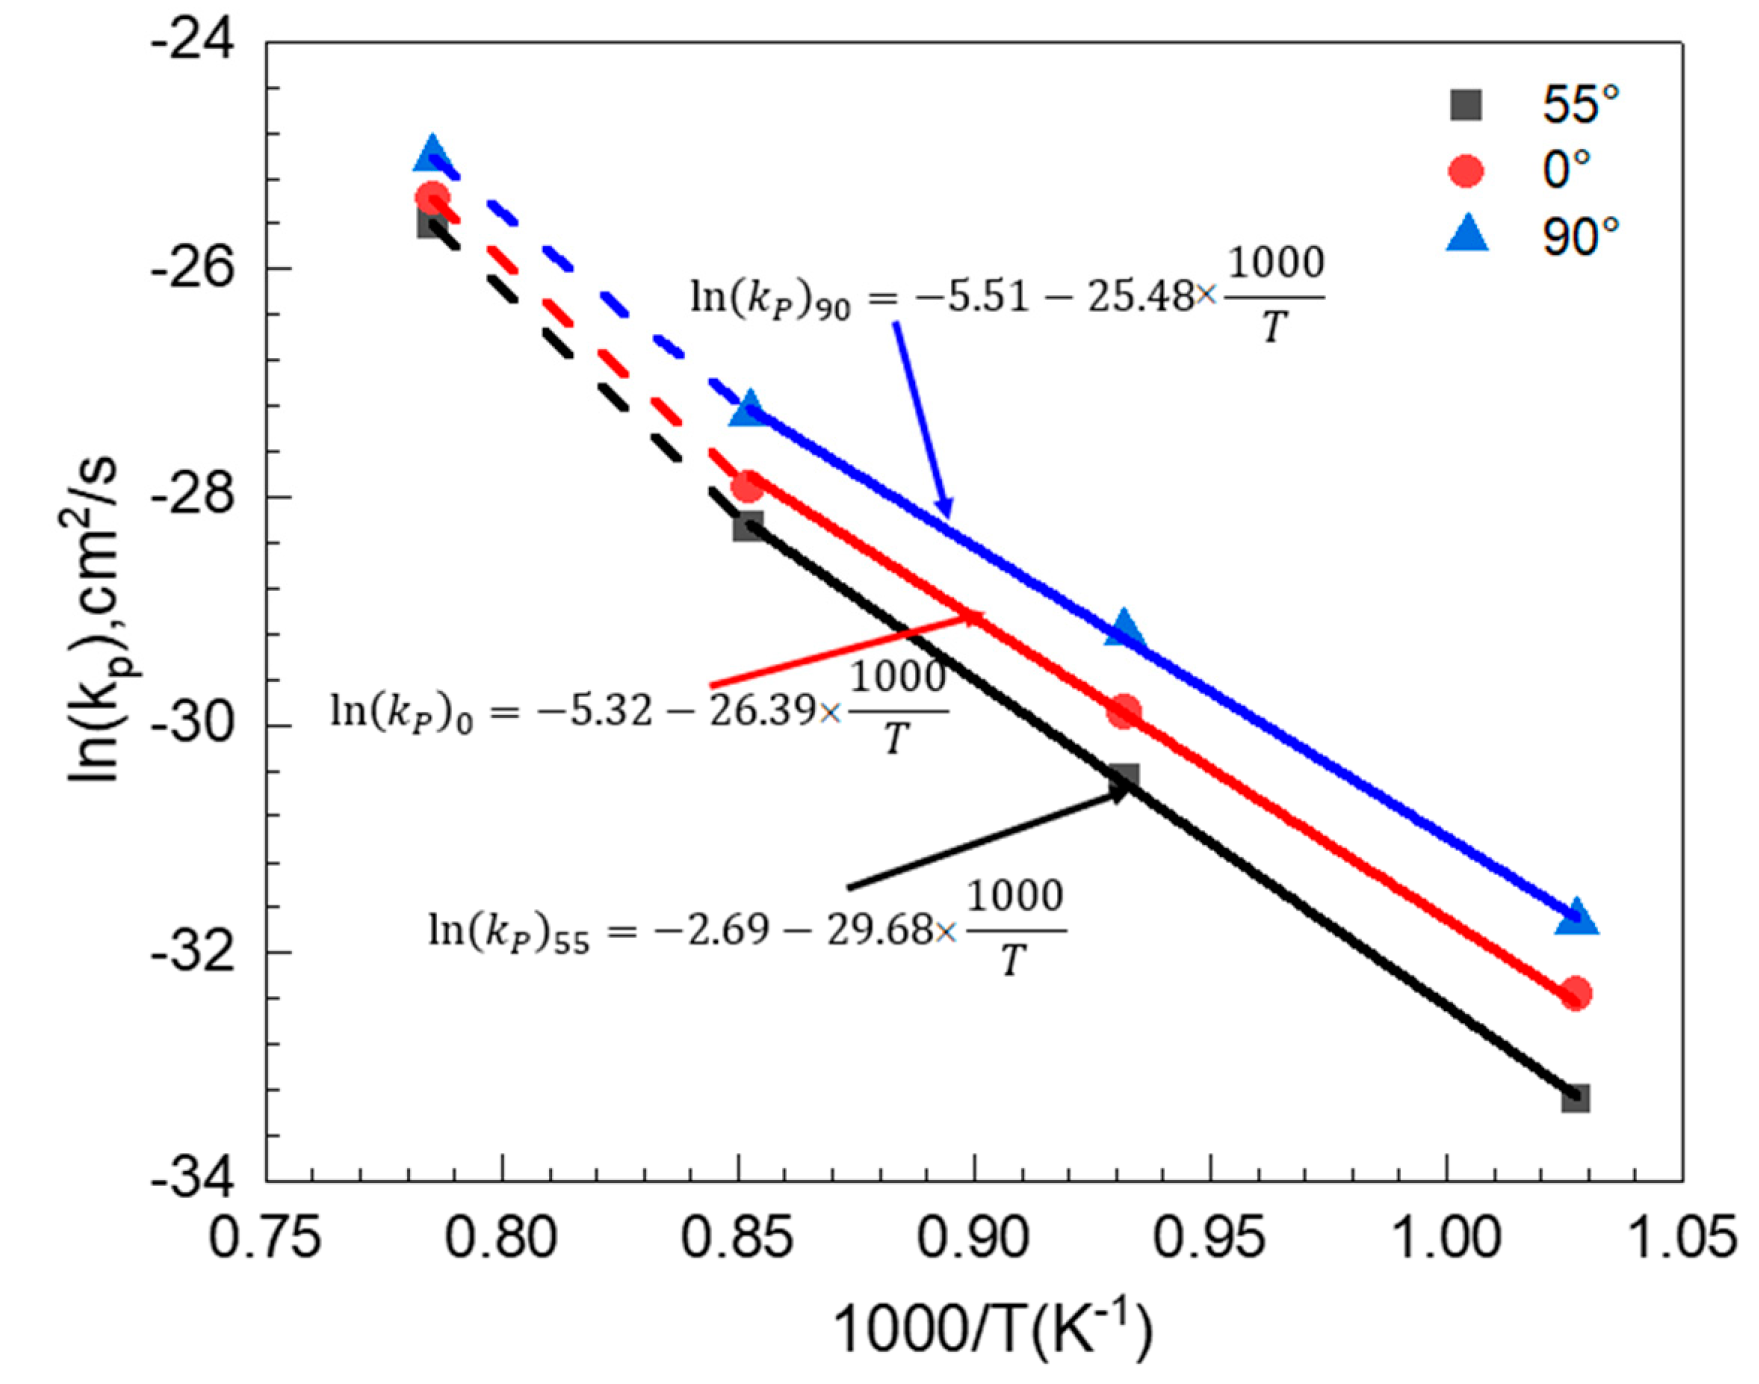
3.5. Oxidation Kinetics

Oxide thickness as a function of oxidation duration for all the specimens are shown in Figure 14. Apparently, the relationship between the Oxide thickness and oxidation temperature/time in our case may conclude with the following equation [25]:
d x d t = k p x
where x stands for the thickness of oxide scales, t represents the oxidation duration, and kp means the parabolic rate constant. Comparing to the rapid oxidation in the early time in all conditions, the growth speed of the oxide-scale thickness instantly decelerated. From the oxidation kinetic curves, we can see that when the oxidation temperature is higher by 100 °C, the thickness of oxide scales could grow more than twice, indicating the important influence of the oxidation temperature. Moreover, under the same condition, the oxide thickness of both 0° specimens and 90° specimens were much higher than that of the 55° specimens. According to Equation (1), the following equation can be derived.
x = 2 k p t 1 2
Table 3 lists the values of kp at each temperature and building direction together with the correlation coefficient value, r2. The values of r2 of the values of kp ranged from 0.90 to 0.99, indicating that the parabolic oxidation law is reasonably applicable to the oxidation behavior. The parabolic rate constant kp depends on temperature according to the Arrhenius equation [26],
k p =   k 0   exp   ( Q R T ) k p =   k 0   exp   ( Q R T )
where k0 represents a constant, Q stands for the activation energy of oxidation, T means the absolute temperature in Kelvin, and R is the universal gas constant. Figure 15 shows the Arrhenius plot for the oxidation of EBM-In718 alloys, the activation energy of the oxidation can be calculated by presenting the variation of kp from the fitting lines. They can be evidently divided into two stages: The high temperature stage (900–1000 °C) and the low temperature stage in the remainder (700–900 °C). For the 0° specimens and 90° specimens, the activation energies were respectively analyzed to be 219.39 and 211.84 kJ/mol when the oxidation temperature was under 900 °C. However, the activation energy of the 55° specimens was higher (246.78 kJ/mol), suggesting that 55° specimens underwent slower oxidation. For the high temperature stage, the activation energy of the specimens is higher but still satisfies the following relation: 90° < 0° < 55°. Hence, the oxide thickness of the EBM-In718 alloys at various temperatures was strongly dependent on the building direction.

4. Discussion

It can be concluded from the results that changing the building direction of EBM-In718 alloys has obvious effects on oxidation behavior. The oxidation resistance of EBM-In718 alloys is in the order of 90° < 0° < 55°. To explain the build direction dependence of the oxidation behavior of EBM-In718 alloys, the anisotropies of EBM-In718 alloy in crystal orientation and grain boundary length density with different build directions need to be considered. In addition, the oxide scale defects (cracks and spallation) could be deeply avoided when alloys were built at 55°, particularly after higher oxidation temperature or longer oxidation time.

4.1. Oxidation Behavior of EBM-In718 Alloys

The characteristic of the oxide scale in all specimens was greatly influenced by oxidation condition. As Figure 11 shows, the intensity of alloy substrate is extremely weak when the specimens were oxidized at higher temperature and/or longer oxidation time, which indicates the growth of oxide scales. In addition, this phenomenon is in accordance with the color change of the oxide scale, indicating the color change is strictly affected by the growth of the oxide scales. However, the great influence of oxide scale composition on its color cannot be ignored, which is in accordance with the XRD results (Figure 11). From Figure 11, it can be seen that the peak intensities of Cr2O3 oxides is dissimilar in different oxidation conditions. The high temperature oxidation behavior of In718 alloys has been widely studied for many years [27,28,29,30]. It is reported that the oxidation resistance of a Ni-based system is mainly controlled by oxidation conditions such as the temperature, the time, and the quantity of Cr element [28,31]. When the oxidation temperature is low (700 °C), the initial oxidation may be affected by the simultaneous development of both Cr2O3 and NbO oxide in the three kinds of EBM-In 718 alloys. Finally, the oxide scales would gradually grow into a Cr2O3-dominant scale. Consequently, with the Cr2O3-dominant scale formed by the selective oxidation of Cr, the oxygen partial pressure in the oxide scale comes to be considerably lower than that in air. As a result, the initial oxidation occurred by the simultaneous formation of NiO, Cr2O3, and MoO3 scale. As the oxidation time increased, NiO and MoO3 were gradually replaced by Cr2O3, forming a single-layered Cr2O3 scale no more than 24 h. When the oxidation temperature was high, Cr2O3 scales rapidly formed and covered the specimen surface within a short oxidation time. As the EDS mapping analysis of Figure 13 shows, with the oxidation time up to 100 h, a Cr-depleted region formed owing to the decrease in Cr concentration under the oxide scale. The thickness of the Cr2O3 scale after prolonged oxidation would increase with the higher temperature. As the diffusion coefficient of the Cr element was higher in the grain boundary than that in the alloy substrate, the concentration of Cr in the grain boundary would be considerably lower than that prior to oxidation with the increase in oxidation time. Horita et al. have reported that as a consequence of the rapid thickening of the outermost oxide scale at high temperature, the oxygen diffusion through the scale was greatly hindered [32], as clearly indicated by the decreasing amount of oxygen in the image of O element in Figure 13. From Figure 9, oxide scales formed on the specimen oxidized at 700 and 1000 °C for 100 h were mainly Cr2O3.

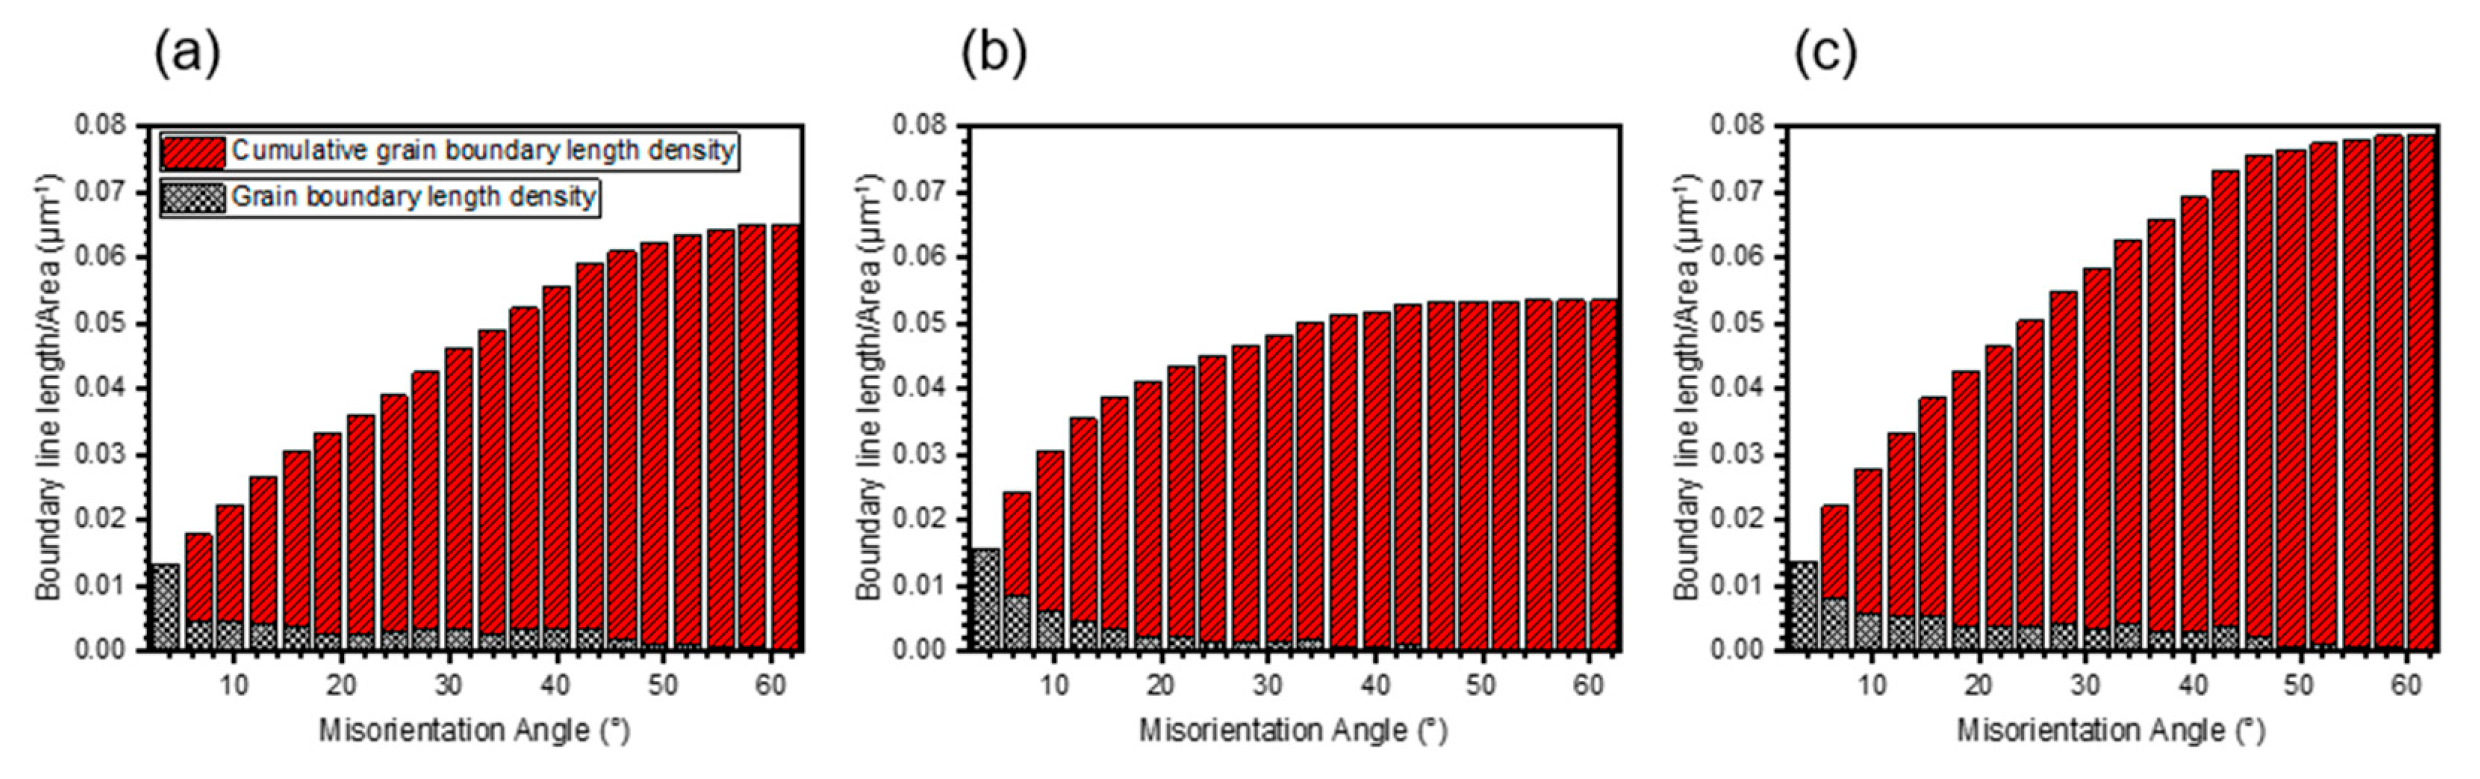
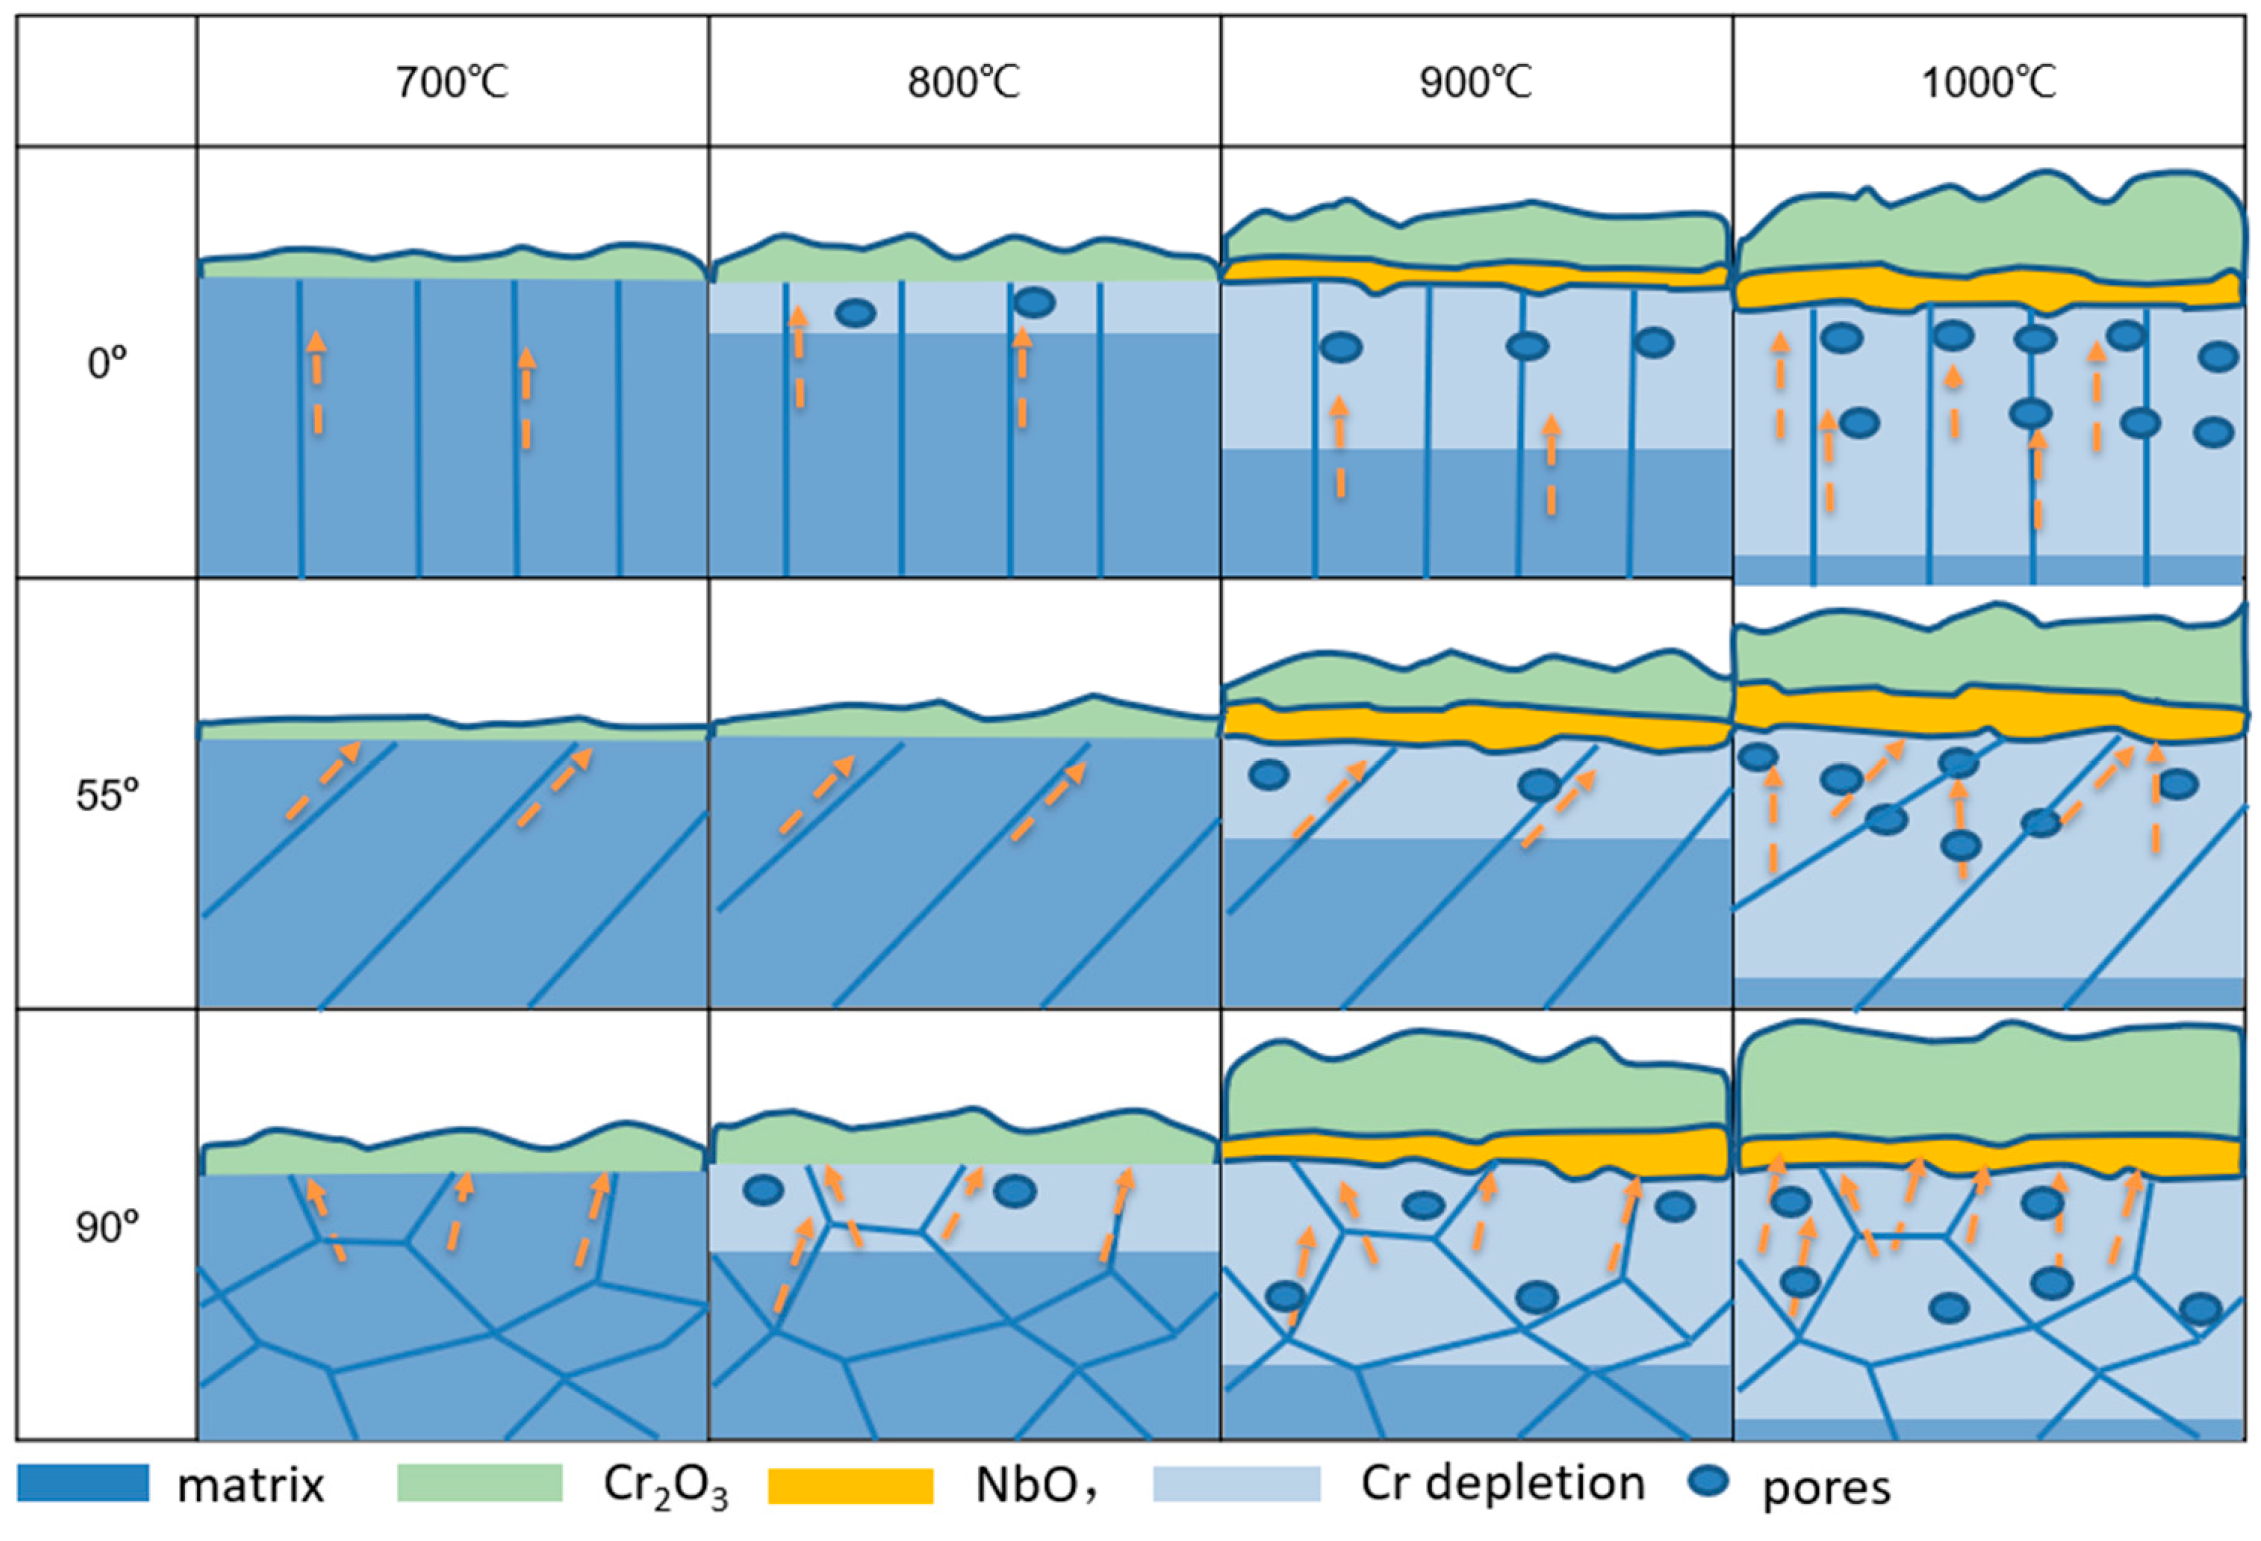
4.2. Effect of Grain Boundary Density on Scale Growth

The grain boundaries are the preferred sites for oxidation [33]. At grain boundaries, the arrangement of atoms is irregular, and the distribution of composition is non-uniform, which make it easy to oxidize. Furthermore, the oxidation behavior was significantly affected by the elements’ diffusion. The diffusion can be divided into two types: Lattice diffusion and grain boundary diffusion. From our present results, the oxide scales were mainly composed of Cr2O3 and NbO. The growth of Cr2O3 scales was influenced by Cr diffusion. In this case, the active energy of oxidation can be divided into two stages, which means the Cr diffusion types were different in various temperatures. When oxidation temperature was below 1000 °C, the Cr diffusion was grain boundary diffusion, and the grain boundary length densities of the specimens are in the order of 90° > 0° > 55°. The 55° sample has the smallest grain boundary densities, so it is the hardest for Cr diffusion, which means it is difficult to oxidize. In addition, Nb is difficult for outward transport, so the outward transport of Cr is generally suppressed by the NbO scale formed at the grain boundary.
On basis of the above discussion, the oxidation mechanisms of EBM-In718 alloys with different build direction are schematically interpreted in Figure 16. The oxidation behavior of EBM-In718 alloys falls into two categories depending on oxidation temperature: Below 1000 °C, 1000 °C.
For all alloys in the low oxidation temperature, the outer layer of oxide scale is the Cr2O3 layer, meanwhile a thin and continuous NbO layer can be seen under Cr2O3 layer. The developing of Cr2O3 is mainly by the transport of Cr atoms along the grain boundaries. Therefore the 55° sample, has the least grain boundaries, and is the most difficult to be oxidized.
When oxidation temperature increases to 1000 °C, the formation of oxide scale is the same as the low temperature situation. The only difference is that the transport of Cr atoms is both along the grain boundaries and bulk grains. Therefore, the oxidation in 1000 °C has no distinct difference.

5. Conclusions

The microstructure and high temperature oxidation behavior of Inconel 718 alloys fabricated by EBM in various build directions are systemically studied. Based on the above results, the following conclusions were drawn:
(1) The microstructure of the Inconel 718 alloy fabricated by EBM mainly consists of γ-fcc phase with preferential crystal orientations in various build directions.
(2) The higher the grain boundary length density is, the worse oxidation resistance the alloy shows. The 55° specimen demonstrates the highest oxidation resistance at various temperatures 700, 800, 900 and 1000 °C, owing to its lowest grain boundary length density.
(3) The anisotropy in grain orientation has little effect on the oxidation behavior of the EBM-In718 alloys.

Author Contributions

Conceptualization, Y.L. and Q.L.; Methodology, X.G., J.T. and X.Y.; Investigation, L.L. and Y.N.; Writing-Original Draft Preparation, L.L., Y.L. and Q.L.; Writing-Review & Editing, L.L., Y.L. and Q.L.

Funding

The authors gratefully acknowledge the financial support from project of The National Natural Science Funds (51871244), The Science Fund for Distinguished Young Scholars of Hunan Province, China (2016JJ1016) and the Special Funds for Future Industrial Development of Shenzhen (No. HKHTZD20140702020004).

Conflicts of Interest

The authors declare no conflict of interest.

References

  1. Decker, R.F. Strengthening Mechanisms in Nickel-Base Superalloys. In Proceedings of the Steel Strengthening Mechanisms Symposium, Zurich, Switzerland, 5–6 May 1969; pp. 1–23. [Google Scholar]
  2. Patterson, R.J.; Cox, A.R.; van Reuth, E.C. Rapid Solidification Rate Processing and Application to Turbine Engine Materials. JOM 2014, 32, 34–39. [Google Scholar] [CrossRef]
  3. Acharya, R.; Bansal, R.; Gambone, J.J.; Kaplan, M.A.; Fuchs, G.E.; Rudawski, N.G.; Das, S. Additive Manufacturing and Characterization of René 80 Superalloy Processed Through Scanning Laser Epitaxy for Turbine Engine Hot-Section Component Repair. Adv. Eng. Mater. 2015, 17, 942–950. [Google Scholar] [CrossRef]
  4. Christian, S.; Zimmermann, M.; HansJürgen, C. Effect of precipitation condition, prestrain and temperature on the fatigue behaviour of wrought nickel-based superalloys in the vhcf range. Acta Mater. 2011, 59, 5288–5304. [Google Scholar]
  5. Paa-Rai, C.; Norachan, J.; Wangyao, P.; Polsilapa, S.; Lothongkum, G. Effect of Long-Term Aging on Microstructural Restoration in Cast Nickel Base Superalloy, GTD-111. Mater. Sci. Forum 2017, 891, 426–432. [Google Scholar] [CrossRef]
  6. Rezaie, A.; Vahdat, S.E. Study of Effects of Temperature and Pressure in HIP Process on Mechanical Properties of Nickel-based Superalloys. Mater. Today 2017, 4, 152–156. [Google Scholar] [CrossRef]
  7. Yu, B.; Li, Y.; Nie, Y.; Mei, H. High temperature oxidation behavior of a novel cobalt-nickel-base superalloy. J. Alloys Compd. 2018, 765, 1148–1157. [Google Scholar] [CrossRef]
  8. Li, Y.; Ye, X.; Li, J.; Zhang, Y.; Koizumi, Y.; Chiba, A. Influence of cobalt addition on microstructure and hot workability of IN713C superalloy. Mater. Des. 2017, 122, 340–346. [Google Scholar] [CrossRef]
  9. Zhang, D.Y.; Niu, W.; Cao, X.Y.; Liu, Z. Effect of standard heat treatment on the microstructure and mechanical properties of selective laser melting manufactured Inconel 718 superalloy. Mater. Sci. Eng. A 2015, 644, 32–40. [Google Scholar] [CrossRef]
  10. Helmer, H.E.; Körner, C.; Singer, R.F. Additive manufacturing of nickel-based superalloy Inconel 718 by selective electron beam melting: Processing window and microstructure. J. Mater. Res. 2014, 29, 1987–1996. [Google Scholar] [CrossRef]
  11. Mumtaz, K.A.; Hopkinson, N.; Stapleton, D.; Todd, I.; Derguti, F.; Vora, P. Benchmarking metal powder bed Additive Manufacturing processes (SLM and EBM) to build flat overhanging geometries without supports. In Proceedings of the Solid Freeform Fabrication Symposium, Austin, TX, USA, 6–8 August 2012. [Google Scholar]
  12. Guillen, G.; Marisela, S. Fundamental studies of Cobalt-base superalloy biomedical prototypes fabricated by electron beam melting: microstructures and microstructural architecture. Ph.D. Thesis, The University of Texas at El Paso, El Paso, TX, USA, December 2011. [Google Scholar]
  13. Gong, X.; Li, Y.; Nie, Y.; Huang, Z.; Liu, F.; Huang, L.; Jiang, L.; Mei, H. Corrosion behaviour of CoCrMo alloy fabricated by electron beam melting. Corros. Sci. 2018, 139, 68–75. [Google Scholar] [CrossRef]
  14. Bian, H.; Li, Y.; Wei, D.; Cui, Y.; Wang, F.; Sun, S.; Yamanaka, K.; Koizumi, Y.; Chiba, A. Precipitation behavior of a novel cobalt-based superalloy subjected to prior plastic deformations. Mater. Des. 2016, 112, 1–10. [Google Scholar] [CrossRef]
  15. Strondl, A.; Palm, M.; Gnauk, J.; Frommeyer, G. Microstructure and mechanical properties of nickel based superalloy IN718 produced by rapid prototyping with electron beam melting (EBM). Mater. Sci. Technol. 2011, 27, 876–883. [Google Scholar] [CrossRef]
  16. Hrabe, N.; Gnäupel-Herold, T.; Quinn, T. Fatigue properties of a titanium alloy (Ti-6Al-4V) fabricated via electron beam melting (EBM): Effects of internal defects and residual stress. Int. J. Fatigue 2016, 94, 202–210. [Google Scholar] [CrossRef]
  17. Gong, X.; Cui, Y.; Wei, D.; Liu, B.; Liu, R.; Nie, Y.; Li, Y. Building Direction Dependence of Corrosion Resistance Property of Ti-6Al-4V Alloy Fabricated by Electron Beam Melting. Corros. Sci. 2017, 127, 101–109. [Google Scholar] [CrossRef]
  18. Qi, H.B.; Yan, Y.N.; Lin, F.; He, W.; Zhang, R.J. Direct metal part forming of 316L stainless steel powder by electron beam selective melting. Proc. Inst. Mech. Eng. B-J. Eng. Manuf. 2006, 220, 1845–1853. [Google Scholar] [CrossRef]
  19. Zhong, Y.; Rännar, L.E.; Liu, L.; Koptyug, A.; Wikman, S.; Olsen, J.; Cui, D.; Shen, Z. Additive manufacturing of 316L stainless steel by electron beam melting for nuclear fusion applications. J. Nucl. Mater. 2017, 486, 234–245. [Google Scholar] [CrossRef]
  20. Hinojos, A.; Mireles, J.; Reichardt, A.; Frigola, P.; Hosemann, P.; Murr, L.E.; Wicker, R.B. Joining of Inconel 718 and 316 Stainless Steel using electron beam melting additive manufacturing technology. Mater. Des. 2016, 94, 17–27. [Google Scholar] [CrossRef] [Green Version]
  21. Mahale, T.R. Electron beam melting of advanced materials and structures. Ph.D. Thesis, North Carolina State University, Raleigh, NC, USA, December 2009. [Google Scholar]
  22. Liu, Y.J.; Li, S.J.; Wang, H.L.; Hou, W.T.; Hao, Y.L.; Yang, R.; Sercombe, T.B.; Zhang, L.C. Microstructure, defects and mechanical behavior of beta-type titanium porous structures manufactured by electron beam melting and selective laser melting. Acta Mater. 2016, 113, 56–67. [Google Scholar] [CrossRef]
  23. Strondl, A.; Fischer, R.; Frommeyer, G.; Schneider, A. Investigations of MX and γ′/γ″ precipitates in the nickel-based superalloy 718 produced by electron beam melting. Mater. Sci. Eng. A 2008, 480, 138–147. [Google Scholar] [CrossRef]
  24. Sun, S.H.; Koizumi, Y.; Saito, T.; Yamanaka, K.; Li, Y.-P.; Cui, Y.; Chiba, A. Electron beam additive manufacturing of Inconel 718 alloy rods: Impact of build direction on microstructure and high-temperature tensile properties. Addit. Manuf. 2018, 23, 457–470. [Google Scholar] [CrossRef]
  25. Mrowec, S.; Stokłosa, A. Calculations of parabolic rate constants for metal oxidation. Oxid. Met. 1974, 8, 379–391. [Google Scholar] [CrossRef]
  26. Tunthawiroon, P.; Li, Y.; Chiba, A. Influences of alloyed Si on the corrosion resistance of Co-Cr-Mo alloy to molten Al by iso-thermal oxidation in air. Corros. Sci. 2015, 100, 428–434. [Google Scholar] [CrossRef]
  27. Ter-Ovanessian, B.; Poquillon, D.; Cloué, J.M.; Andrieu, E. Influence of local mechanical loading paths on the oxidation assisted crack initiation of alloy 718. Mater. Sci. Eng. A 2012, 533, 43–49. [Google Scholar] [CrossRef] [Green Version]
  28. Connolley, T.; Reed, P.A.S.; Starink, M.J. Short crack initiation and growth at 600 °C in notched specimens of Inconel718. Mater. Sci. Eng. A 2003, 340, 139–154. [Google Scholar] [CrossRef]
  29. Greene, G.A.; Finfrock, C.C. Oxidation of Inconel 718 in Air at High Temperatures. Oxid. Met. 2001, 55, 505–521. [Google Scholar] [CrossRef]
  30. Berthier, C.; Lenglet, M.; Lameille, J.M. SEM-EDS and XPS Studies of the High Temperature Oxidation Behaviour of Inconel 718. Microchim. Acta 2000, 132, 337–343. [Google Scholar]
  31. Cruchley, S.; Evans, H.; Taylor, M. An overview of the oxidation of Ni-based superalloys for turbine disc applications: surface condition, applied load and mechanical performance. High. Temp. Technol. 2016, 33, 465–475. [Google Scholar] [CrossRef]
  32. Horita, T.; Kishimoto, H.; Yamaji, K.; Xiong, Y.; Brito, M.E.; Yokokawa, H.; Baba, Y.; Ogasawara, K.; Kameda, H.; Matsuzaki, Y. Diffusion of oxygen in the scales of Fe-Cr alloy interconnects and oxide coating layer for solid oxide fuel cells. Solid State Ion. 2008, 179, 2216–2221. [Google Scholar] [CrossRef]
  33. Li, Y.; Tunthawiroon, P.; Tang, N.; Bian, H.; Wang, F.; Sun, S.; Chen, Y.; Omura, K.; Koizumi, Y.; Chiba, A. Effects of Al, Ti, and Zr doping on oxide film formation in Co-29Cr-6Mo alloy used as mould material for Al die-casting. Corros. Sci. 2014, 84, 147–158. [Google Scholar] [CrossRef]
Figure 1. Schematic representation of three-dimensional diagram of electron beam melting (EBM)-In718 alloy columnar specimens with a size of (Φ15 × 85 mm) and the planes used for experiments: (a) 0° sample; (b) 55° sample and (c) 90° sample.
Materials 11 02549 g001
Figure 2. Sheet specimens cut from the middle sections of the Inconel 718 rods.
Materials 11 02549 g002
Figure 3. X-ray diffraction (XRD) patterns for the 0°, 55°and 90° specimens of the EBM-In718 alloys.
Materials 11 02549 g003
Figure 4. Electron backscatter diffraction (EBSD) inverse polar figure (IPF) maps (a,b,c) and image quality (IQ) + phase maps (d,e,f) of the EBM-In718 specimens: (a,d) 0° sample; (b,e) 55° sample and (c,f) 90° sample.
Materials 11 02549 g004
Figure 5. Grain size distributions in the vertical cross-section of EBM-In718 specimens: (a) 0° sample; (b) 55° sample and (c) 90° sample.
Materials 11 02549 g005
Figure 6. Distributions of grain boundary length density and cumulative grain boundary length density as a function of misorientation angle obtained from EBSD analysis: (a) 0° sample; (b) 55° sample and (c) 90° sample.
Materials 11 02549 g006
Figure 7. Surface morphology of alloys after oxidation at 700 °C for 4 and 100 h: (a,d) 0° sample; (b,e) 55° sample; (c,f) 90° sample.
Materials 11 02549 g007
Figure 8. Surface morphology of alloys after oxidation at 1000 °C for 4 and 100 h: (a,d) 0° sample; (b,e) 55° sample; (c,f) 90° sample.
Materials 11 02549 g008
Figure 9. Elemental distribution maps of oxide surface after oxidation at 1000 °C for 100 h: (a) 0° sample; (b) 55° sample; (c) 90° sample.
Materials 11 02549 g009
Figure 10. Surface morphology of alloys after oxidation for 100 h at 700 and 1000 °C: (a,d) 0° sample; (b,e) 55° sample; (c,f) 90° sample.
Materials 11 02549 g010
Figure 11. XRD patterns of the three alloys after oxidation at (a) 700 °C for 4 h; (b) 700 °C for 100 h; (c) 1000 °C for 4 h, and (d) 1000 °C for 100 h.
Materials 11 02549 g011
Figure 12. Cross-sectional morphology of EBM-In 718 alloys after oxidation for 100 h at different temperatures.
Materials 11 02549 g012
Figure 13. Elemental distribution maps of cross-sectional surface of 55° specimens after oxidation at 1000 °C for 100 h under secondary electrons (SE) mode.
Materials 11 02549 g013
Figure 14. Oxide thickness as a function of oxidation duration for (a) 0° sample; (b) 55°sample, and (c) 90° sample after oxidization at 700, 800, 900, and 1000 °C.
Materials 11 02549 g014
Figure 15. Arrhenius plot for the oxidation of EBM-In718 alloys.
Materials 11 02549 g015
Figure 16. Oxidation mechanisms of EBM-In718 alloys with different build direction in high temperature for 100 h.
Materials 11 02549 g016
Table 1. Chemical composition of Inconel 718 powder (wt. %).
FeCrMoNbTiCoAlCNNi
17.819.42.974.880.840.100.480.03550.0077Bal.
Table 2. Energy-dispersive X-ray spectroscopy (EDS) point analysis results (wt. %) at points 1–3 for alloy specimens shown in Figure 7 (after oxidation at 700 °C for 4 h and 100 h) and Figure 9 (after oxidation at 1000 °C for 100 h).
ConditionAlloyP1P2P3
NiCrFeNbONiCrFeNbONiCrFeNbO
700 °C,
100 h
19.627.33.21.848.112.813.48.838.326.723.313.515.21.646.4
55°21.925.89.62.140.614.710.29.440.625.131.36.523.31.837.1
90°14.833.32.60.448.910.915.18.435.430.222.516.311.11.149
1000 °C,
100 h
13.432.55.31.347.59.59.36.145.329.827.57.619.21.144.6
55°15.728.87.51.646.410.78.66.551.622.633.17.124.61.533.7
90°9.237.63.80.948.58.810.15.539.236.425.410.218.30.745.4
Table 3. Square root of parabolic rate constant, correlation coefficient, and activation energy of EBM-In718 alloys.
Parabolic Constant 2 k p cm   s 1 / 2 ,   ( r 2 )   700 °C800 °C900 °C1000 °CQ kJ/mol
8.79 × 10⁻¹⁵ (0.9014)8.89 × 10⁻¹⁴ (0.9986)9.07 × 10⁻¹³ (0.9706)2.01 × 10⁻¹² (0.9645)219.39
55°3.88 × 10⁻¹⁵ (0.9786)6.54 × 10⁻¹⁴ (0.9801)7.04 × 10⁻¹³ (0.9687)1.34 × 10⁻¹² (0.9927)246.78
90°1.68 × 10⁻¹⁴ (0.9543)2.11 × 10⁻¹³ (0.9559)1.45 × 10⁻¹² (0.9914)3.11 × 10⁻¹² (0.9879)211.84

