3.1. Microstructures of As-Cast Mg-Al-Sn-Mn Magnesium Alloys
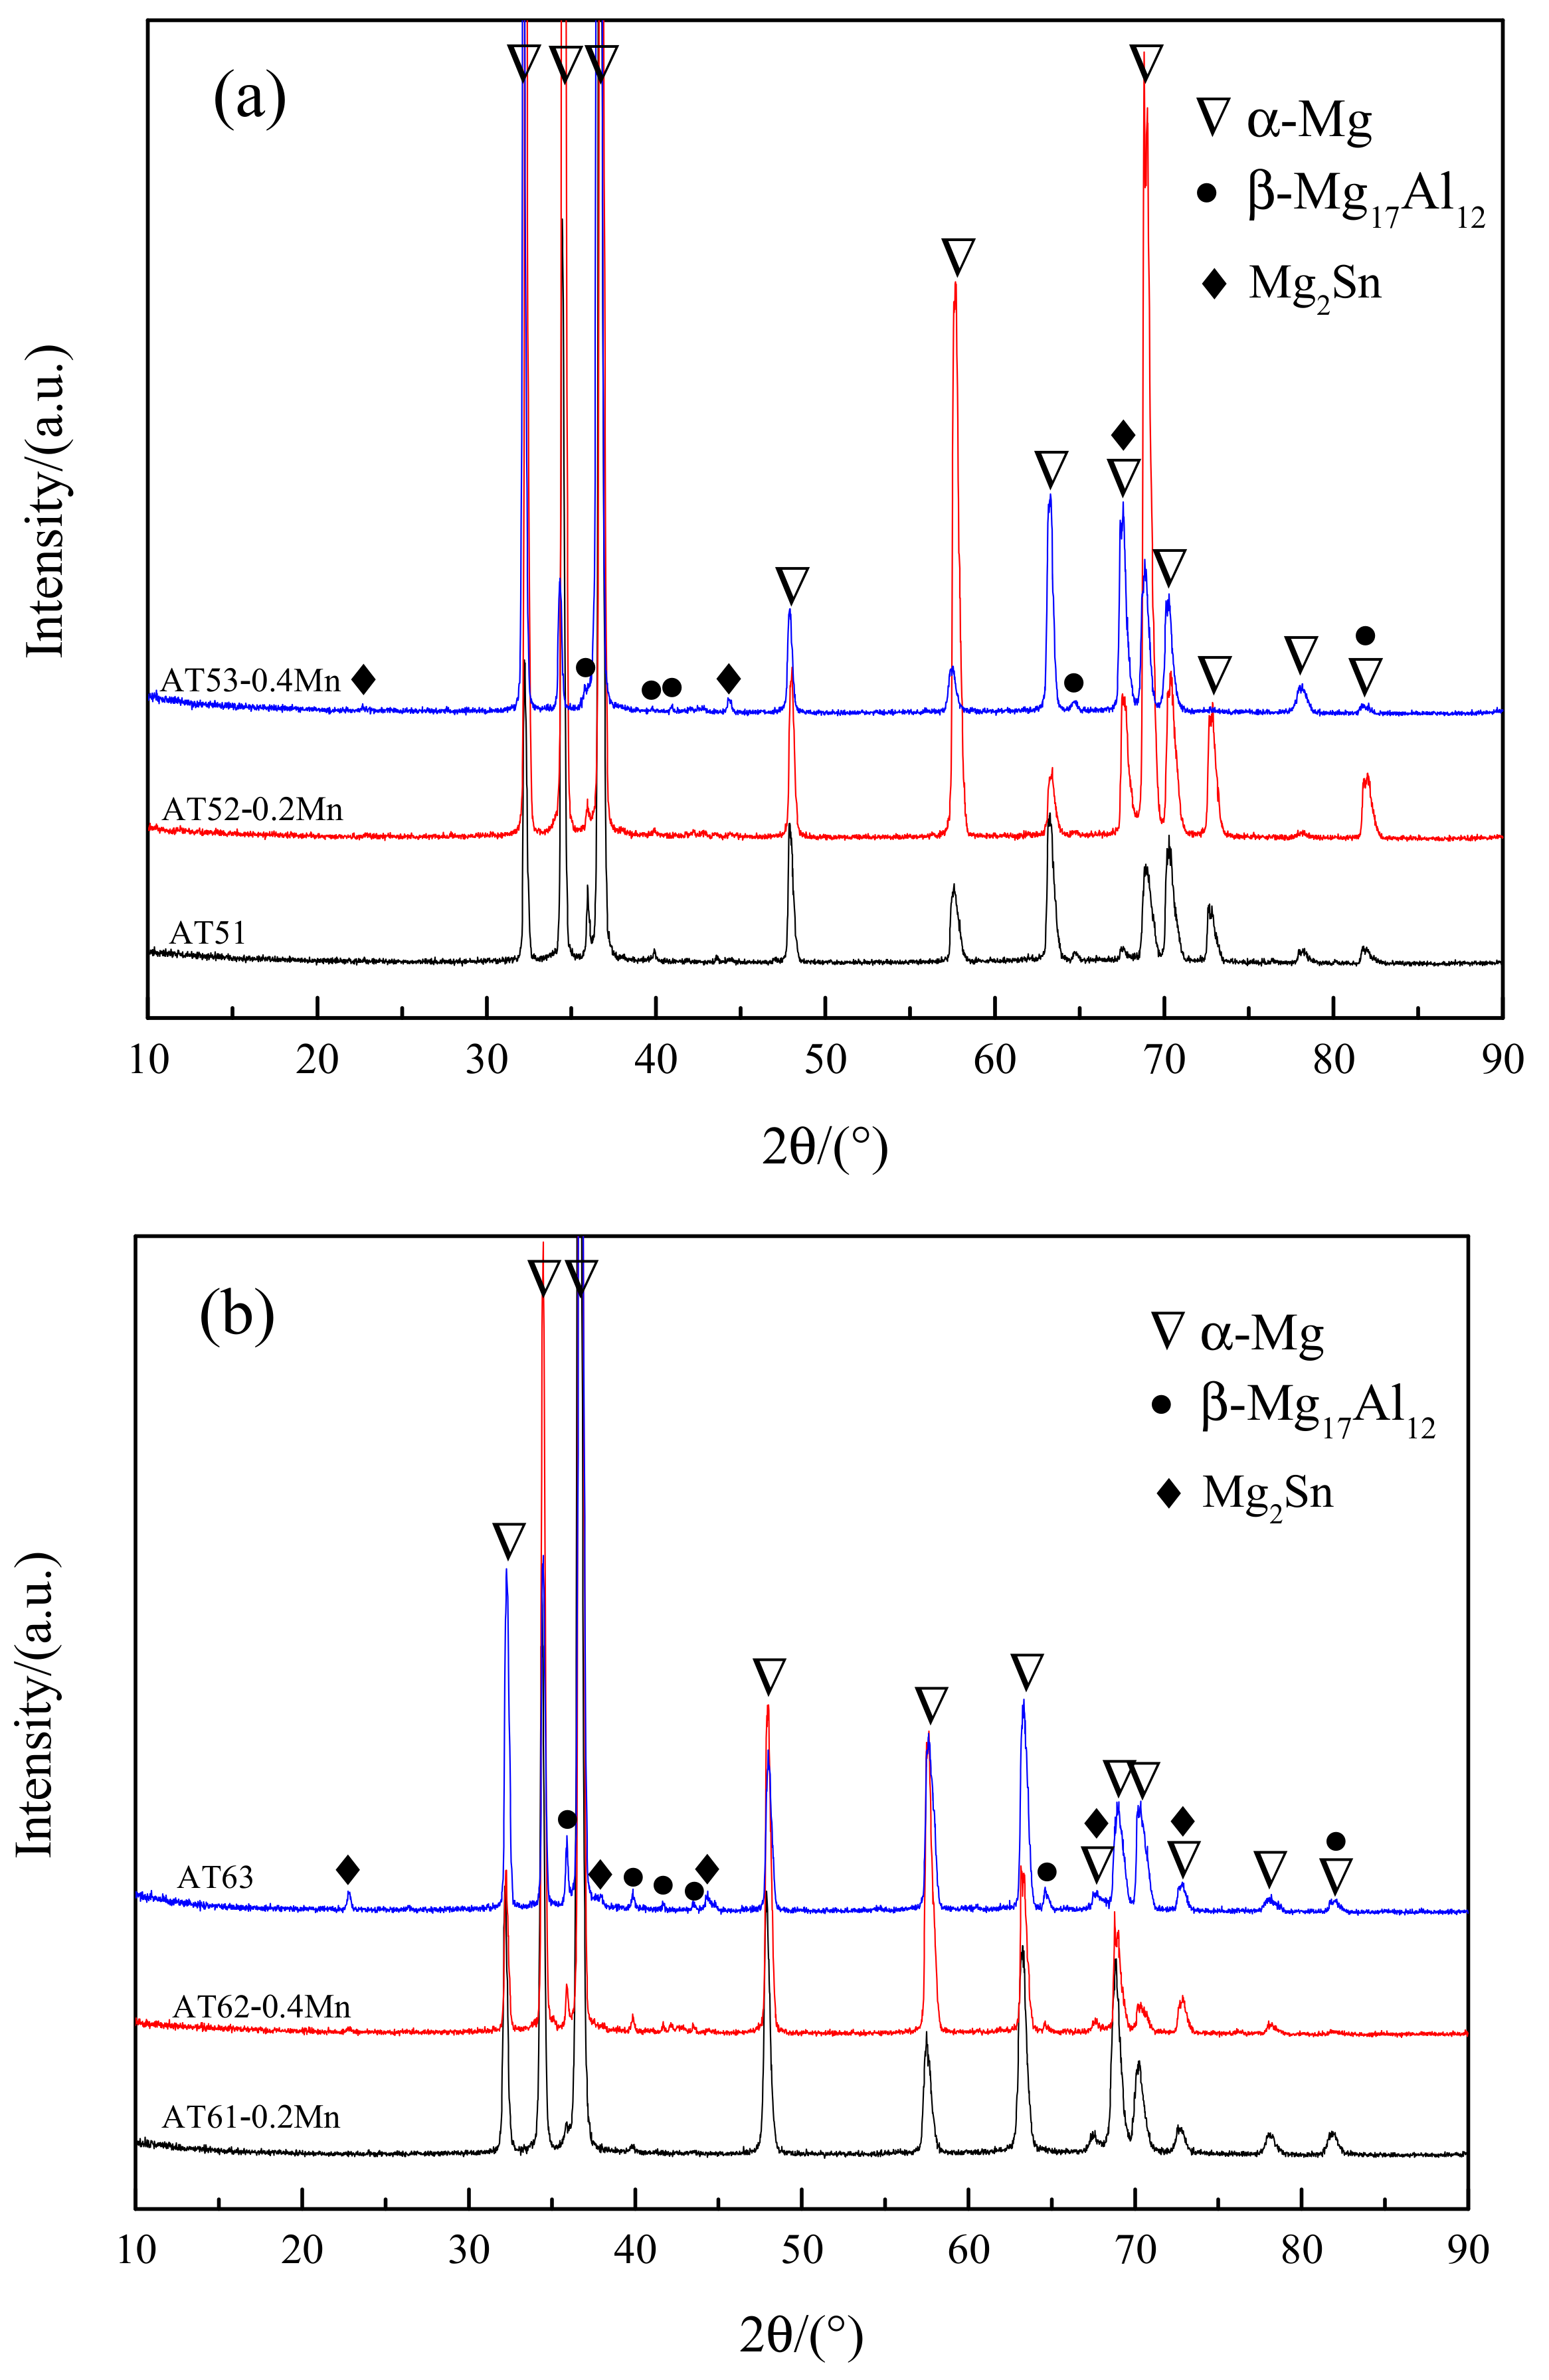
Figure 1 is the XRD pattern results of as-cast Mg-Al-Sn-Mn alloys; the common phases of nine alloys are α-Mg, β-Mg
17Al
12, and Mg
2Sn.
The XRD pattern with the same content of Al in
Figure 1 shows that the β-Mg
17Al
12 diffraction peak is more obvious with the increase of the content of Sn. When the content of Sn is 3 wt.%, the Mg
2Sn diffraction peaks appear in AT53-0.4Mn, AT63, and AT73-0.2Mn alloys. This indicates that with the increase of Sn, the content of β-Mg
17Al
12 and Mg
2Sn phase in the cast alloy increases.
When the content of Sn is constant, with the increase of Al, the β-Mg17Al12 diffraction peak becomes increasingly obvious, and the Mg2Sn diffraction peak becomes more obvious, too. As Al content increases, the solid solubility of Sn in Mg decreases, thus producing Mg2Sn phase.
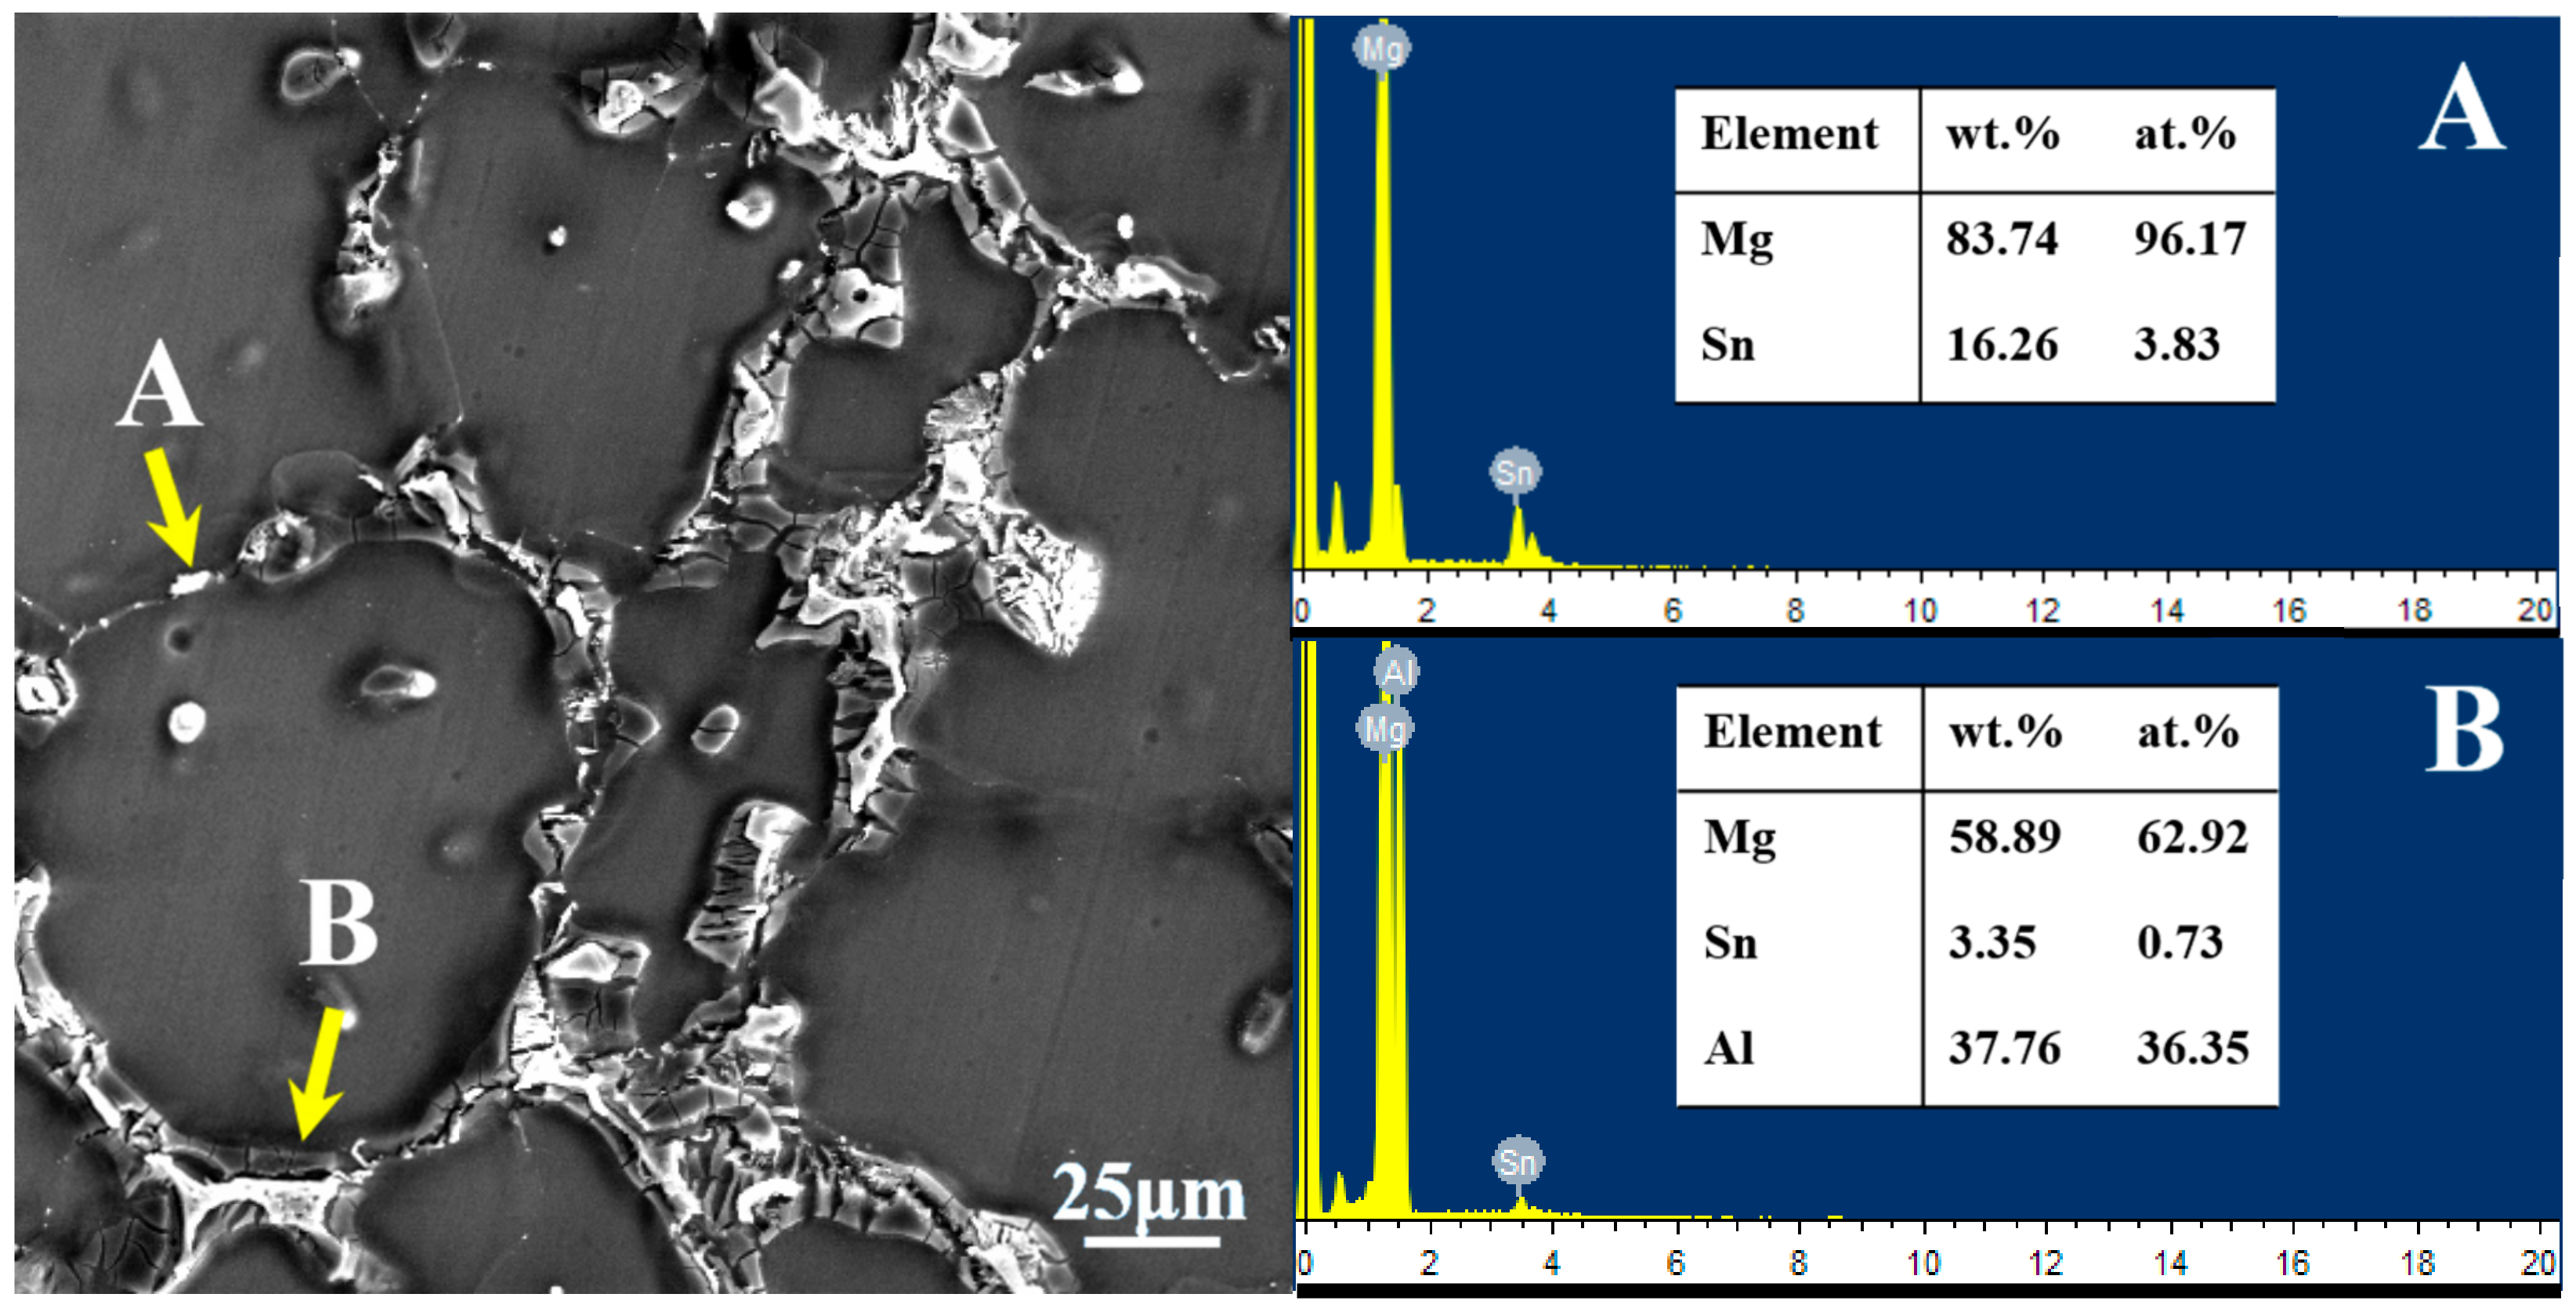
SEM image and EDS results of the as-cast AT63 alloy are given in
Figure 2. It can be found that the gray-white eutectic is α-Mg+β-Mg
17Al
12 (as shown in B in
Figure 2). The small bright white strip and globular particles are Mg
2Sn phase from the combination of EDS analysis and XRD results (as shown in
Figure 1b and
Figure 2A).
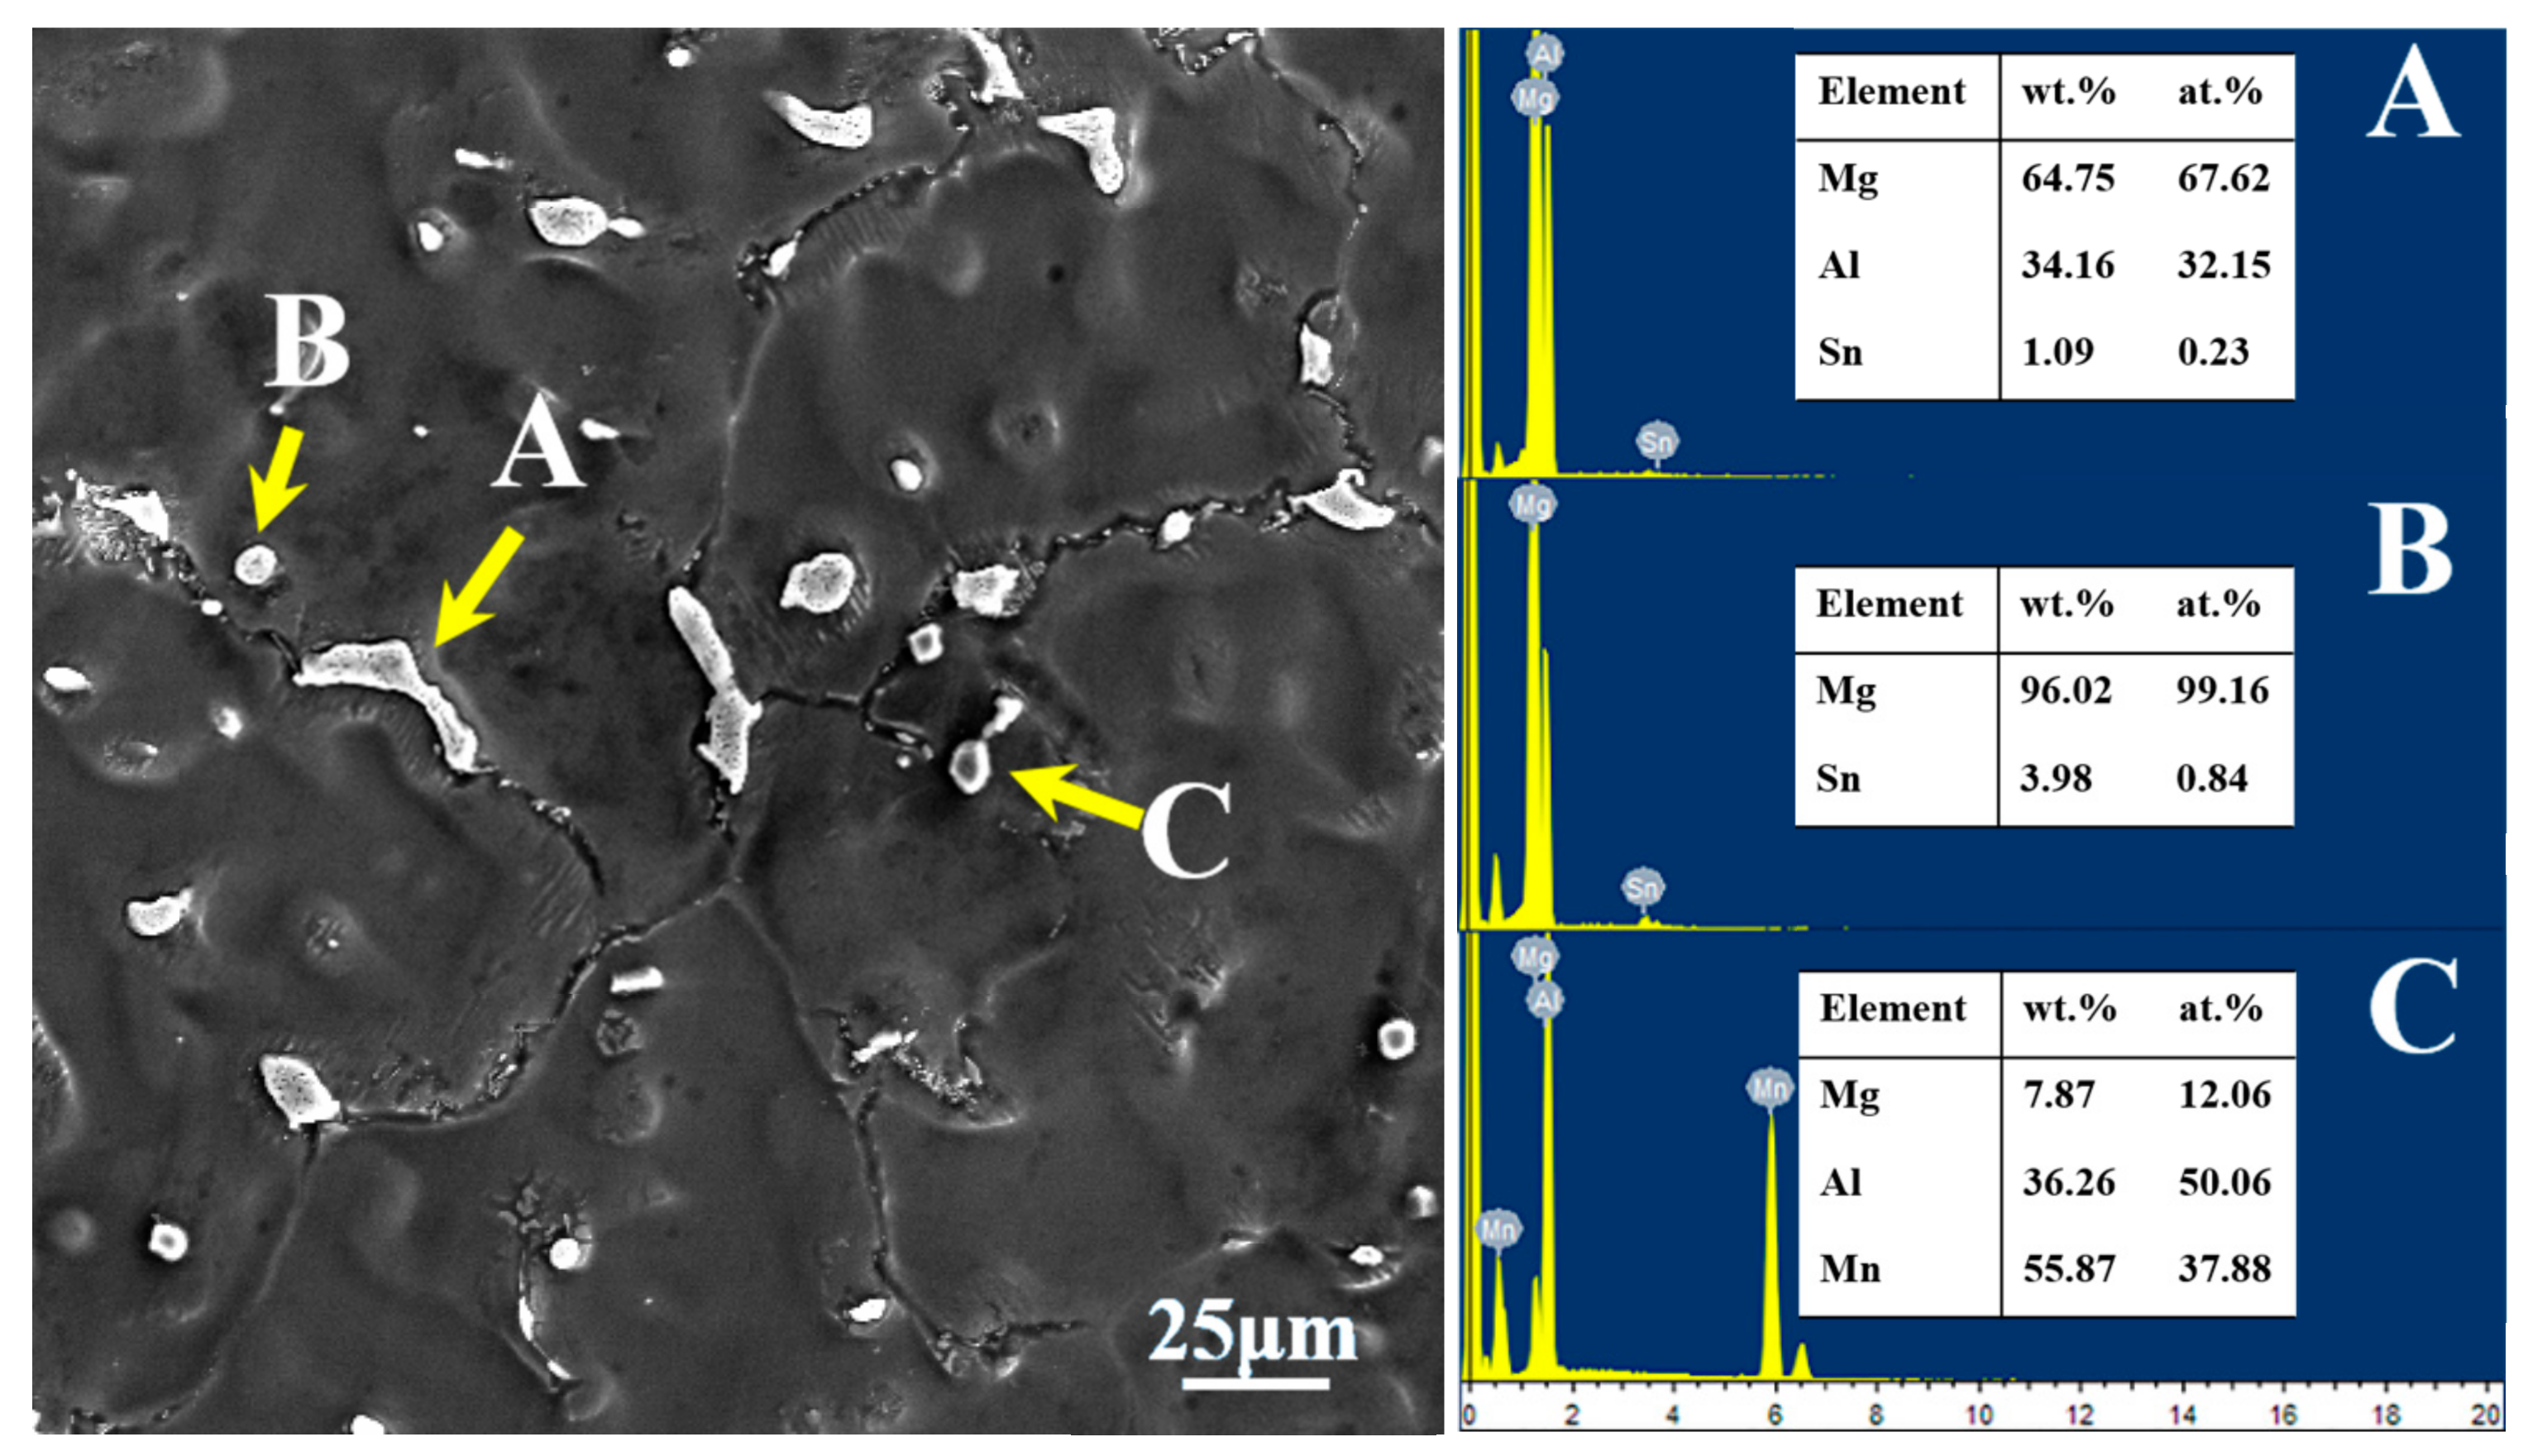
SEM image and EDS results of the main phases in the as-cast AT71-0.4Mn alloy are presented in
Figure 3. The combination of EDS analysis and XRD results shows that the long-stripe particles along the grain boundaries are the β-Mg
17Al
12 phase (as shown in
Figure 3A), and the small spheroidal particles distributed along the grain boundaries or inside grains are Mg
2Sn phase (as shown in
Figure 3B). Besides, many irregular polygonal particles can also be observed in the as-cast AT71-0.4Mn alloy, these irregular polygonal particles are Al-Mn phase (as shown in
Figure 3C).
3.2. Microstructure of Extruded Mg-Al-Sn-Mn Magnesium Alloys
Figure 4 presents EBSD inverse-pole figure (IPF) maps of the extruded Mg-Al-Sn-Mn magnesium alloys. IPF maps of nine kinds of extruded alloys are arranged in the order of orthogonal experimental design, too.
Inspection of the images in
Figure 4 reveals that dynamic recrystallization occurs in nine alloys during the hot-extrusion process. The cast dendrite structure changes into the recrystallized equiaxed grain.
The extreme-difference analysis method can easily and intuitively show the influence of each element on the alloy.
Table 1 gives the orthogonal-test parameters and results analysis table under the grain-size index from EBSD results.
The R value of each element in
Table 1 ranks in the order of R(C), R(B), and R(A). It shows that the content of Mn elements in the alloy has the greatest influence on the grain size, followed by Sn and Al. For magnesium alloys, Mn is the most significant grain-refining element [
44,
45]. The Mn and Al elements form the primary Al–Mn phase from the liquid [
44]. The Al–Mn phase also has a high melting point (642 °C) that cannot be dissolved into the matrix during homogenization. In the process of hot extrusion, the Al–Mn phase acts as a heterogeneous nucleation point, which restricts the growth of the dynamic recrystallized grain [
32,
34,
45]. In addition, the fine Mg
2Sn phase precipitates formed during the extrusion process are distributed along the grain boundaries and within the grain interiors [
1] (as shown in the following SEM results). Mg
2Sn precipitates also play an important role in restricting the growth dynamic recrystallized (DRXed) grain via grain-boundary pinning, which is consistent with previously reported results for extruded TAZ711 [
46] and TAZ811 [
47] alloys. Therefore, Sn can also effectively refine the grain size of an Mg-Al-Sn-Mn alloy. Al elements are completely dissolved into the matrix during homogenization process. There is also no second-phase precipitate formed during extrusion. Therefore, the effect of Al on Mg-Al-Sn-Mn alloy grain size is the smallest.
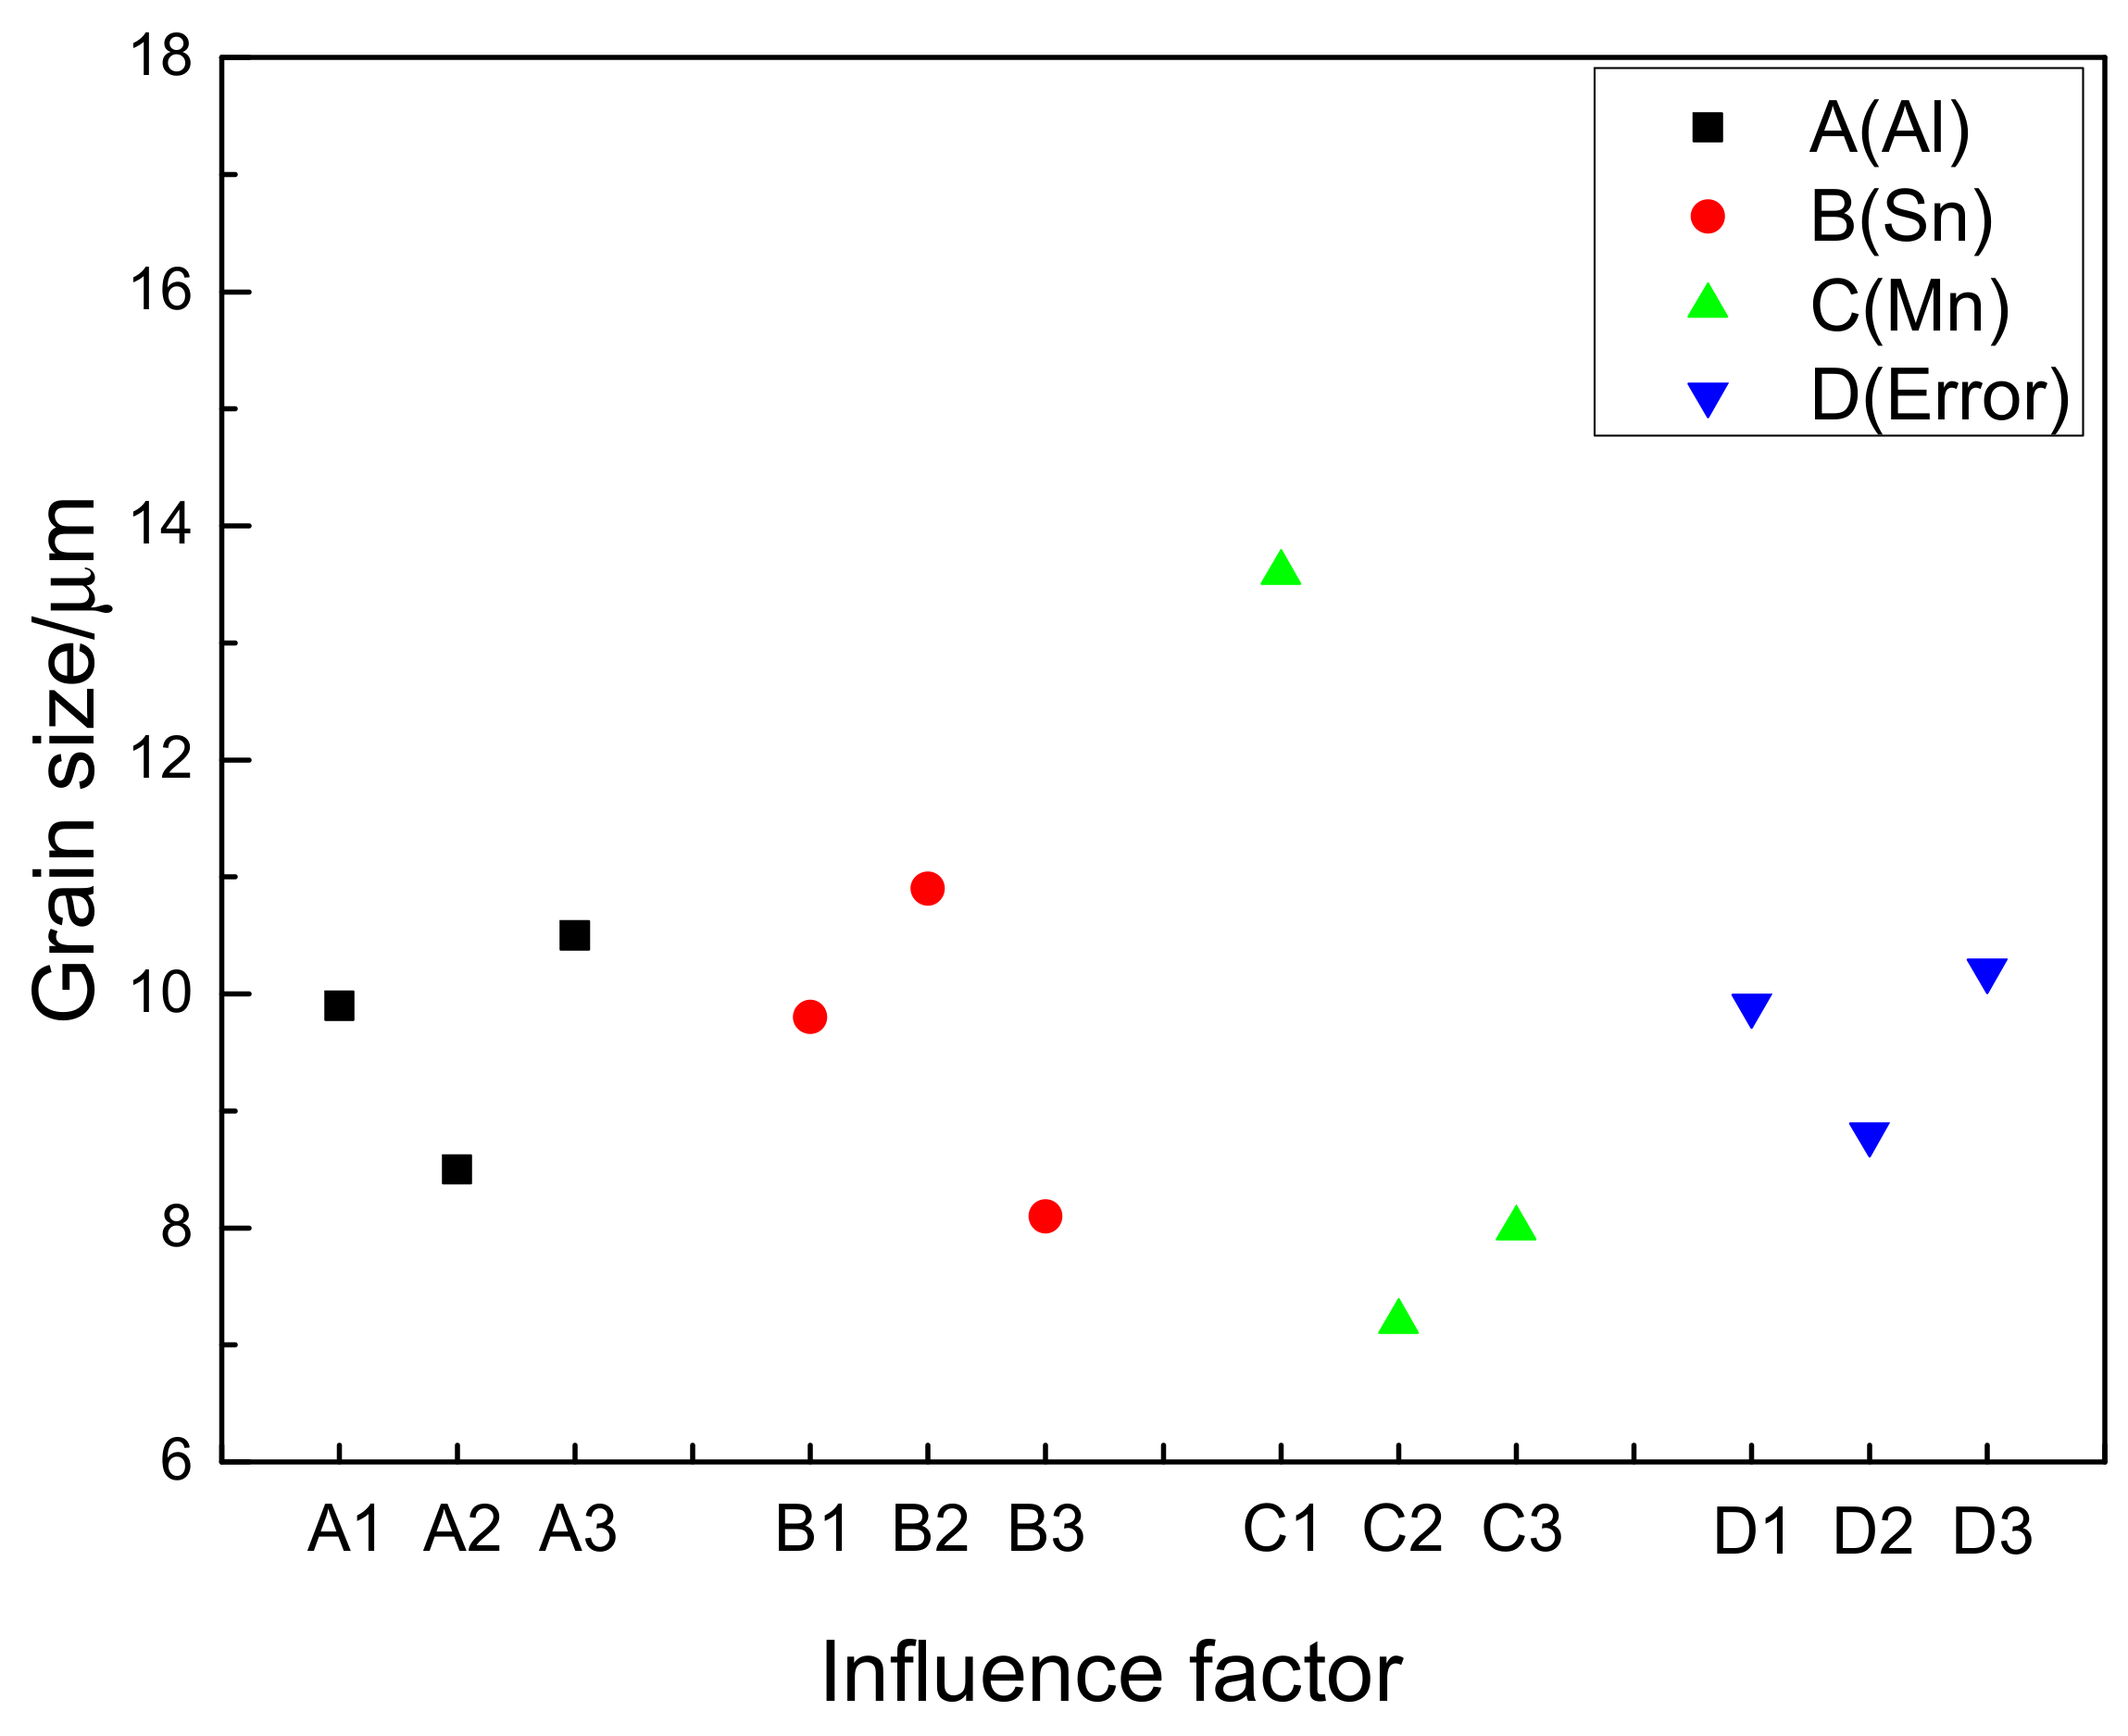
In order to understand the influence of Al, Sn, and Mn content on the grain size for the extruded Mg-Al-Sn-Mn magnesium alloys, the diagram of the relationship between factors and indicators (grain size) is shown in
Figure 5. As shown in
Figure 5, Mn is the main factor affecting grain size. With the content of Mn from 0 wt.% to 0.2 wt.%, the grain diameter decreases rapidly. However, when the content of Mn is increased to 0.4 wt.%, there is a rising trend. Therefore, the optimum Mn element content is 0.2 wt.%. Similarly, the best choice of Al and Sn are 6 wt.% and 3 wt.%, respectively. So, the AT63-0.2Mn alloy has the minimum grain size, in theory. It is not included in the designed nine kinds of alloys, yet. The AT61-0.2Mn and AT73-0.2Mn alloys have the smallest grain size in all alloys, reaching 6.8 μm.
In order to determine the type, morphology and distribution of the second phases in extruded Mg-Al-Sn-Mn magnesium alloys, the SEM and EDS of the extruded AT63 alloy and AT71-0.4Mn alloy were carried out. The results are shown in
Figure 6 and
Figure 7.
As can be seen from
Figure 6, there are bright white particles in the extruded AT63 alloy with different sizes (as shown in A and B). The EDS analysis shows that the bright white particles are the Mg
2Sn phase. The β-Mg
17Al
12 phase in the cast alloy was completely dissolved into the magnesium matrix during the homogenization process, and it was not precipitated during the extrusion process.
From
Figure 7, there are several lumpy white particles and continuous white particles along the grain boundary in the extruded AT71-0.4Mn alloy. The lumpy white second phase in the alloy is mainly the enrichment area of Al and Mn elements, indicating that the lumpy white particle in the alloy (as shown in
Figure 7A) is the second Al-Mn phase. The Sn element is almost evenly distributed on the Mg matrix, indicating that most of the Sn elements in Mg-Al-Sn-Mn magnesium alloy are dissolved into the magnesium matrix. Only a part of Sn and Mg form the Mg
2Sn phase on the grain boundary (as shown in
Figure 7B). Similar to the condition of AT63, the Mg
17Al
12 phase in the extruded AT71-0.4Mn alloy has not been detected, either.
3.3. Textures of Extruded Mg-Al-Sn-Mn Magnesium Alloy
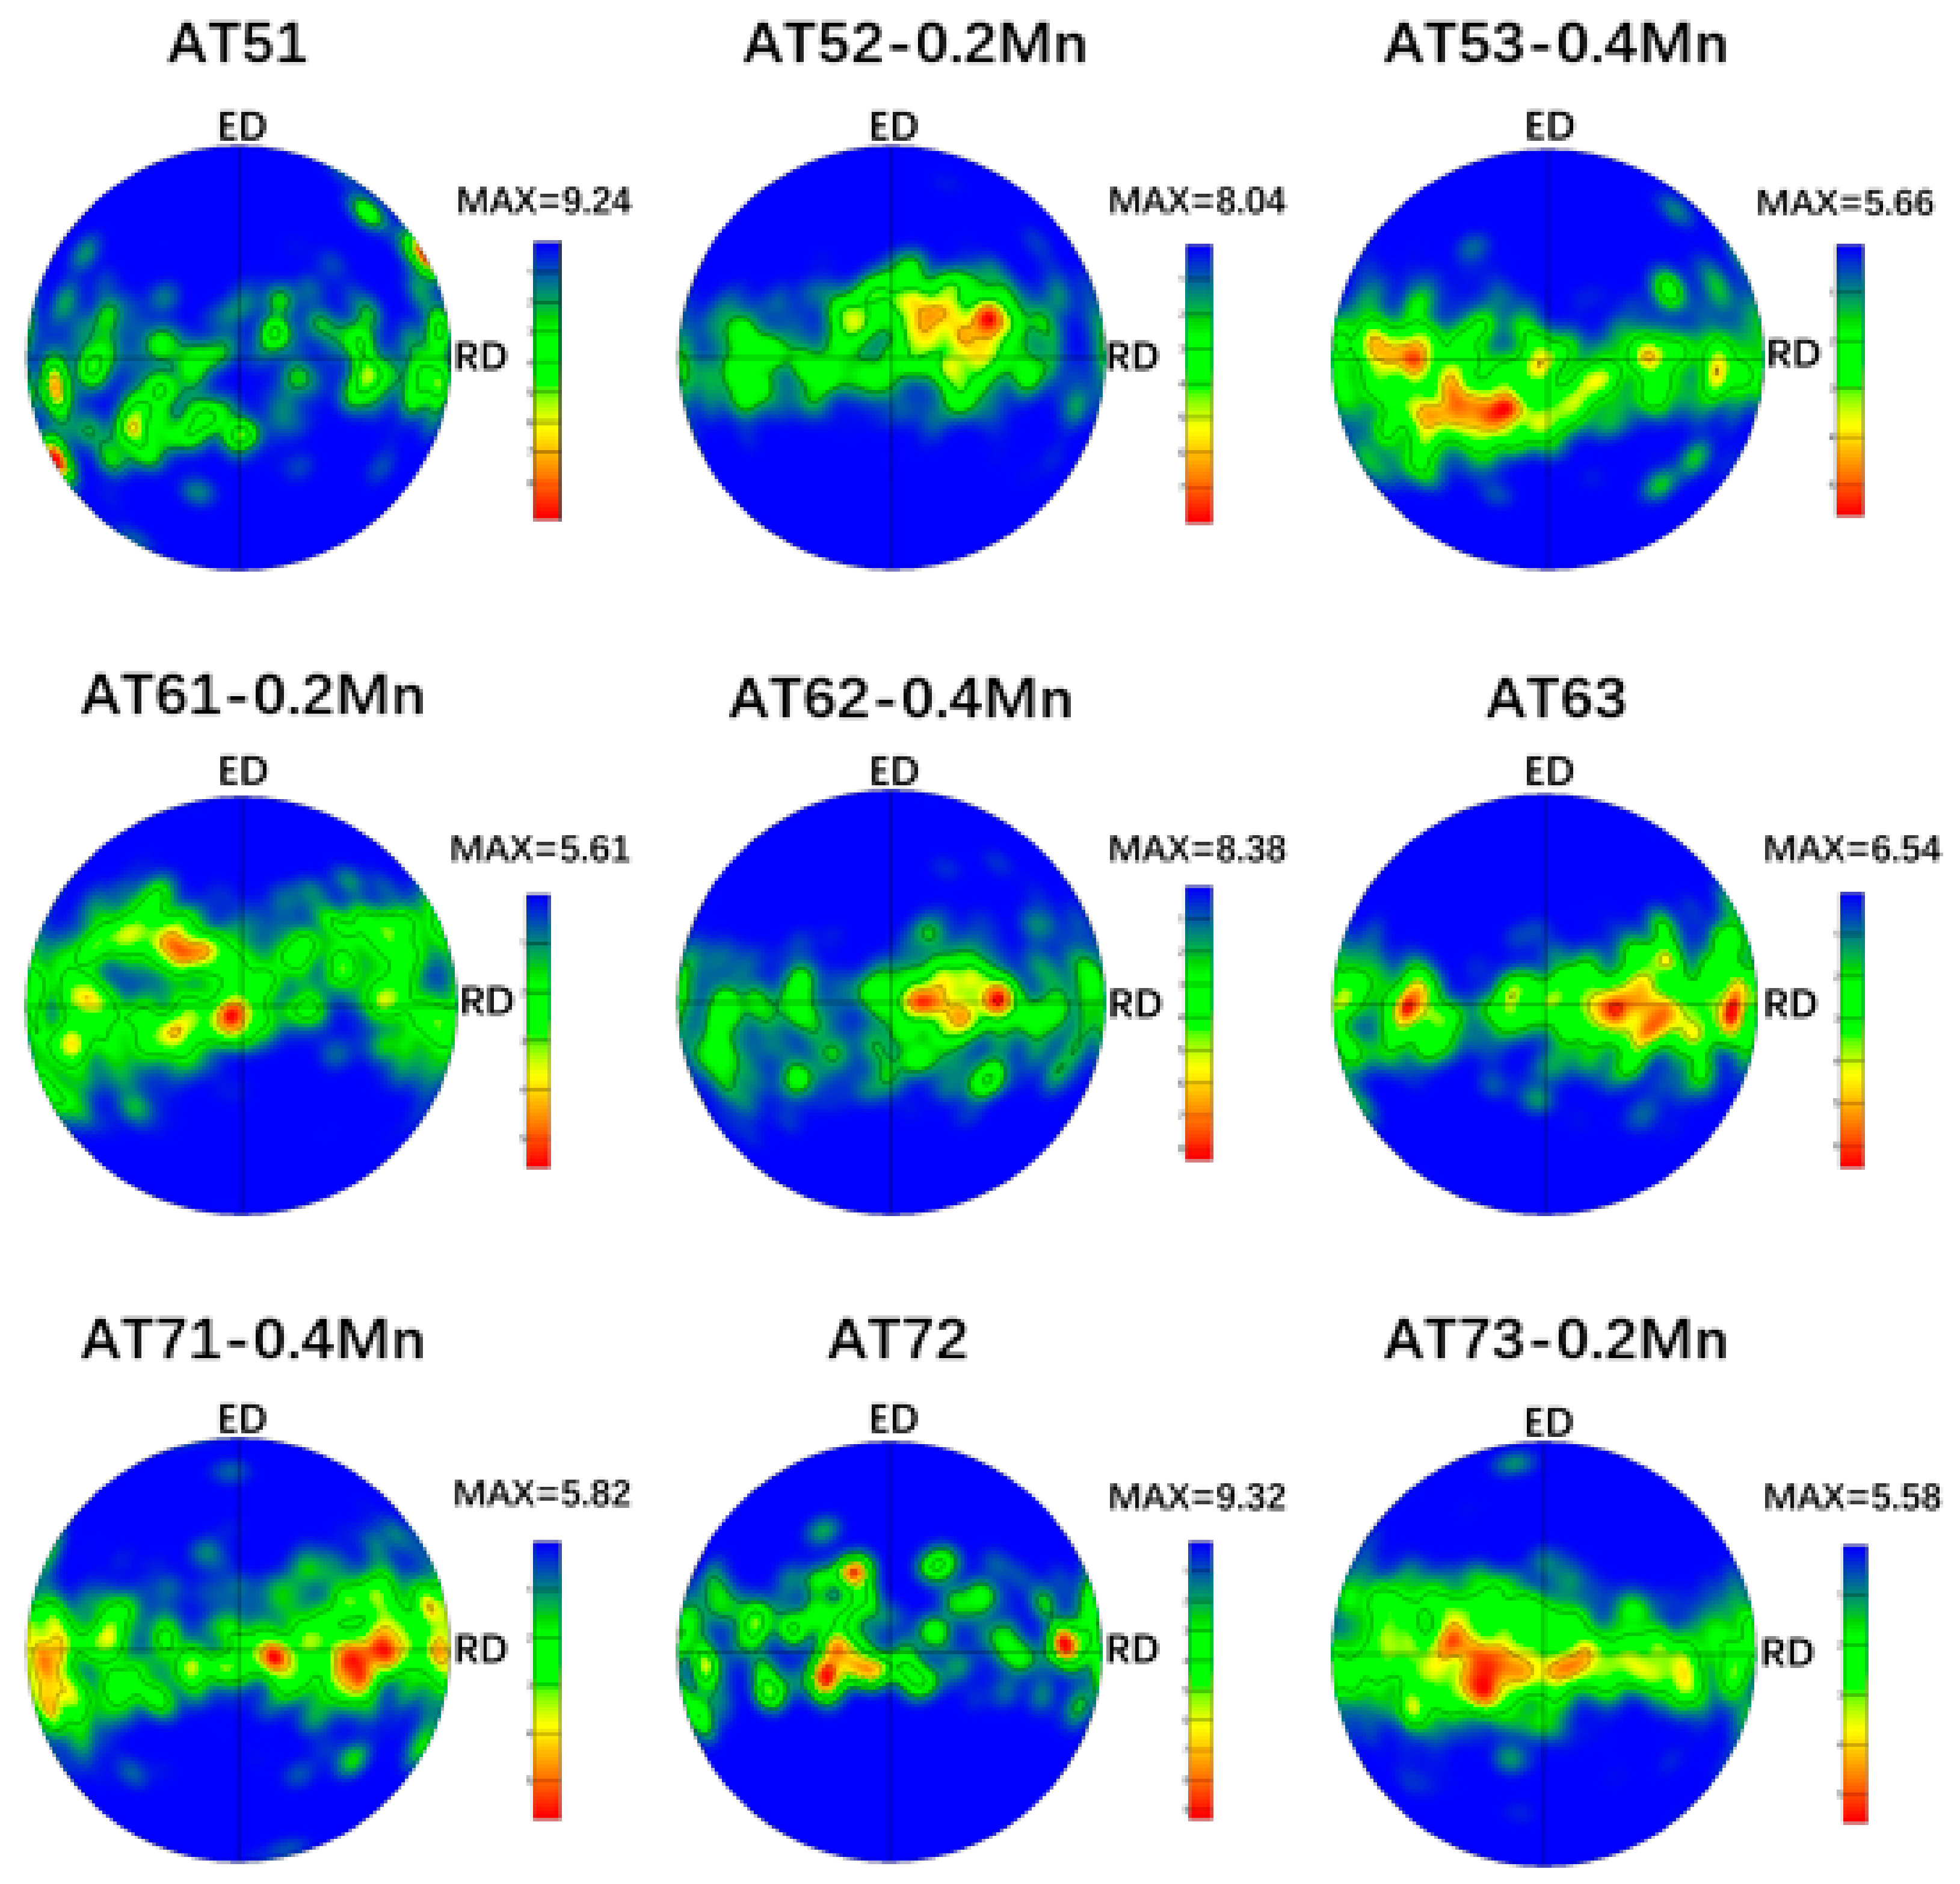
Figure 8 shows the (0001) pole figures of extruded Mg-Al-Sn-Mn magnesium alloys; the as-extruded alloys exhibit a typical extruding texture with (0001) basal planes parallel to the extrusion direction (ED), which is a typical fiber texture in extruded magnesium alloys [
36,
48]. In addition, the maximum texture intensity varies with element content. The orthogonal test parameters and results analysis are shown in
Table 2.
It can be obtained from
Table 2 that R value of each element ranks in the order of R(B), R(C), and R(A). It shows that Sn has the greatest influence on the maximum texture intensity, followed by Mn, and the content of Al has the smallest effect. The maximum intensity of texture is often related to the DRX region. It has been reported that the Mg-4.5Zn-1.1Ca alloy extruded at lower temperatures exhibited a stronger texture due to the lower fraction of the DRXed region [
49]. In the present work, the fractions of unDRXed grains are quite low, and it cannot be considered as a reason explaining the texture intensity change.
In addition, the strength of texture is related to the content of second phase and grain size. The increase of the second phase and the decrease of grain size will weaken the texture intensity [
50,
51]. On the one hand, the presence of Mg
2Sn precipitates reduces the rate of tensile twinning due to the pinning of twin boundary [
52]. On the other hand, the addition of Sn obviously affects grain size. Hence, the Sn element has the greatest influence on the texture intensity. The addition of Mn will obviously reduce the grain size and weaken the texture intensity. Al cannot form second-phase particles on a hot extruded process and has little effect on grain size (from
Figure 2). So, Al content is the smallest factor affecting texture intensity.
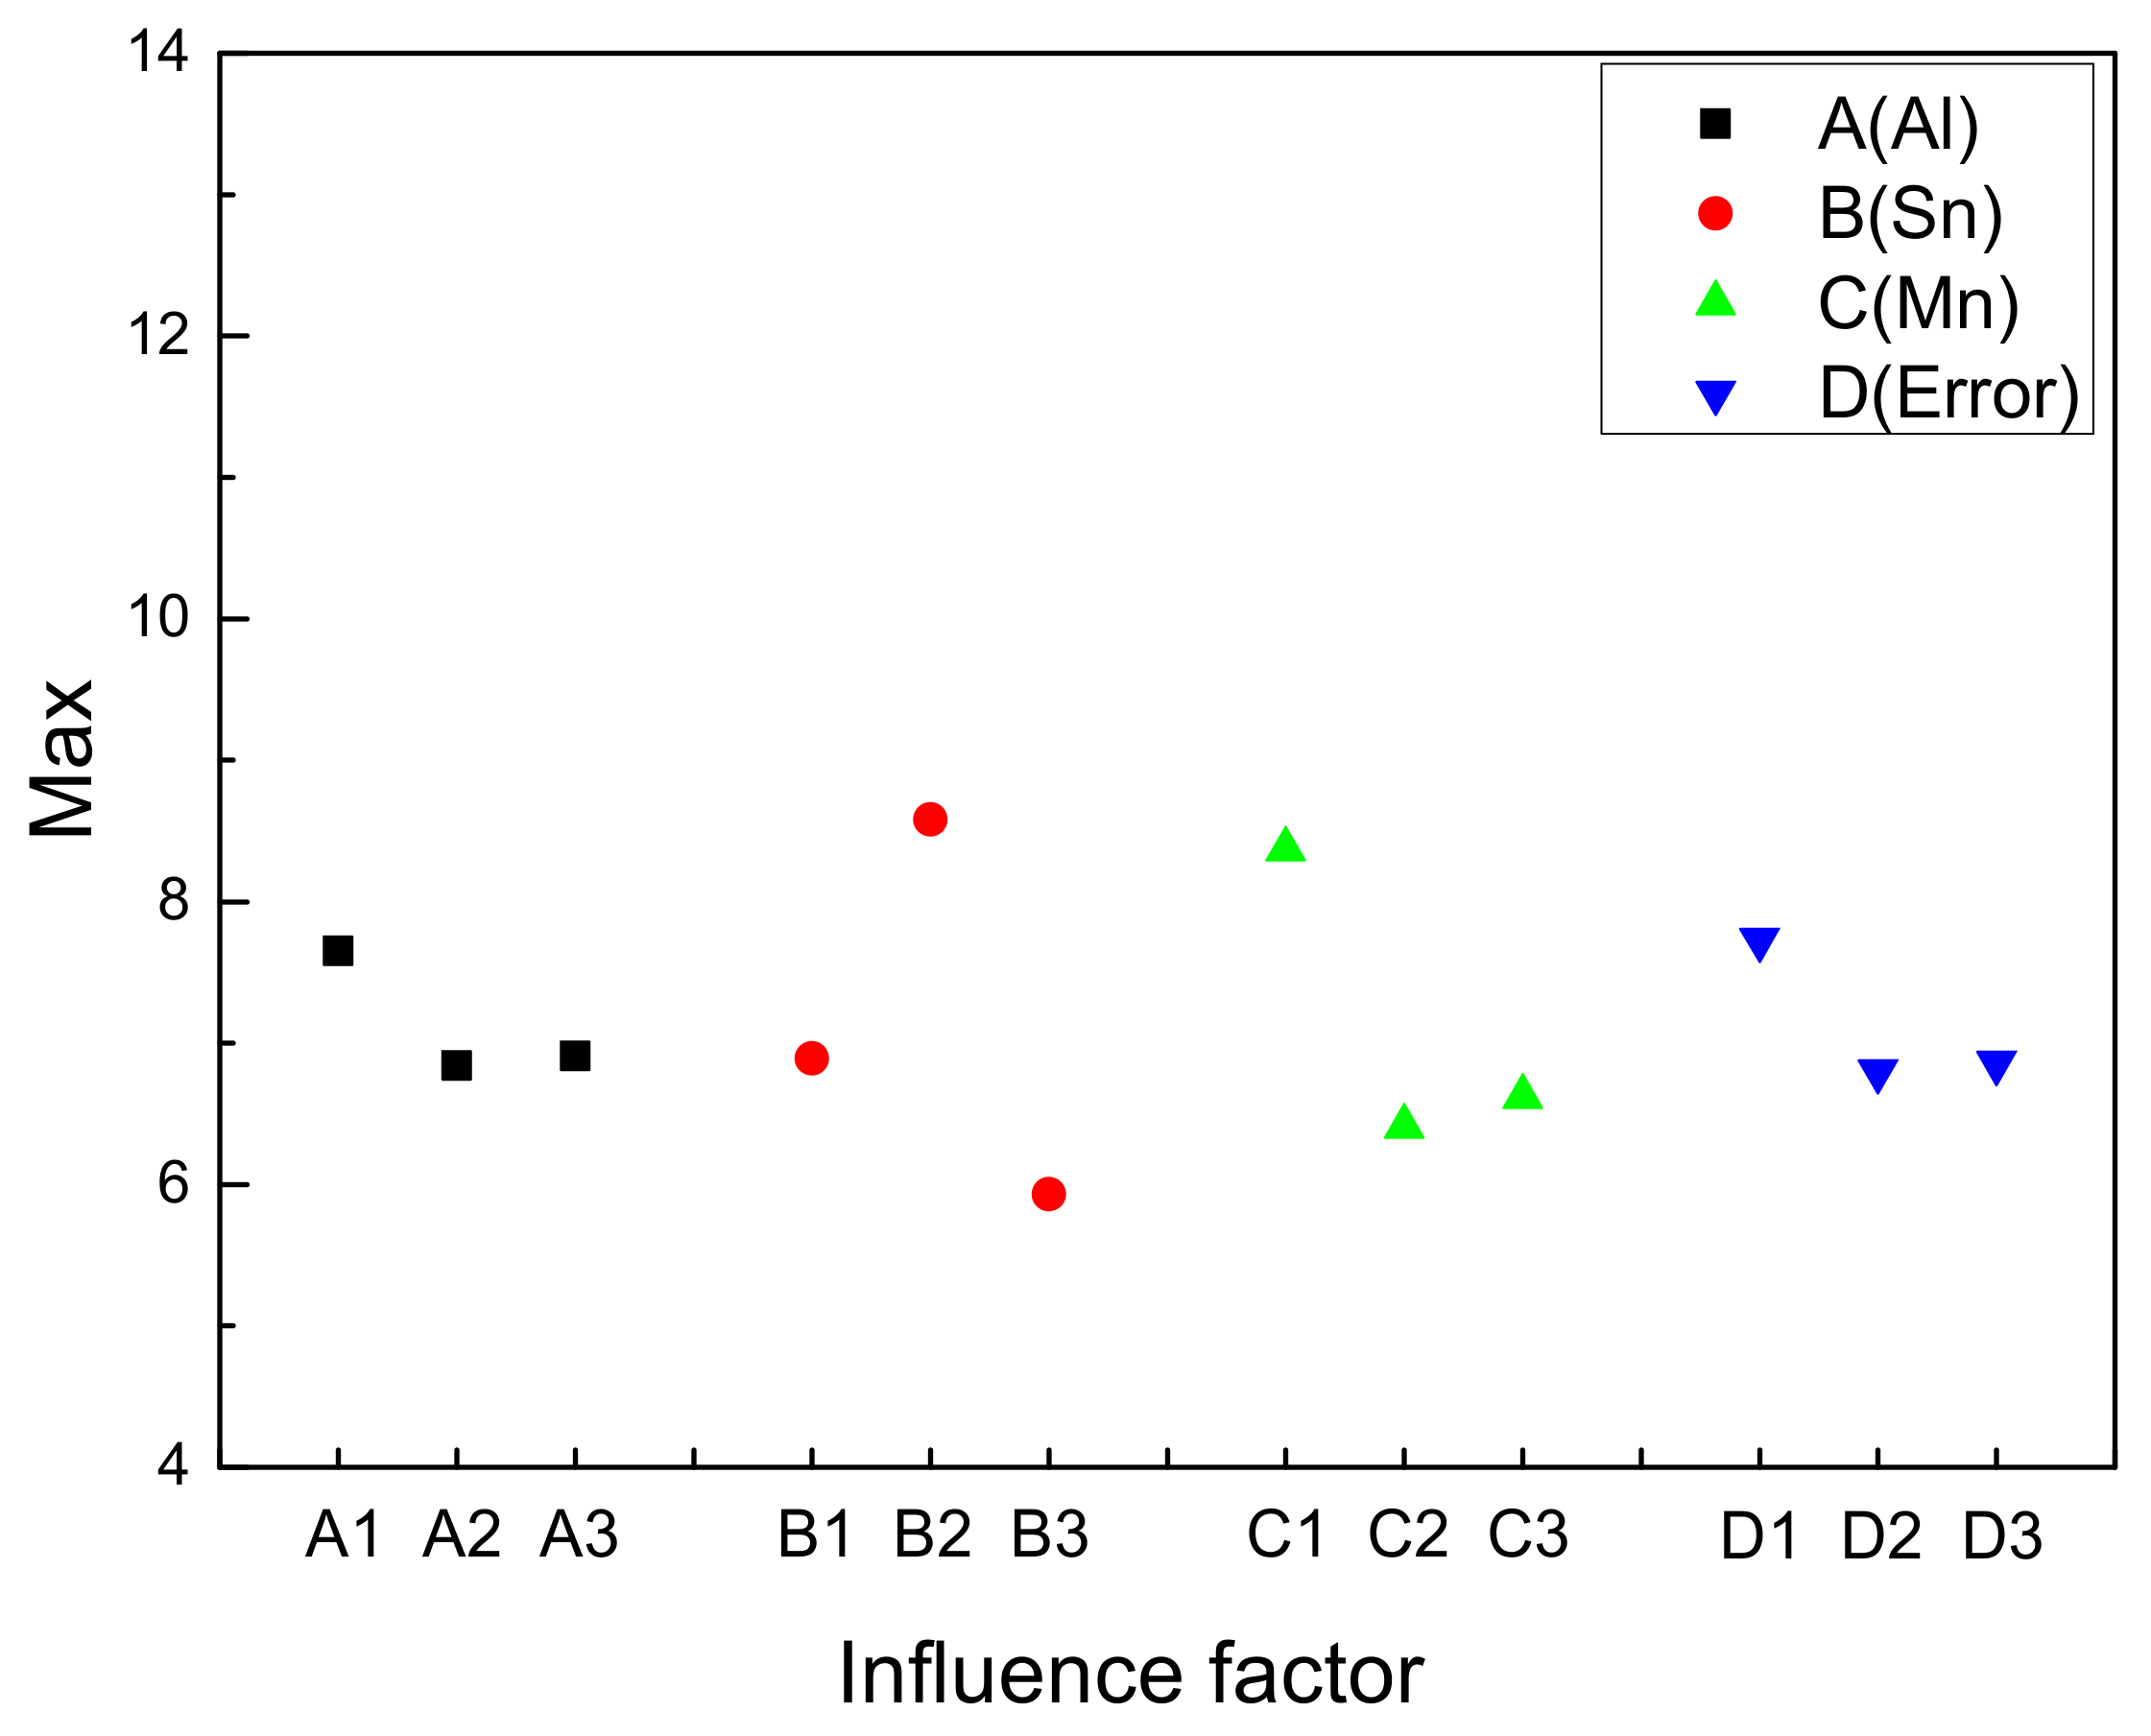
Figure 9 shows the Factors and Index trends diagram of maximum texture intensity for nine trial samples. It can be used to understand the influence of Al, Sn, and Mn content on maximum texture intensity for extruded Mg-Al-Sn-Mn magnesium alloys. The change of grain size is the main factor affecting the texture intensity of magnesium alloy. Borkar et al. [
53] revealed that the fine grains have relatively more random orientations than medium-to-large-sized grains; thus, a weaker texture happens. Therefore, the influence of element content on texture intensity in
Figure 9 is similar to that of grain size in
Figure 5. So, the AT63-0.2Mn alloy has the maximum texture intensity. It is not yet included in the designed nine kinds of alloys. However, there was little change in Al content of 6 wt.% and 7 wt.%. The AT73-0.2Mn alloy has the smallest maximum texture intensity in all alloys.
3.4. Mechanical Properties of Extruded Mg-Al-Sn-Mn Magnesium Alloys at Room Temperature
Figure 10 displays the stress-strain curvers of the extruded Mg-Al-Sn-Mn alloys.
Table 3 gives the corresponding mechanical properties, listed in terms of TYS, UTS, and EL. It can be seen that the UTS of Mg-7Al-3Sn-0.2Mn is the highest and the UTS is up to 322 MPa, and the EL of Mg-5Al-2Sn-0.2Mn is the highest, reaching 28.4%.
Table 4 is the orthogonal test parameters and results analysis table under the UTS index. The R value of each element in
Table 4 ranks in the order of R(A), R(B), and R(C). It shows that the content of Al has the greatest influence on the UTS of the alloy, followed by the content of Sn, and the content of Mn has the least influence. Al element improves UTS of magnesium alloy by solid solution strengthening owing to no Mg–Al phase is formed. This is the main strengthening mechanism of Mg-Al-Sn-Mn alloy. Thus, Al has the greatest influence on UTS. For Sn element, the Mg
2Sn second phase can improve the UTS by precipitation strengthening and fine-grained strengthening mechanism. For Mn, as the content of Al-Mn phase is very low, UTS is mainly improved by fine-grained strengthening mechanism. Therefore, the effect of Mn on Mg-Al-Sn-Mn alloy UTS is the smallest.
In order to understand the influence of Al, Sn and Mn content on UTS of the extruded Mg-Al-Sn-Mn magnesium alloy, the diagram of the relationship between factors and indicators (UTS) is shown in
Figure 11.
From
Figure 11, it is concluded that Al is the main factor affecting the UTS of the alloy. With the Al content from 5 wt.% to 7 wt.%, the UTS of the alloy almost increases linearly, so the best Al content is 7 wt.%. As the secondary factor, the content of Sn, from 1 wt.% to 3 wt.%, also has obvious strength enhancement, and the optimum content of Sn is 3 wt.%. As for Mn content from 0 wt.% to 0.2 wt.%, the UTS of the alloy is obviously enhanced. But when the content of Mn reaches 0.4 wt.%, the strength of the alloy decreases. So, the optimum content of Mn was 0.2 wt.%.
Above all, the optimum composition of the alloy with the largest UTS is Mg-7 Al-3Sn-0.2Mn (AT73-0.2Mn). The UTS of the best composite alloy is the highest in this test sample, reaching 322 MPa.
Table 5 is the orthogonal test parameters and results analysis table under the TYS index.
Figure 12 is the Factors and Index trends diagram of TYS for nine trial samples. The influence of Al, Sn, and Mn content on TYS is almost the same as that of UTS. But the effect of grain size on TYS is more obvious than UTS. So, The R value of each element in
Table 5 ranks in the order of R(A), R(C), and R(B). It shows that the content of Al elements in the alloy has the greatest influence. And the effect of Sn content on TYS is more obvious than that of Mn. From
Figure 12, it can be seen that the Mg-7Al-3Sn-0.2Mn (AT73-0.2Mn) Mg alloy has the largest TYS (202 MPa). It is same to the UTS results.
Similar to the analysis of the strength index, it can be concluded from
Table 6 that the R value ranks in the order of R(B), R(A), and R(C). The Sn content has the greatest influence on the elongation, and the R value is 3.47. The second is Al, and the content of Mn has the smallest effect on the elongation. The reason is that the addition of Sn to Mg alloys can decrease the stacking fault energy of the alloys, resulting in the improved activity of basal slip system {0001} <11
0> and the activation of the {10
1} <11
0> and {11
2} <11
3> slip systems [
30]. So, the addition of Sn makes the elongation increase. However, when excessive Sn is added, Mg
2Sn hinders the movement of dislocation, resulting in the increase of the strength and decrease of the elongation. The Al element is completely dissolved into the matrix, resulting in lattice distortion. The increase of the Al content leads to the increase of lattice distortion. Then, it leads to the increase of the strength and decrease of elongation. The addition of Mn can effectively refine the grain size, leading to strength and elongation increasing at the same time.
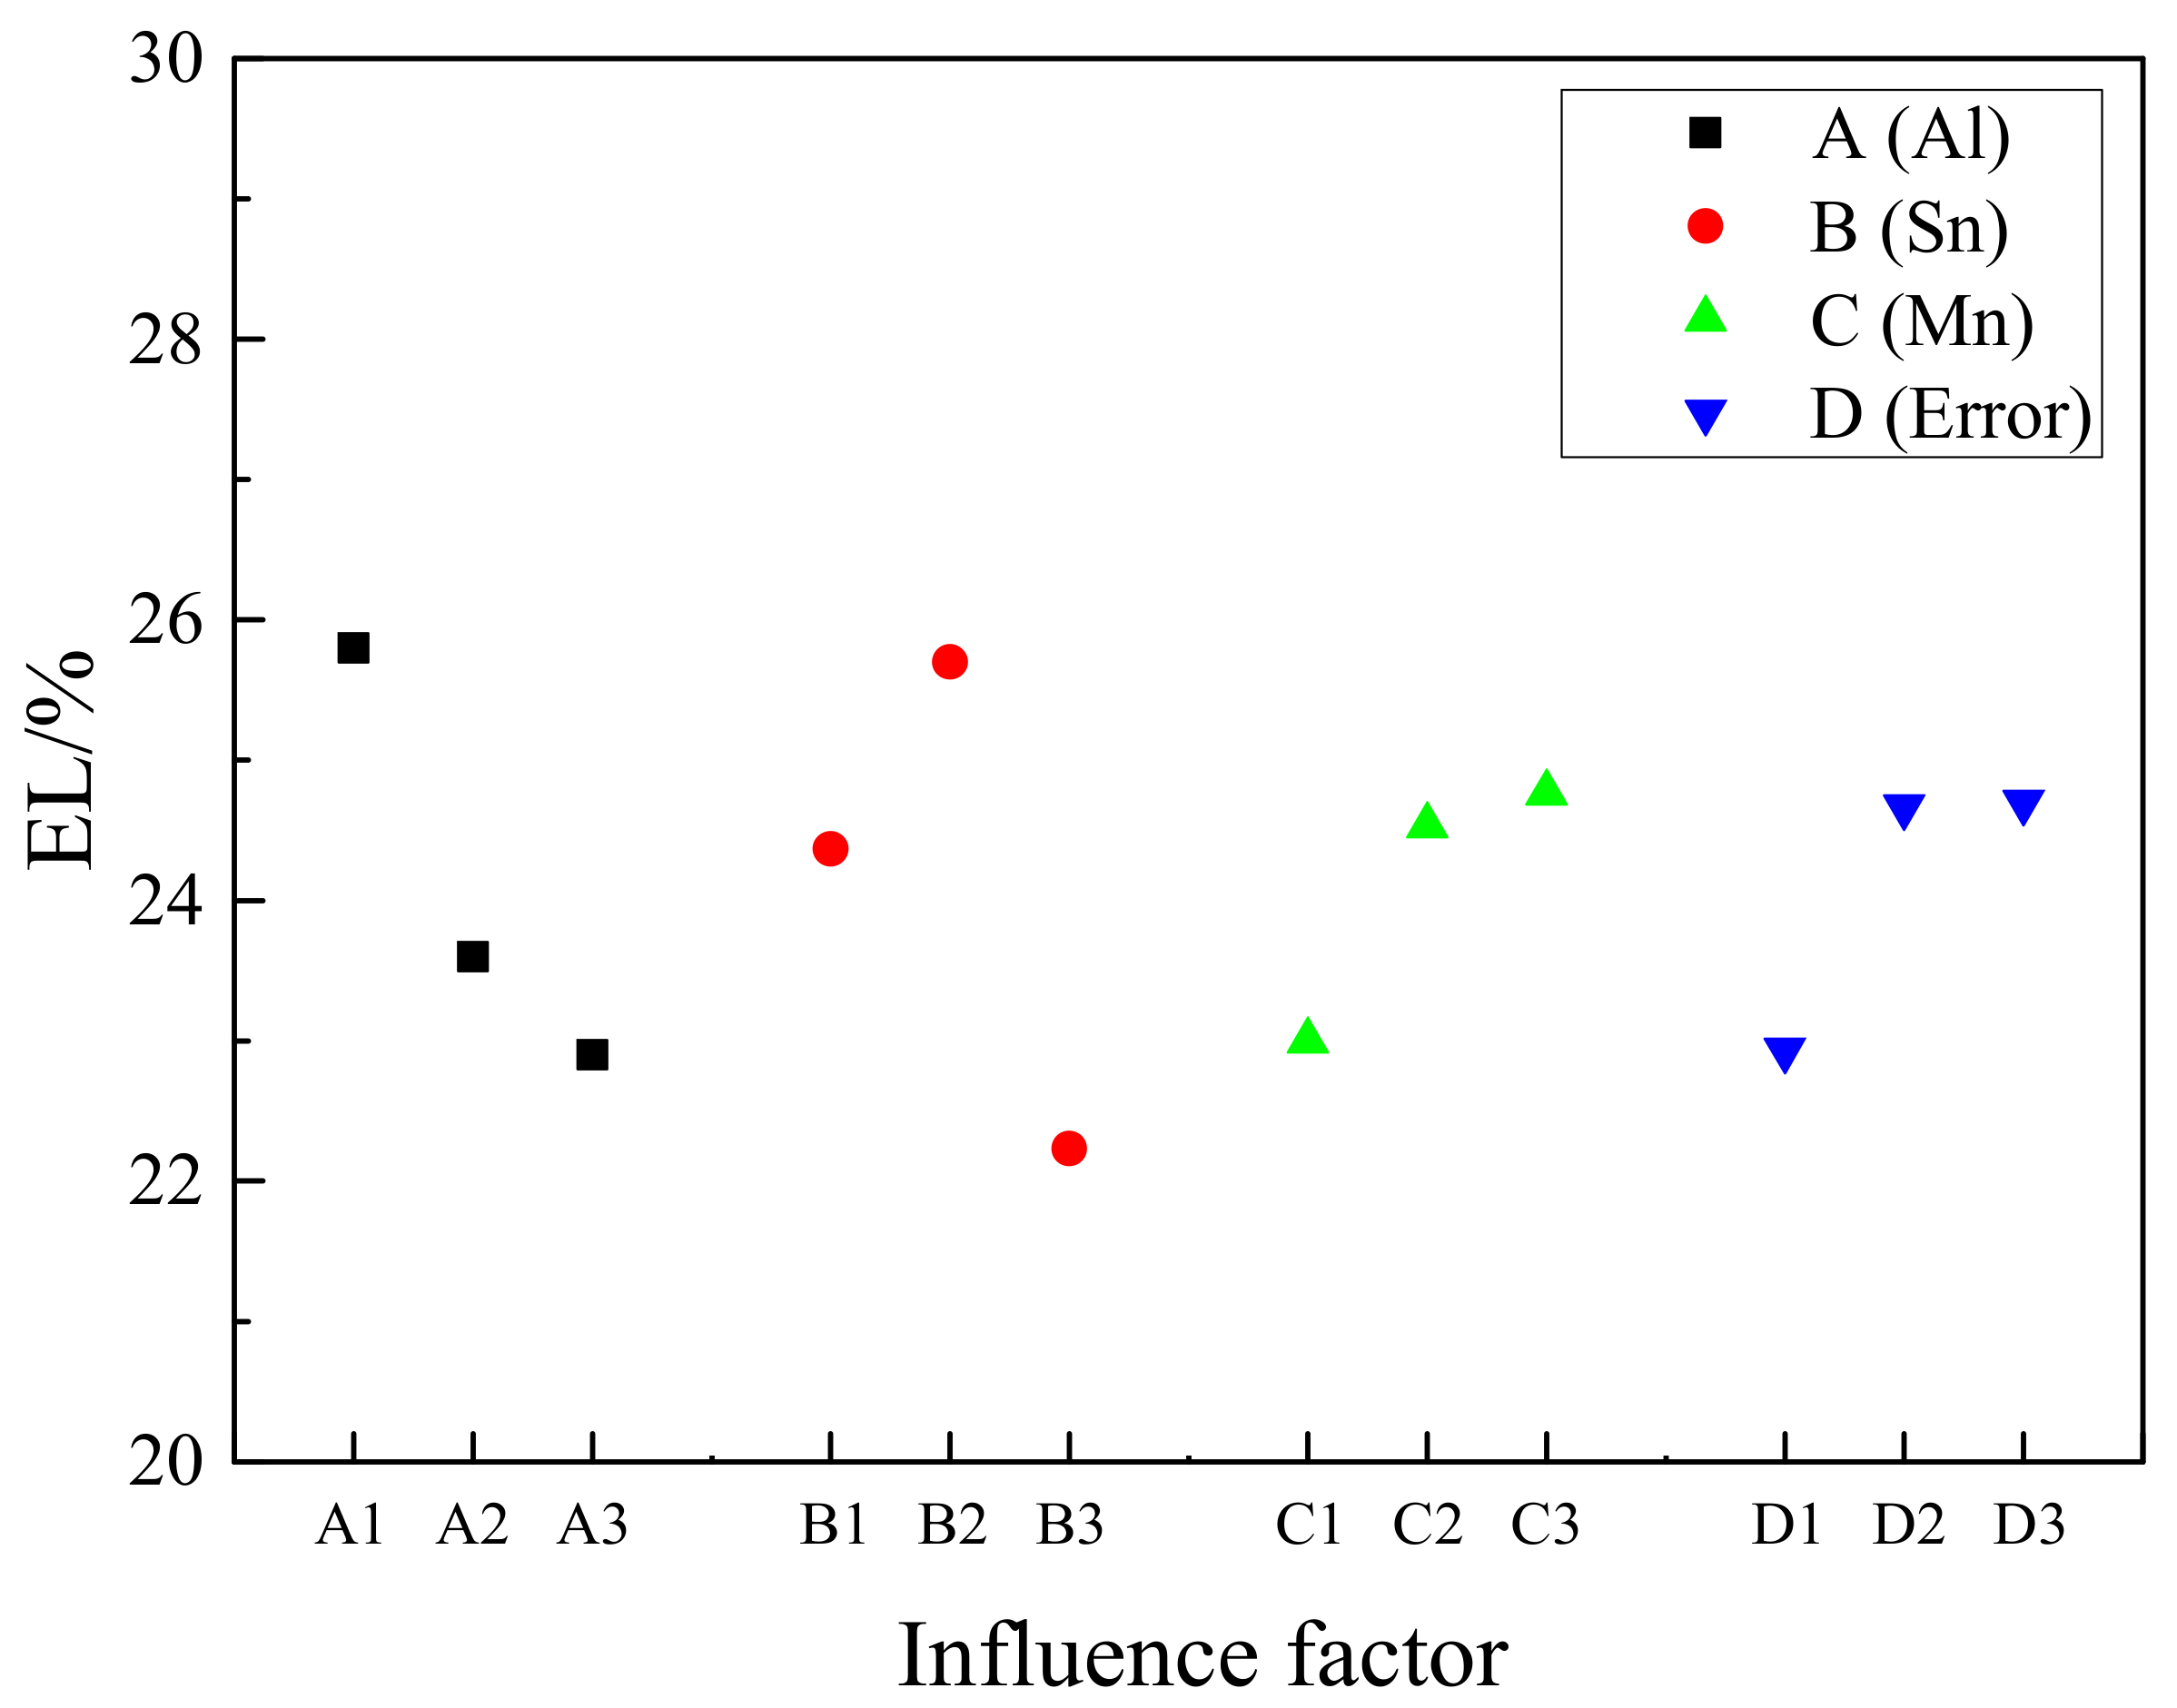
Combining with
Figure 13, when the content of Al increases from 5 wt.% to 7 wt.%, the elongation of the alloy decreases and the optimum Al content is 5 wt.%. It is contrary to the trend of strength. The elongation increased greatly when the Sn addition increased from 1 wt.% to 2 wt.%. However, when the Sn content increased to 3 wt.%, the elongation decreased significantly. So, the optimum selection of Sn content is 2 wt.%. Similar to the Al and Sn selection methods, the optimum content of Mn is 0.4 wt.%.
Therefore, in theory, the AT52-0.4 Mn has the highest elongation, but it is not in the nine alloys of this design. As the content of Mn has little effect on the elongation, the content of Mn can be selected to 0.2 wt.%.
Above all, the optimum composition of the alloy with the highest elongation is Mg-5Al-2Sn-0.2Mn (AT52-0.2Mn). The EL of the best composite alloy is the highest in this test sample, reaching 28.4%.


