2.1. Raw Material
Eucalyptus globulus Labill from Galicia, Northwest Spain, was used in this research. The boards were kiln-dried prior to sample preparation. It is worth noting that the boards were approximately knot-free (knot diameter less than 1/20 times board width), which is a characteristic feature of this species. Each board is identified with a reference number shown in
Table 1. This table also includes the boards´ densities (ρ) determined for a reference moisture content of 12%, and the corresponding static longitudinal modulus of elasticity in the grain direction (
EL) resulting from edgewise bending tests under four-point loading according to EN 408:2011 [
23].
The orthotropic average values for the radial modulus of elasticity
ER = 1820 MPa, the tangential modulus of elasticity
ET = 821 MPa, the shear modulus of elasticity in the LR plane
GLR = 1926 MPa, and the shear modulus of elasticity in the LT plane
GLT = 969 MPa, are taken from [
24] using Galician
Eucalyptus globulus with a similar density to the boards used in this study. These parameters were obtained by compression tests coupled with a stereovision system (DIC 3D). DCB specimens were prepared from these boards according to the specifications shown in
Section 2.3.
2.2. Compliance-Based Beam Method (CBBM)
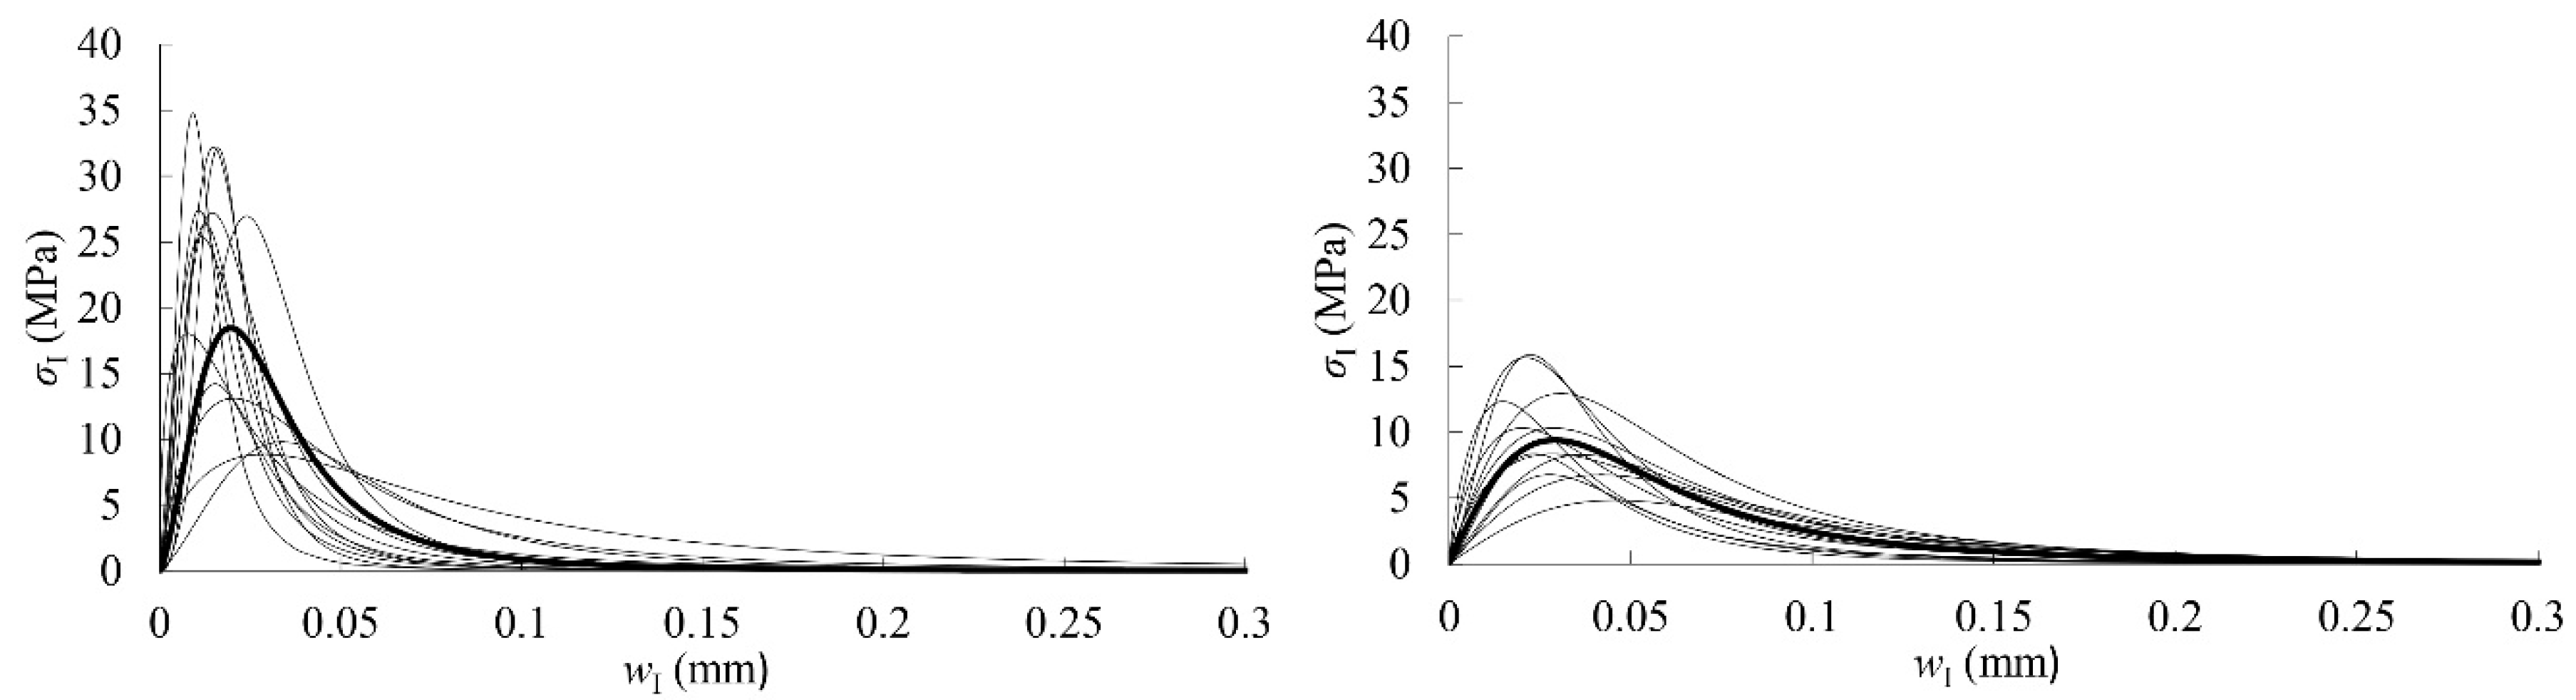
The procedure applied to determine the cohesive law corresponds to a direct method that requires establishing the relationship between the strain energy release rate in mode I loading (
GI), the crack tip opening displacement (
wI), and the traction tension (
σI), according to Equation (1).
The cohesive law in mode I, defined as
, can be then determined by differentiating Equation (1), as follows:
This requires the accurate measurement of
GI evolution as a function of
wI in the course of an experimental fracture test (in this case a DCB test, see details in
Section 2.3). The classical data reduction schemes used for this purpose are based on beam theory or compliance calibration and require crack length (
a) measuring during testing [
25]. However, the fracture process zone (FPZ) ahead of the crack tip in wood involves toughening mechanisms, such as microcracking, crack-branching, or fiber-bridging, hindering the identification of the crack tip and therefore also the
a-measurement. To overcome this problem, the Compliance Based Beam method (CBBM) [
20,
26] is shown to be a suitable alternative. It is based on Timoshenko beam theory and it introduces the concept of an equivalent crack length (
aeq), accounting for the FPZ effect given by
aeq =
a + Δ + Δ
aFPZ. Accordingly, compliance for a DCB specimen during crack propagation can be written as
where
GLR is the shear modulus in the LR plane;
B and
h the specimen dimensions; and,
Ef the corrected flexural modulus (instead of
EL) to take into account the cross-section rotation effects at the crack tip during testing and local stress concentrations.
Ef can be estimated from Equation (4) when considering the initial compliance (
C0) and a corrected initial crack length (
a0 + Δ)
where Δ represents the Williams correction term given by [
27] in the form:
An iterative process can be used to solve Equations (4)–(6) until a converged value of Ef is reached. It must be noted that ET and GLT values should be used instead of ER and GLR in Equations (3)–(7) when the TL crack propagation system is considered.
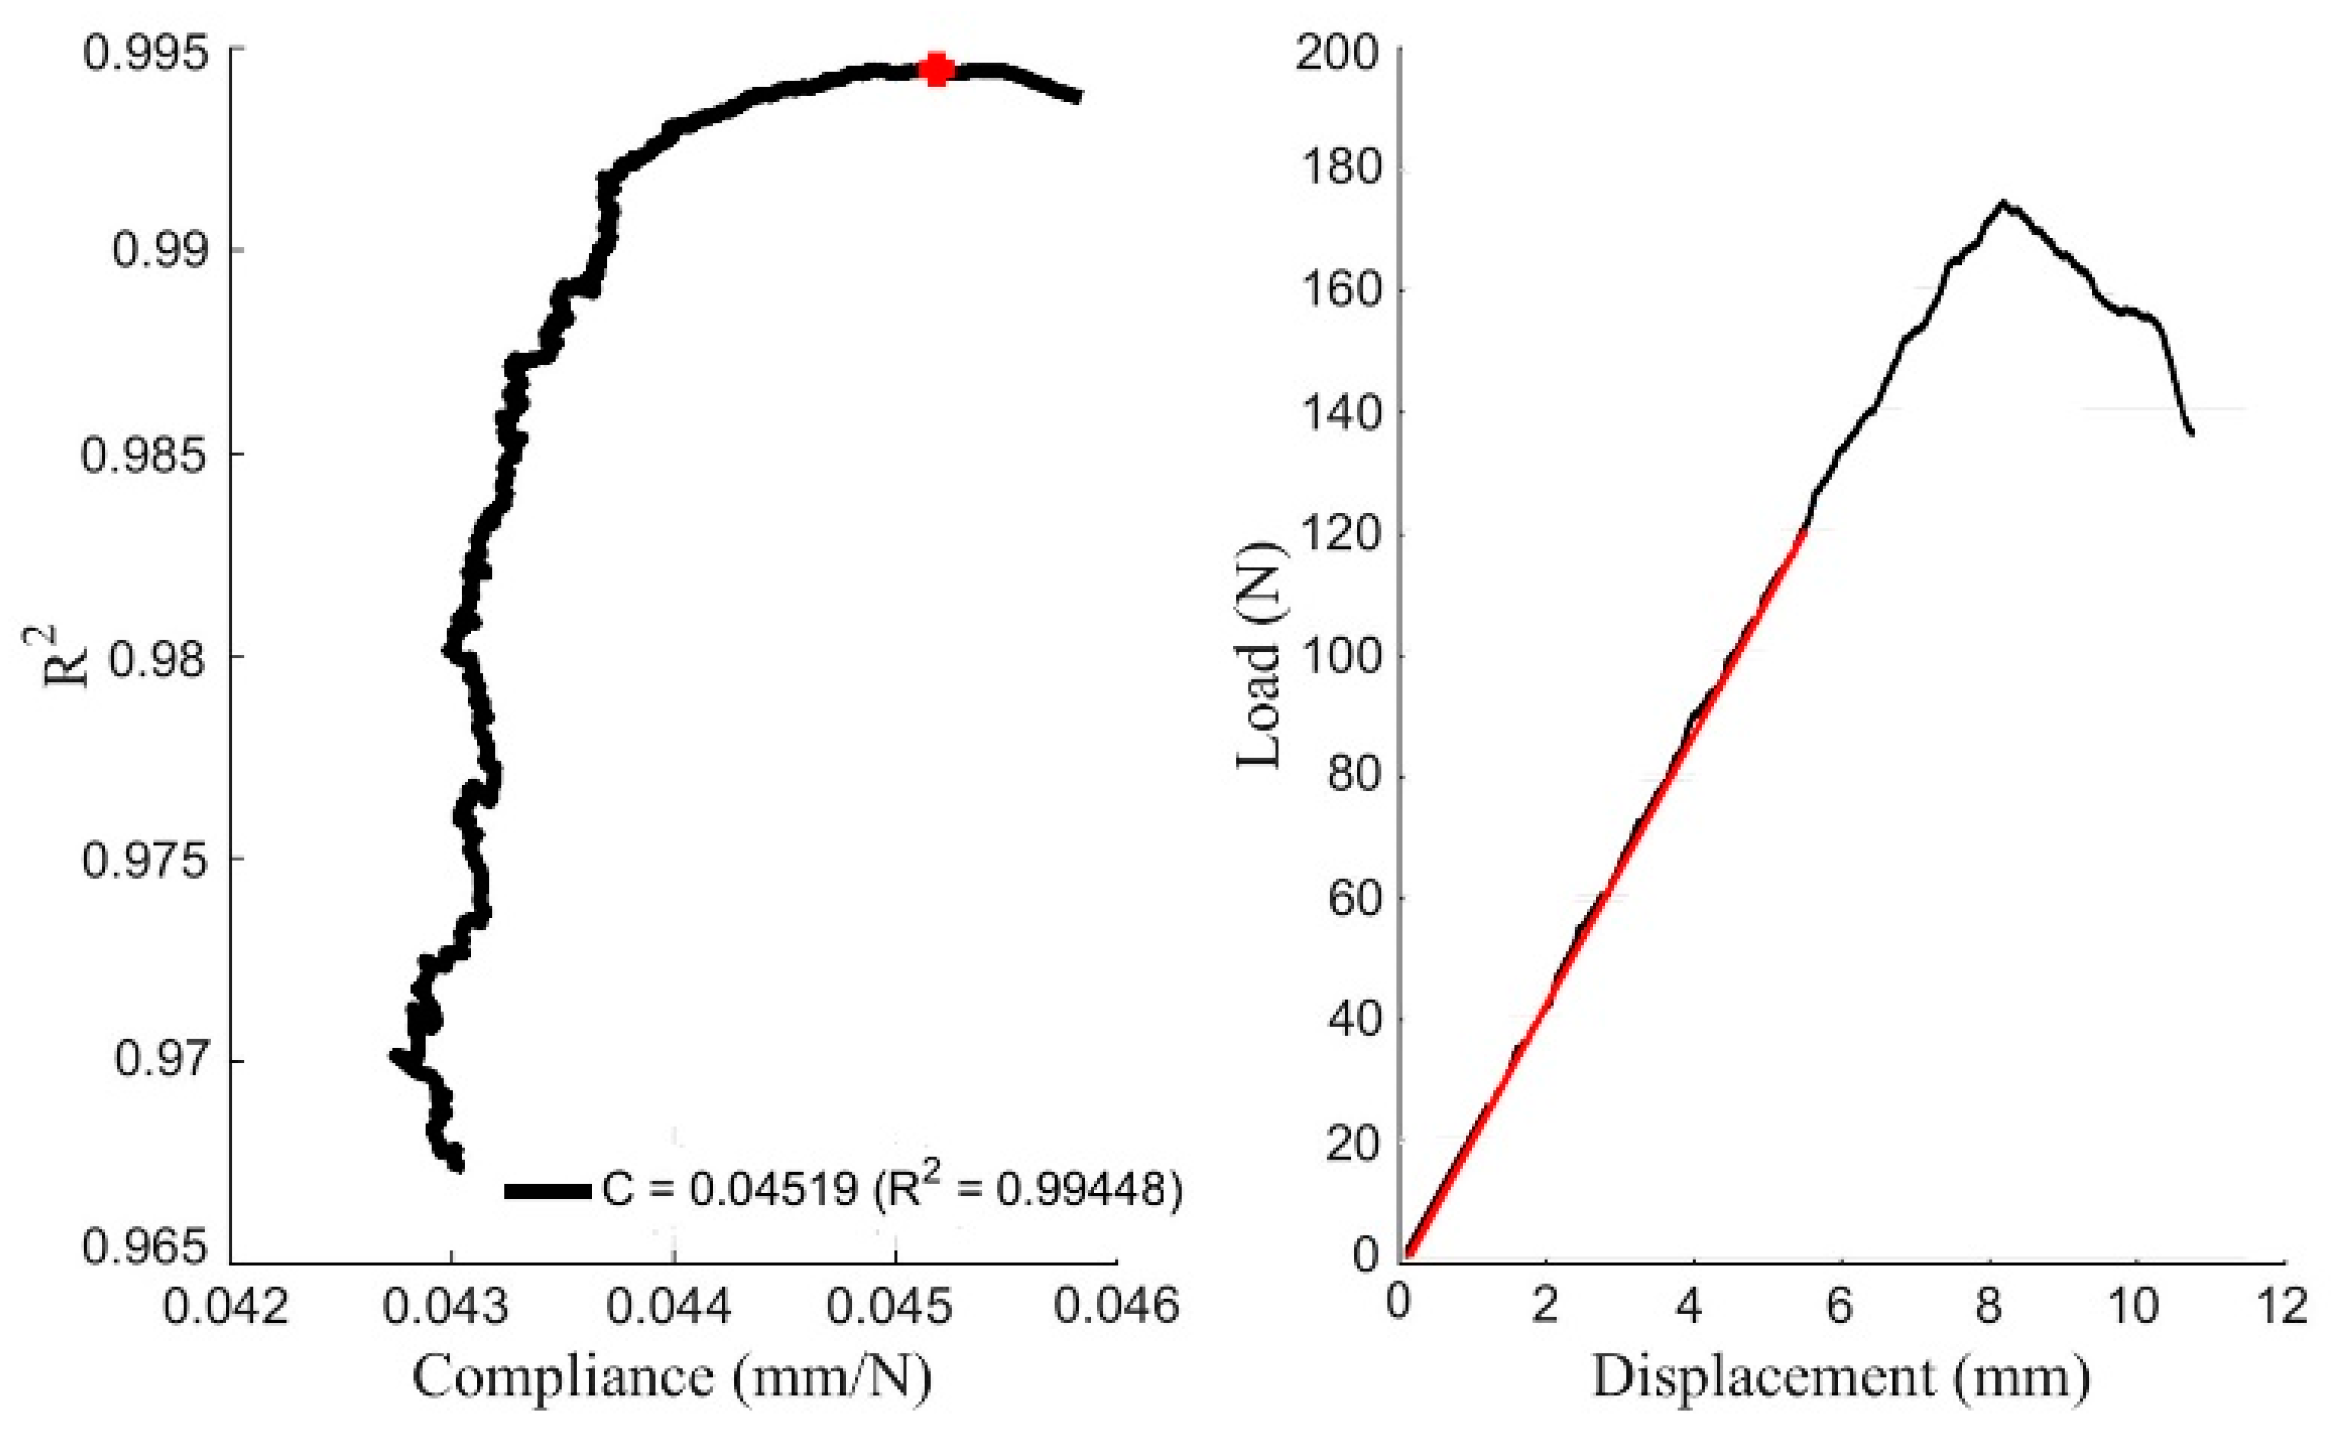
The equivalent crack length,
aeq, that meets the specimen compliance recorded during propagation is evaluated from a polynomial function solved with Matlab
® (Mathworks, Madrid, Spain), according to [
20].
Let us consider the Irwin-Kies equation [
28]
the strain energy release rate in mode I (
GI) is obtained by combining Equations (3) and (7). It represents the resistance curve (
R-curve) of the material to the crack growth.
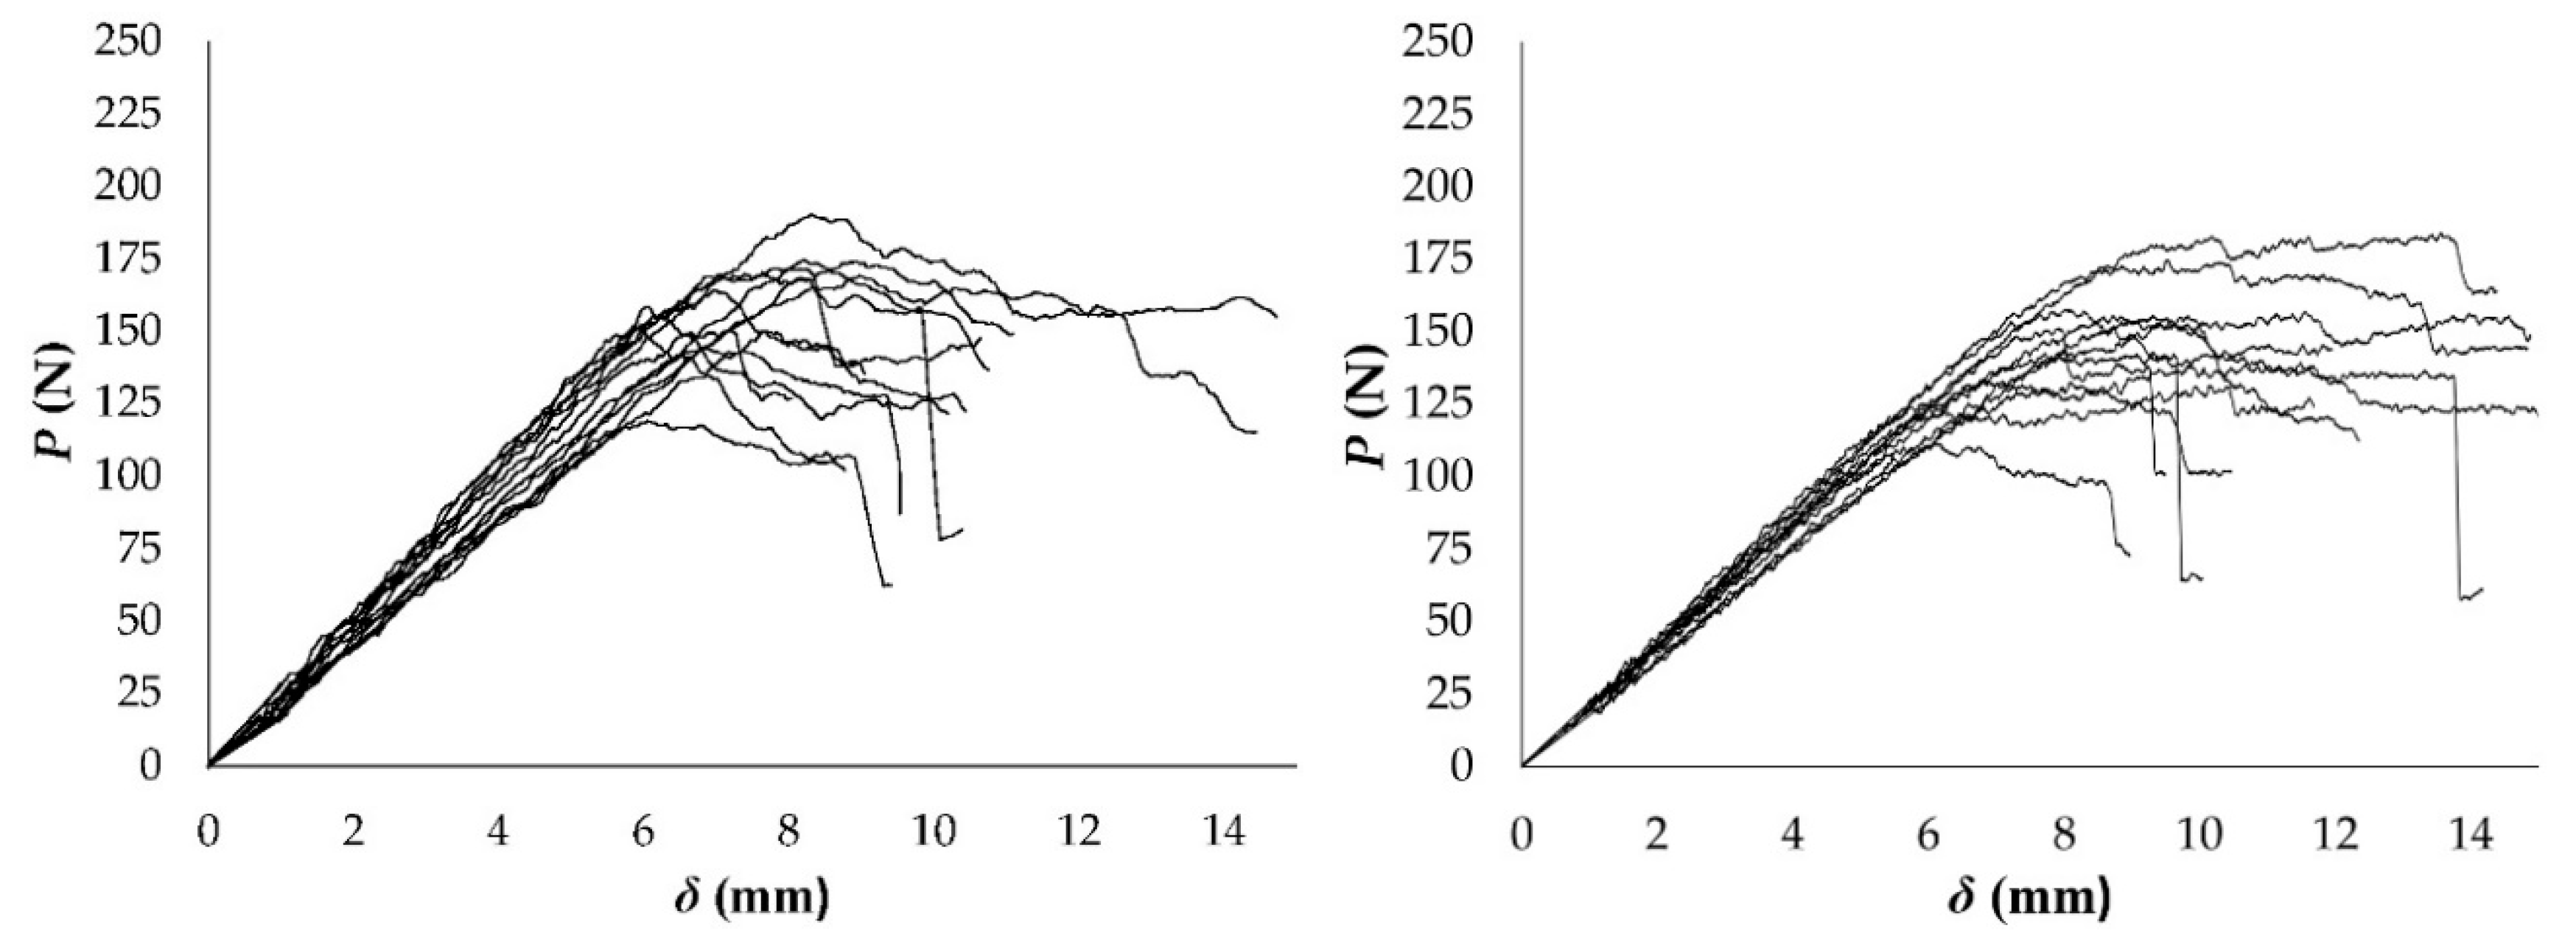
The CBBM method has the definitive advantage of only requiring the experimental load–displacement (
P–
δ) curve to derive the evolution of
GI without crack length monitoring, making it less sensitive to experimental errors. The
GI is then correlated with crack tip opening displacement in mode I (
wI), measured by the digital image correlation (DIC) technique during the test (see details in
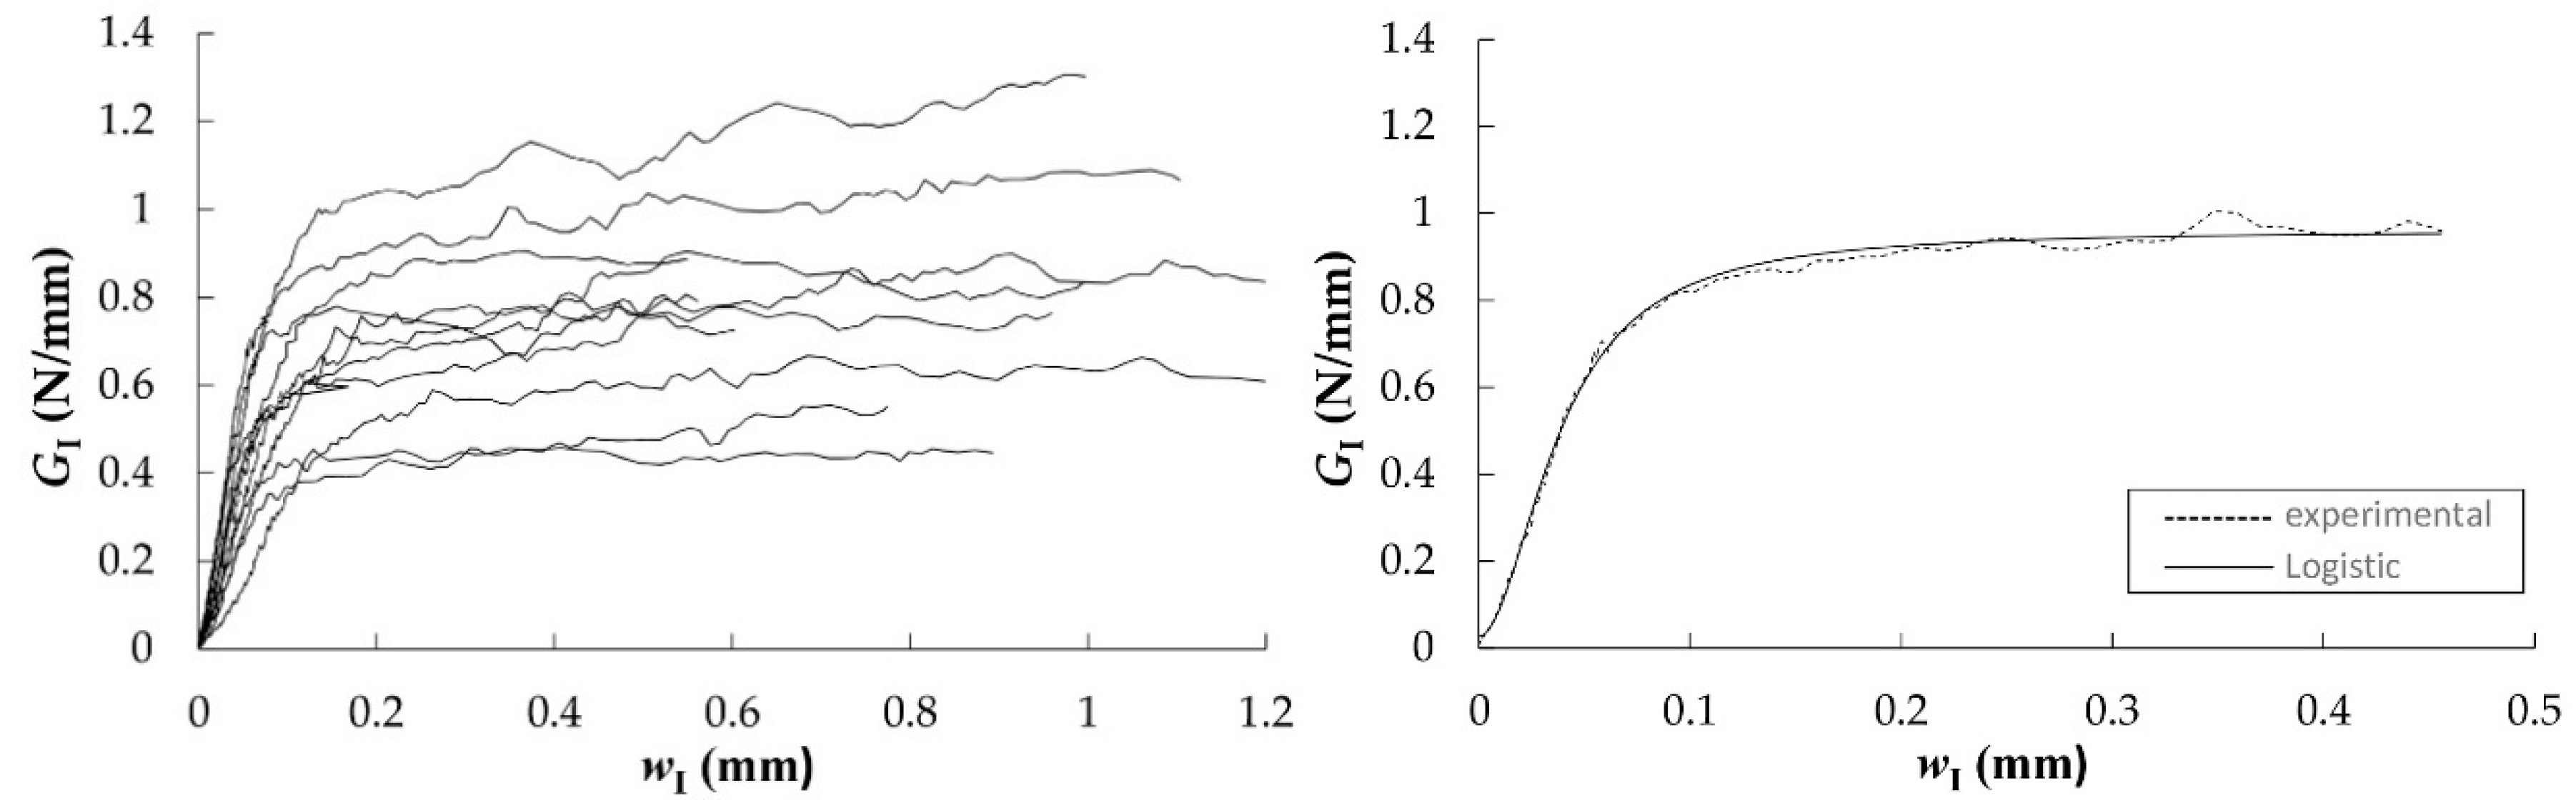
Section 2.3) and its derivative yields in the cohesive law expressed in Equation (2). It is therefore important to accurately evaluate the
relationship. This was performed in two ways for further comparison and discussion: (a) a smoothing spline using Matlab
® was adjusted to the experimental curve in order to soften the noise before differentiation; (b) the
GI-
wI data were fitted, in the least-square sense, by a continuous approximation function (logistic function), as follows,
where
A1,
A2,
p, and
wI,0 are constants determined by regression analysis. Although this function has no particular physical meaning, it is simply a tool for the analytical differentiation that is required to obtain the cohesive law. The
A2 parameter must provide an estimation of the critical strain release, as
The direct approach presented in this data reduction scheme can be potentially extended to other fracture modes, including mode II by means of the end notched flexure (ENF) test [
29,
30].
2.3. Double Cantilever Beam (DCB) Test Coupled with Digital Image Correlation
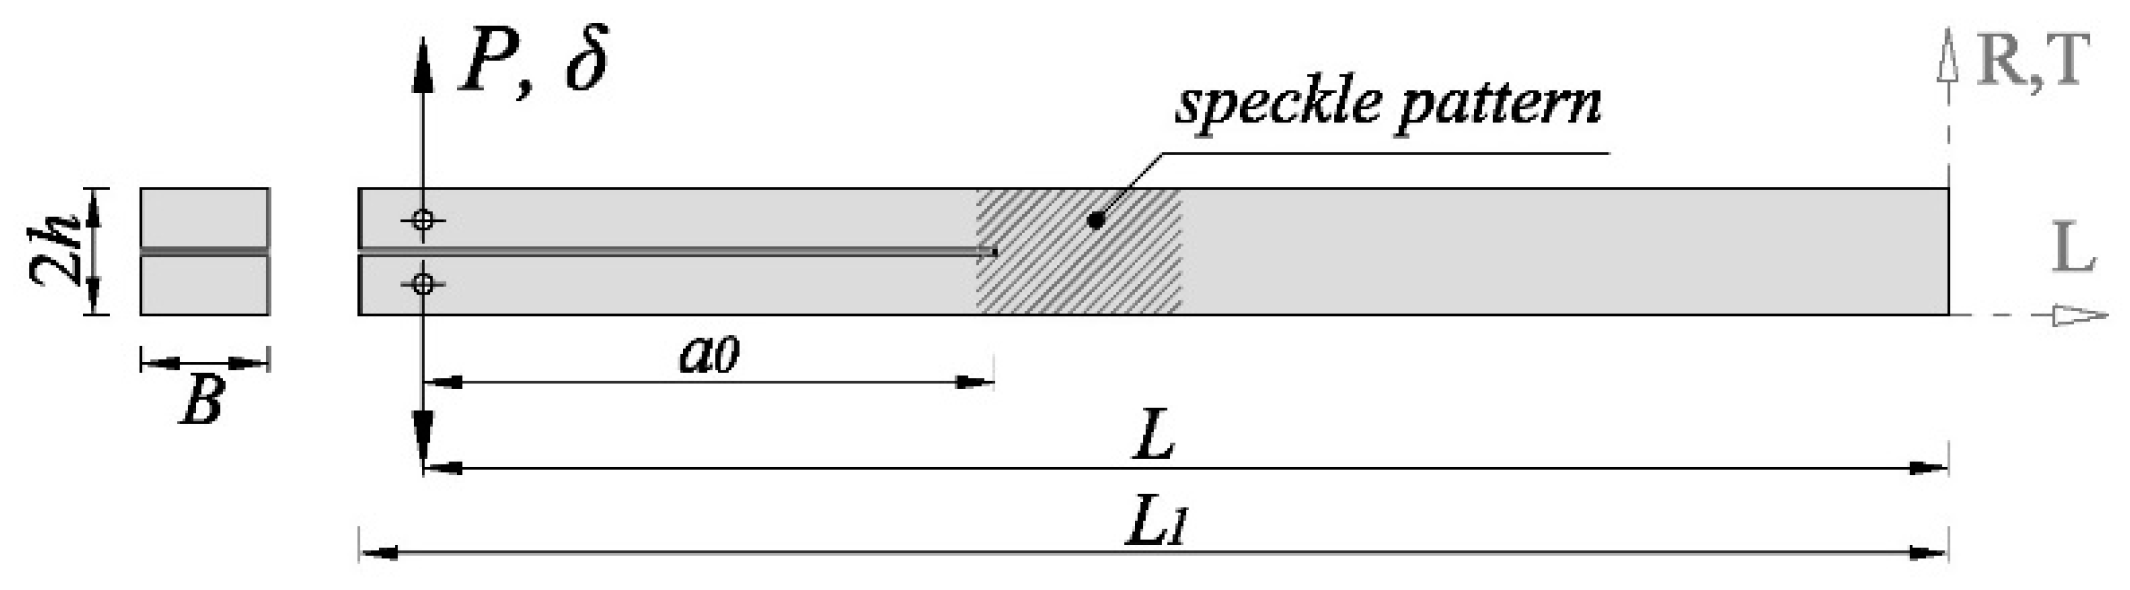
Thirteen DCB specimens that were oriented along the RL crack propagation system and fourteen oriented along the TL system were prepared for fracture tests. The first letter indicates the loading direction (Radial and Tangential, respectively) and the second letter refers to the crack propagation direction (Longitudinal). The DCB specimens consist of a rectangular beam with
L1 × 2
h ×
B mm (250 mm × 20 mm × 20 mm) nominal dimension, as schematically shown in
Figure 1. A mid-height pre-cracked surface of 100 mm in length and 1 mm thickness was initially performed. This initial notch was then lengthened a few millimeters with a band saw in order to guarantee a sharp initial crack. The actual
a0 value for each specimen was measured after testing. A symmetrical pair of 3 mm diameter holes were drilled at 10 mm from the specimen end, where the load (
P) perpendicular to the pre-cracked surface was applied. The applied load was transferred to the specimen by means of two 3 mm diameter steel pins that were inserted into the holes.
Prior to testing, the specimens were conditioned at 20 °C and 65% relative humidity until equilibrium moisture content was reached. The mean value of moisture content was approximately 11%.
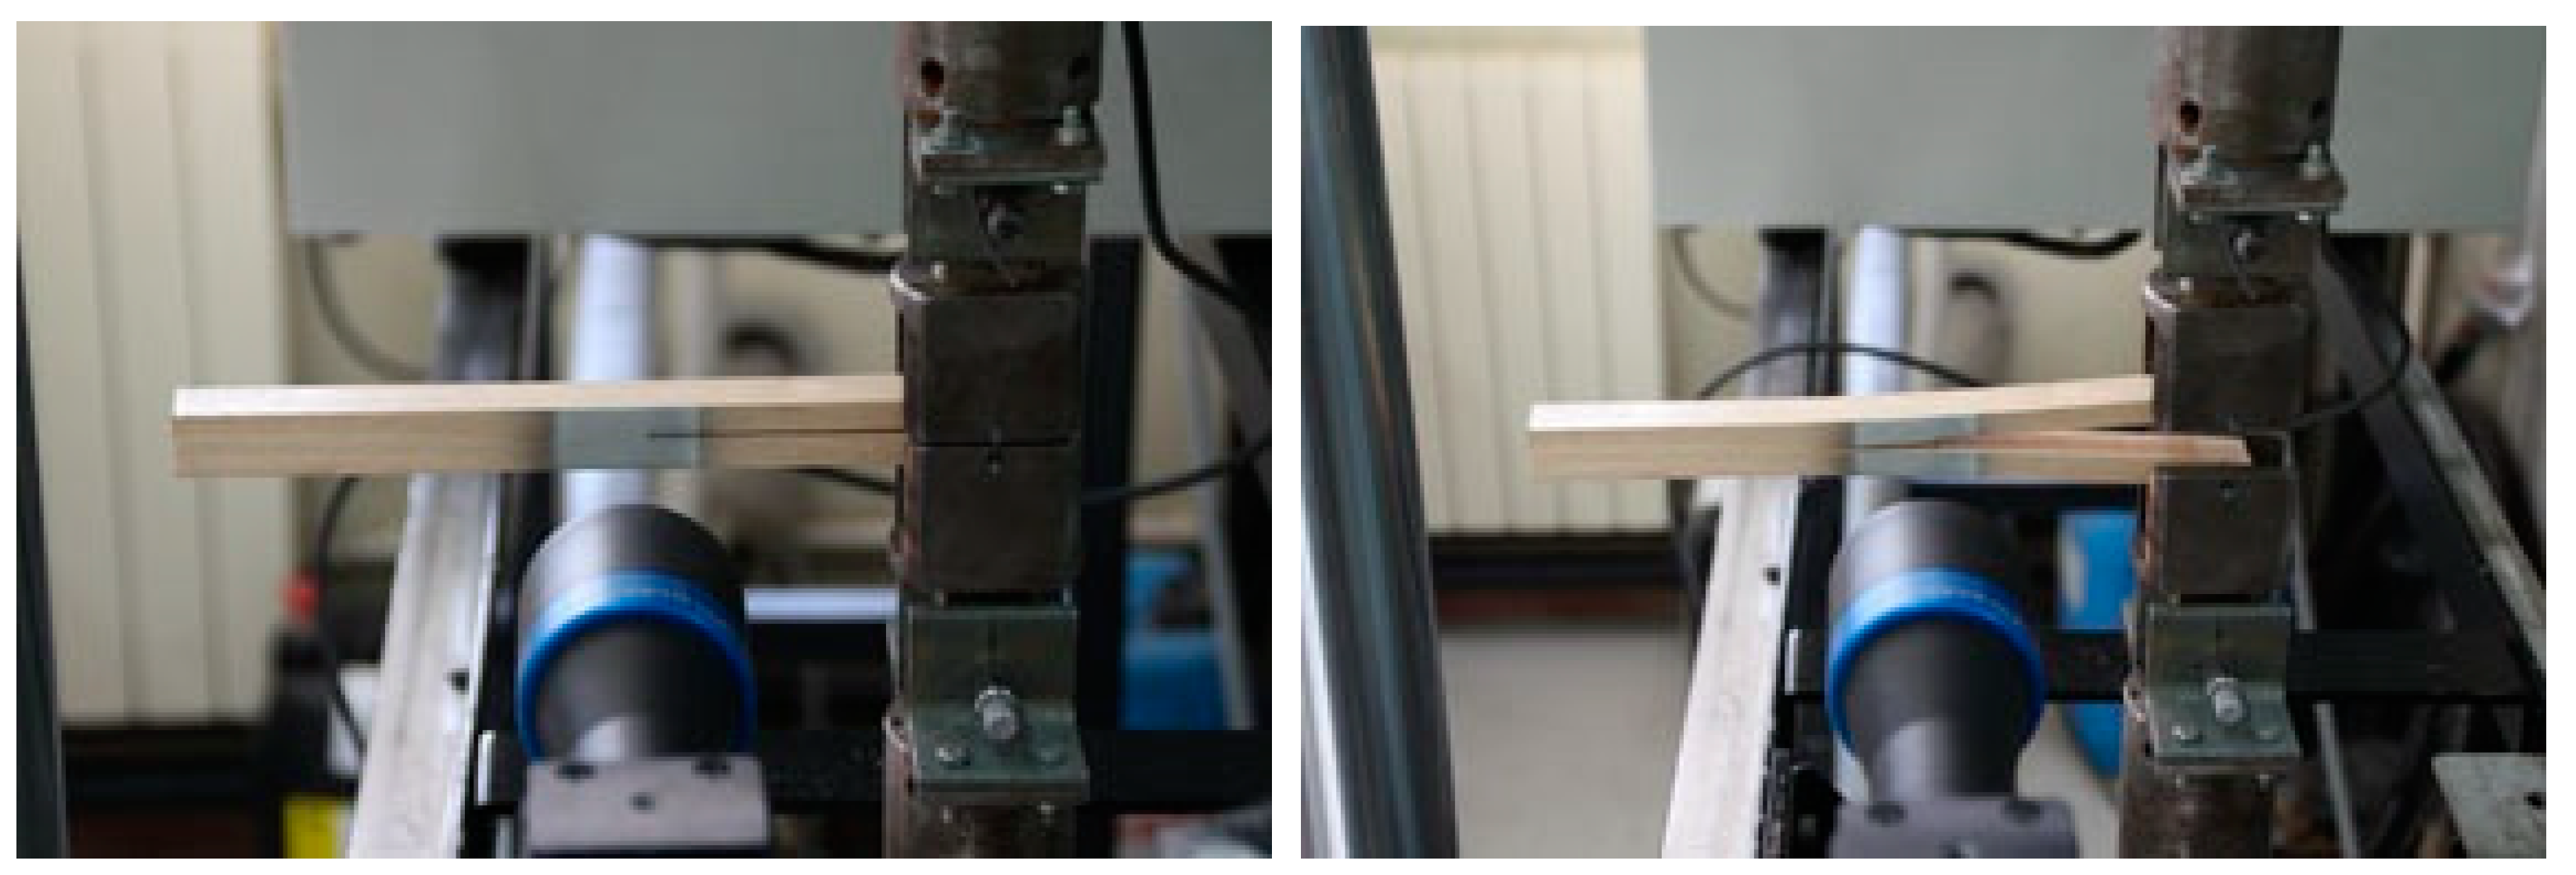
The fracture tests were carried out using an INSTRON 1125 universal testing machine (Instron, Barcelona, Spain) with a load cell having a maximum capacity of 5 kN and 50 N/V gain. Specimens were loaded under 3 mm/min displacement control.
Crack mouth opening displacement was recorded using the optical system ARAMIS DIC-2D (GOM mbH, Braunschweig, Germany) [
31,
32] (
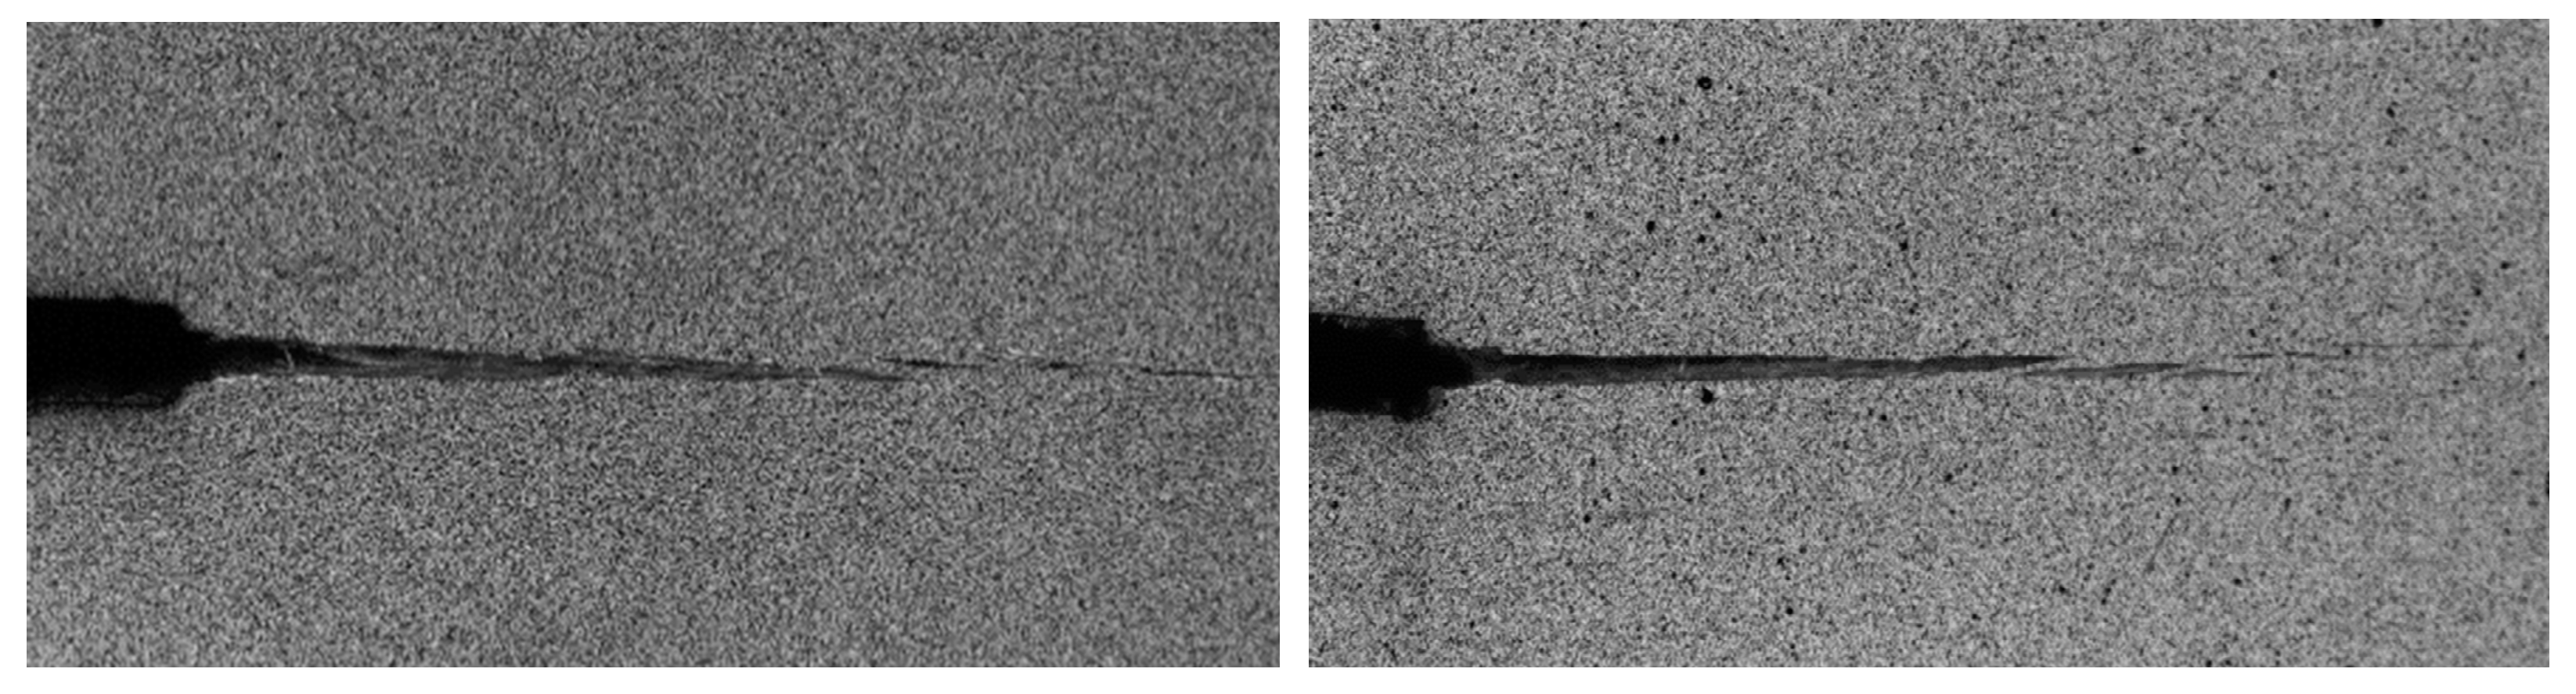
Figure 2). This is a non-contact system that applies the principles of digital image correlation (DIC). This technique shows clear advantages in comparison with traditional measurement methods since it makes it possible to measure the deformation field of a whole specimen area, providing more robust results. It is composed of an eight-bit charge-coupled device (CCD) camera with a telecentric lens that was mounted on a translation bar for fine aligning of the optical axis with regard to the planar specimen surface. The specimens were illuminated by two cold light sources incorporated in the measuring device. A speckled pattern with black ink on a white matte surface is applied to the specimen by an airbrush IWATA, model CM-B (Anesta Iwata Iberica SL, Barcelona, Spain), so that proper granulometry contrast and isotropy at the magnification scale is ensured. The region of interest is focused on the area just in front of the crack tip, where the crack starts to propagate. The different components of the optical system and the measuring parameters selected for this work are compiled in
Table 2. Complete
P-
δ curves were obtained in all tests with an acquisition rate of 5 Hz, while the acquisition of images from DIC was made with 1 Hz frequency.
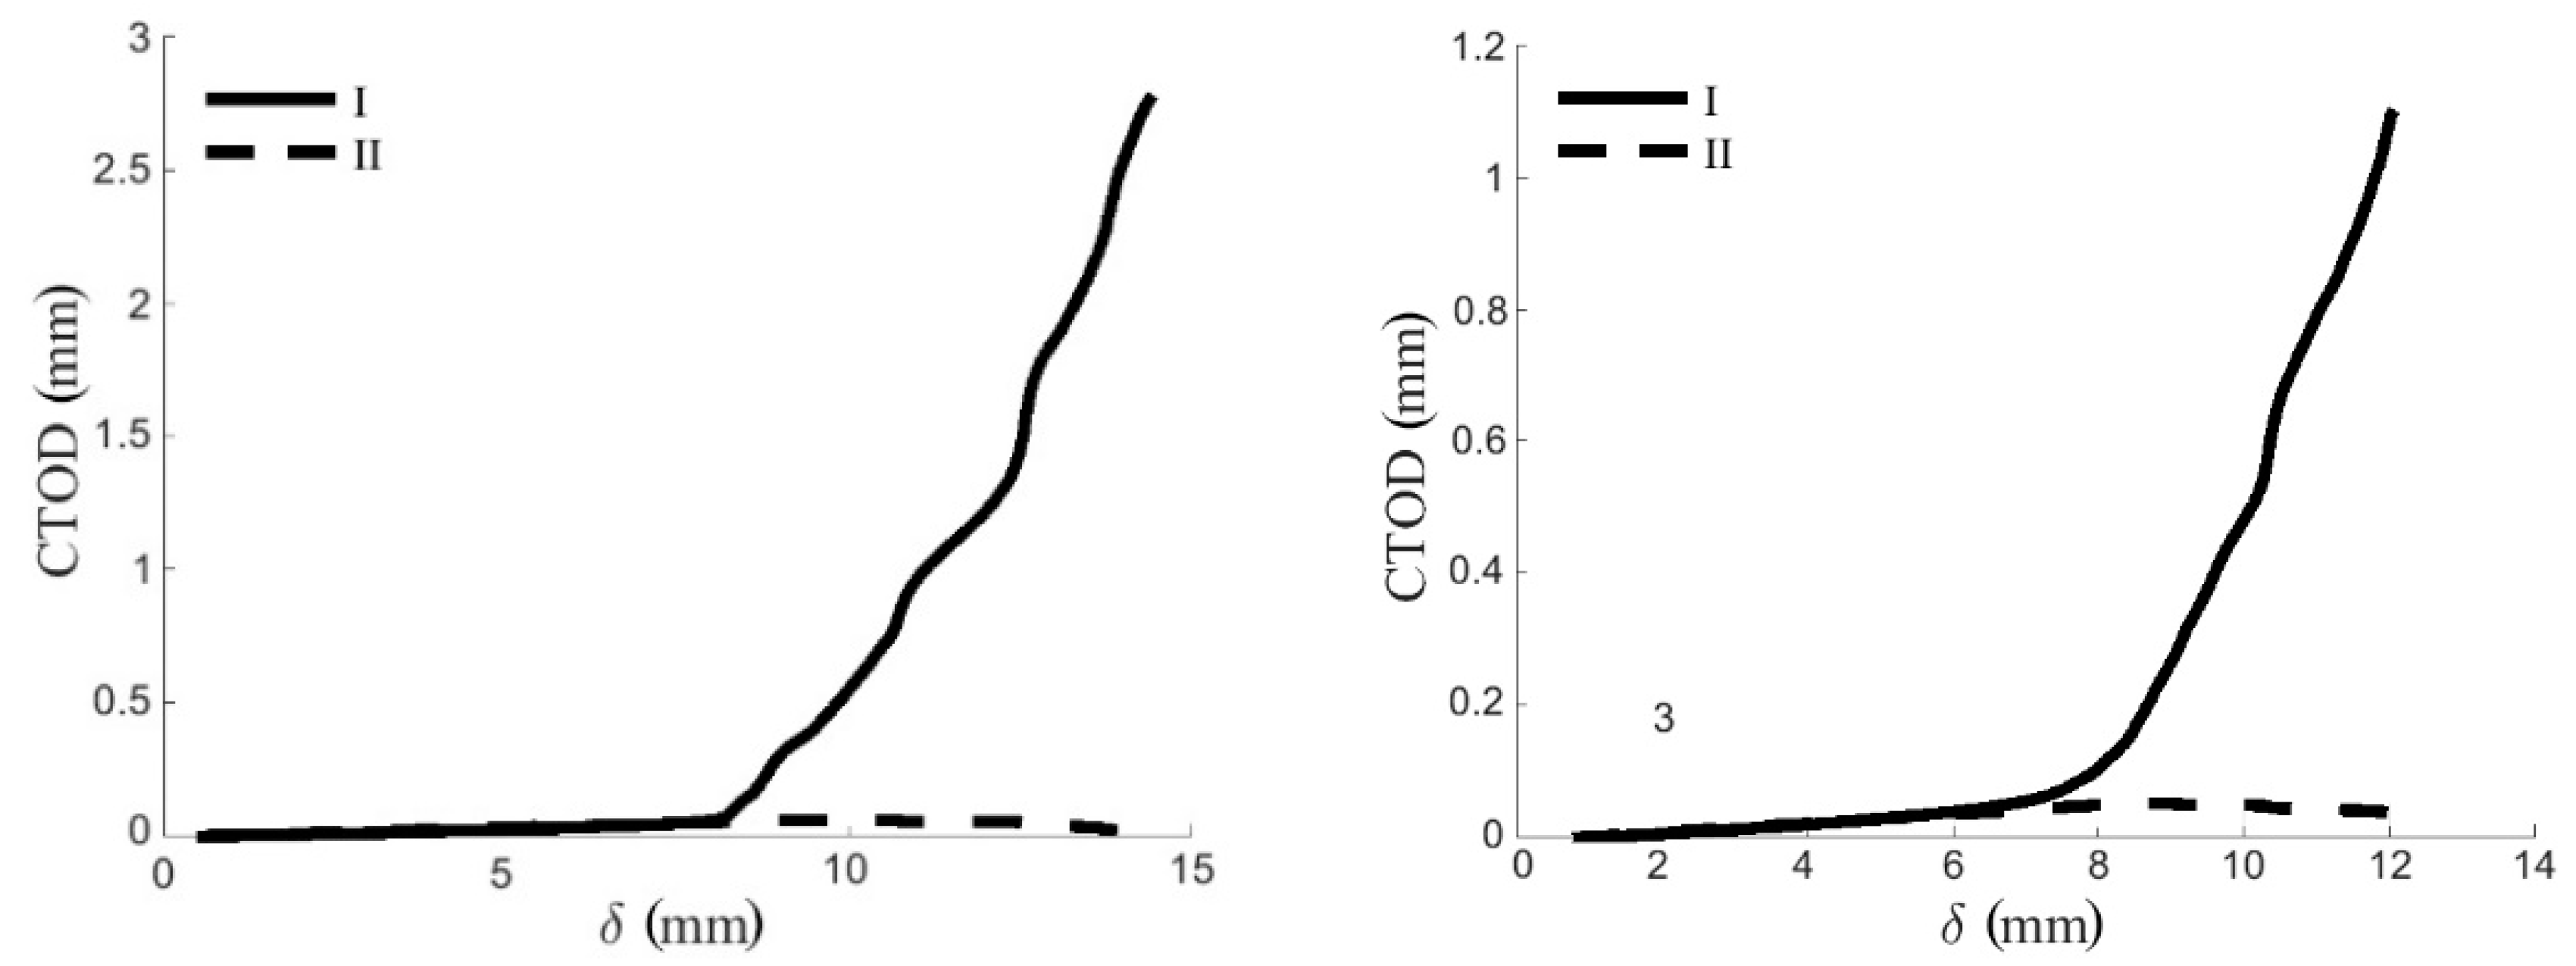
The crack tip opening displacement in mode I (
wI) was obtained by post-processing the displacements monitored by DIC. The initial crack length was firstly identified in the undeformed image. The relative displacement between a pair of subsets selected close to the crack tip is evaluated afterwards. The value of
wI is calculated as the Eucledian norm, as shown in Equation (9) [
33,
34].
where
and
are the displacement components in the direction perpendicular to the crack propagation associated to the upper and the lower cracked surface, respectively. This approach has the limitation of defining the cohesive law based on surface measurements, which may not be fully representative of the crack front over the volume of the FPZ. Current research interests have been expanded to the experimental observation of the volumetric crack front ahead of the crack tip by X-ray computed tomography [
35,
36] and exploring paths, which includes digital volume correlation, for the quantitative extraction of relevant mechanical [
37,
38] and fracture parameters [
39].


