Analytical Model for Load–Slip Relationship of Perfobond Shear Connector Based on Push-Out Test


Abstract
:1. Introduction
2. Push-Out Test
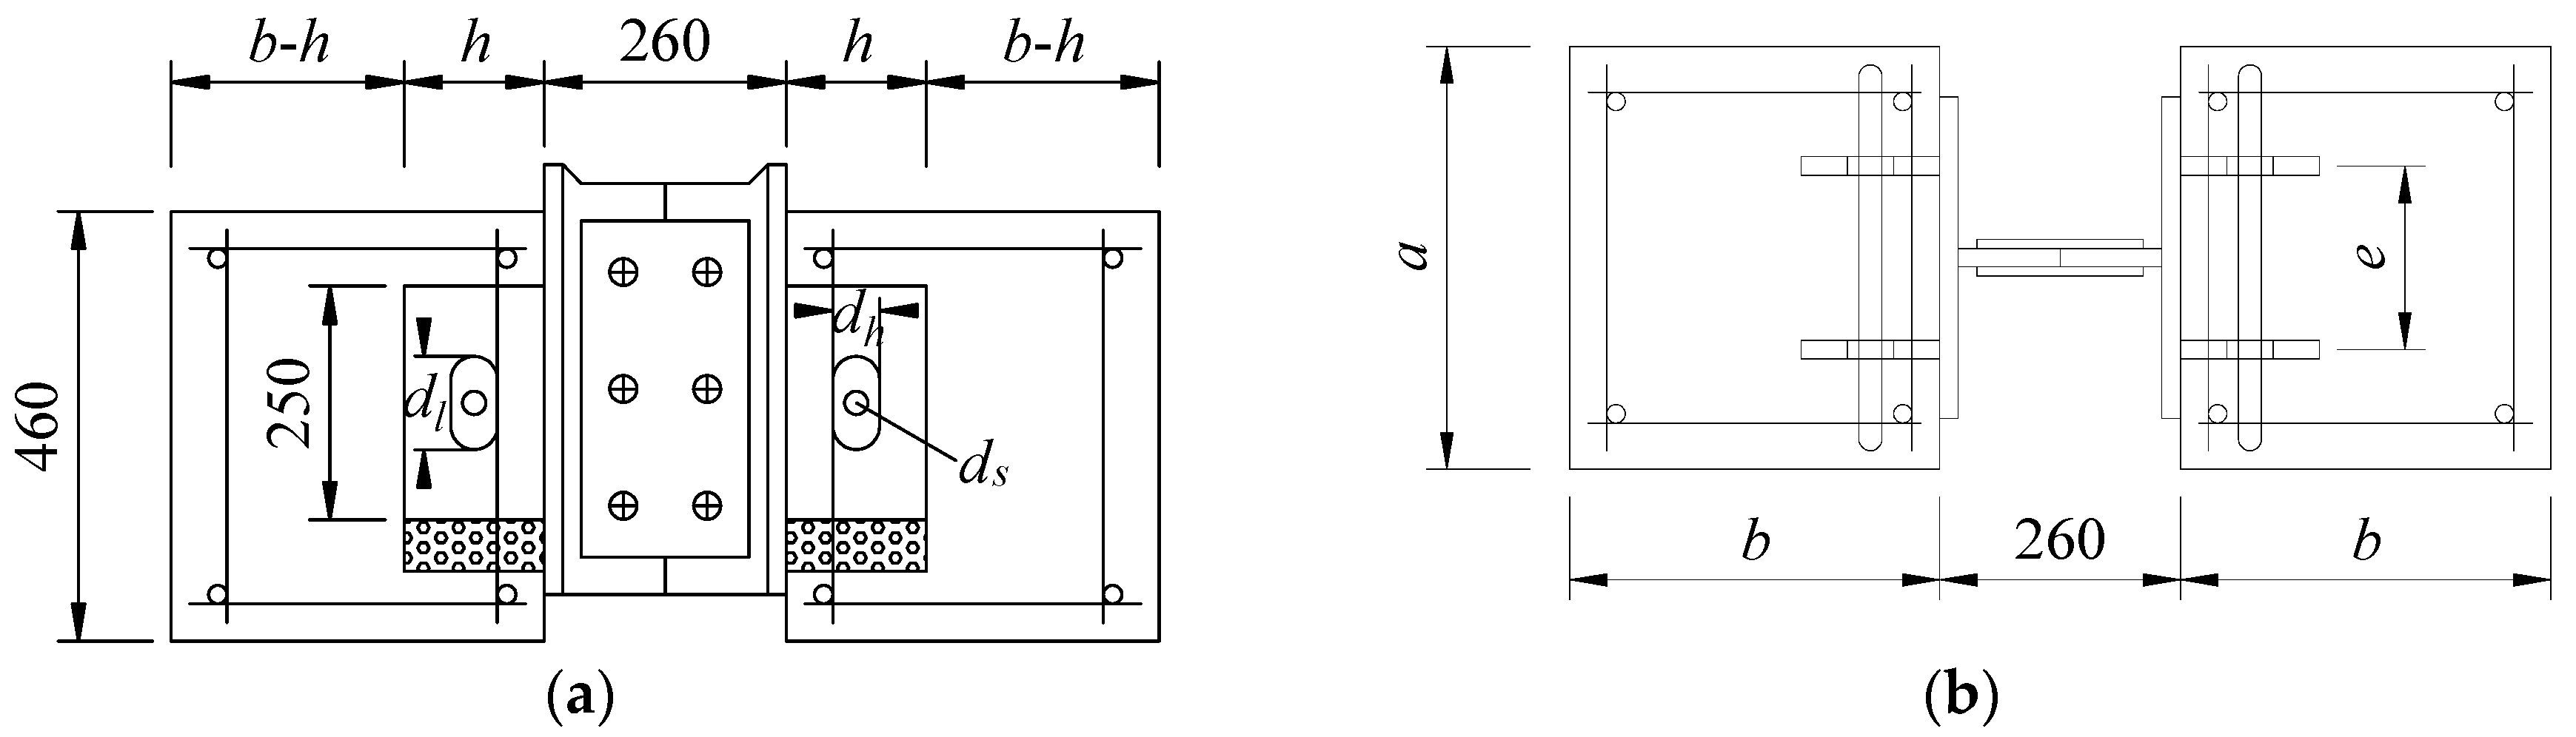
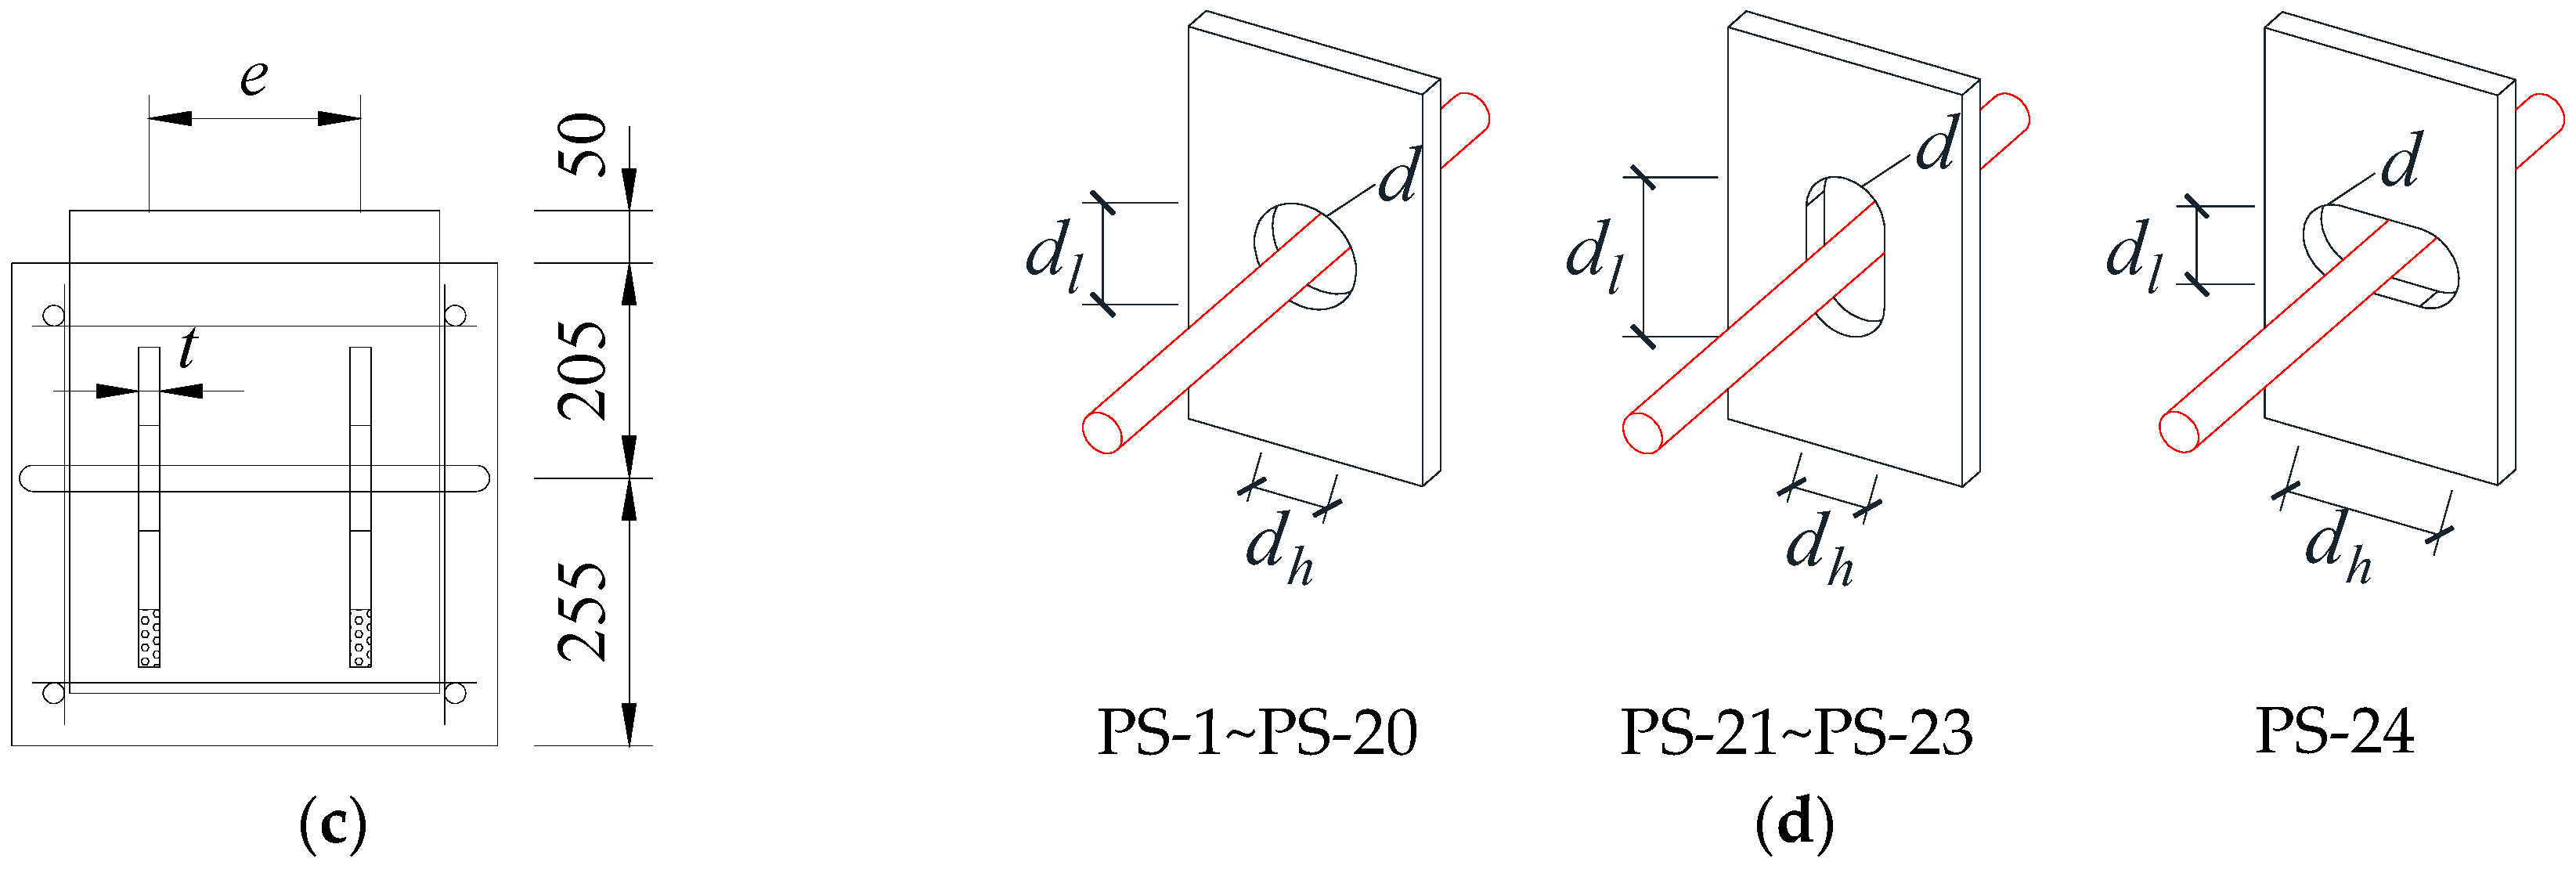
2.1. Test Specimens
2.2. Material Properties
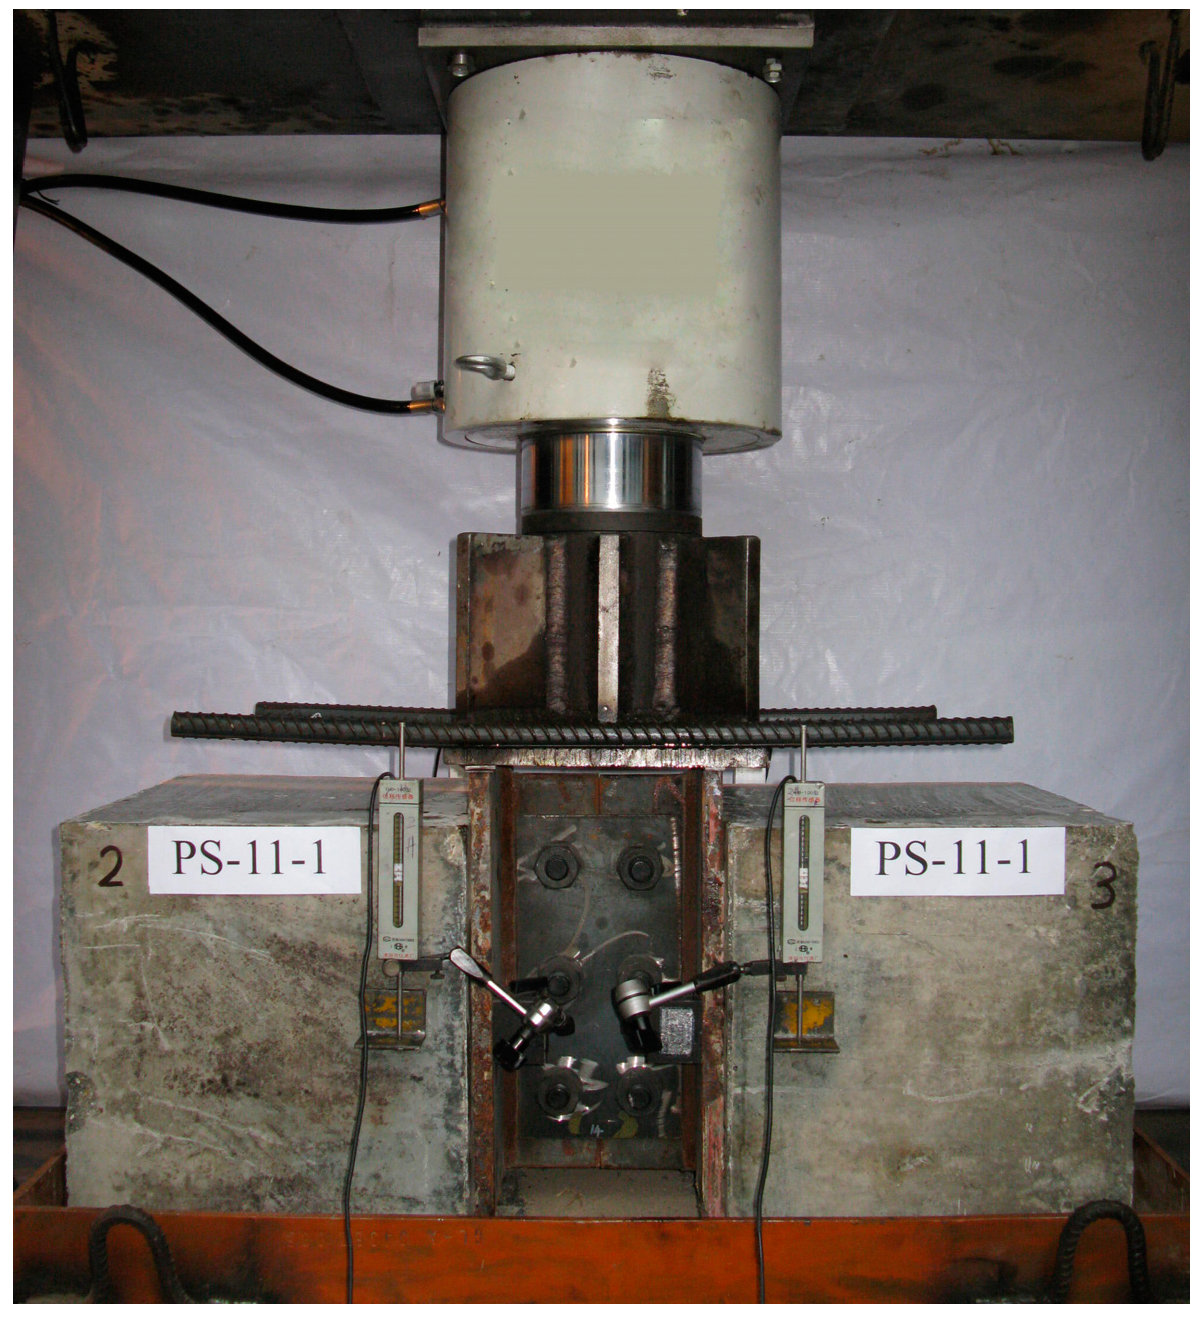
2.3. Test Setup and Instrumentation
3. Test Results
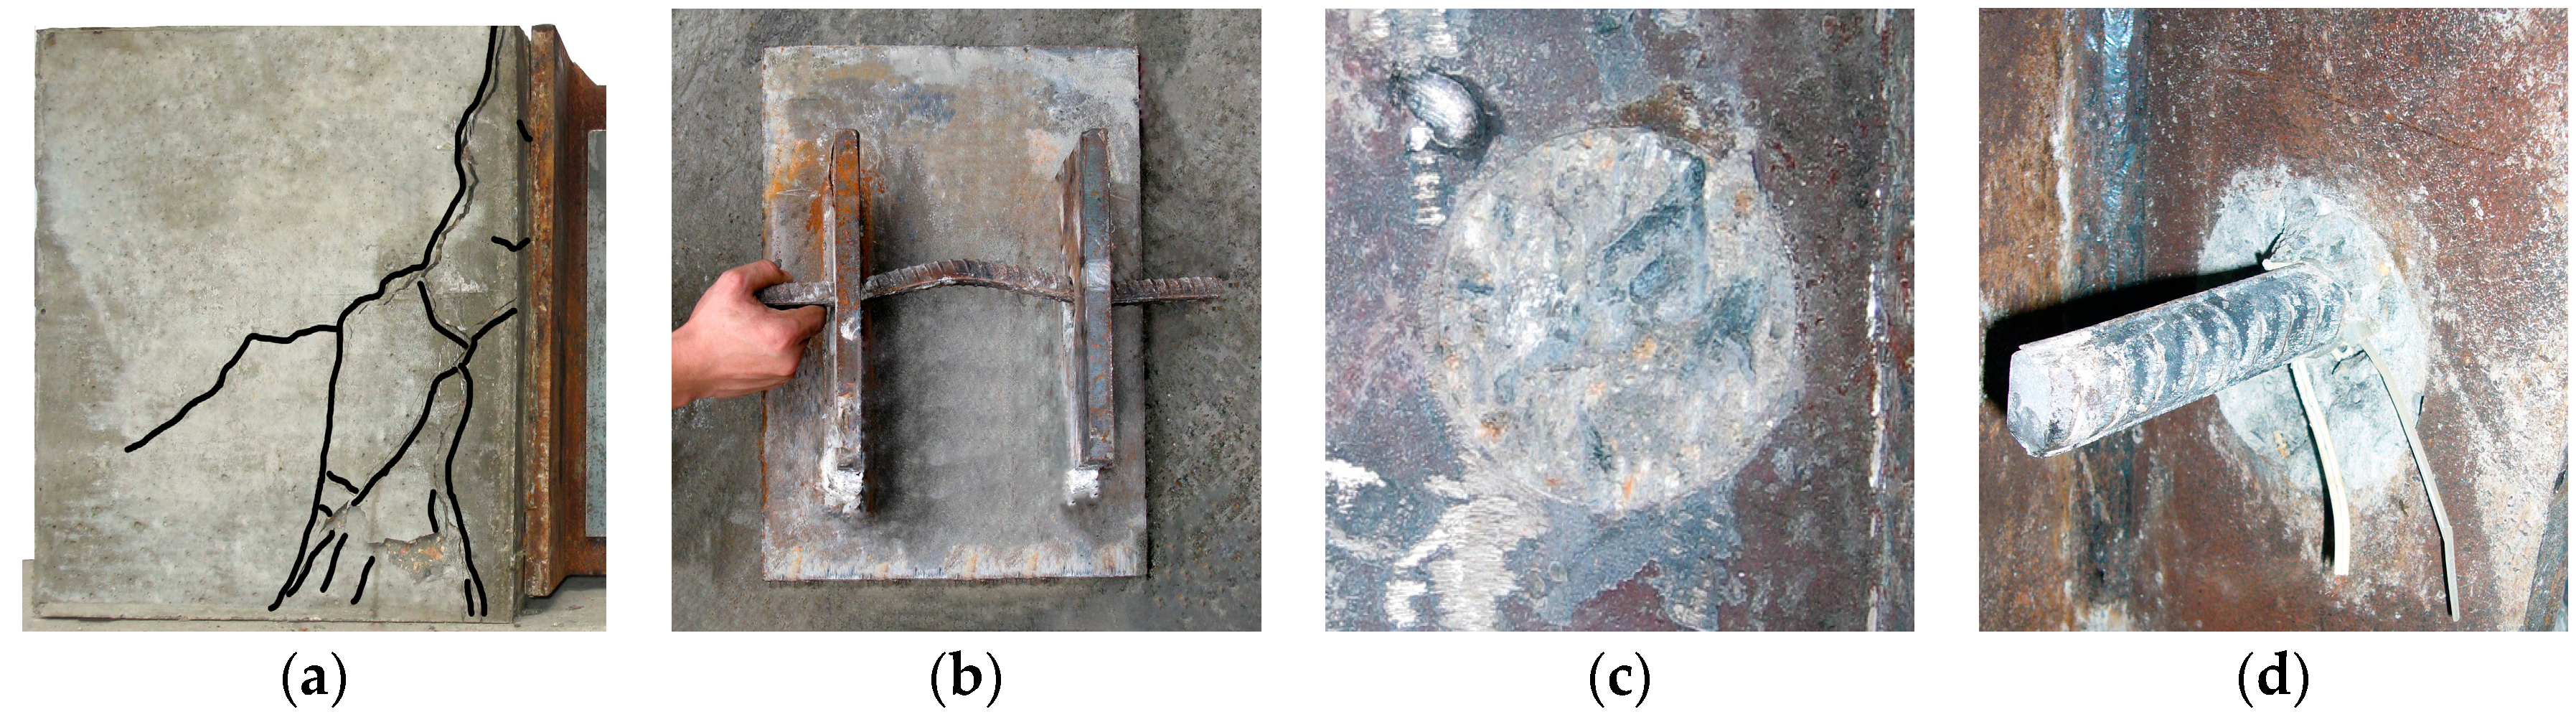
3.1. Failure Modes
3.2. Shear Mechanism
3.3. Load–Slip Response
3.4. Stiffness Variations
3.5. Stage Identifications
3.6. Curve Characteristics
4. Parametric Study
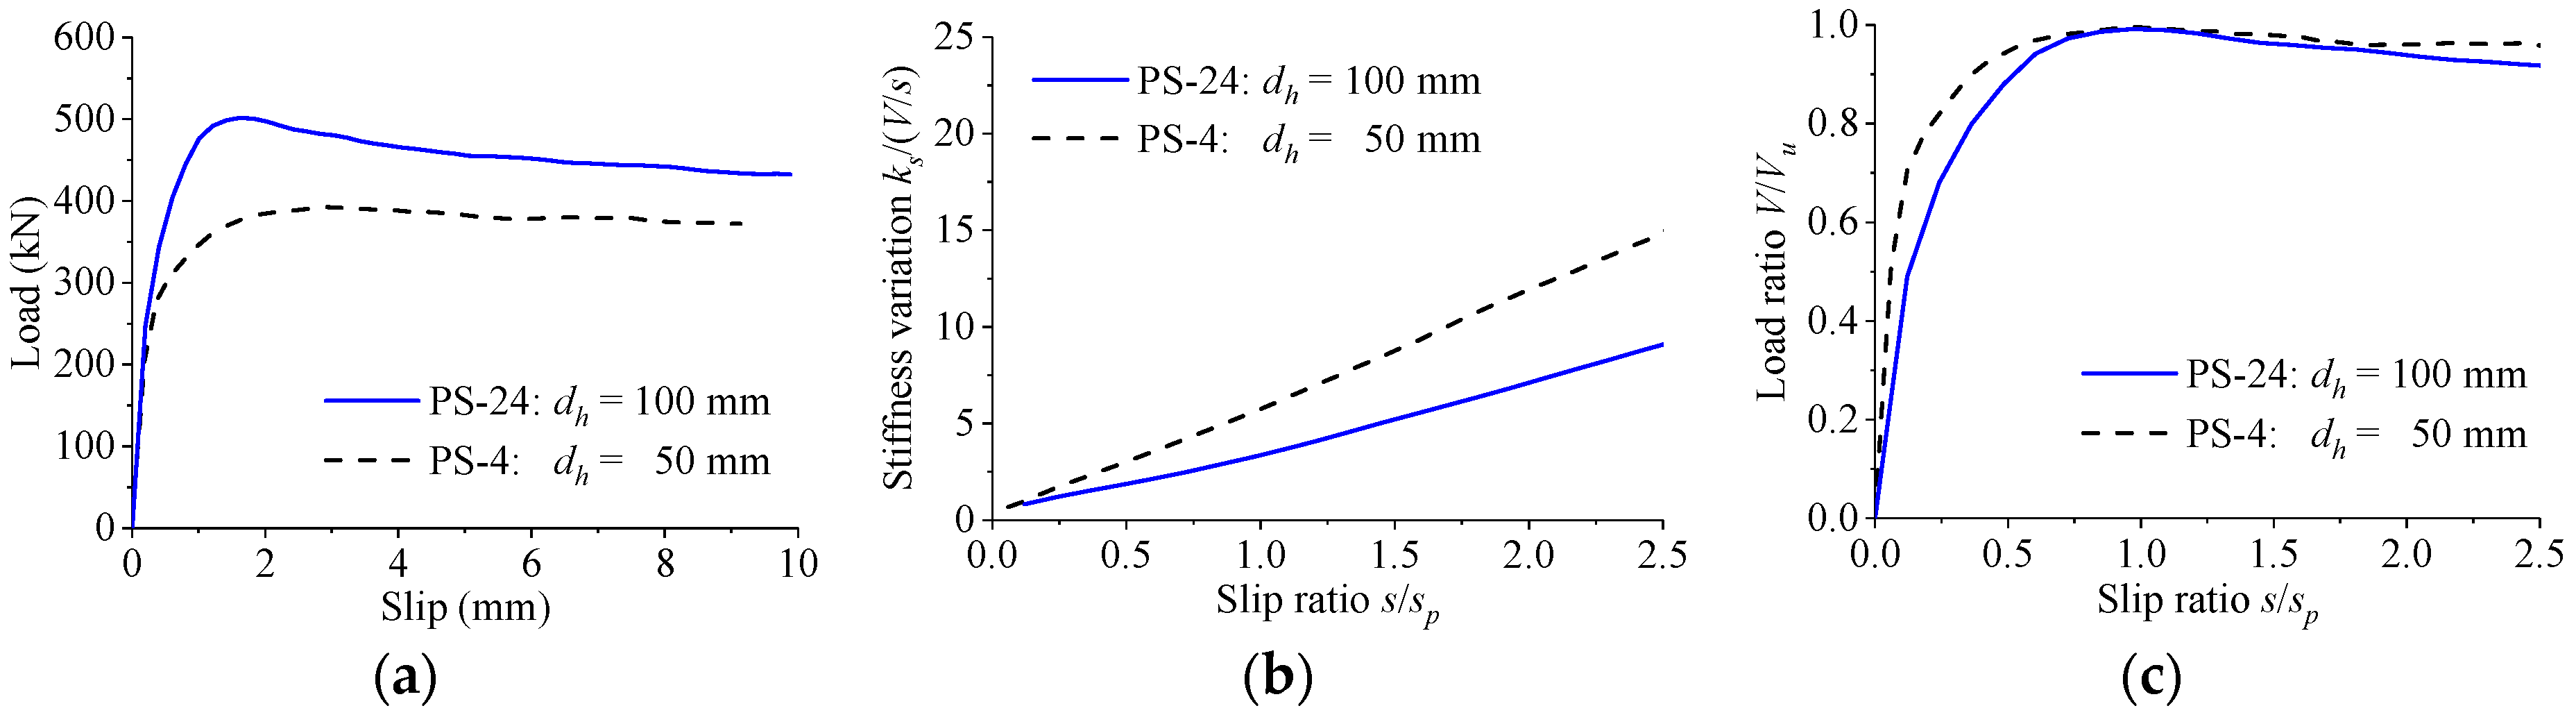
4.1. Influence of Hole Geometry
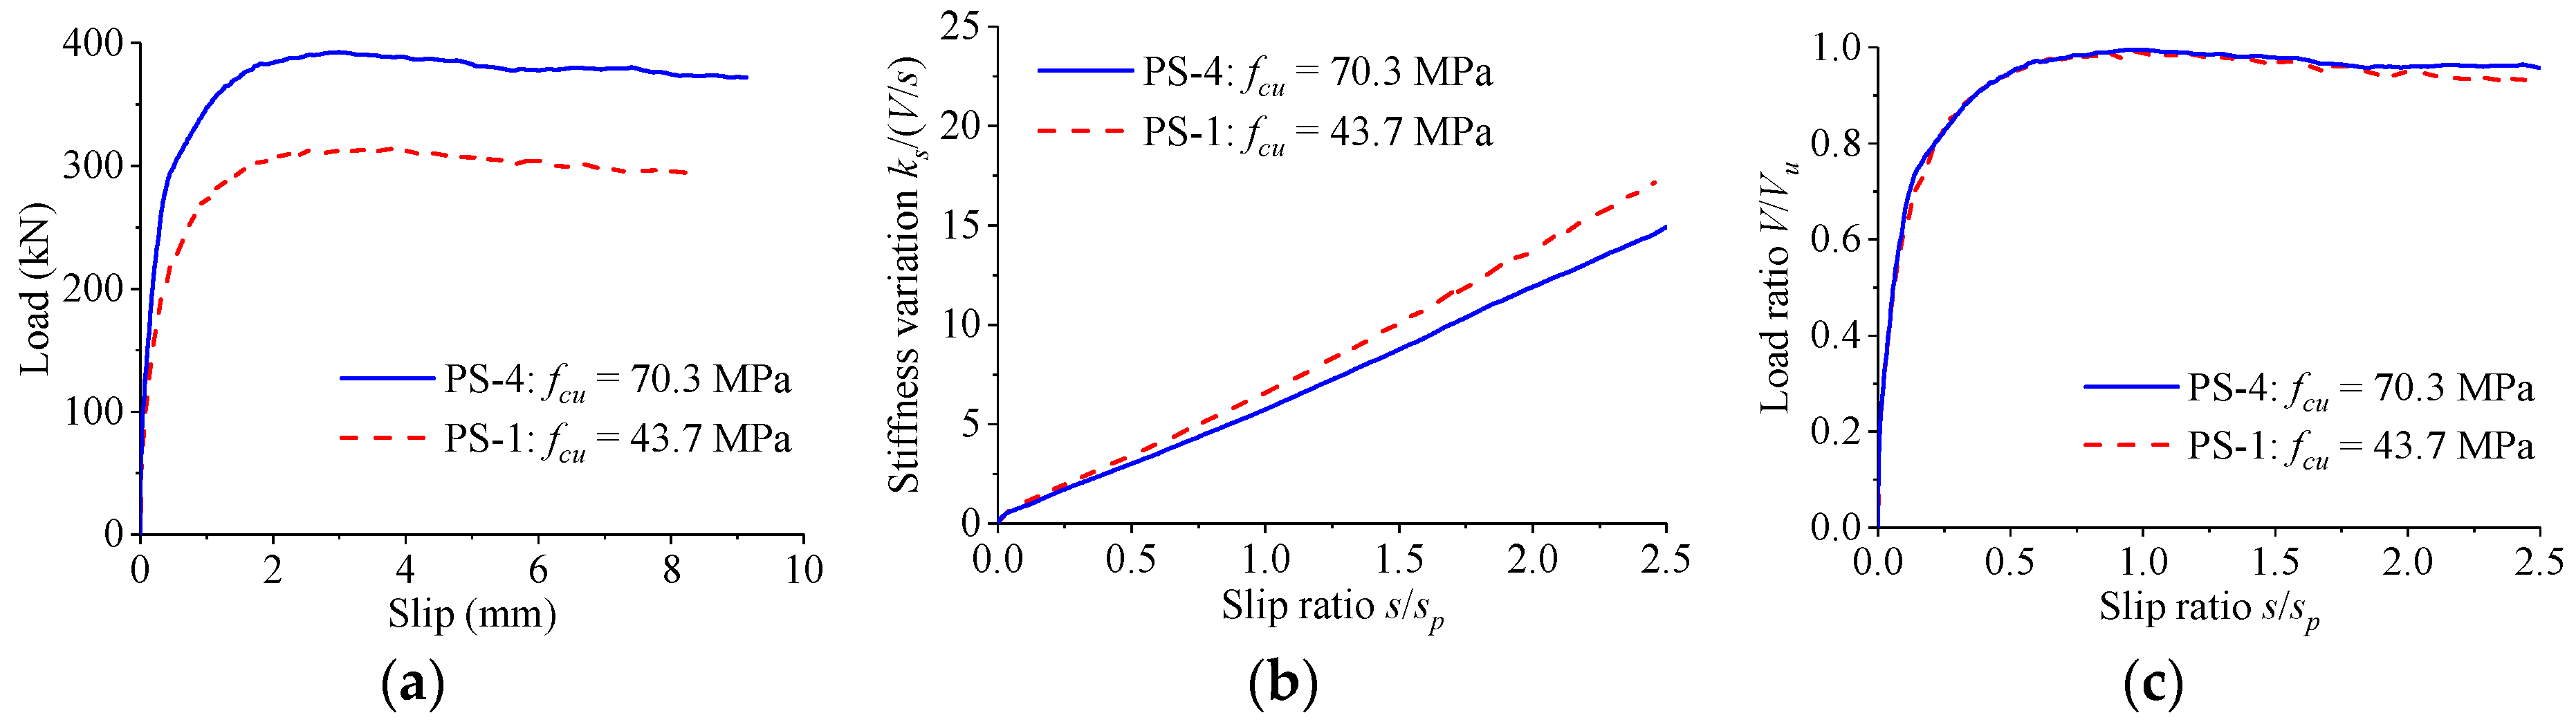
4.2. Influence of Concrete Strength
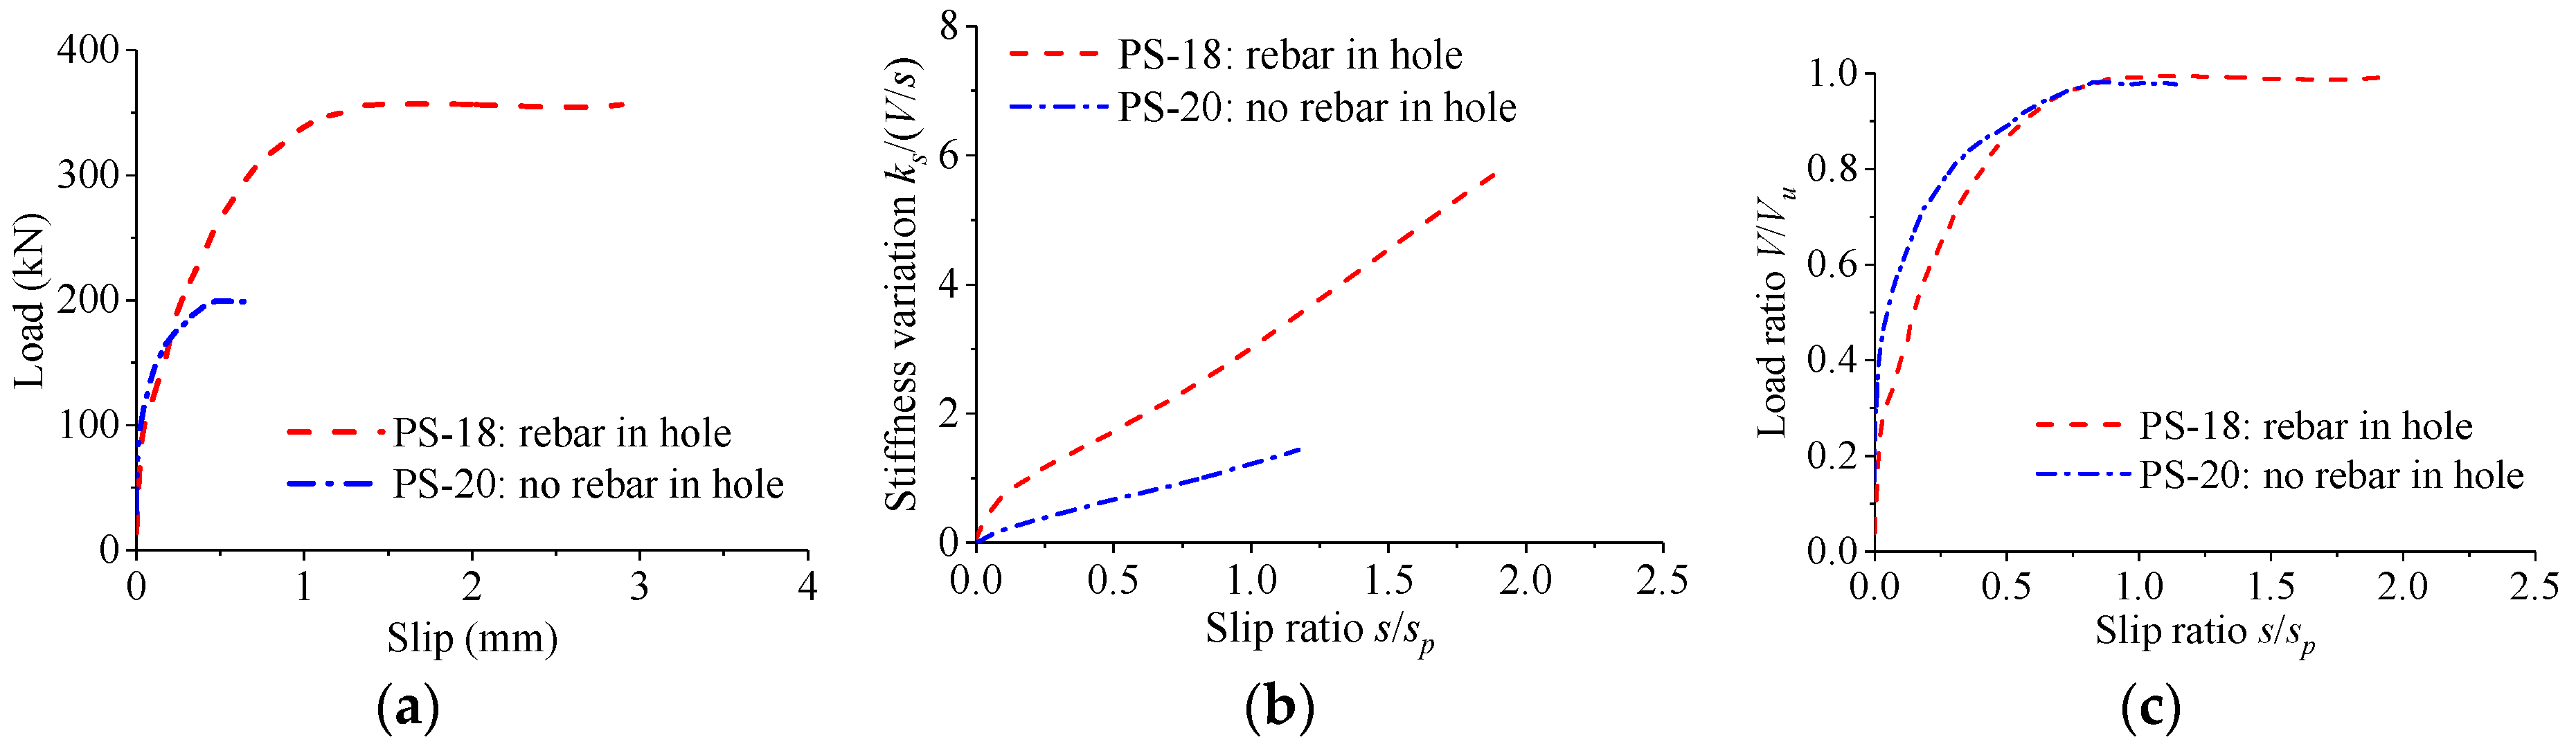
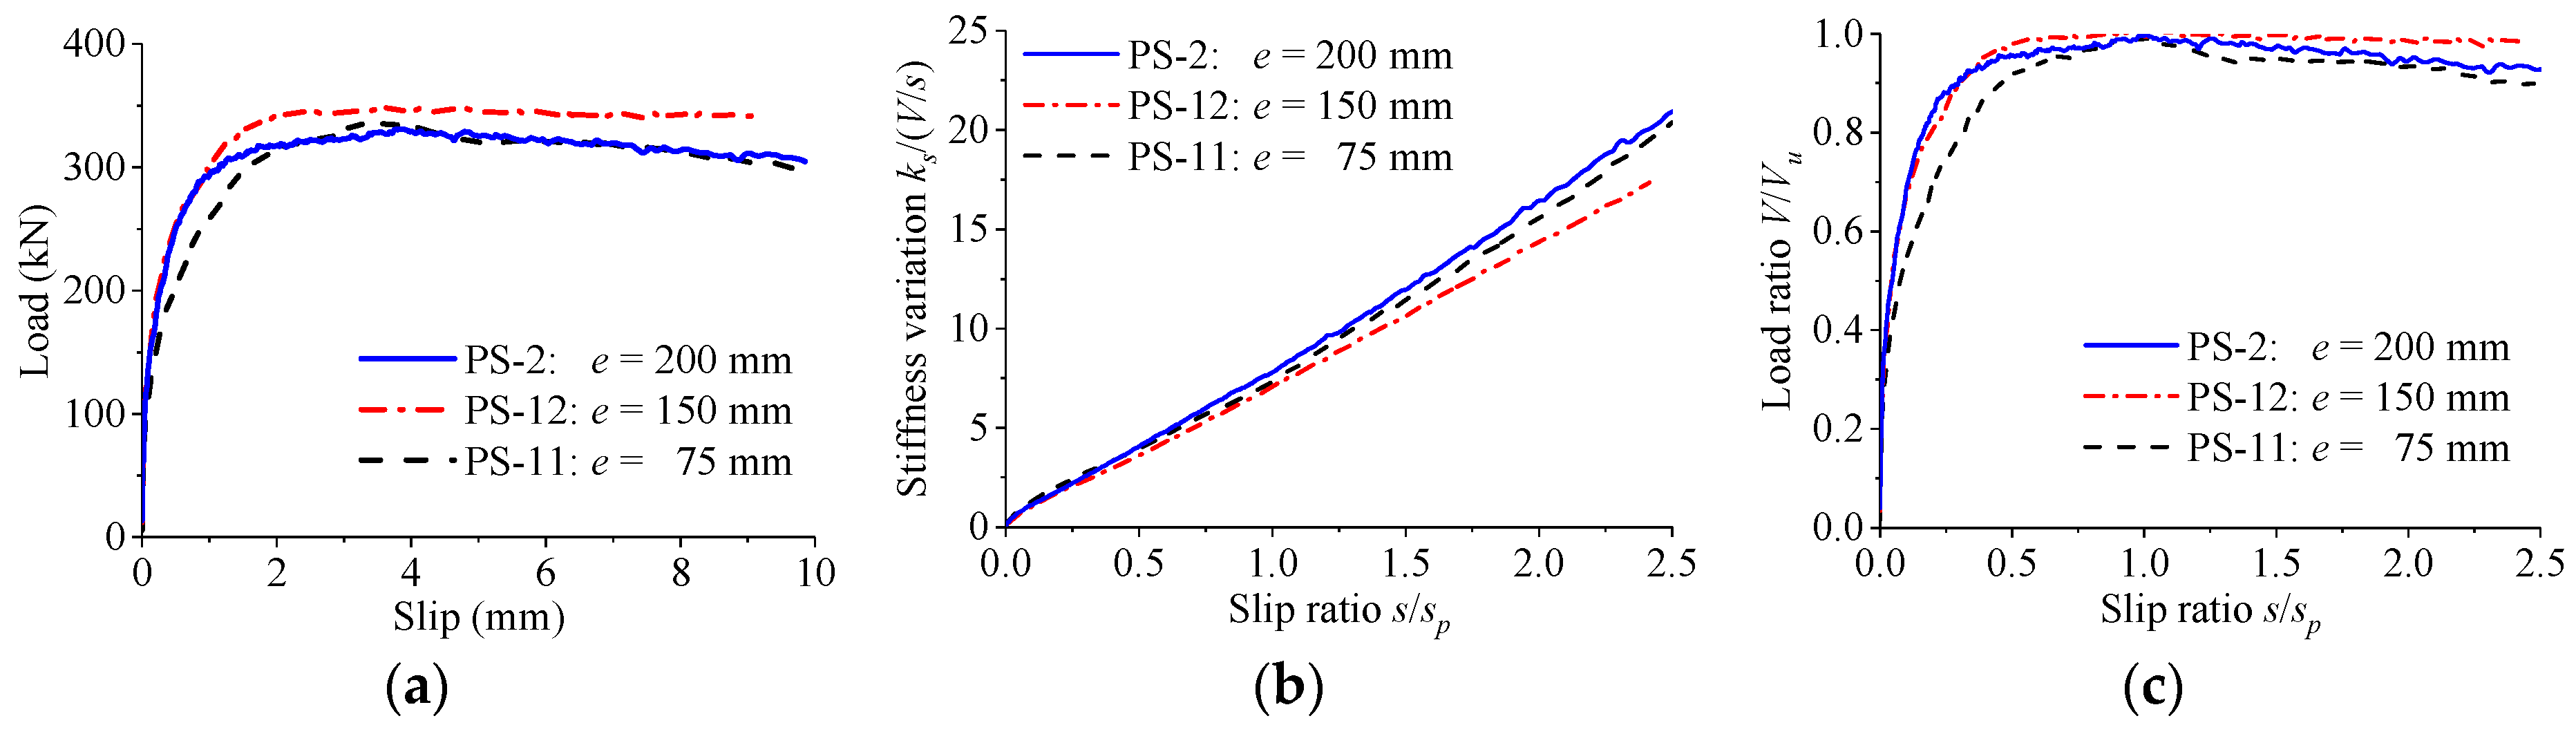
4.3. Influence of Rebar Configuration
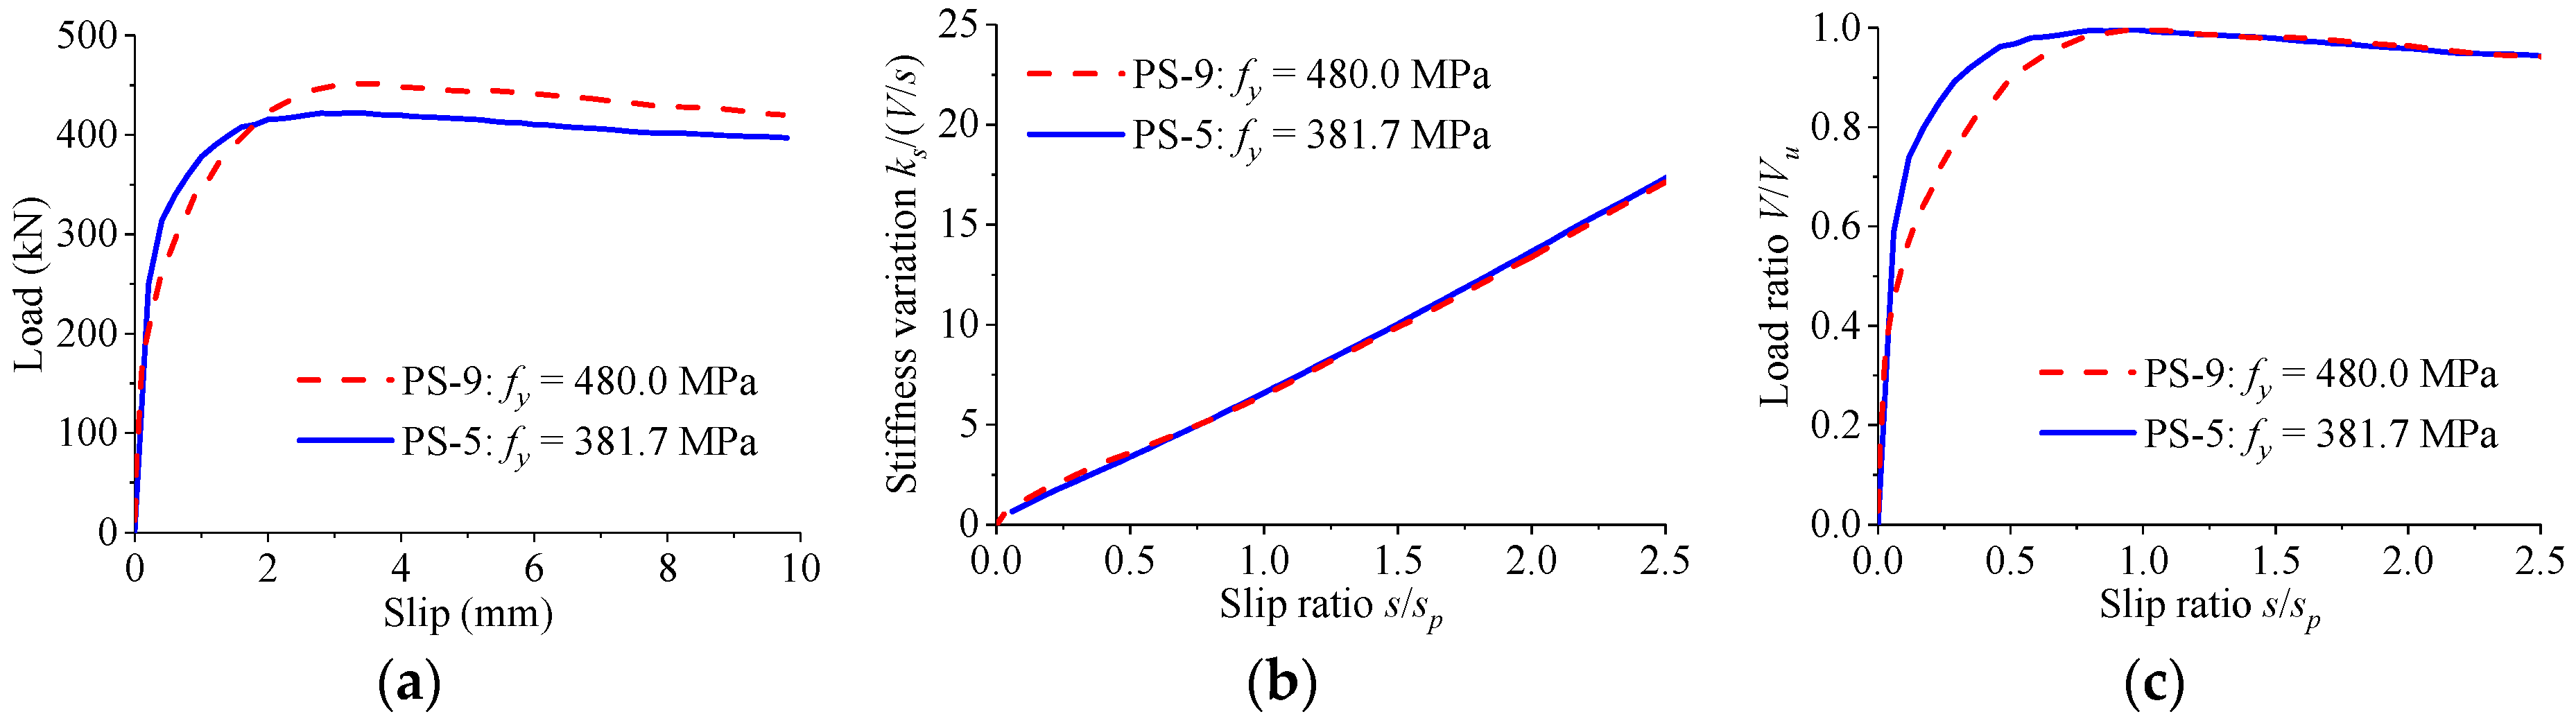
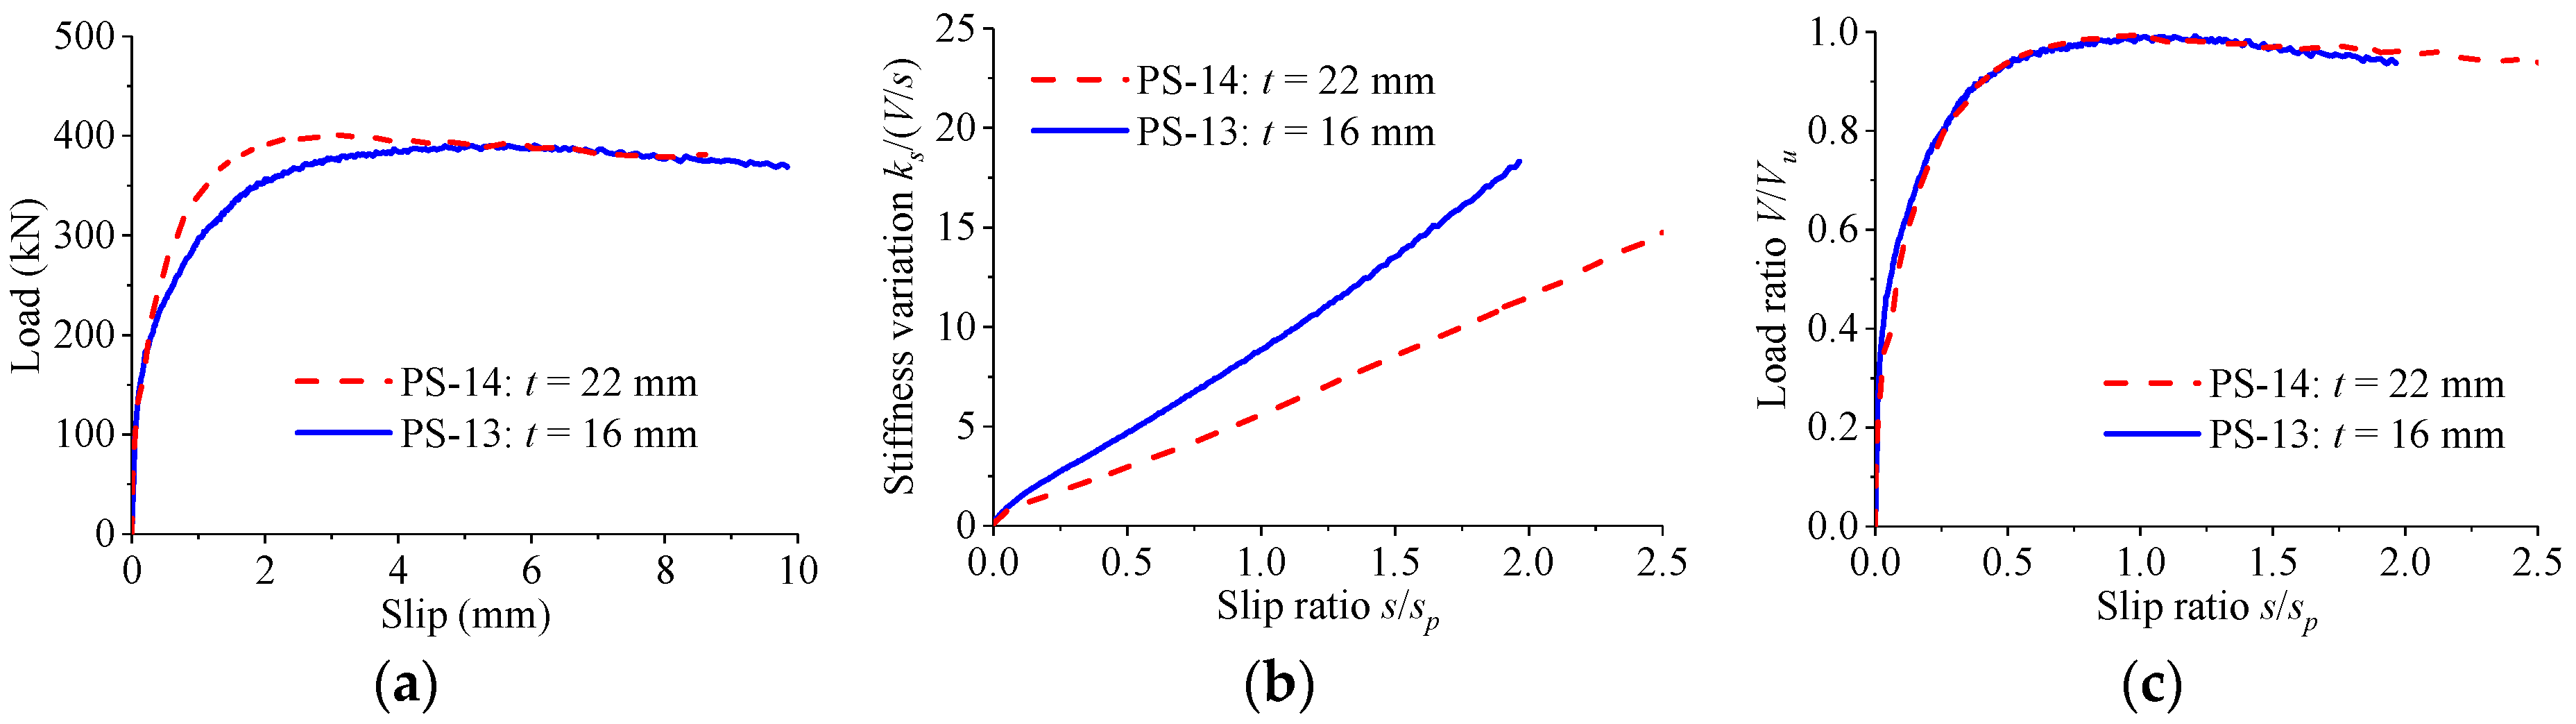
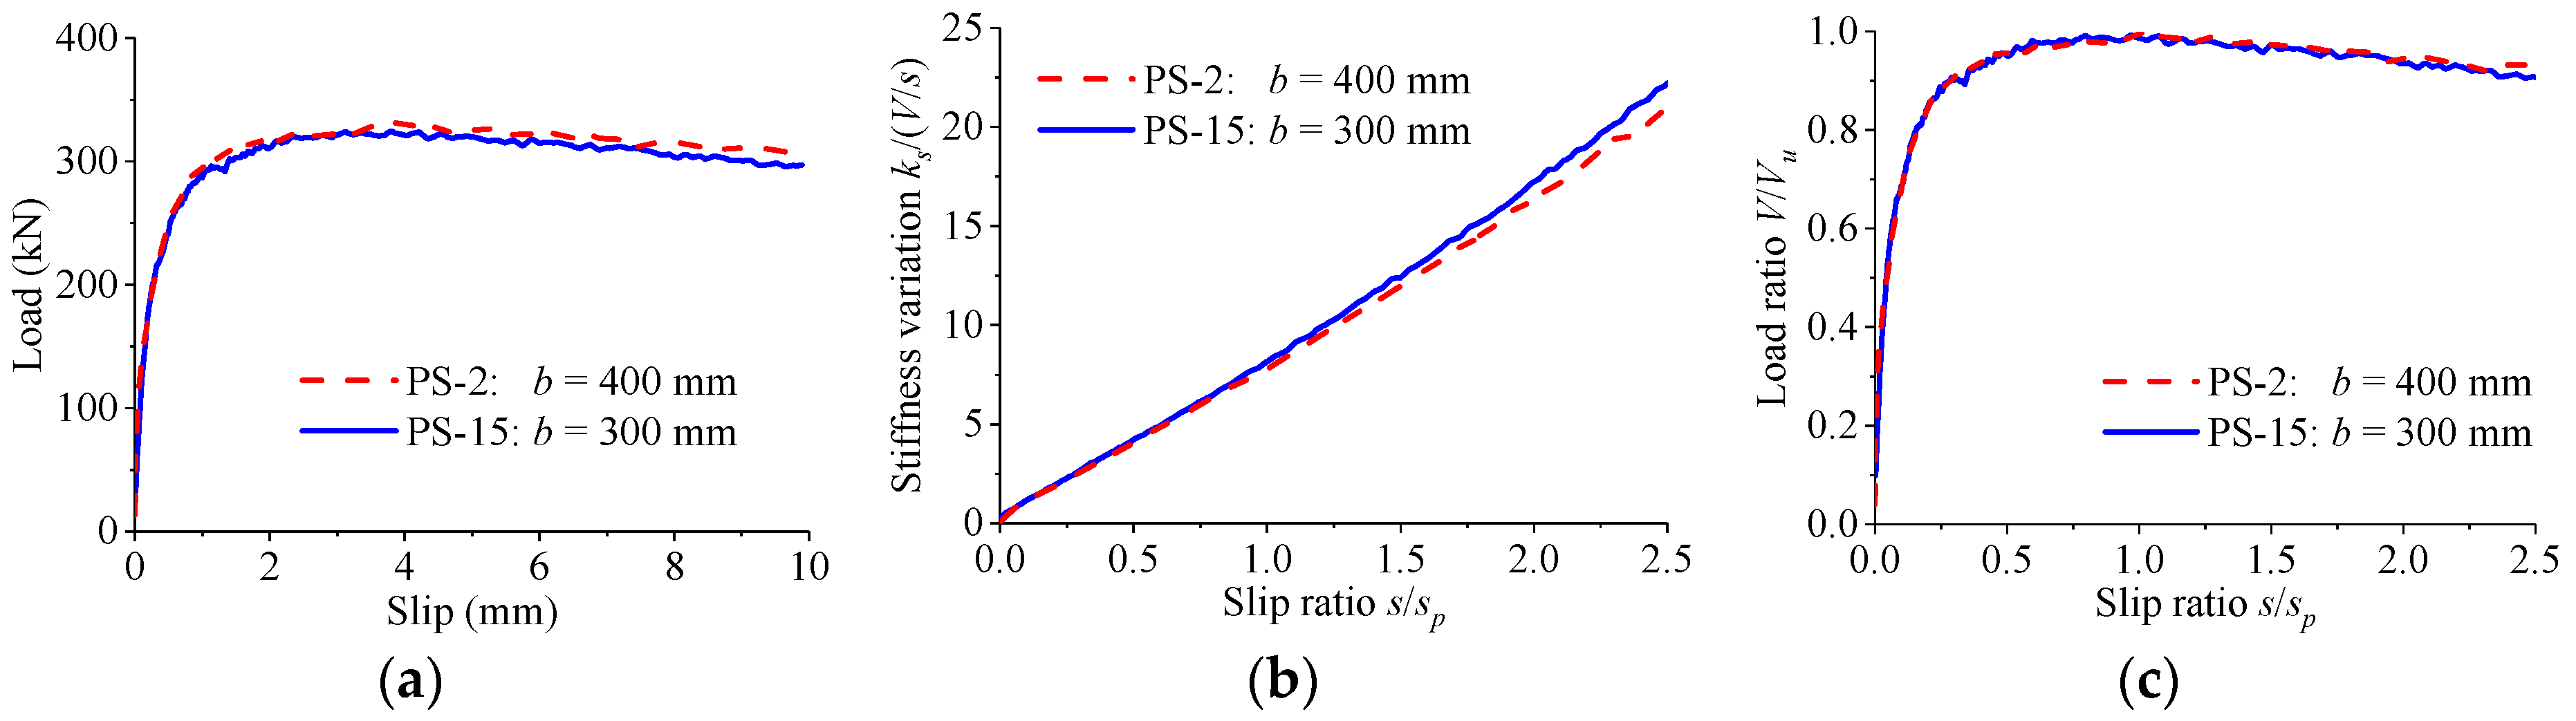
4.4. Influence of Rib Dimension
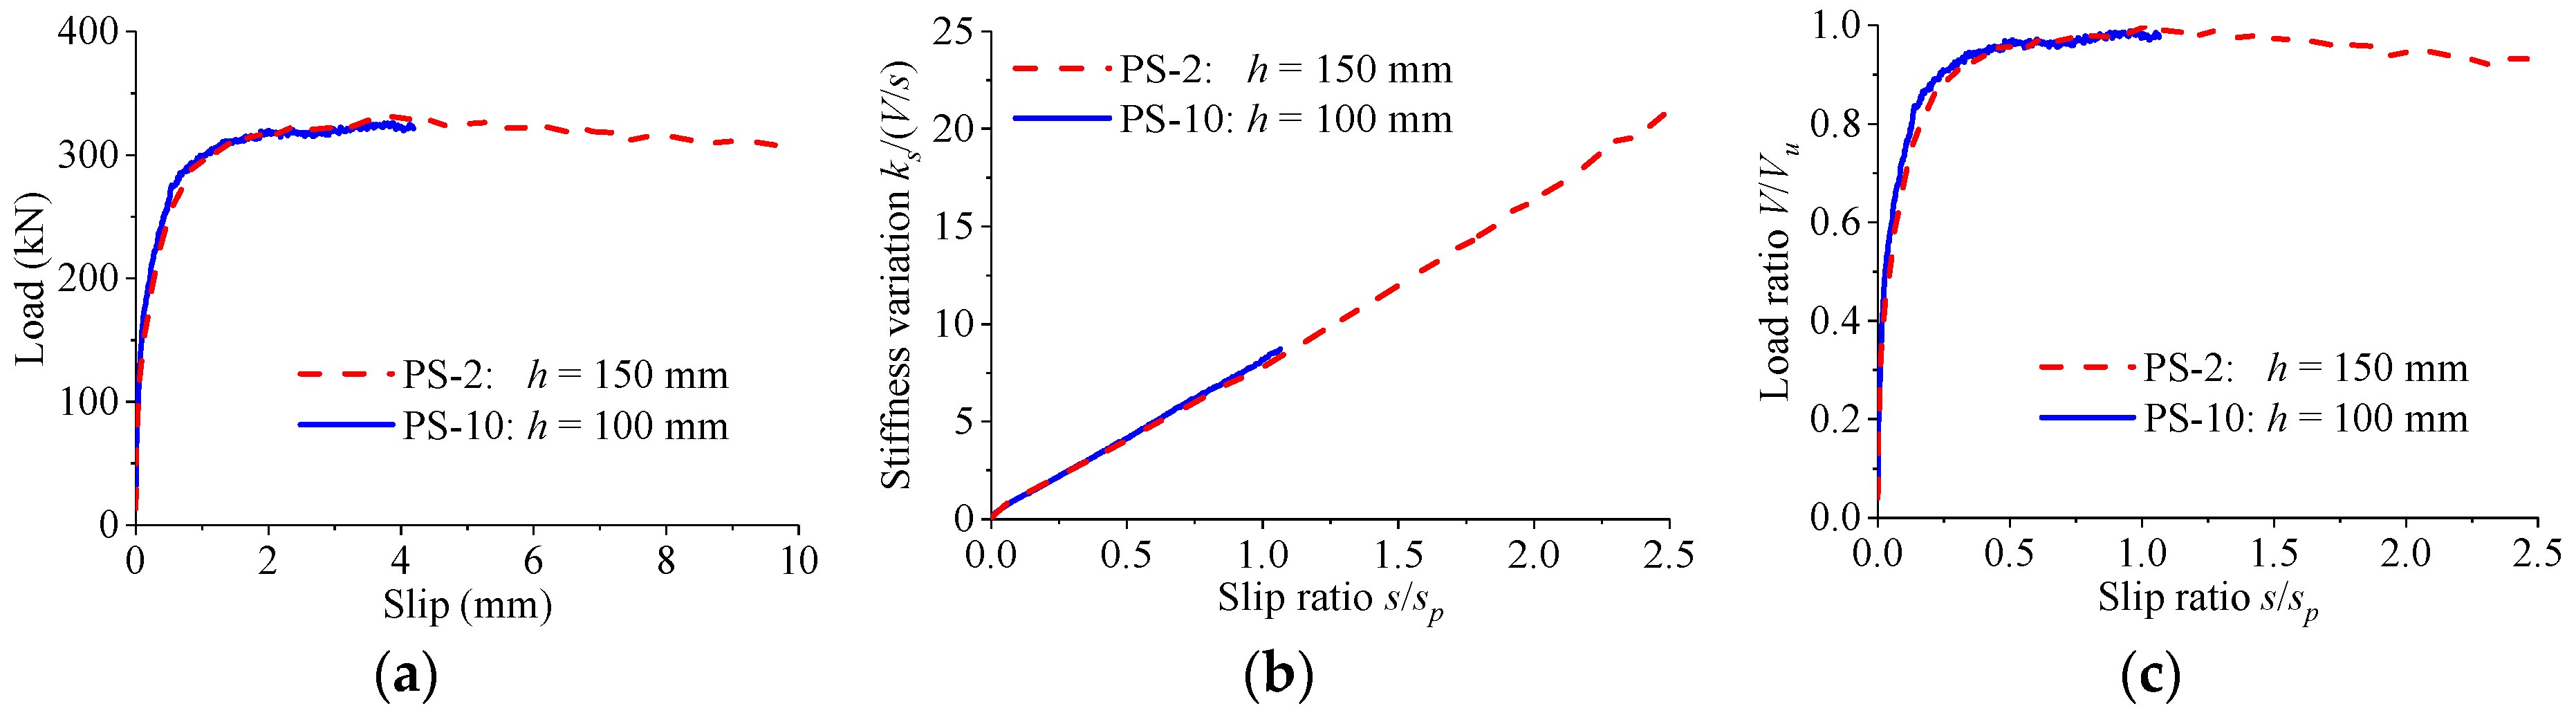
4.5. Influence of Slab Thickness
5. Analytical Model
5.1. Previous Expressions
5.2. Proposed Expression
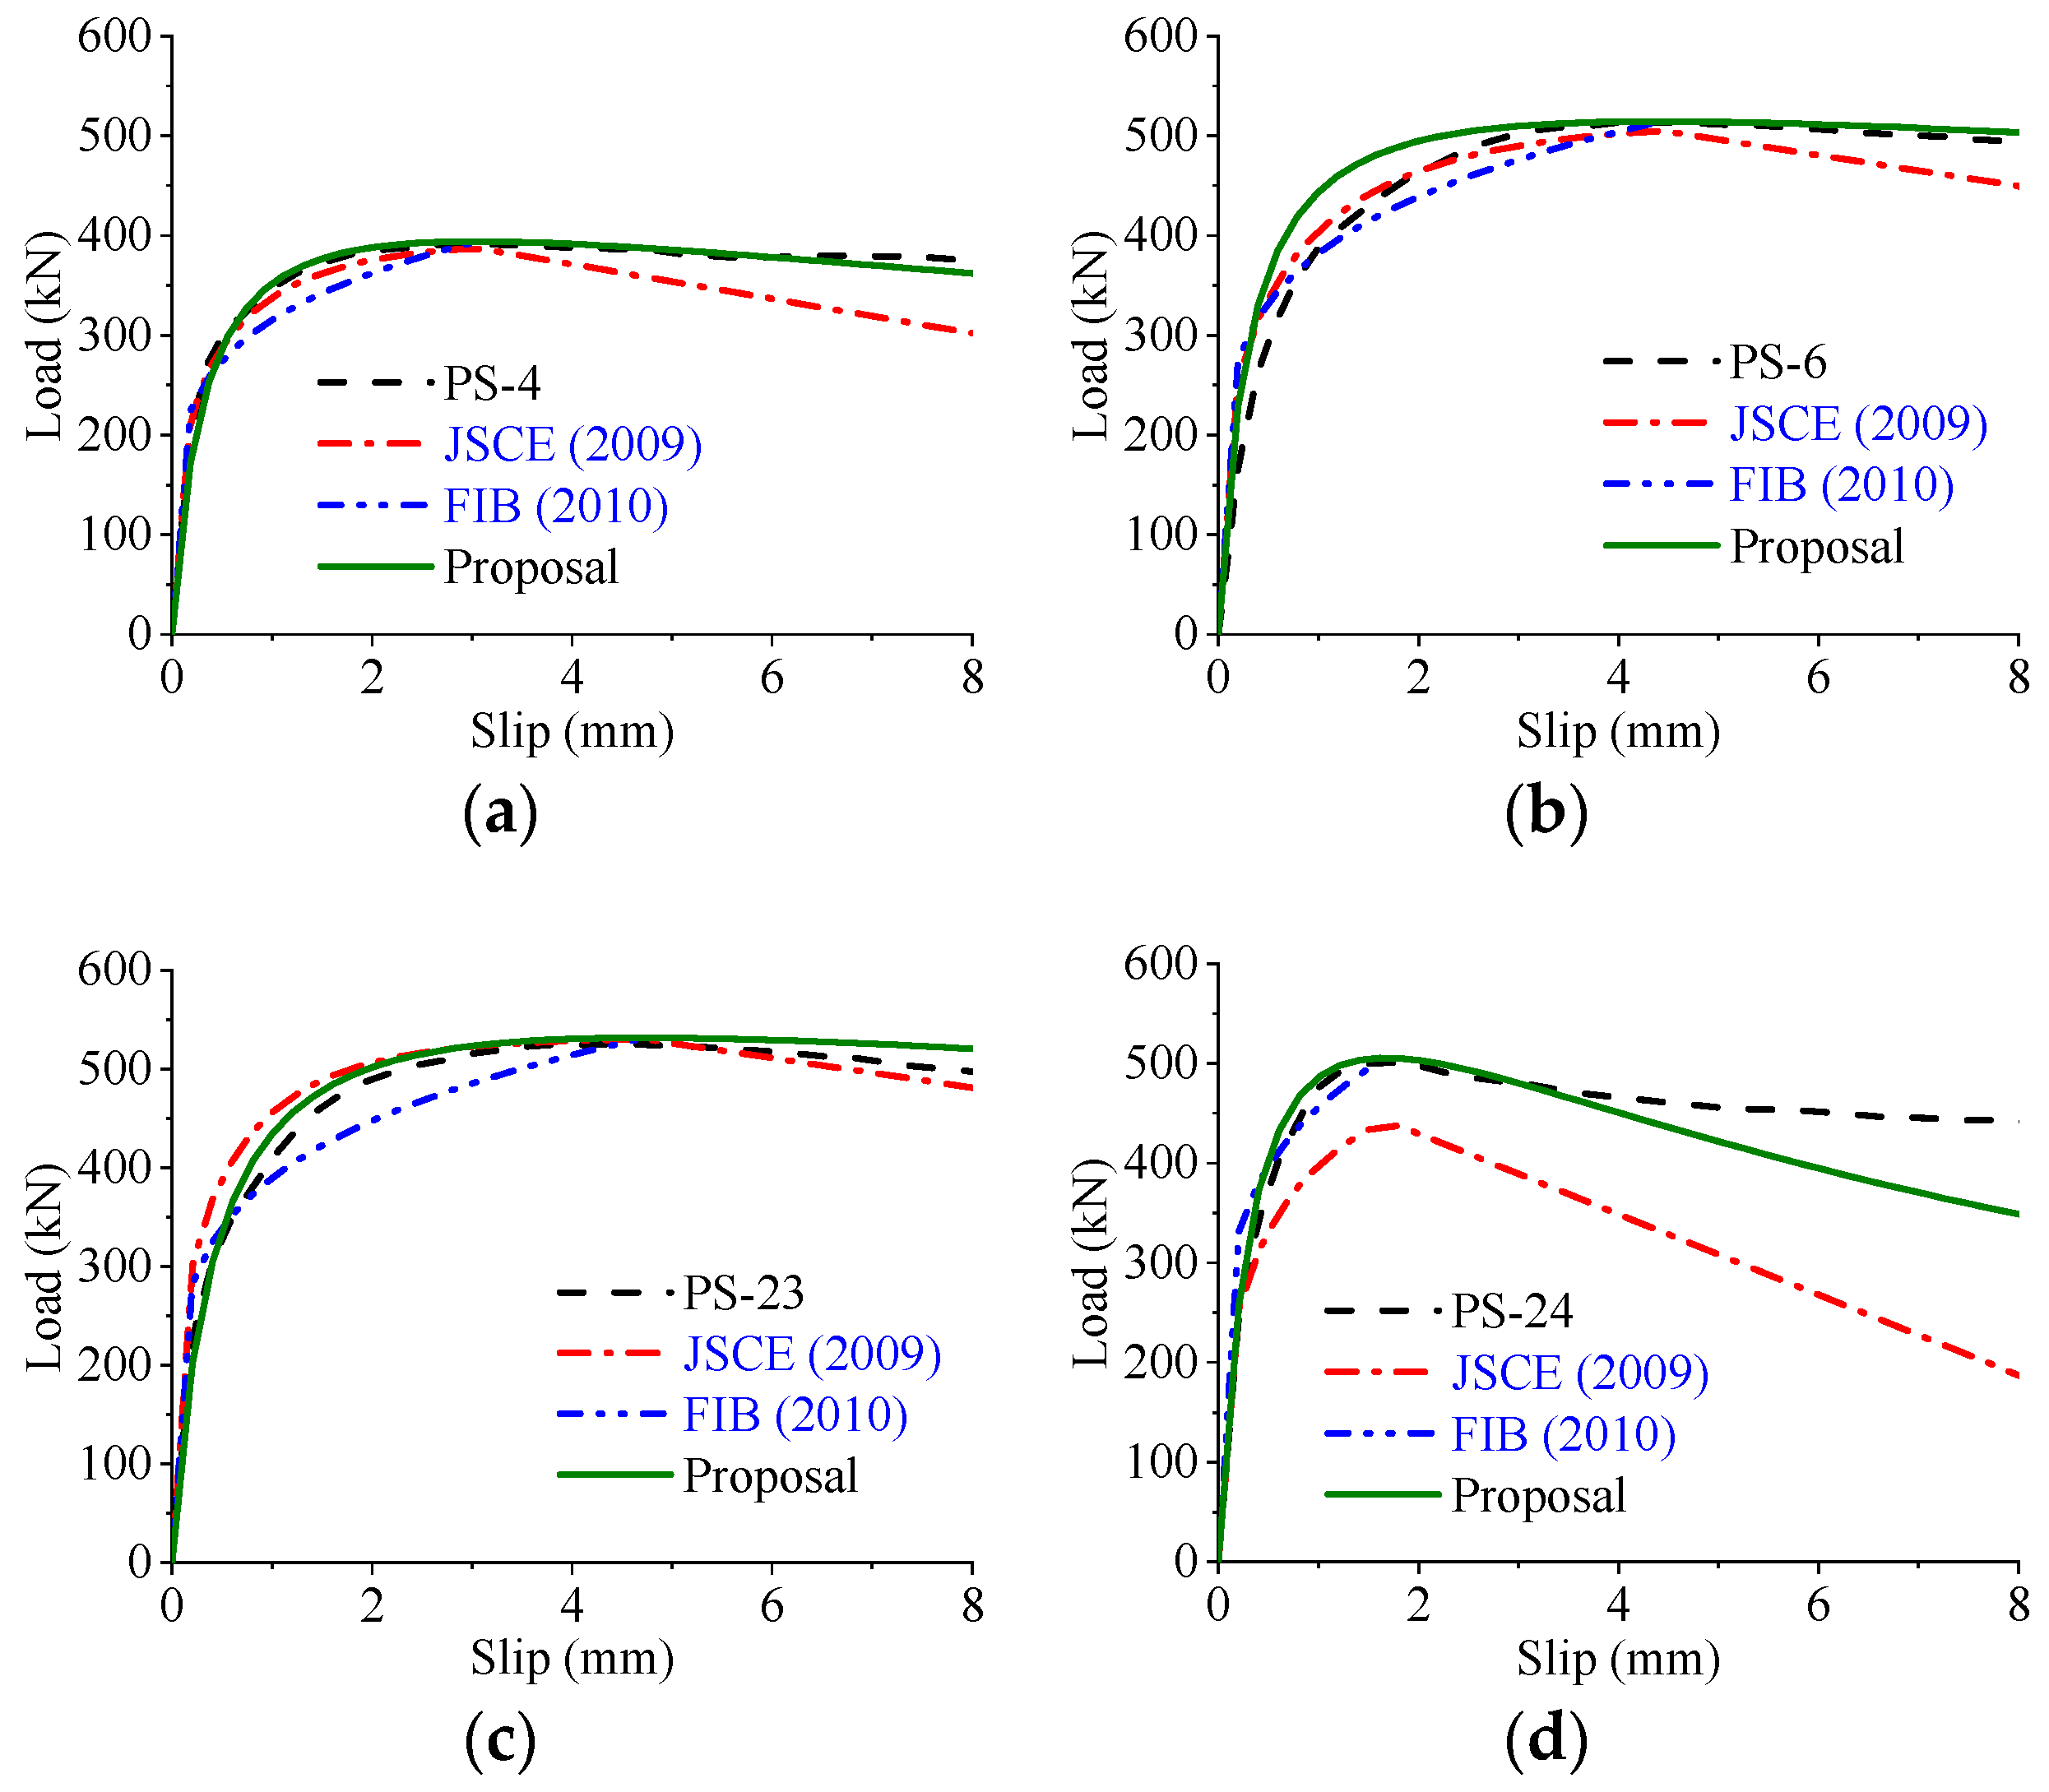
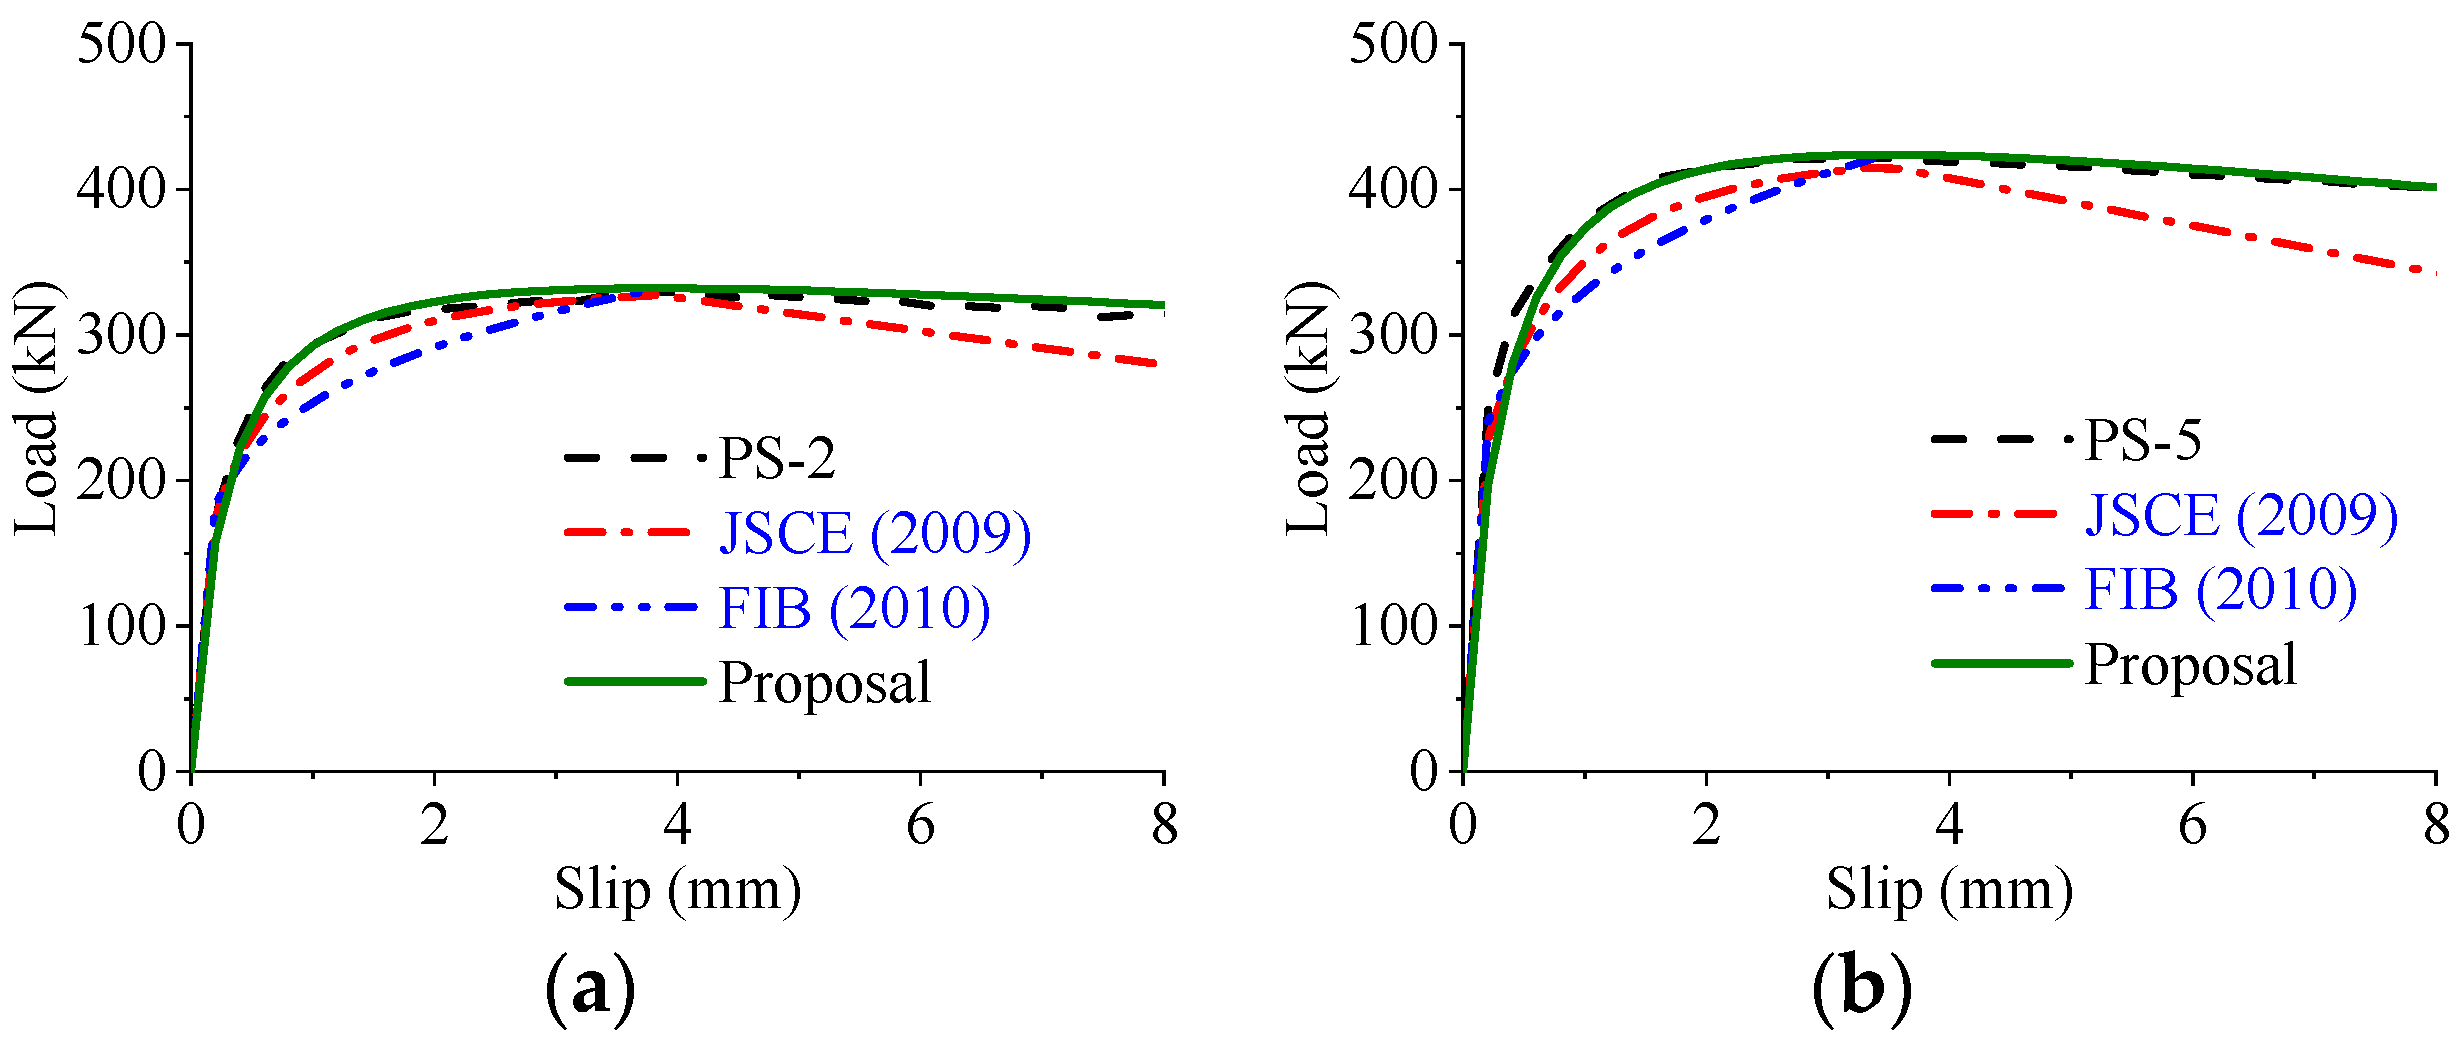
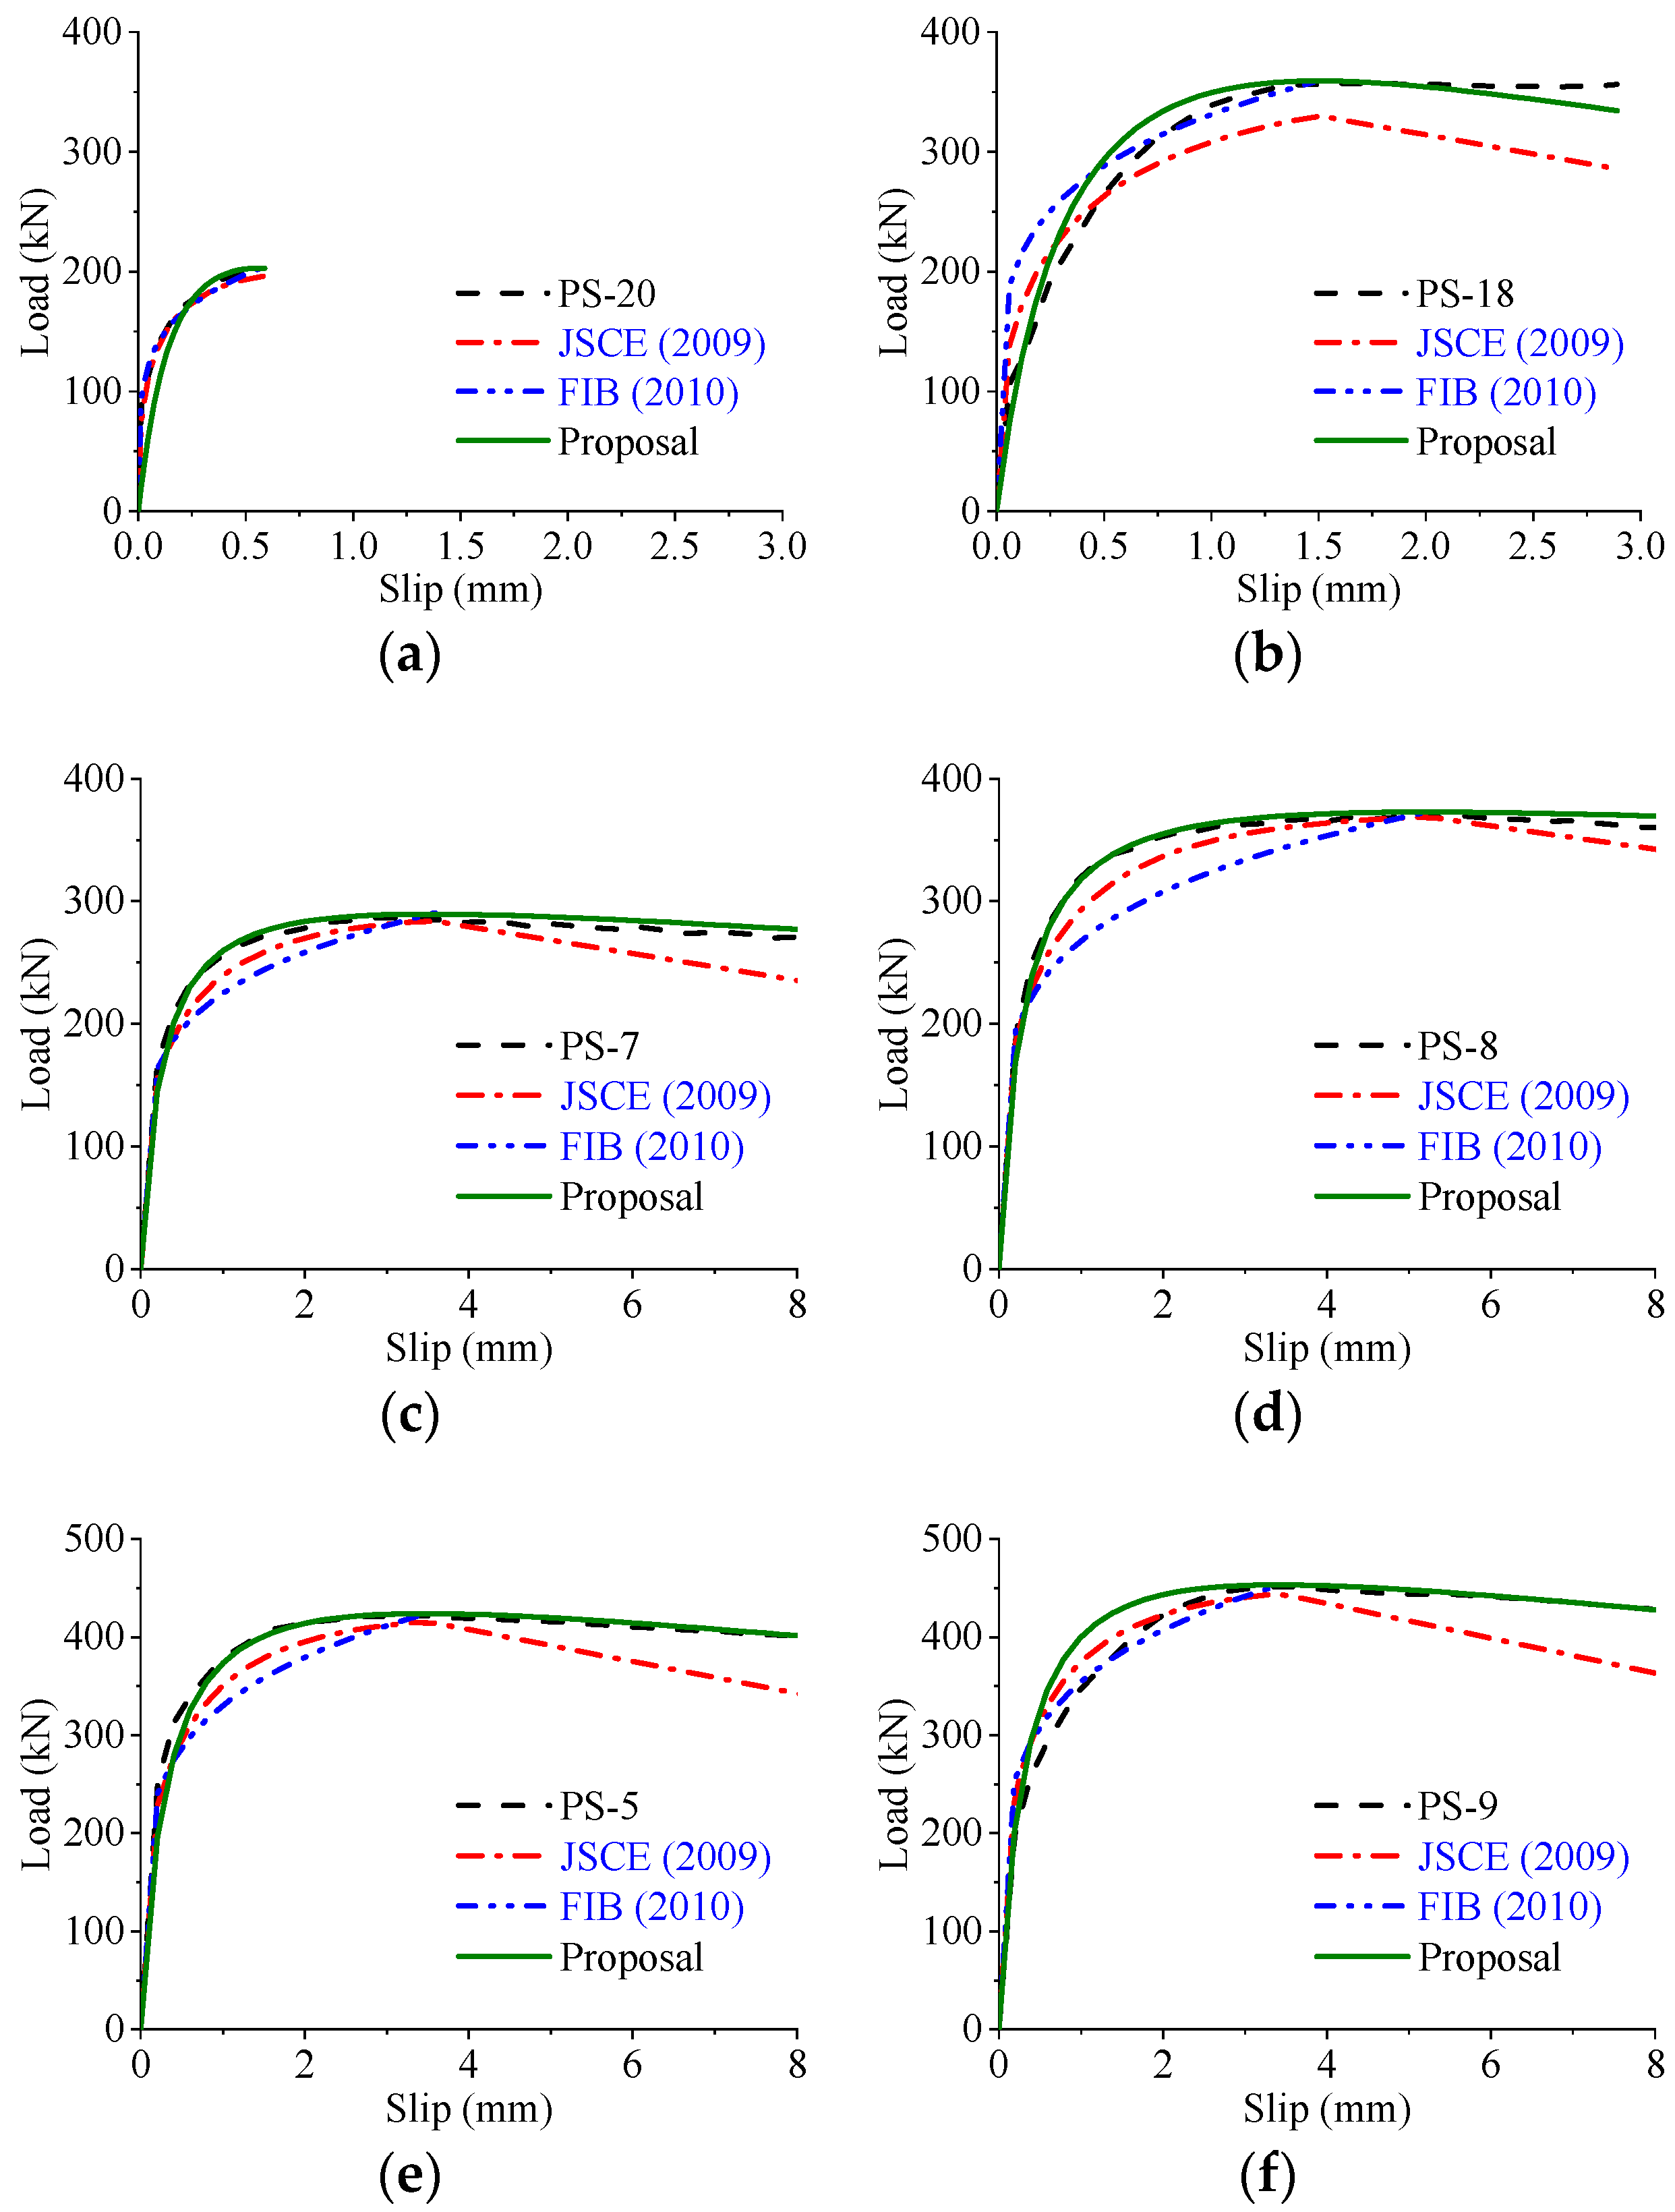
5.3. Comparison and Validation
6. Conclusions
- (1)
- The failure modes of perfobond connectors involve cracking in the concrete slab, yielding of the rebar in hole, and shearing in the concrete dowel. No obvious deformation occurs in the structural steel and the hole edge of the perfobond rib.
- (2)
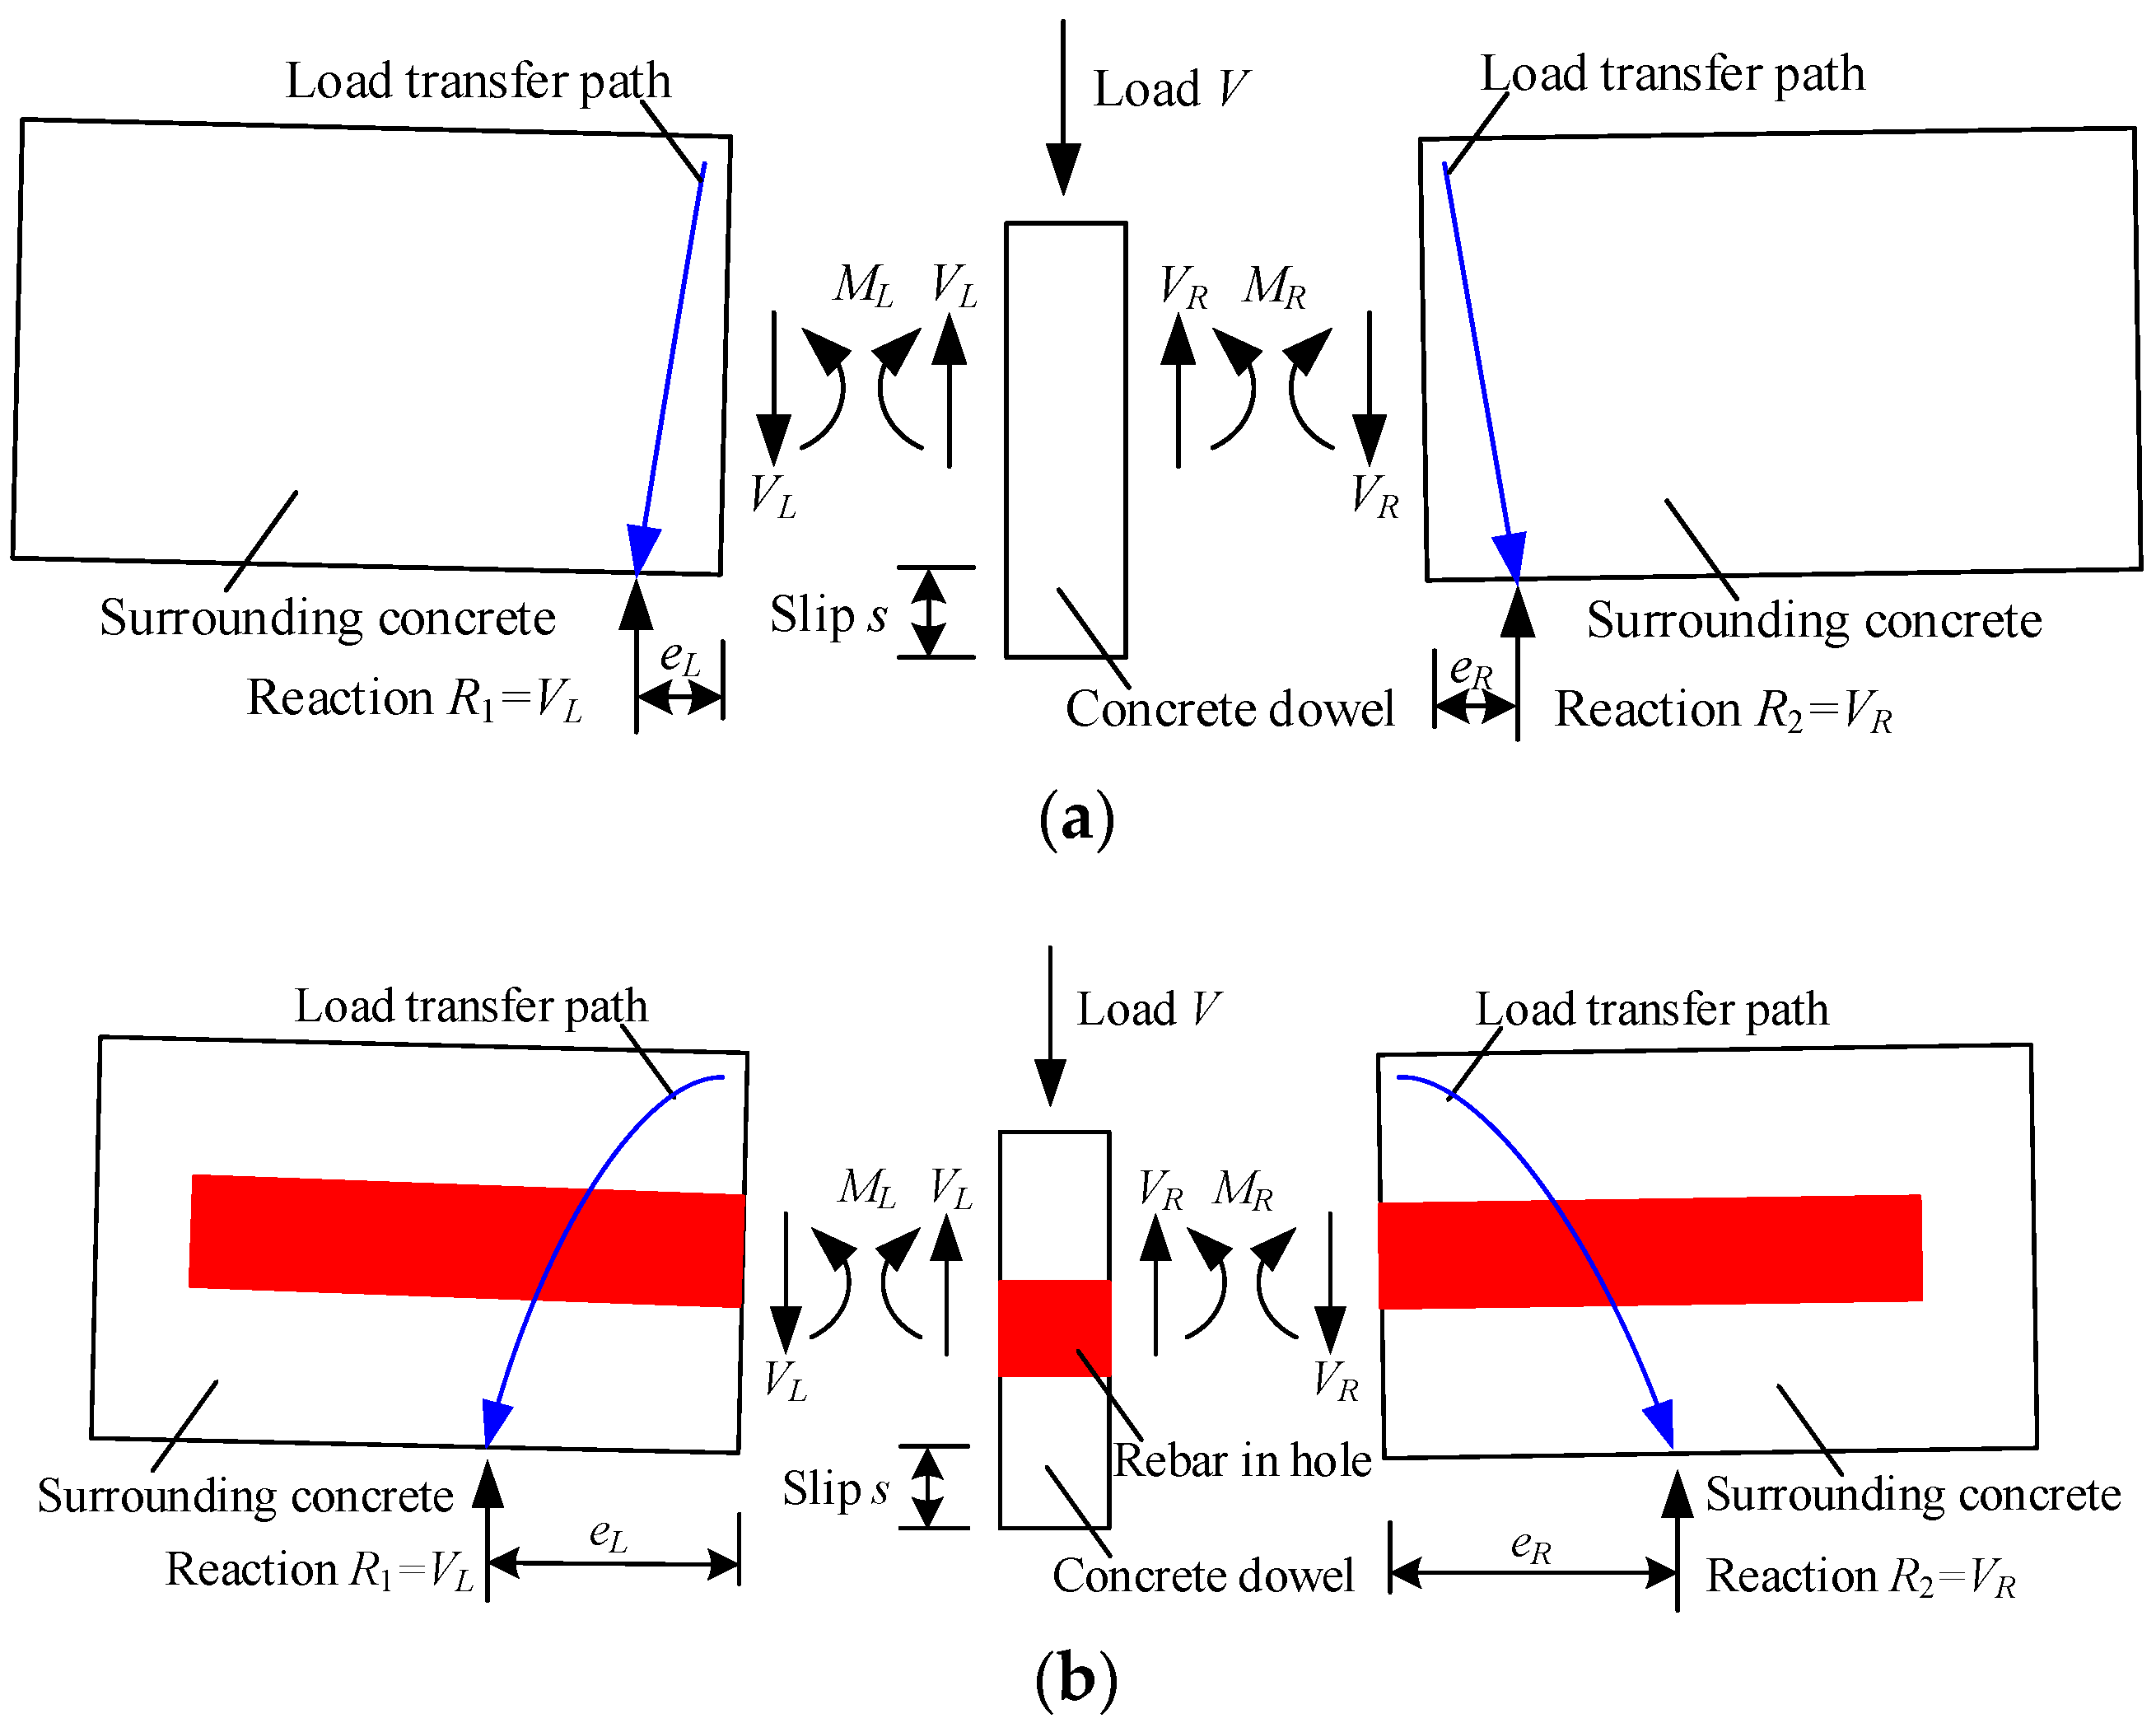
- The shear mechanism indicates that the shear strength and the slip ductility of perfobond connectors can be greatly enhanced by providing a rebar in hole. The main reason is that the rebar in hole provides resistance to the bending moment and extends the load transfer path to the surrounding concrete.
- (3)
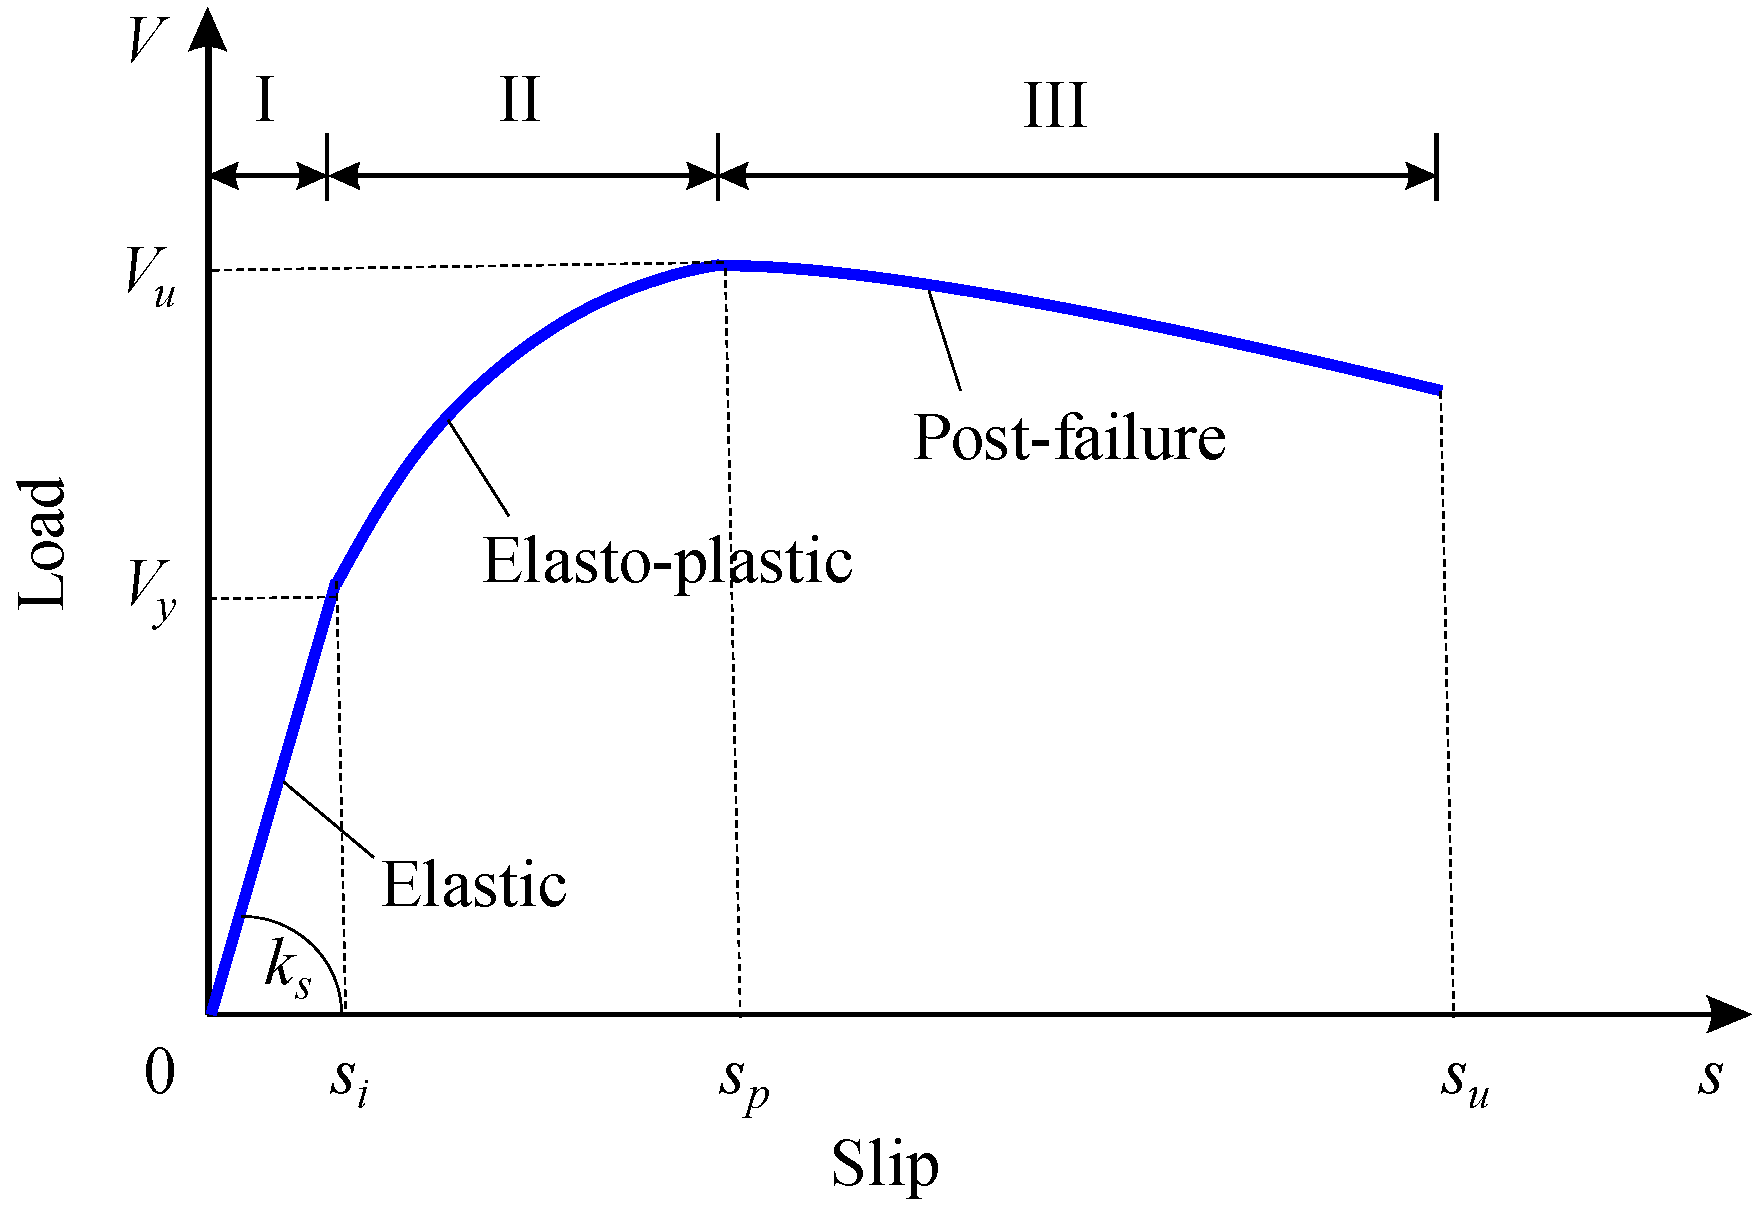
- The load–slip relationship of perfobond connectors consists of a linear branch with very small slips, followed by a nonlinear branch with a peak point, and ends with a slowly descending branch. Three stages can be accordingly identified as elastic stage, elasto-plastic stage, and postfailure stage.
- (4)
- In typical push-out tests, the load–slip curves have five characteristics which can be expressed by mathematical descriptions. These curve characteristics can be used to establish the theoretical expression for the load–slip relationship of perfobond connectors.
- (5)
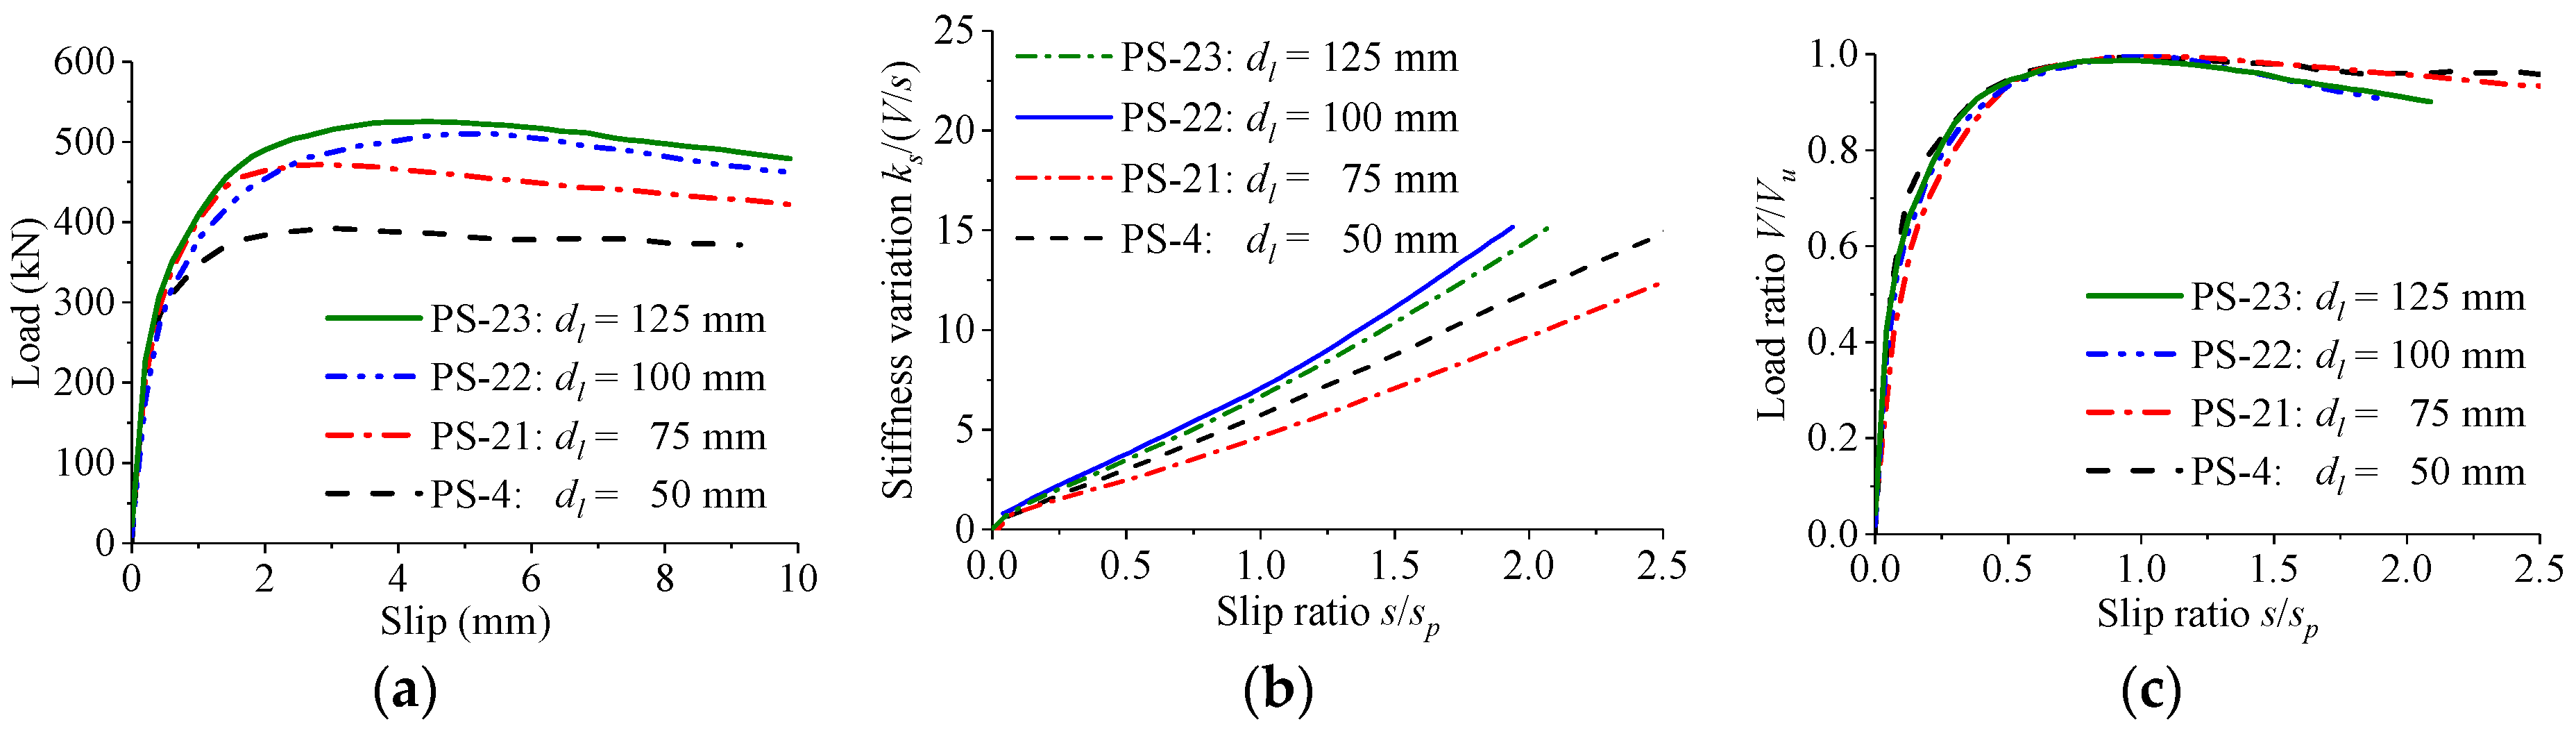
- According to the results of parametric study, the load–slip relationship of perfobond connectors is significantly influenced by the hole geometry, the concrete strength, and the configuration of the rebar in hole. The dimensions of the perfobond rib and the size of the concrete slab have negligible effect on the load–slip relationship of perfobond connectors.
- (6)
- Based on theoretical analysis and experimental results, an analytical model is proposed to express the load–slip relationship of perfobond connectors. Compared with existing expressions, the proposed expression has more explicit physical meanings and fits better with the experimental results. Therefore, the proposed expression can be used to calculate the nonlinear behavior of perfobond connectors in composite structures.
Author Contributions
Funding
Conflicts of Interest
References
- He, J.; Liu, Y.; Chen, A.; Wang, D.; Yoda, T. Bending behavior of concrete-encased composite I-girder with corrugated steel web. Thin-Walled Struct. 2014, 74, 70–84. [Google Scholar] [CrossRef]
- Kim, S.E.; Nguyen, H.T. Evaluation of the connection efficiency of hybrid steel–concrete girder using finite element approach. Int. J. Mech. Sci. 2012, 61, 8–23. [Google Scholar] [CrossRef]
- Kim, Y.H.; Kang, J.Y.; Kim, S.H.; Kim, D.J. Structural performance of steel pile caps strengthened with perfobond shear connectors under lateral loading. Appl. Sci. 2016, 6, 317. [Google Scholar] [CrossRef]
- Liu, Y.; Xin, H.; He, J.; Xue, D.; Ma, B. Experimental and analytical study on fatigue behavior of composite truss joints. J. Constr. Steel Res. 2013, 83, 21–36. [Google Scholar] [CrossRef]
- Mirza, O.; Uy, B. Effects of the combination of axial and shear loading on the behaviour of headed stud steel anchors. Eng. Struct. 2010, 32, 93–105. [Google Scholar] [CrossRef]
- Zheng, S.; Liu, Y.; Yoda, T.; Lin, W. Parametric study on shear capacity of circular-hole and long-hole perfobond shear connector. J. Constr. Steel Res. 2016, 117, 64–80. [Google Scholar] [CrossRef]
- Zheng, S.; Liu, Y.; Yoda, T.; Lin, W. Shear behavior and analytical model of perfobond connectors. Steel Compos. Struct. 2016, 20, 71–89. [Google Scholar] [CrossRef]
- Kim, S.H.; Kim, K.S.; Lee, D.H.; Park, J.S.; Han, O. Analysis of the shear behavior of stubby Y-type perfobond rib shear connectors for a composite frame structure. Materials 2017, 10, 1340. [Google Scholar] [CrossRef]
- Rodrigues, J.P.C.; Laím, L. Experimental investigation on the structural response of T, T-block and T-Perfobond shear connectors at elevated temperatures. Eng. Struct. 2014, 75, 299–314. [Google Scholar] [CrossRef]
- Classen, M.; Hegger, J. Assessing the pry-out resistance of open rib shear connectors in cracked concrete—Engineering model with aggregate interlock. Eng. Struct. 2017, 148, 254–262. [Google Scholar] [CrossRef]
- Mazoz, A.; Benanane, A.; Titoum, M. Push-out tests on a new shear connector of I-shape. Int. J. Steel Struct. 2013, 13, 519–528. [Google Scholar] [CrossRef]
- Shariati, M.; Sulong, N.H.R.; Khanouki, M.M.A. Experimental assessment of channel shear connectors under monotonic and fully reversed cyclic loading in high strength concrete. Mater. Des. 2012, 34, 325–331. [Google Scholar] [CrossRef]
- Kim, Y.H.; Choi, H.; Lee, S.; Yoon, S.J. Experimental and analytical investigations on the hat shaped shear connector in the steel-concrete composite flexural member. Int. J. Steel Struct. 2011, 11, 99–107. [Google Scholar] [CrossRef]
- Ataei, A.; Bradford, M.A.; Liu, X. Experimental study of composite beams having a precast geopolymer concrete slab and deconstructable bolted shear connectors. Eng. Struct. 2016, 114, 1–13. [Google Scholar] [CrossRef]
- Gattesco, N.; Giuriani, E.; Gubana, A. Low-cycle fatigue test on stud shear connectors. J. Struct. Eng. ASCE 1997, 123, 145–150. [Google Scholar] [CrossRef]
- Ahn, J.H.; Lee, C.G.; Won, J.H.; Kim, S.H. Shear resistance of the perfobond-rib shear connector depending on concrete strength and rib arrangement. J. Constr. Steel Res. 2010, 66, 1295–1307. [Google Scholar] [CrossRef]
- Hosaka, T.; Mitsuki, K.; Hiragi, H.; Ushijima, Y.; Tachibana, Y.; Watanabe, H. An experimental study on shear characteristics of perfobond strip and its rational strength equations. J. Struct. Eng. JSCE 2000, 46A, 1593–1604. [Google Scholar]
- Oguejiofor, E.C.; Hosain, M.U. Numerical analysis of push-out specimens with perfobond rib connectors. Comput. Struct. 1997, 62, 617–624. [Google Scholar] [CrossRef]
- Ranzi, G.; Bradford, M.A.; Uy, B. A direct stiffness analysis of a composite beam with partial interaction. Int. J. Numer. Meth. Eng. 2004, 61, 657–672. [Google Scholar] [CrossRef]
- Zona, A.; Ranzi, G. Finite element models for nonlinear analysis of steel-concrete composite beams with partial interaction in combined bending and shear. Finite Elem. Anal. Des. 2011, 47, 98–118. [Google Scholar] [CrossRef]
- Lorenc, W.; Kubica, E. Behavior of composite beams prestressed with external tendons: Experimental study. J. Constr. Steel Res. 2006, 62, 1353–1366. [Google Scholar] [CrossRef]
- Xue, W.; Ding, M.; Wang, H.; Luo, Z. Static behavior and theoretical model of stud shear connectors. J. Bridge Eng. ASCE 2008, 13, 623–634. [Google Scholar] [CrossRef]
- JSCE. Standard Specifications for Hybrid Structures-2009; Japan Society of Civil Engineers: Tokyo, Japan, 2009. [Google Scholar]
- FIB. Model Code 2010—Final Draft, Vol. 1; FIB: Lausanne, Switzerland, 2010. [Google Scholar]
- EN 1994-1-1:2004. Eurocode 4: Design of Composite Steel and Concrete Structures, Part 1-1: General Rules and Rules for Buildings; European Committee for Standardization (CEN): Brussels, Belgium, 2004. [Google Scholar]


| Group | d (mm) | dl (mm) | dh (mm) | ds (mm) | fcu (MPa) | fy (MPa) | t (mm) | h (mm) | e (mm) | a (mm) | b (mm) |
|---|---|---|---|---|---|---|---|---|---|---|---|
| PS-1 | 50 | 50 | 50 | 20 | 43.3 | 373.6 | 20 | 150 | 200 | 460 | 400 |
| PS-2 | 60 | 60 | 60 | 20 | 43.3 | 373.6 | 20 | 150 | 200 | 460 | 400 |
| PS-3 | 75 | 75 | 75 | 20 | 43.3 | 373.6 | 20 | 150 | 200 | 460 | 400 |
| PS-4 | 50 | 50 | 50 | 20 | 70.3 | 381.7 | 20 | 150 | 200 | 460 | 400 |
| PS-5 | 60 | 60 | 60 | 20 | 70.3 | 381.7 | 20 | 150 | 200 | 460 | 400 |
| PS-6 | 75 | 75 | 75 | 20 | 70.3 | 381.7 | 20 | 150 | 200 | 460 | 400 |
| PS-7 | 60 | 60 | 60 | 16 | 43.3 | 373.6 | 20 | 150 | 200 | 460 | 400 |
| PS-8 | 60 | 60 | 60 | 25 | 43.3 | 373.6 | 20 | 150 | 200 | 460 | 400 |
| PS-9 | 60 | 60 | 60 | 20 | 70.3 | 480.0 | 20 | 150 | 200 | 460 | 400 |
| PS-10 | 60 | 60 | 60 | 20 | 43.3 | 373.6 | 20 | 100 | 200 | 460 | 400 |
| PS-11 | 60 | 60 | 60 | 20 | 43.3 | 373.6 | 20 | 150 | 75 | 460 | 400 |
| PS-12 | 60 | 60 | 60 | 20 | 43.3 | 373.6 | 20 | 150 | 150 | 460 | 400 |
| PS-13 | 65 | 65 | 65 | 20 | 43.3 | 373.6 | 16 | 210 | 200 | 460 | 400 |
| PS-14 | 65 | 65 | 65 | 20 | 43.3 | 373.6 | 22 | 210 | 200 | 460 | 400 |
| PS-15 | 60 | 60 | 60 | 20 | 43.3 | 373.6 | 20 | 150 | 200 | 460 | 300 |
| PS-16 | 75 | 75 | 75 | 20 | 63.4 | 335.0 | 20 | 150 | 150 | 400 | 500 |
| PS-17 | 50 | 50 | 50 | 20 | 54.6 | 335.0 | 20 | 100 | 150 | 400 | 200 |
| PS-18 | 50 | 50 | 50 | 20 | 54.6 | 335.0 | 20 | 100 | 150 | 400 | 200 |
| PS-19 | 50 | 50 | 50 | 20 | 54.6 | 335.0 | 20 | 100 | 150 | 400 | 200 |
| PS-20 | 50 | 50 | 50 | — | 54.6 | 335.0 | 20 | 100 | 150 | 400 | 200 |
| PS-21 | 50 | 75 | 50 | 20 | 70.3 | 381.7 | 20 | 150 | 200 | 460 | 400 |
| PS-22 | 50 | 100 | 50 | 20 | 70.3 | 381.7 | 20 | 150 | 200 | 460 | 400 |
| PS-23 | 50 | 125 | 50 | 20 | 70.3 | 381.7 | 20 | 150 | 200 | 460 | 400 |
| PS-24 | 50 | 50 | 100 | 20 | 70.3 | 381.7 | 20 | 150 | 200 | 460 | 400 |
| Group | Shear Strength Vu (kN) | Shear Stiffness ks (kN·mm−1) | Peak Slip sp (mm) | |||||||||
|---|---|---|---|---|---|---|---|---|---|---|---|---|
| Vu,1 | Vu,2 | Vu,3 | Vu,avg | ks,1 | ks,2 | ks,3 | ks,avg | sp,1 | sp,2 | sp,3 | sp,avg | |
| PS-1 | 328.0 | 306.9 | 314.3 | 316.4 | 629.5 | 571.0 | 624.7 | 608.4 | 3.22 | 3.28 | 3.68 | 3.39 |
| PS-2 | 335.3 | 329.0 | 332.0 | 332.1 | 690.0 | 607.5 | 717.9 | 671.8 | 3.53 | 4.14 | 3.85 | 3.84 |
| PS-3 | 386.2 | 333.8 | 353.4 | 357.8 | 797.1 | 786.1 | 744.1 | 775.8 | 3.86 | 4.43 | 5.18 | 4.49 |
| PS-4 | 386.9 | 430.5 | 364.9 | 394.1 | 720.1 | 732.2 | 771.4 | 741.2 | 3.13 | 2.95 | 3.03 | 3.04 |
| PS-5 | 420.0 | 438.5 | 413.5 | 424.0 | 789.6 | 805.2 | 795.8 | 796.9 | 3.86 | 3.25 | 3.33 | 3.48 |
| PS-6 | 523.6 | 540.1 | 479.5 | 514.4 | 988.4 | 986.7 | 924.7 | 966.6 | 4.17 | 4.68 | 4.41 | 4.42 |
| PS-7 | 284.9 | 284.4 | 299.1 | 289.5 | 633.4 | 678.5 | 621.0 | 644.3 | 3.37 | 3.94 | 3.28 | 3.53 |
| PS-8 | 397.0 | 346.1 | 375.4 | 372.8 | 732.4 | 715.4 | 681.1 | 709.7 | 5.55 | 5.18 | 4.94 | 5.22 |
| PS-9 | 440.0 | 466.0 | 454.0 | 453.3 | 843.7 | 856.0 | 865.9 | 855.2 | 3.34 | 3.22 | 3.70 | 3.42 |
| PS-10 | 350.5 | 317.1 | 321.1 | 329.6 | 688.4 | 698.4 | 626.7 | 671.1 | 3.75 | 3.88 | 4.17 | 3.93 |
| PS-11 | 335.3 | 333.8 | 347.5 | 338.9 | 711.3 | 641.3 | 638.2 | 663.6 | 3.61 | 3.48 | 4.03 | 3.71 |
| PS-12 | 362.7 | 358.3 | 318.7 | 346.6 | 621.7 | 602.1 | 713.0 | 645.6 | 4.07 | 3.50 | 3.82 | 3.80 |
| PS-13 | 392.6 | 394.5 | 394.0 | 393.7 | 648.6 | 712.8 | 697.9 | 686.5 | 4.55 | 5.03 | 5.45 | 5.01 |
| PS-14 | 374.0 | 415.6 | 422.4 | 404.0 | 712.5 | 723.3 | 687.1 | 707.6 | 3.27 | 3.13 | 3.08 | 3.16 |
| PS-15 | 323.6 | 334.6 | 322.1 | 326.8 | 683.4 | 618.5 | 711.4 | 671.1 | 3.81 | 4.22 | 3.74 | 3.92 |
| PS-16 | 494.1 | 474.9 | 515.0 | 494.7 | 1114.9 | 963.3 | — | 1039.1 | 2.79 | 2.48 | — | 2.64 |
| PS-17 | 340.7 | 320.0 | 434.0 | 364.9 | 738.9 | 728.2 | 783.3 | 750.1 | 2.18 | 0.36 | 1.74 | 1.43 |
| PS-18 | 362.8 | 375.9 | 339.2 | 359.3 | 722.2 | 751.8 | 678.8 | 717.6 | 1.62 | 1.32 | 1.56 | 1.50 |
| PS-19 | 363.0 | 351.0 | 362.2 | 358.7 | 700.9 | 742.7 | 753.6 | 732.4 | 1.89 | 1.91 | 1.78 | 1.86 |
| PS-20 | 204.7 | 167.2 | 237.5 | 203.1 | 417.0 | 405.8 | 454.3 | 425.7 | 0.65 | 0.57 | 0.48 | 0.57 |
| PS-21 | 501.0 | 442.5 | 477.0 | 473.5 | 856.9 | 711.4 | 790.2 | 786.2 | 2.72 | 3.06 | 2.59 | 2.79 |
| PS-22 | 503.0 | 514.6 | 515.6 | 511.1 | 668.7 | 679.3 | 782.7 | 710.2 | 4.83 | 5.41 | 5.02 | 5.09 |
| PS-23 | 477.0 | 556.6 | 562.1 | 531.9 | 702.0 | 733.3 | 788.7 | 741.3 | 4.75 | 4.09 | 5.36 | 4.73 |
| PS-24 | 506.5 | 505.5 | 505.0 | 505.7 | 991.6 | 1034.0 | 1003.3 | 1009.6 | 1.99 | 1.41 | 1.60 | 1.67 |
| Consideration for Key Features | JSCE [23] | FIB [24] | Proposal | |
|---|---|---|---|---|
| Stage identifications | (1) Elastic stage | √ | √ | √ |
| (2) Elasto-plastic stage | √ | √ | √ | |
| (3) Postfailure stage | √ | × | √ | |
| Curve characteristics | (1) When , . | √ | √ | √ |
| (2) When , . | √ | √ | √ | |
| (3) When , and . | √ | √ | √ | |
| (4) When , , and . | × | × | √ | |
| (5) When , . | √ | × | √ | |
| Stiffness variations | (1) Overall similarity | √ | √ | √ |
| (2) Individual similarity | × | × | √ | |
© 2018 by the authors. Licensee MDPI, Basel, Switzerland. This article is an open access article distributed under the terms and conditions of the Creative Commons Attribution (CC BY) license (http://creativecommons.org/licenses/by/4.0/).
Share and Cite
Zheng, S.; Zhao, C.; Liu, Y. Analytical Model for Load–Slip Relationship of Perfobond Shear Connector Based on Push-Out Test. Materials 2019, 12, 29. https://doi.org/10.3390/ma12010029
Zheng S, Zhao C, Liu Y. Analytical Model for Load–Slip Relationship of Perfobond Shear Connector Based on Push-Out Test. Materials. 2019; 12(1):29. https://doi.org/10.3390/ma12010029
Chicago/Turabian StyleZheng, Shuangjie, Chen Zhao, and Yangqing Liu. 2019. "Analytical Model for Load–Slip Relationship of Perfobond Shear Connector Based on Push-Out Test" Materials 12, no. 1: 29. https://doi.org/10.3390/ma12010029