Forming Limit Stress Diagram Prediction of Pure Titanium Sheet Based on GTN Model
Abstract
:1. Introduction
2. Materials and Methods
2.1. Materials
2.2. Methods
2.2.1. Determining GTN Model Parameters with Finite Element REVERSE Calibration
2.2.2. Establishment of Finite Element Model
- (1)
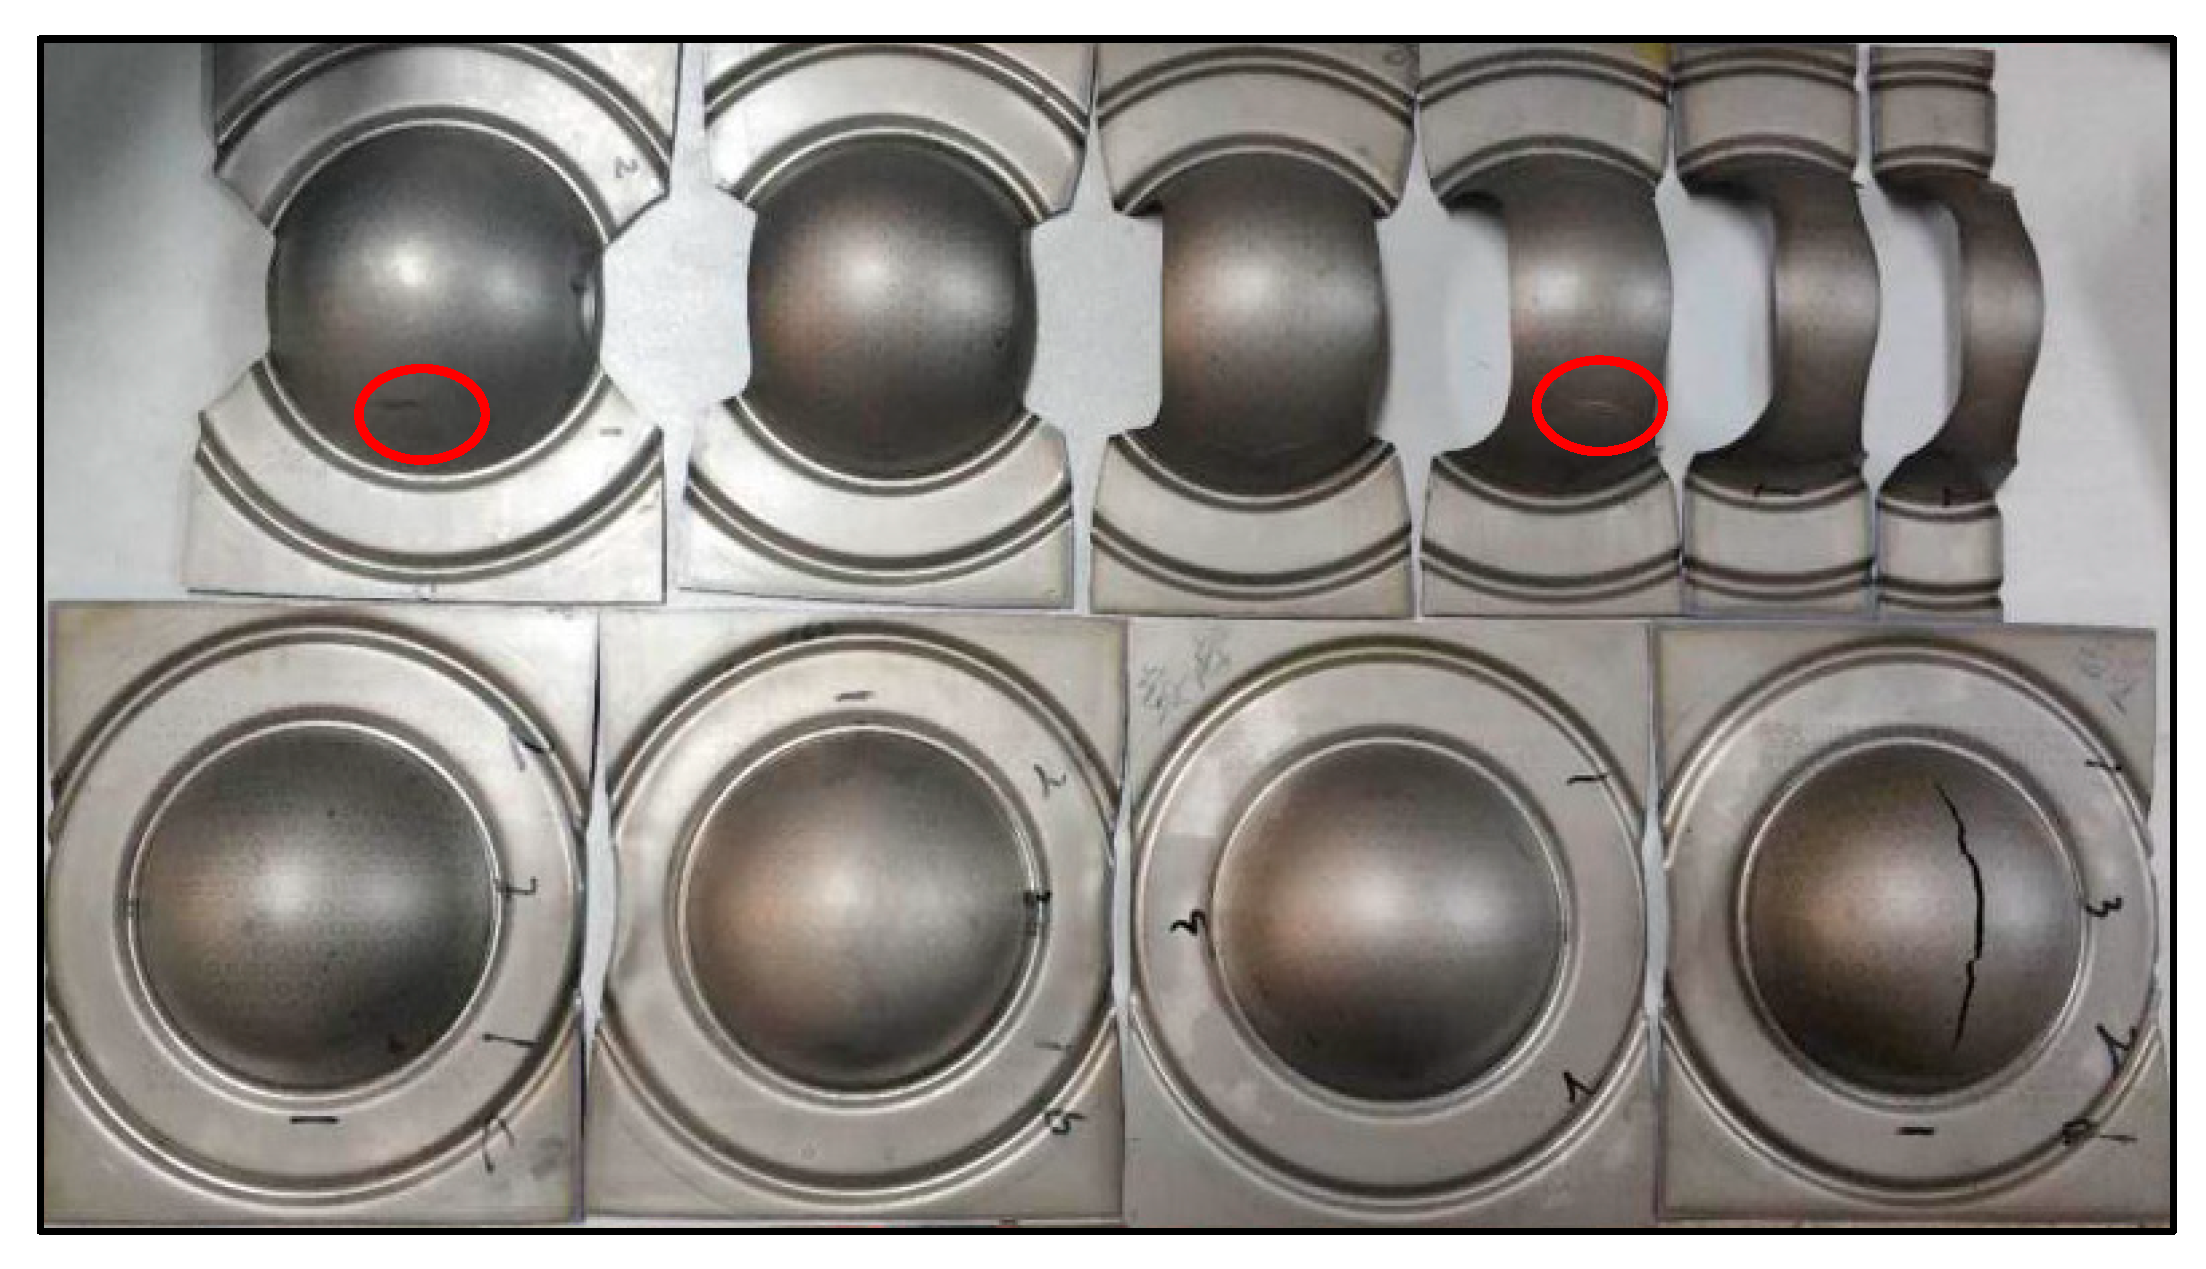
- Geometry size: The experimental for obtaining FLD reference standard GB/T 15825.8-2008 [31], The length of stepped specimens are 180 mm, and the widths (B) are 120 mm, 100 mm, 80 mm, 60 mm, 40 mm and 20 mm, respectively, as shown in Figure 5a. The dimensions of square specimens are 180 mm × 180 mm. The diameter of the hemispherical punch is 100 mm and the aperture of the die is 110 mm, as shown in Figure 5b.
- (2)
- Material parameters: Density is 4.51 g/mm3, elastic modulus is 106.605 GPa, and Poisson’s ratio is 0.34.
- (3)
- Contact friction: The contact between stepped specimens and moulds is modeled by surface-to-surface contact. The Coulomb friction coefficient is set to µ = 0.25. The Coulomb friction coefficients between square specimens and moulds are 0.1, 0.15, 0.2 and 0.25, respectively.
- (4)
- Boundary conditions: The blanking force is 140 KN when the sample width is 20 mm and 40 mm, the blanking force is 160 KN when the sample width is 60 mm and 80 mm, and the blanking force is 180 KN when the sample width is 100 mm and 120 mm. The blanking force is 220 KN when the sample is a square specimen, and the bulging speed is 0.2 mm/s.
- (5)
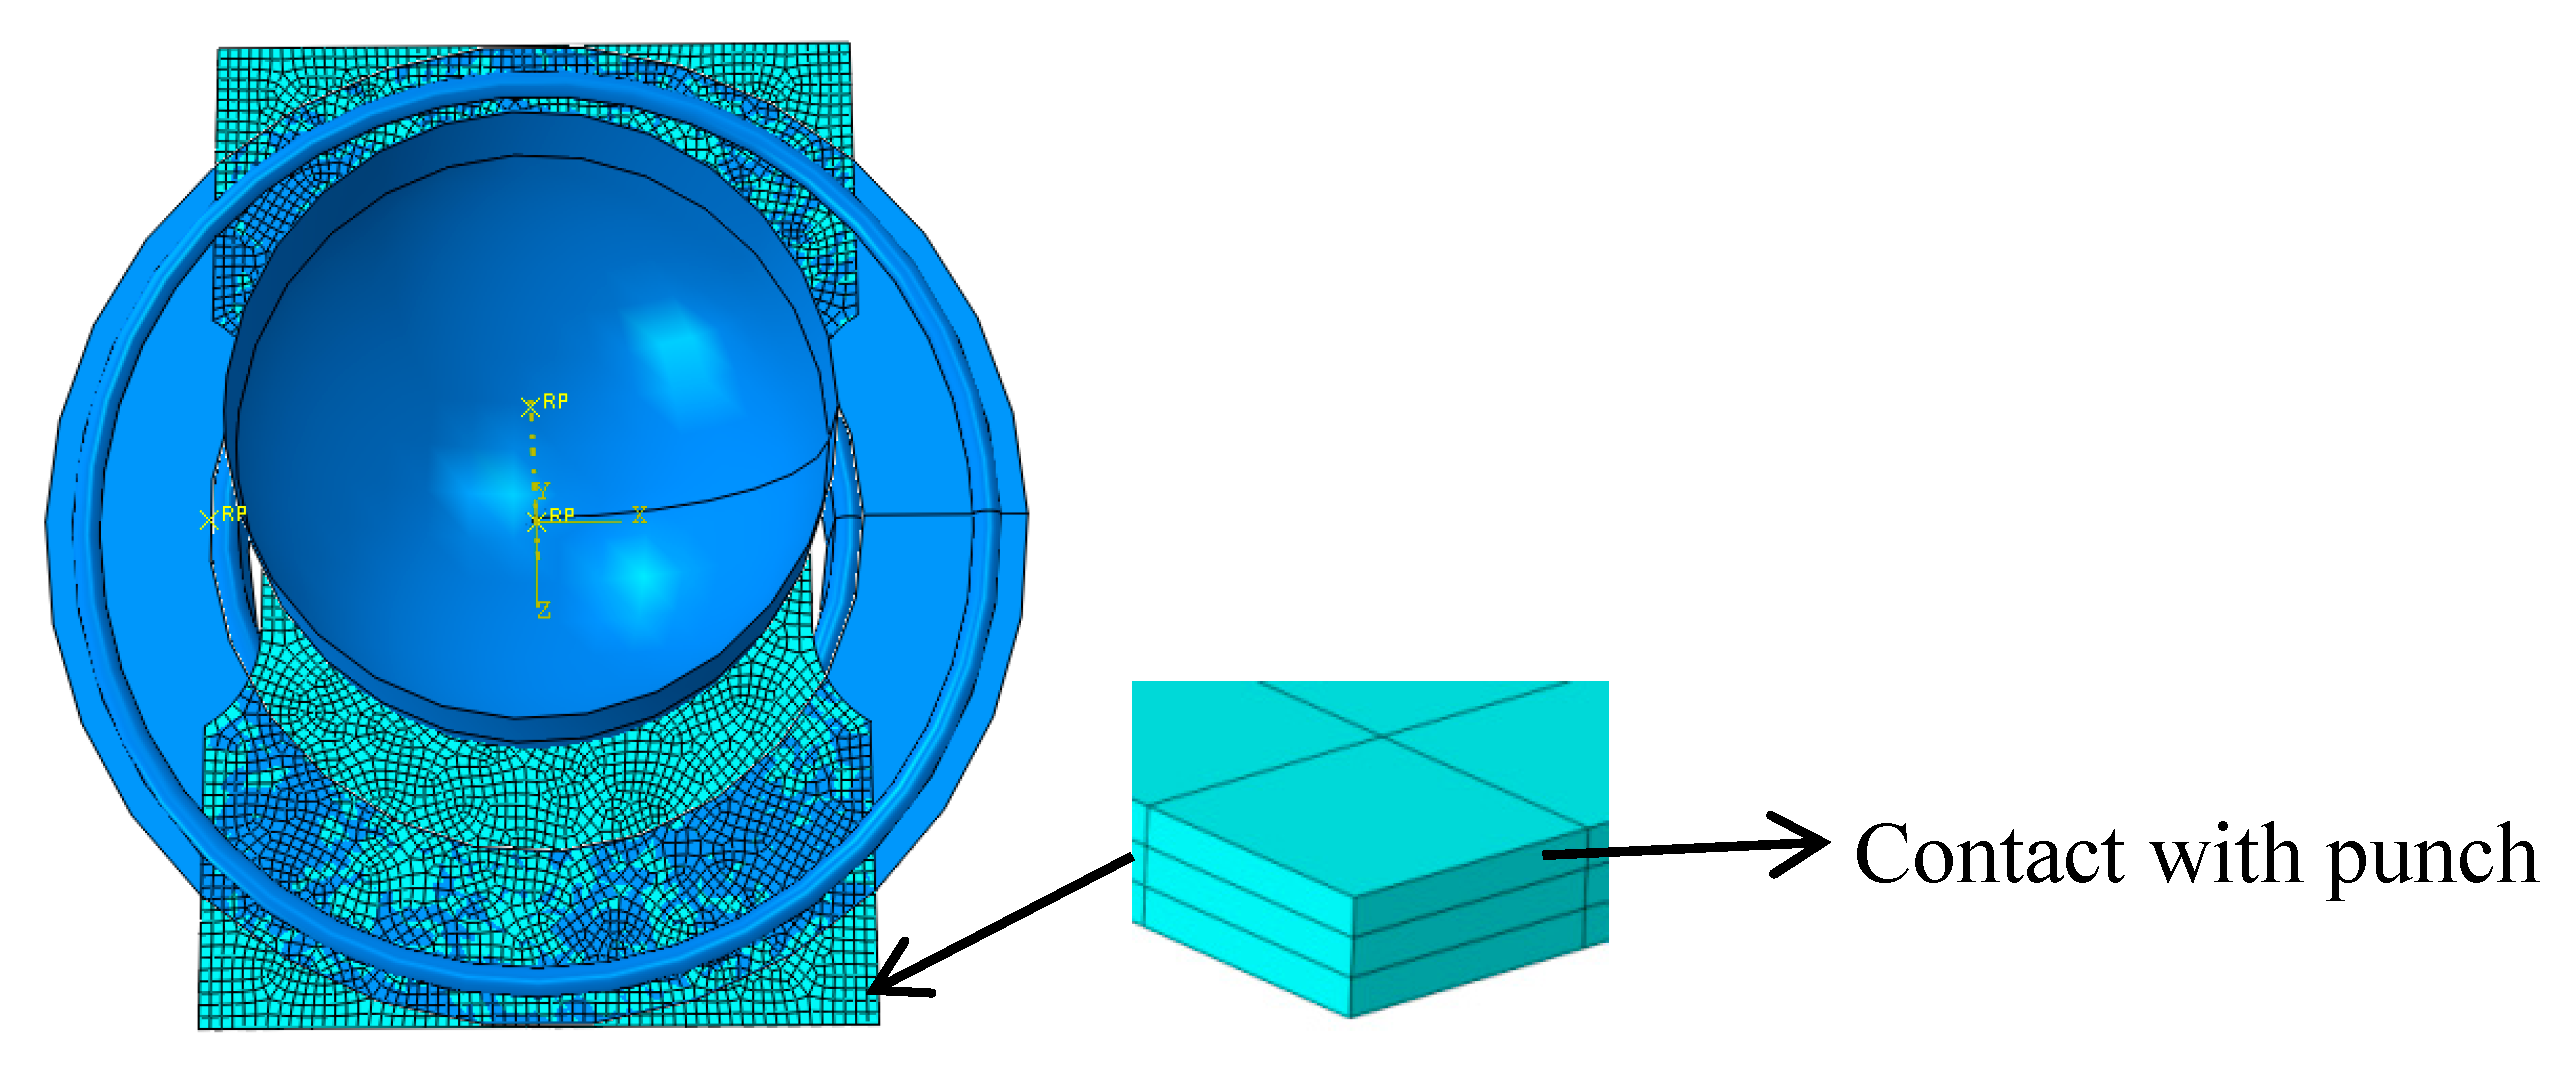
- Mesh: Since material failure always develops on the free material surface, the sheet metal geometry is also meshed in three element layers (contact with punch, middle layer and free surface). According to the above key techniques, the finite element model is shown in Figure 6.
3. Results
4. Discussion
5. Conclusions
- (1)
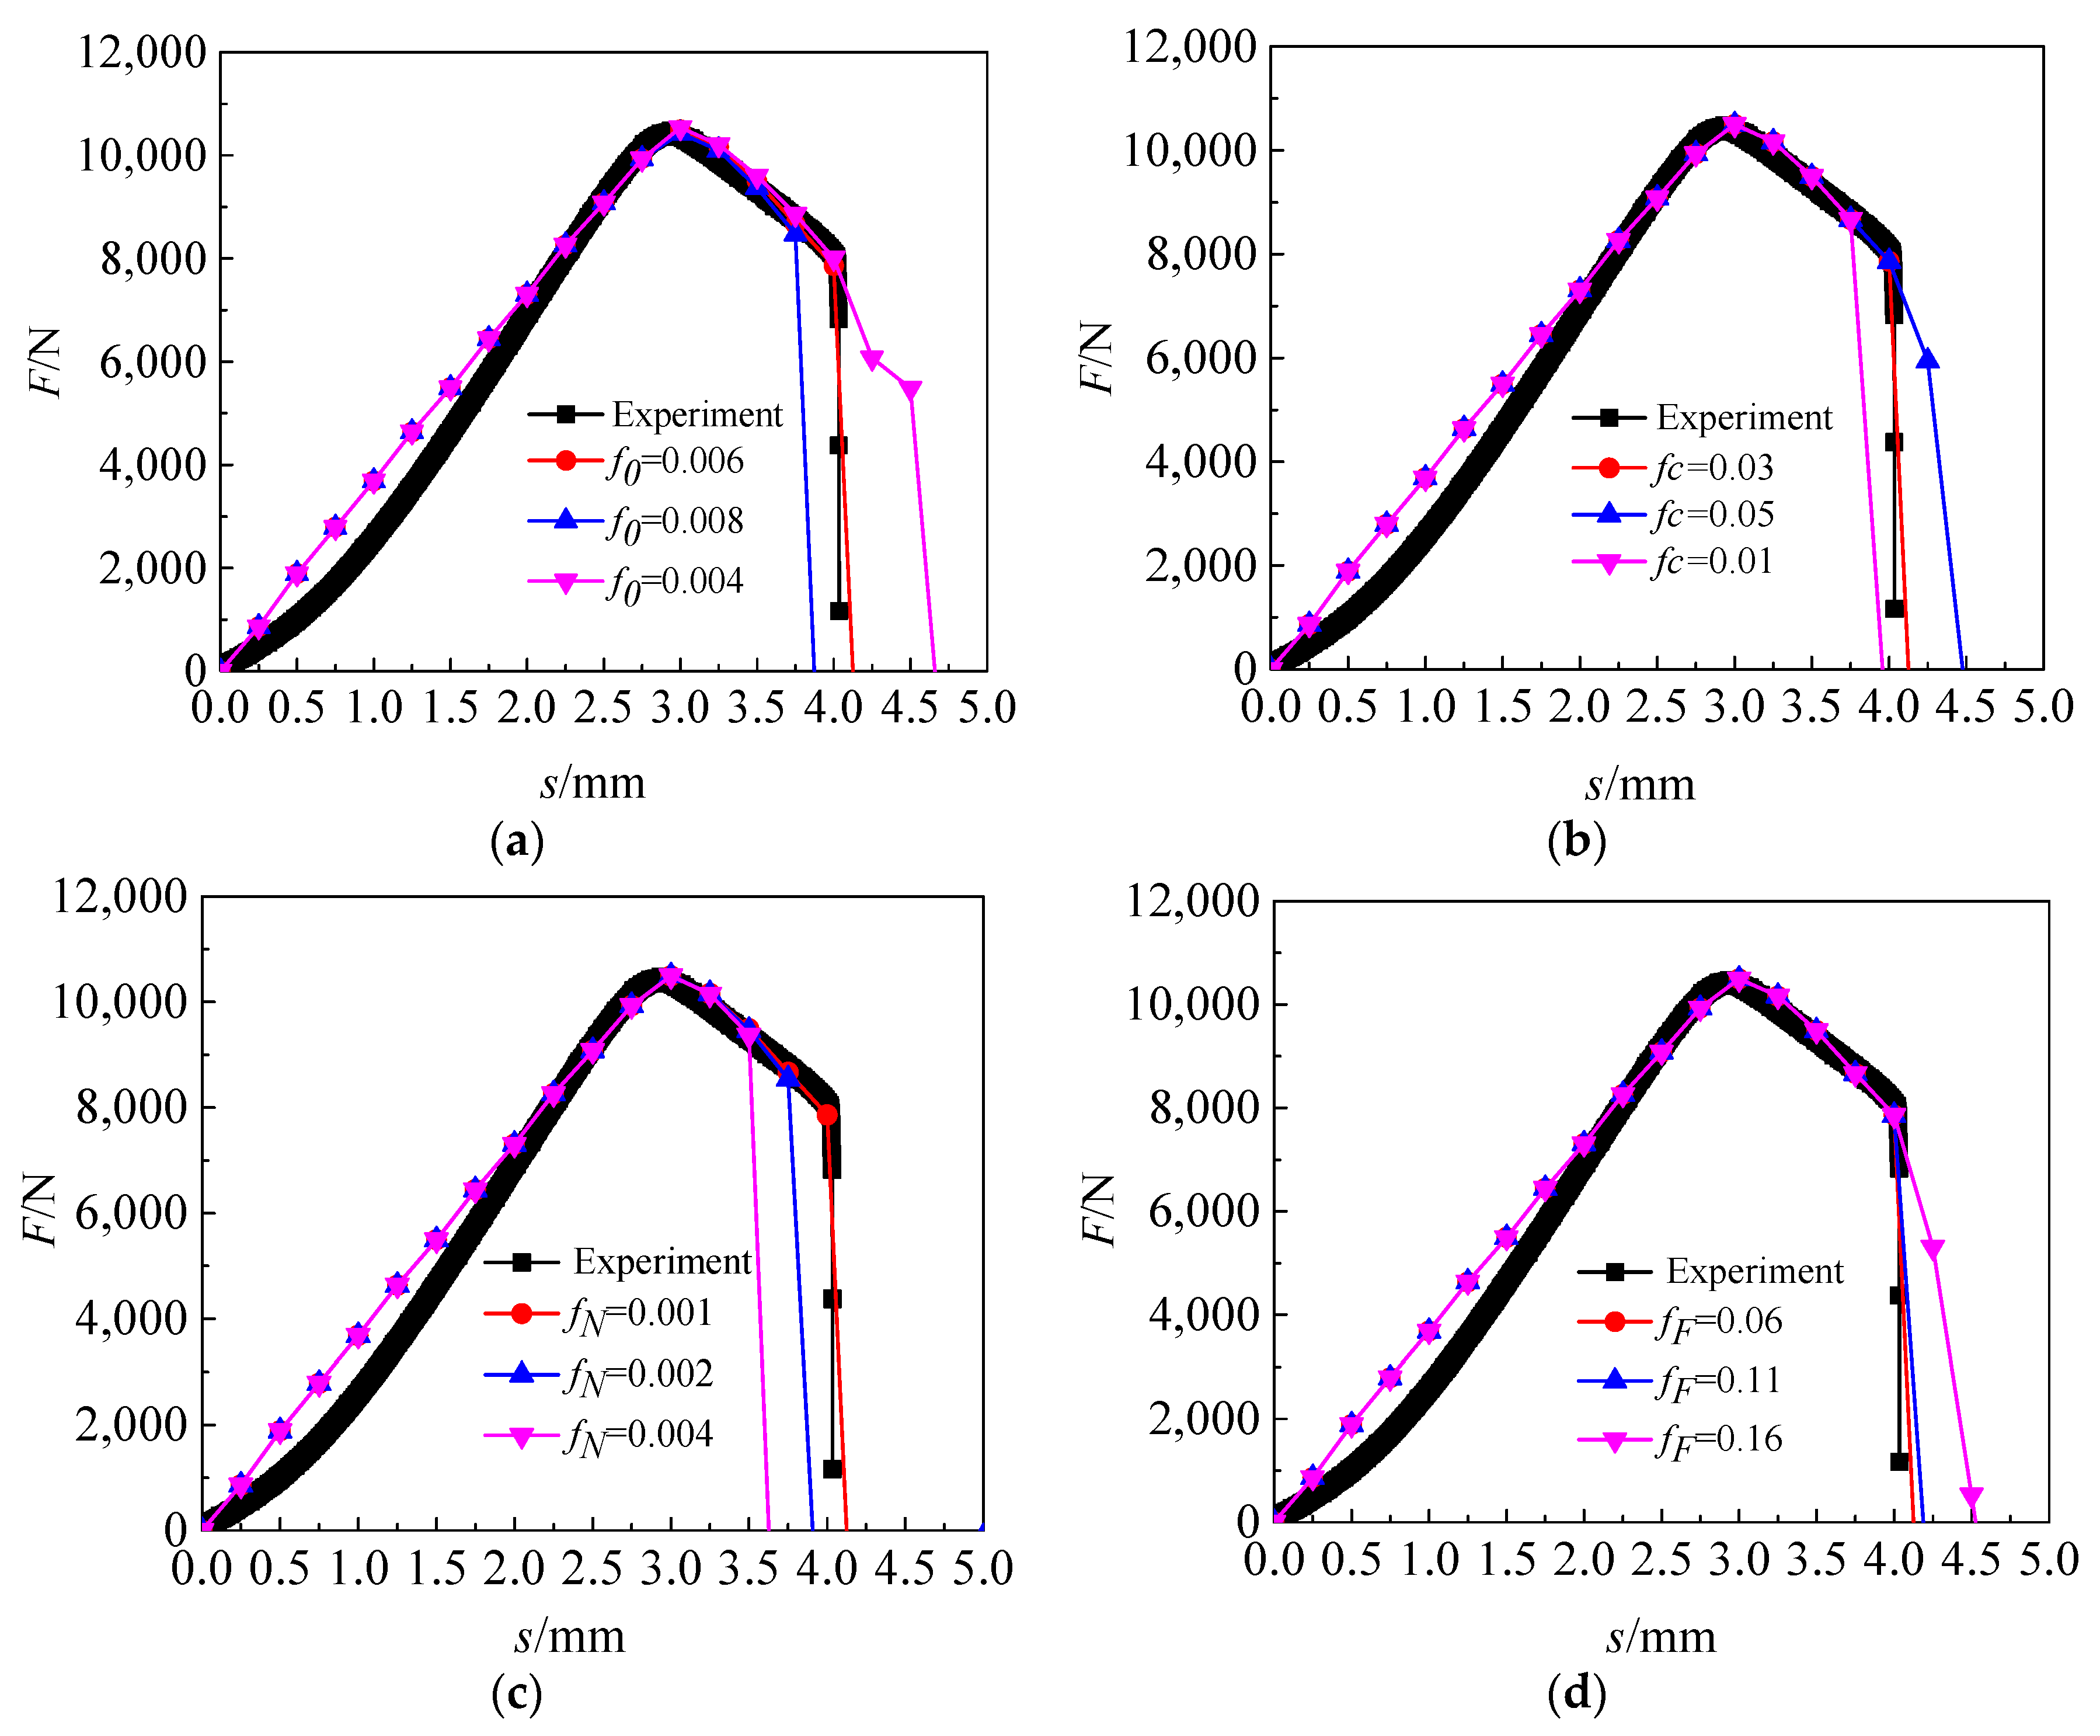
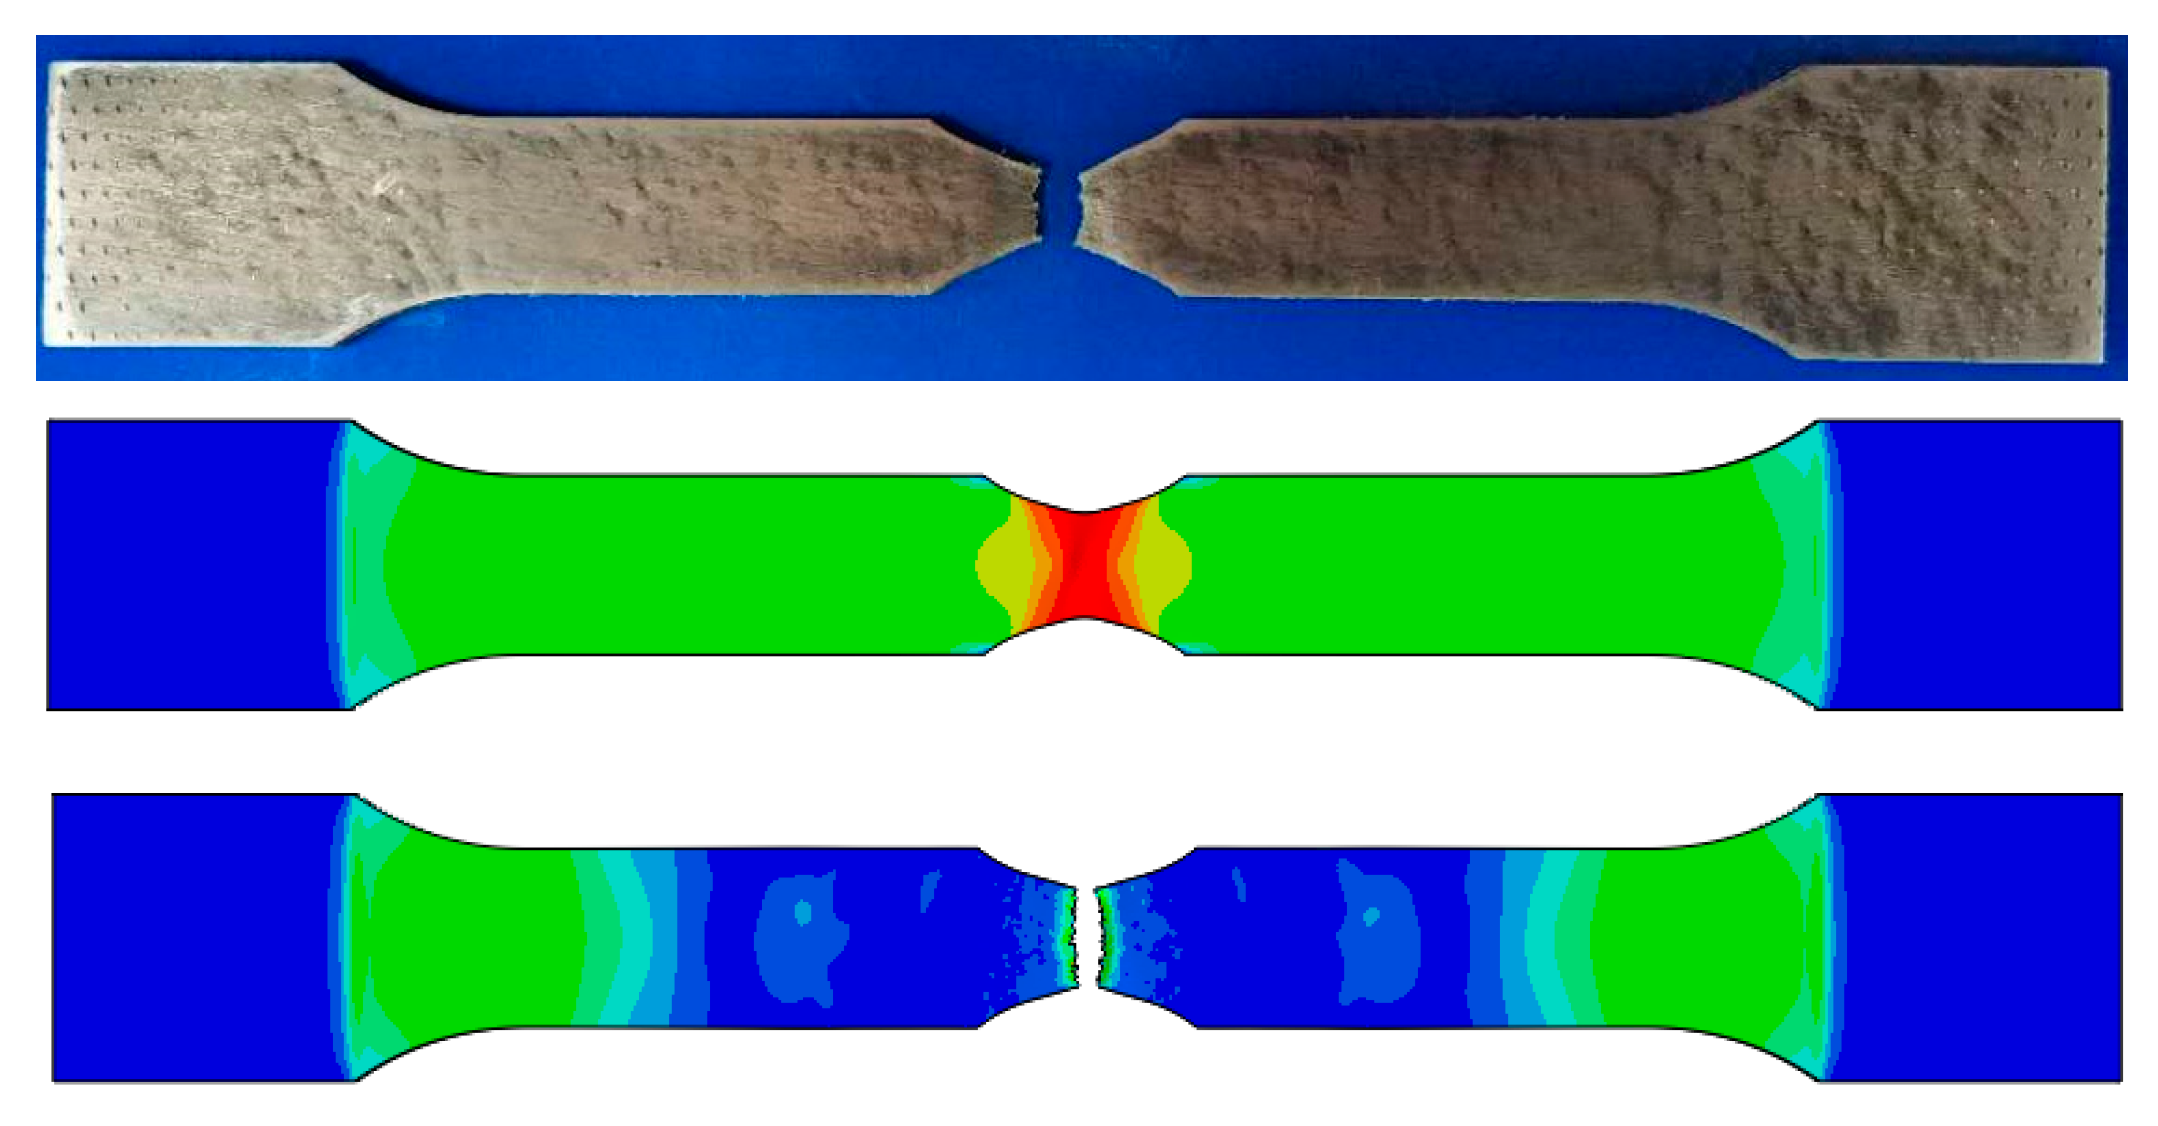
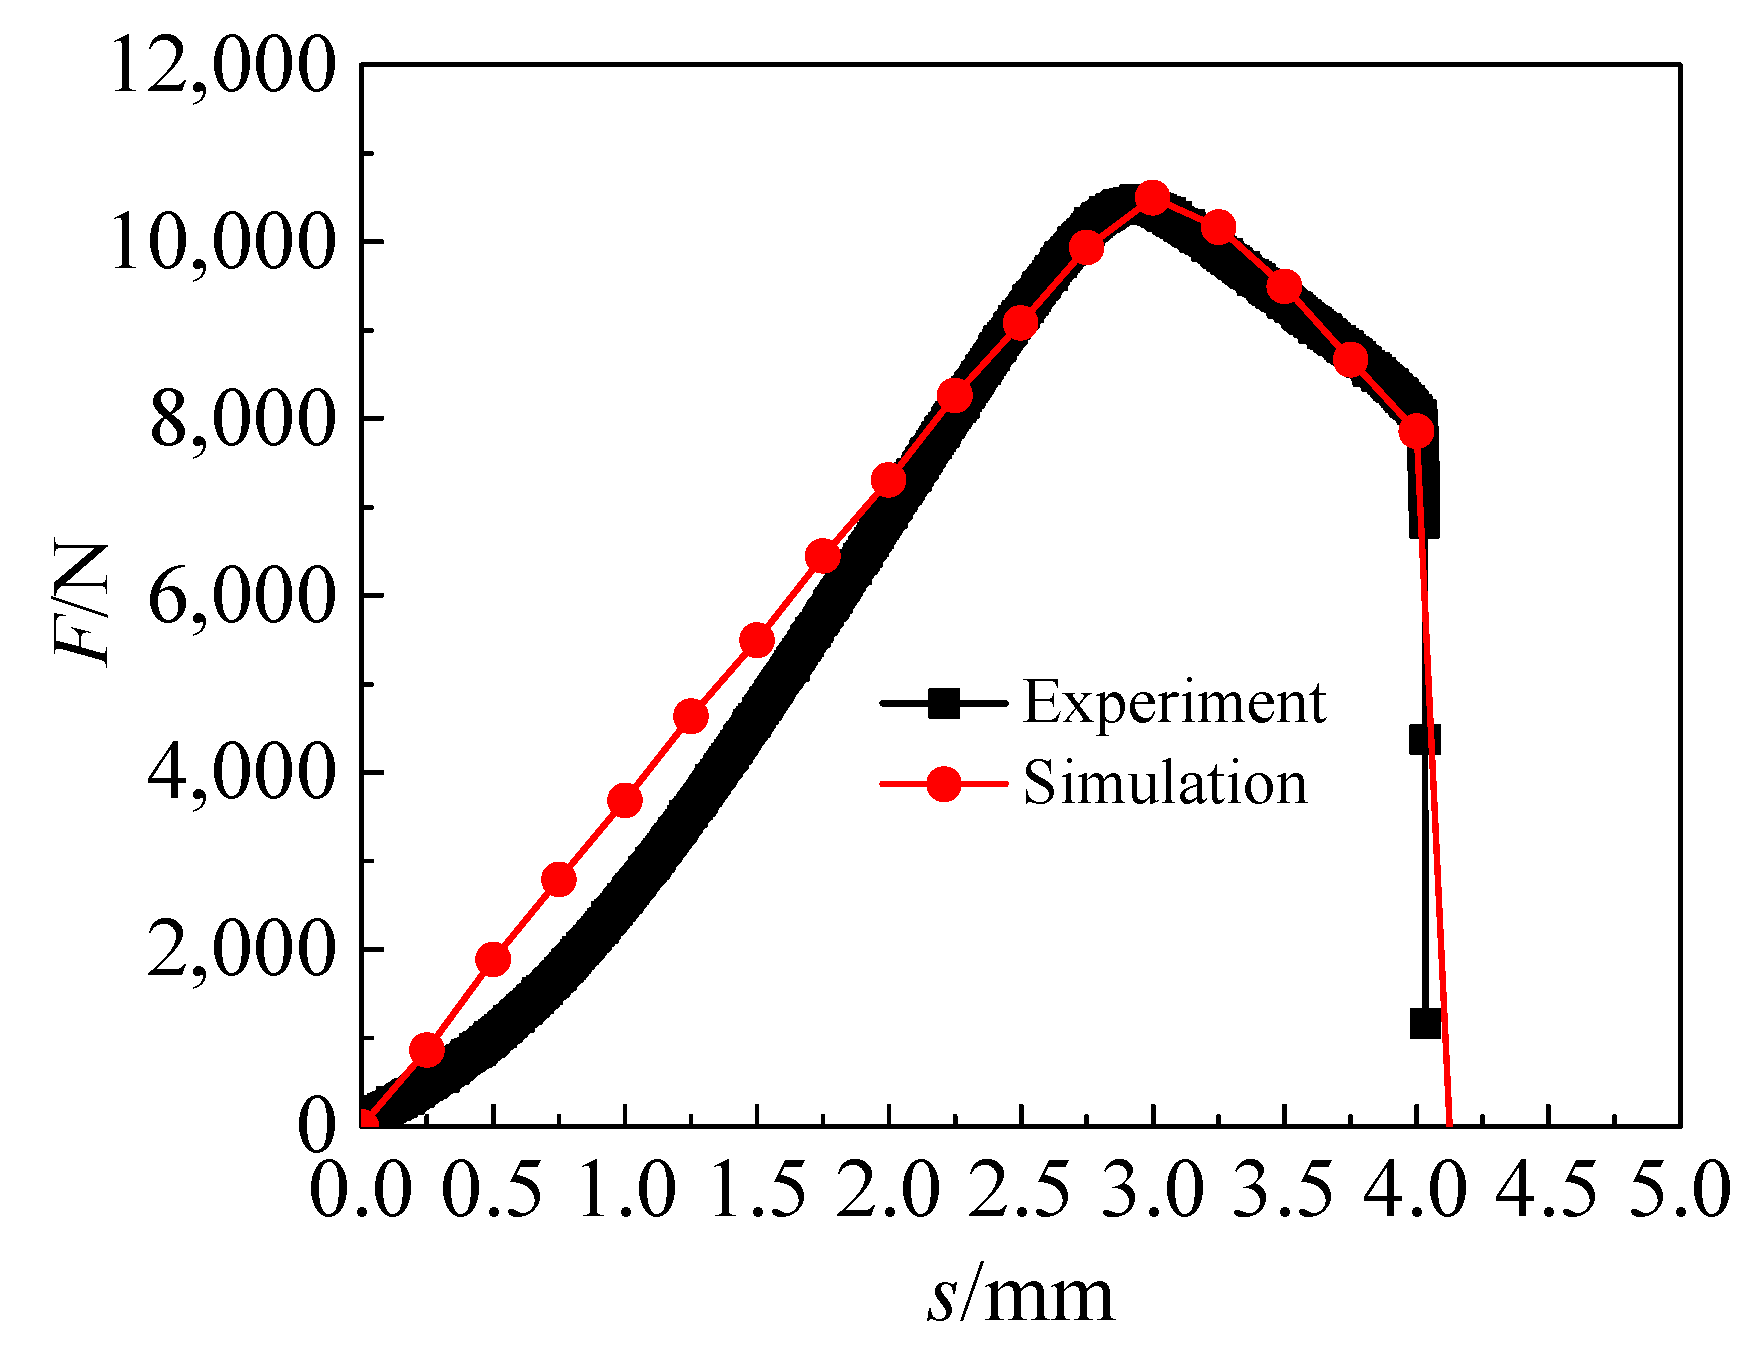
- The parameters in the GTN damage model of TA1 are determined by finite element reverse calibration. f0, fN, fc and fF are assigned as 0.006, 0.001, 0.03 and 0.06, respectively. The GTN model parameters obtained from finite element reverse calibration are proved available for ductile metals by comparing the force-displacement curves obtained by the finite element simulation and notched uniaxial tensile test.
- (2)
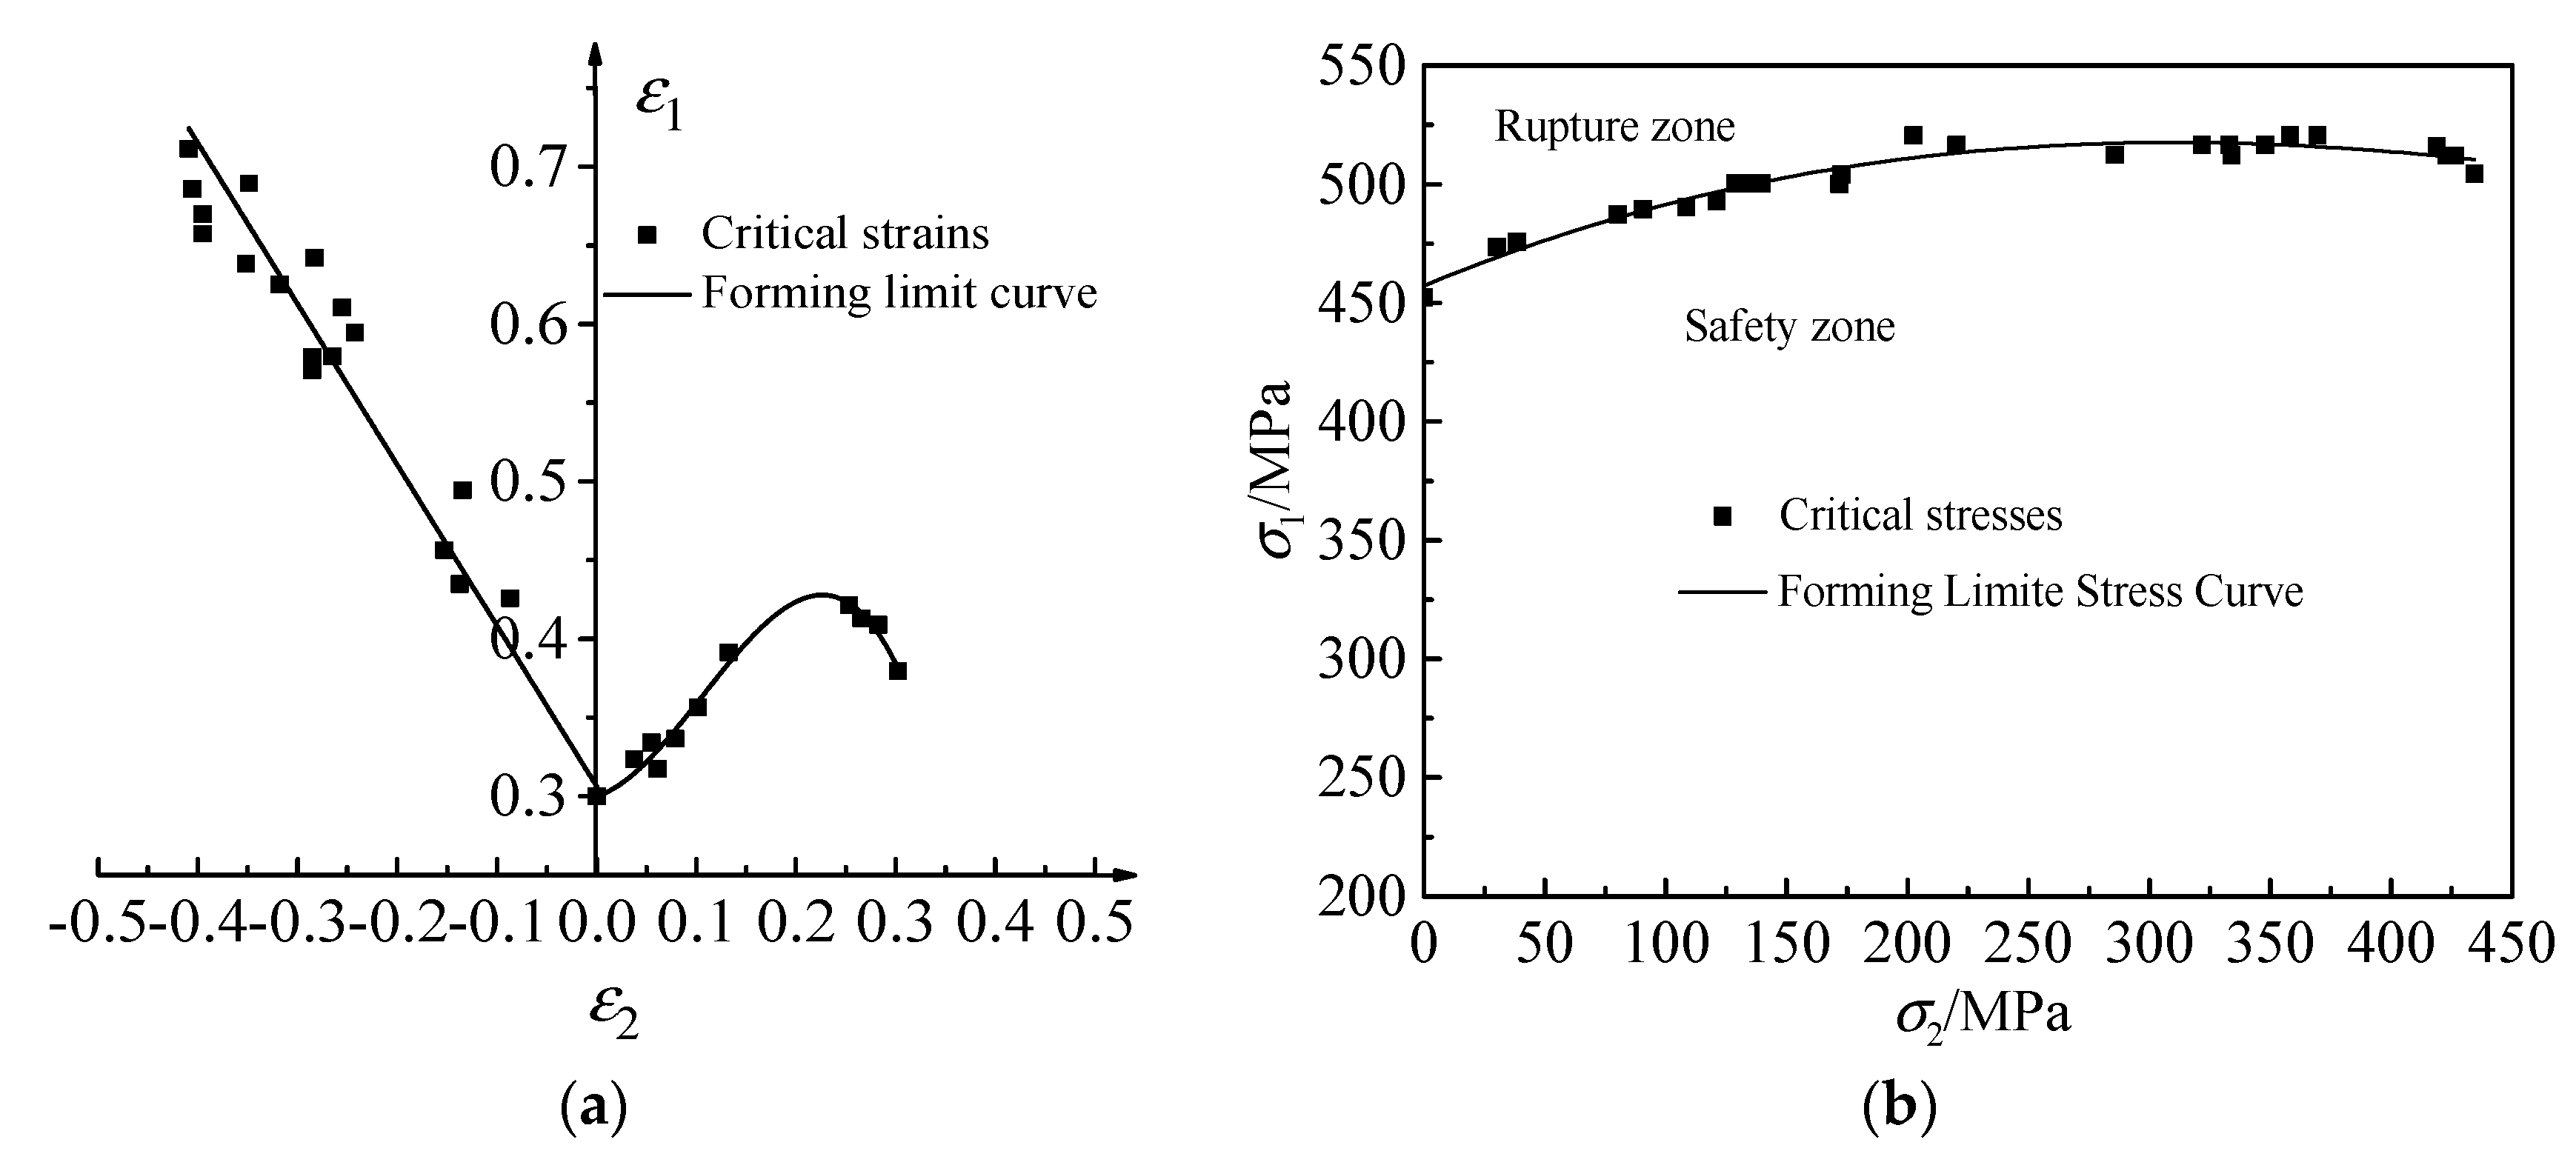
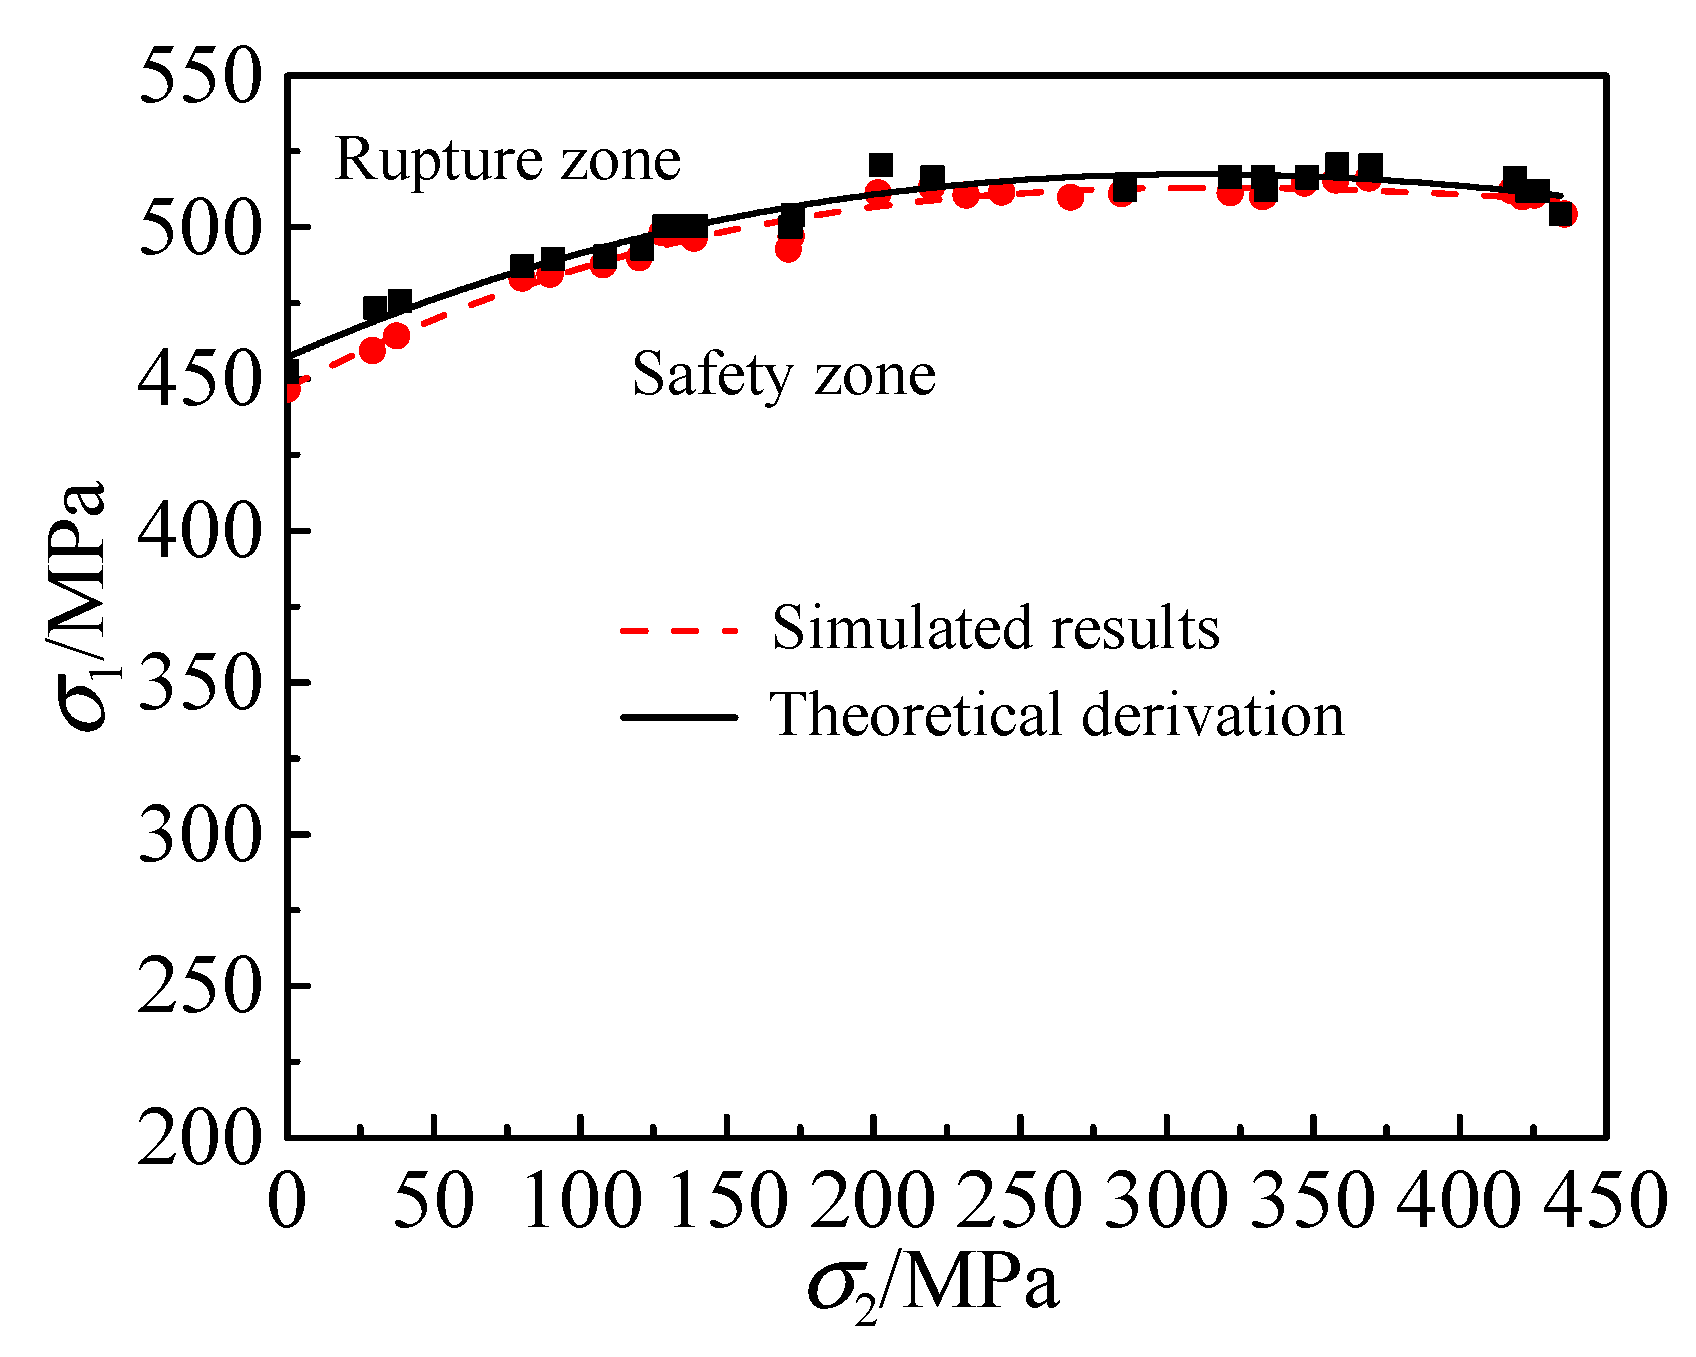
- The GTN damage model parameters obtained by finite element reverse calibration are used as the failure criterion combined with the finite element analysis method to obtain the FLD and FLSD of the TA1, which is in a good agreement with the FLD and FLSD of the TA1 obtained by experimental and theoretical derivation. It is verified that the GTN model parameters determined by the finite element reverse calibration can be used to study the forming limit of ductile metals, and provide theoretical basis and technical guidance for actual production.
Author Contributions
Funding
Conflicts of Interest
References
- Gao, P.F.; Cai, Y.; Zhan, M.; Fan, X.G.; Lei, Z.N. Crystallographic orientation evolution during the development of tri-modal microstructure in the hot working of TA15 titanium alloy. J. Alloys Compd. 2018, 741, 734–745. [Google Scholar] [CrossRef]
- Gao, P.F.; Fan, X.G.; Yang, H. Role of processing parameters in the development of tri-modal microstructure during isothermal local loading forming of TA15 titanium alloy. J. Mater. Process. Technol. 2016, 239, 160–171. [Google Scholar] [CrossRef]
- Gao, P.F.; Zhan, M.; Fan, X.G.; Lei, Z.N.; Cai, Y. Hot deformation behavior and microstructure evolution of TA15 titanium alloy with nonuniform microstructure. Mater. Sci. Eng. A 2017, 689, 243–251. [Google Scholar] [CrossRef]
- Gao, P.F.; Qin, G.; Wang, X.X.; Li, Y.X.; Li, J.S. Dependence of mechanical properties on the microstructural parameters of TA15 titanium alloy with tri-modal microstructure. Mater. Sci. Eng. A 2019, 739, 203–213. [Google Scholar] [CrossRef]
- Gao, P.F.; Li, Y.X.; Wu, R.H.; Lei, Z.N.; Cai, Y.; Zhan, M. Characterization and analysis of strain heterogeneity at grain-scale of titanium alloy with tri-modal microstructure during tensile deformation. Materials 2018, 11, 2194. [Google Scholar] [CrossRef]
- Safdarian, R. Stress based forming limit diagram for formability characterization of 6061 aluminum. Trans. Nonferr. Metals Soc. 2016, 26, 2433–2441. [Google Scholar] [CrossRef]
- Ahmadi, S.; Eivani, A.R.; Akbarzadeh, A. An experimental and theoretical study on the prediction of forming limit diagrams using new BBC yield criteria and M-K analysis. Comput. Mater. Sci. 2009, 44, 1272–1280. [Google Scholar] [CrossRef]
- Kleemola, H.J.; Pelkkikangas, M.T. Effect of predeformation and strain path on the forming limits of steel copper and brass. Sheet Metal Ind. 1977, 63, 591–599. [Google Scholar]
- Thomas, B.S. A general forming limit criterion for sheet metal forming. Int. J. Mech. Sci. 2000, 42, 1–27. [Google Scholar]
- Paul, S.K. Path independent limiting criteria in sheet metal forming. J. Manuf. Process. 2015, 20, 291–303. [Google Scholar] [CrossRef]
- Assempour, A.; Hashemi, R.; Abrinia, K.; Ganjiani, M.; Masoumi, E. A methodology for prediction of forming limit stress diagrams considering the strain path effect. Comput. Mater. Sci. 2009, 45, 195–204. [Google Scholar] [CrossRef]
- Fang, G.; Liu, Q.J.; Lei, L.P.; Zeng, P. Comparative analysis between stress- and strain-based forming limit diagrams for aluminum alloy sheet 1060. Trans. Nonferr. Metals Soc. 2012, 22, s343–s349. [Google Scholar] [CrossRef]
- Wang, H.B.; Yan, Y.; Han, F.; Wan, M. Experimental and theoretical investigations of the forming limit of 5754O aluminum alloy sheet under different combined loading paths. Int. J. Mech. Sci. 2017, 133, 147–166. [Google Scholar] [CrossRef]
- Thomas, B.S.; Yoon, J.W. On the existence of indeterminate solutions to the equations of motion under non-associated flow. Int. J. Plast. 2008, 24, 583–613. [Google Scholar]
- Xie, Y.; Wan, M.; Han, F. Transformation relation between limit strainand limit stress in sheet metal forming. J. Plast. Eng. 2004, 11, 55–58. [Google Scholar]
- Uthaisangsuk, V.; Prahl, U.; Bleck, W. Stress based failure criterion for formability characterization of metastable steels. Comput. Mater. Sci. 2007, 39, 1272–1280. [Google Scholar] [CrossRef]
- Uthaisangsuk, V.; Prahl, U.; Munstermann, S.; Bleck, W. Experimental and numerical failure criterion for formability prediction in sheet metal forming. Comput. Mater. Sci. 2008, 43, 43–50. [Google Scholar] [CrossRef]
- Chen, M.Z. Volume Evolution Simulation for Damage Analysis of Aluminum Alloy 6016; Chongqing University: Chongqing, China, 2015. [Google Scholar]
- Foad, R.; Gholamhossien, M.; Farhad, A.; Jalal, F.S. Determination of the constants of GTN damage model using experiment, polynomial regression and kriging methods. Appl. Sci. 2017, 7, 1179. [Google Scholar]
- Gurson, A.L. Continuum theory of ductile rupture by void nucleation and growth: Part I-yield criteria and flow rules for porous ductile media. J. Eng. Mater. Technol. 1977, 99, 2–15. [Google Scholar] [CrossRef]
- Tvergaard, V. Influence of voids on shear band instabilities under plane strain conditions. Int. J. Fract. 1981, 17, 398–407. [Google Scholar] [CrossRef]
- Tvergaard, V. On loca1ization in ductile materials containing spherical voids. Int. J. Fract. 1982, 18, 237–252. [Google Scholar]
- Tvergaard, V.; Needleman, A. Analysis of the cup-cone fracture in a round tensile bar. Acta Met. 1984, 32, 157–169. [Google Scholar] [CrossRef]
- Needleman, A.; Tvergaard, V. An analysis of ductile rupture in notched bars. J. Mesh. Phys. Solids 1984, 32, 461–490. [Google Scholar] [CrossRef]
- Chu, C.C.; Needleman, A. Void nucleation effects in biaxially stretched sheet. J. Eng. Mater. Technol. 1980, 102, 249–256. [Google Scholar] [CrossRef]
- Wang, X.X.; Zhan, M.; Guo, J.; Zhao, B. Evaluating the Applicability of GTN Damage Model in Forward Tube Spinning of Aluminum Alloy. Metals 2016, 6, 136. [Google Scholar] [CrossRef]
- Feng, F.; Li, J.; Yuan, P.; Zhang, Q.X.; Huang, P.; Su, H.L.; Chen, R.C. Application of a GTN Damage Model Predicting the Fracture of 5052-O Aluminum Alloy High-Speed Electromagnetic Impaction. Metals 2018, 8, 761. [Google Scholar] [CrossRef]
- Benseddiq, N.; Imad, A. A ductile fracture analysis using a local damage model. Int. J. Press. Vessel. Pip. 2008, 85, 219–227. [Google Scholar] [CrossRef]
- Zhang, Z.L.; Thaulow, C.; Ødegård, J. A complete Gurson model approach for ductile fracture. Eng. Fract. Mech. 2000, 67, 155–168. [Google Scholar] [CrossRef]
- Kalyanmoy, D.; Sameer, A.; Meyarivan, T. A Fast Elitist Non-dominated Sorting Genetic Algorithm for Multi-objective Optimization: NSGA-II. IEEE Trans. Evolut. Comput. 2002, 6, 182–197. [Google Scholar]
- GB/T15825.8-2008. Guidelins for the Determination of Forming-Limit Diagrams; Standards Press of China: Beijing, China, 2008. [Google Scholar]
- He, M.; Li, F.G.; Wang, Z.G. Forming limit Stress diagram prediction of aluminum alloy 5052 based on GTN model parameters determined by in situ tensile test. Chin. J. Aeronaut. 2011, 24, 378–386. [Google Scholar] [CrossRef]
- Wu, M.L.; Zha, G.C.; Gan, Z.R. FEA of vertical parts formed with multistage incremental sheet metal forming based on the forming limit stress diagram. Int. J. Adv. Manuf. Technol. 2017, 93, 2155–2160. [Google Scholar] [CrossRef]





| Group | f0 | fc | fN | fF | εN | SN | q1 | q2 | q3 |
|---|---|---|---|---|---|---|---|---|---|
| 1 | 0.006 | 0.03 | 0.001 | 0.06 | 0.2 | 0.1 | 1.5 | 1.0 | 2.25 |
| 2 | 0.006 | 0.03 | 0.004 | 0.06 | |||||
| 3 | 0.006 | 0.03 | 0.002 | 0.06 | |||||
| 4 | 0.006 | 0.05 | 0.001 | 0.06 | |||||
| 5 | 0.006 | 0.01 | 0.001 | 0.06 | |||||
| 6 | 0.006 | 0.03 | 0.001 | 0.11 | |||||
| 7 | 0.006 | 0.03 | 0.001 | 0.16 | |||||
| 8 | 0.004 | 0.03 | 0.001 | 0.06 | |||||
| 9 | 0.008 | 0.03 | 0.001 | 0.06 |
© 2019 by the authors. Licensee MDPI, Basel, Switzerland. This article is an open access article distributed under the terms and conditions of the Creative Commons Attribution (CC BY) license (http://creativecommons.org/licenses/by/4.0/).
Share and Cite
Huang, T.; Zhan, M.; Wang, K.; Chen, F.; Guo, J.; Li, Y.; Song, Z.; Bai, L. Forming Limit Stress Diagram Prediction of Pure Titanium Sheet Based on GTN Model. Materials 2019, 12, 1783. https://doi.org/10.3390/ma12111783
Huang T, Zhan M, Wang K, Chen F, Guo J, Li Y, Song Z, Bai L. Forming Limit Stress Diagram Prediction of Pure Titanium Sheet Based on GTN Model. Materials. 2019; 12(11):1783. https://doi.org/10.3390/ma12111783
Chicago/Turabian StyleHuang, Tao, Mei Zhan, Kun Wang, Fuxiao Chen, Junqing Guo, Yanyang Li, Zhuo Song, and Luge Bai. 2019. "Forming Limit Stress Diagram Prediction of Pure Titanium Sheet Based on GTN Model" Materials 12, no. 11: 1783. https://doi.org/10.3390/ma12111783
APA StyleHuang, T., Zhan, M., Wang, K., Chen, F., Guo, J., Li, Y., Song, Z., & Bai, L. (2019). Forming Limit Stress Diagram Prediction of Pure Titanium Sheet Based on GTN Model. Materials, 12(11), 1783. https://doi.org/10.3390/ma12111783


