1. Introduction
The properties and lifespan of wood strongly depend on many aspects, and therefore the permanent moisture monitoring of wood has a specific application in a wide range of technical fields. Primarily, wood-based wall technologies are widely considered to be suitable building materials for low-environmental impact composites in the building engineering field. Wood framed and composite wood wall technologies that utilize advanced insulation techniques have been well-integrated for several decades in the building sector, and specifically meet thermal and environmental requirements [
1]. Thermal properties, such as thermal conductivity and specific heat, are given significant consideration when designing buildings, especially low-energy or passive ones. Building components that are exposed to the weather outdoors are mainly affected by moisture and temperature-related factors. It has been two decades since exterior building surfaces began to be designed to be monitored by methods for the continuous monitoring of temperature and moisture in the micro-environment of structures, and within the wood itself. A system was introduced that maps the climate index for the decay of wood at various geographical levels via the use of existing climatic data, standards, and moisture content measurements [
2]. Moisture and temperature can also play an important role indoors and within the structure of a building, i.e., throughout the whole building envelope. The existence of high moisture content can initiate decay or the growth of fungi. Particularly for bio-based building materials such as wood, the use of biological agents should be considered in order to predict service life, particularly with regard to fungal decay and mold growth risks. The control and reduction of wood moisture content is therefore a key instrument for wood protection [
3,
4]. However, the permanent monitoring of wood components may also have a relevant role to play in this field, especially when such components are incorporated in the building structure and their continuous physical monitoring is impossible. The correct estimation of timber moisture content and the subsequent initiation of potentially necessary measures are therefore essential tasks during the planning, execution, and maintenance of buildings built with wood or wood-based products. This fact has contributed to a recent and considerable rise in interest concerning the in-situ monitoring of the moisture content of structural timber elements [
5]. In this connection, the modeling of the outdoor performance of wood products is also attracting specific attention [
6]. Furthermore, moisture content measurement has a lot of potential for use in testing the durability of timber products [
7].
A technique for the nondestructive evaluation of moisture content distribution during drying using a newly developed soft X-ray digital microscope and absortimetry was investigated by Tanaka et al. [
8] and Tanaka and Kawai [
9]. X-ray-based methods and diagnostics have already been successfully developed and used in many applications to identify aspects of wood decay [
10,
11]. In particular, wood temperature and moisture content have a direct impact on fungus and its ability to metabolize and degrade wood cell wall material over time [
12]. Moisture requirements for the growth and decay of different fungi and wood species have already been determined, though relationships between wood moisture content, wood temperature, and fungal decay play an important part when applying the method in specific climates [
13]. In addition, the relationship between microclimate, material environment, and decay is being studied in order to achieve a better understanding of issues concerned with the service life prediction of wood and wood-based products. Dietsch et al. [
5] describes common methods of determining wood moisture content and evaluates them with respect to their applicability in monitoring concepts. Continuous moisture measurements using calibrated load cells and a data logger coupled with a weather station are an efficient way to record moisture in all kinds of material [
14]. Unfortunately, the most accurate direct methods, which use oven drying and distillation, are time-consuming and cause the destruction of specimens.
Many indirect methods have been developed based on electric conductance or dielectric properties which allow results to be obtained fast and with satisfactory accuracy. In this relation, wood moisture measurement has a long history. Indirect methods are often applied for in-situ measurements and monitoring. They are based on determining a different property, which is correlated with the water content. Thus, resistivity measurements require material-specific characteristics and a temperature compensation, since both parameters have a significant effect on electrical conductivity [
15]. Dunlap [
16] discusses twelve commercial electrical moisture meters. Most of them are based on resistance (conductance) measurement. The Wood Handbook [
17] states that the resistance of wood ranges from a few petaohms for oven-dry wood to a few kiloohms for wood with fiber saturation. In the range between fiber saturation (appr. 30%) to complete saturation, the change of resistance is not so significant. James [
18] mentioned that the conductance and dielectric properties of wood vary consistently with moisture content when it is less than 30%, with a roughly linear relationship between the logarithm of conductance and the logarithm of moisture content. Thanks to this relationship, the moisture content can be determined. The measurement principle is based on the application of direct or alternating current, but higher resistances than a few hundred megaohms are not so easy to measure. Electric-current through such huge resistance is often very small, and direct current measurement in a simple electrical circuit with an appropriate error is not possible. Measuring very high resistance values is a difficult task, since low voltage or currents are present and thus, noise and amplification must be carefully done, especially when low resistance values are required to be measured using the same circuit, too [
19]. Moisture content is not the only phenomenon which has an effect on the conductance of wood material; another significant factor is temperature dependency. James [
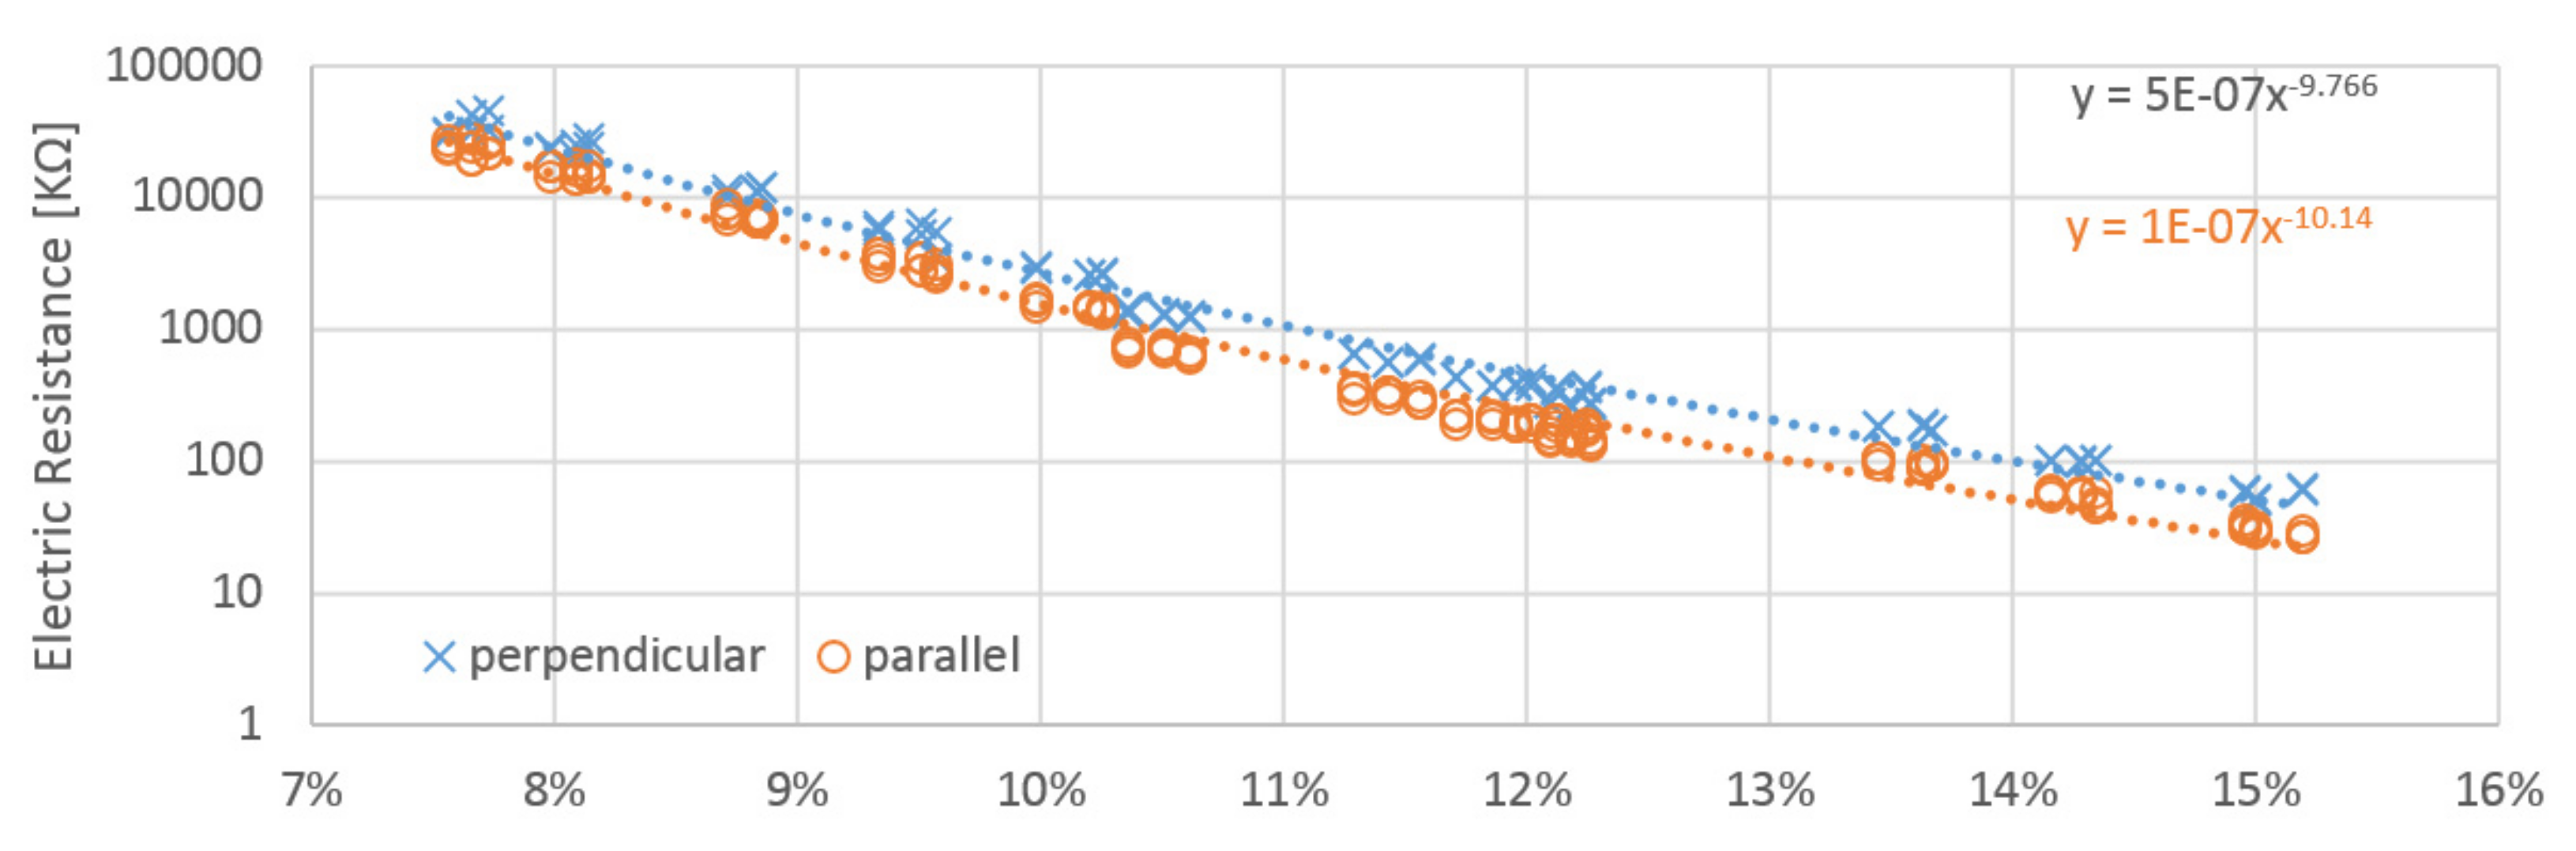
18] mentioned that an increase of 10 °C causes an approximately two-fold increase in conductance in regions with more than 10% moisture content. Another problem is the anisotropy of wood in the direction of the grain. Conductance measured parallel to the grain is approximately double that of perpendicular conductance.
Many methods, complex electrical circuits, and devices have been developed in past decades. The most common and most easily applicable methods are electrical resistance measurements [
15]. Typical devices are equipped with probes and a display for showing calculated values. They are portable, and very useful for taking technical measurements or conducting on-site inspections of materials. A long-term moisture measuring and data logging method for wood exposed to weather conditions was developed by Brischke et al. [
20]. The method involves measuring the electrical resistance with glued electrodes for a sustainable connection. The measuring points at the tips of the electrodes are glued conductively into the wood while the remaining outer parts of the electrodes are glued with insulating adhesive. For this purpose, special conductive and insulating glues and electrodes were developed and comparatively evaluated in laboratory tests. In a recent study, the comparison of accuracy and ease of operation between voltammetry and digital bridge method for electrical resistance measurement in wood specimens and the factors influencing voltammetry were examined in detail [
21]. Another useful approach is based on interdigital capacitance sensing of moisture content in rubber wood where the electrode contact is non-penetrating. It has linear sensitivity and better accuracy at very low moisture content. This represents faster measurement and is more convenient to be used in the industry for the production line quality control monitoring of moisture content of rubber wood [
22].
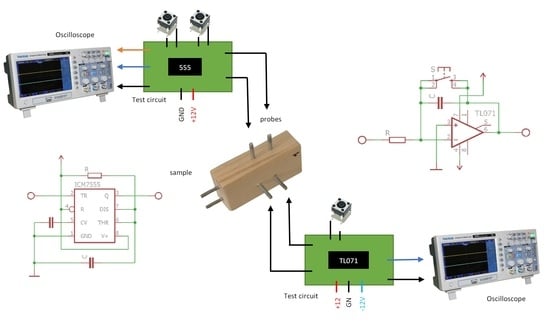
Nowadays, with innovative approaches in many fields, we often use technologies which allow us to monitor the service life of all building elements permanently. Portable independent devices often cannot be integrated into structures for a long time or connected to networks. For that reason, there are potential future applications for sensors which could be connected to a network and placed into a composite structure containing wood for a long period of time (
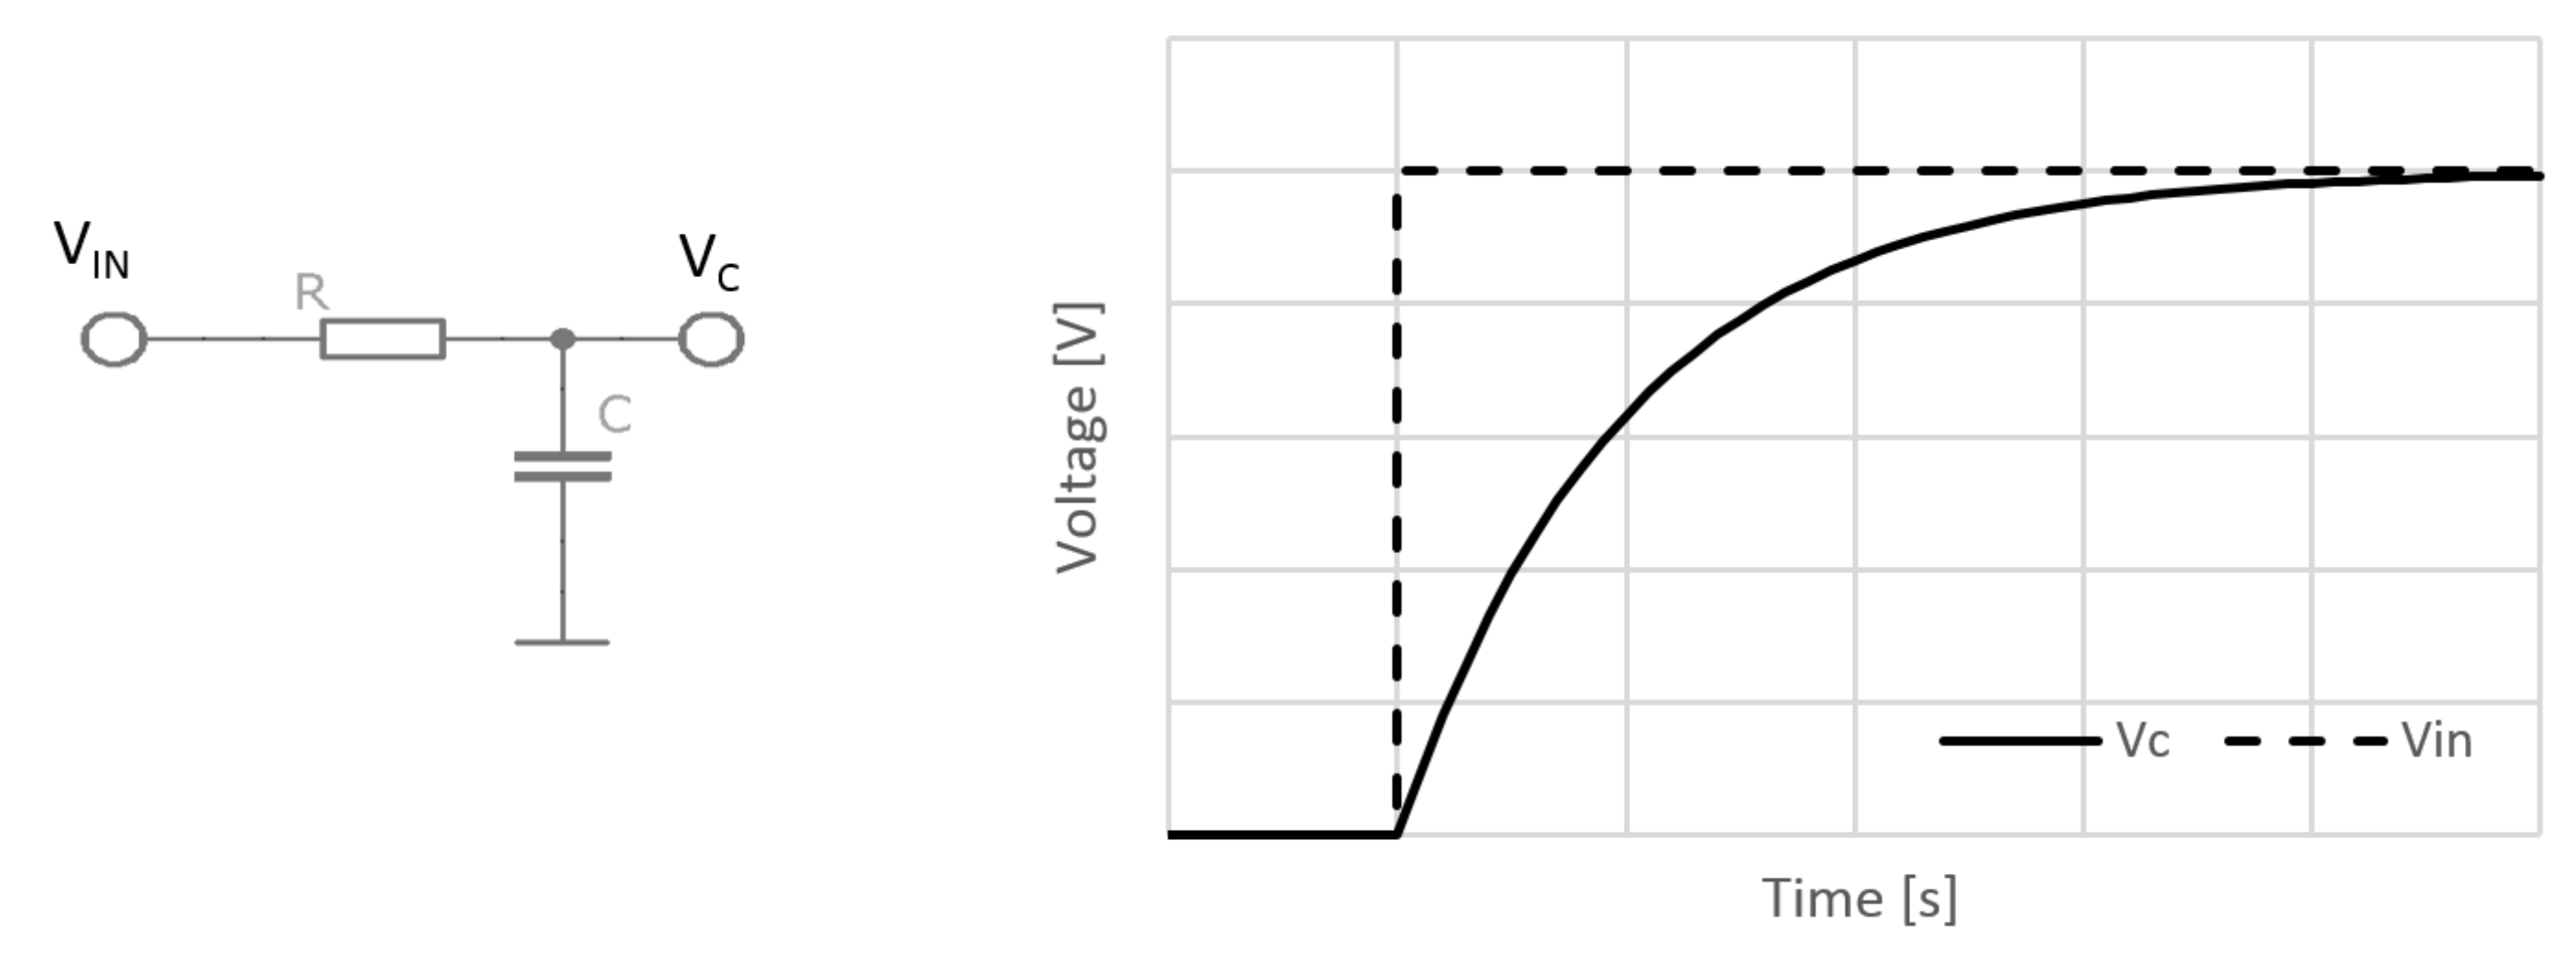
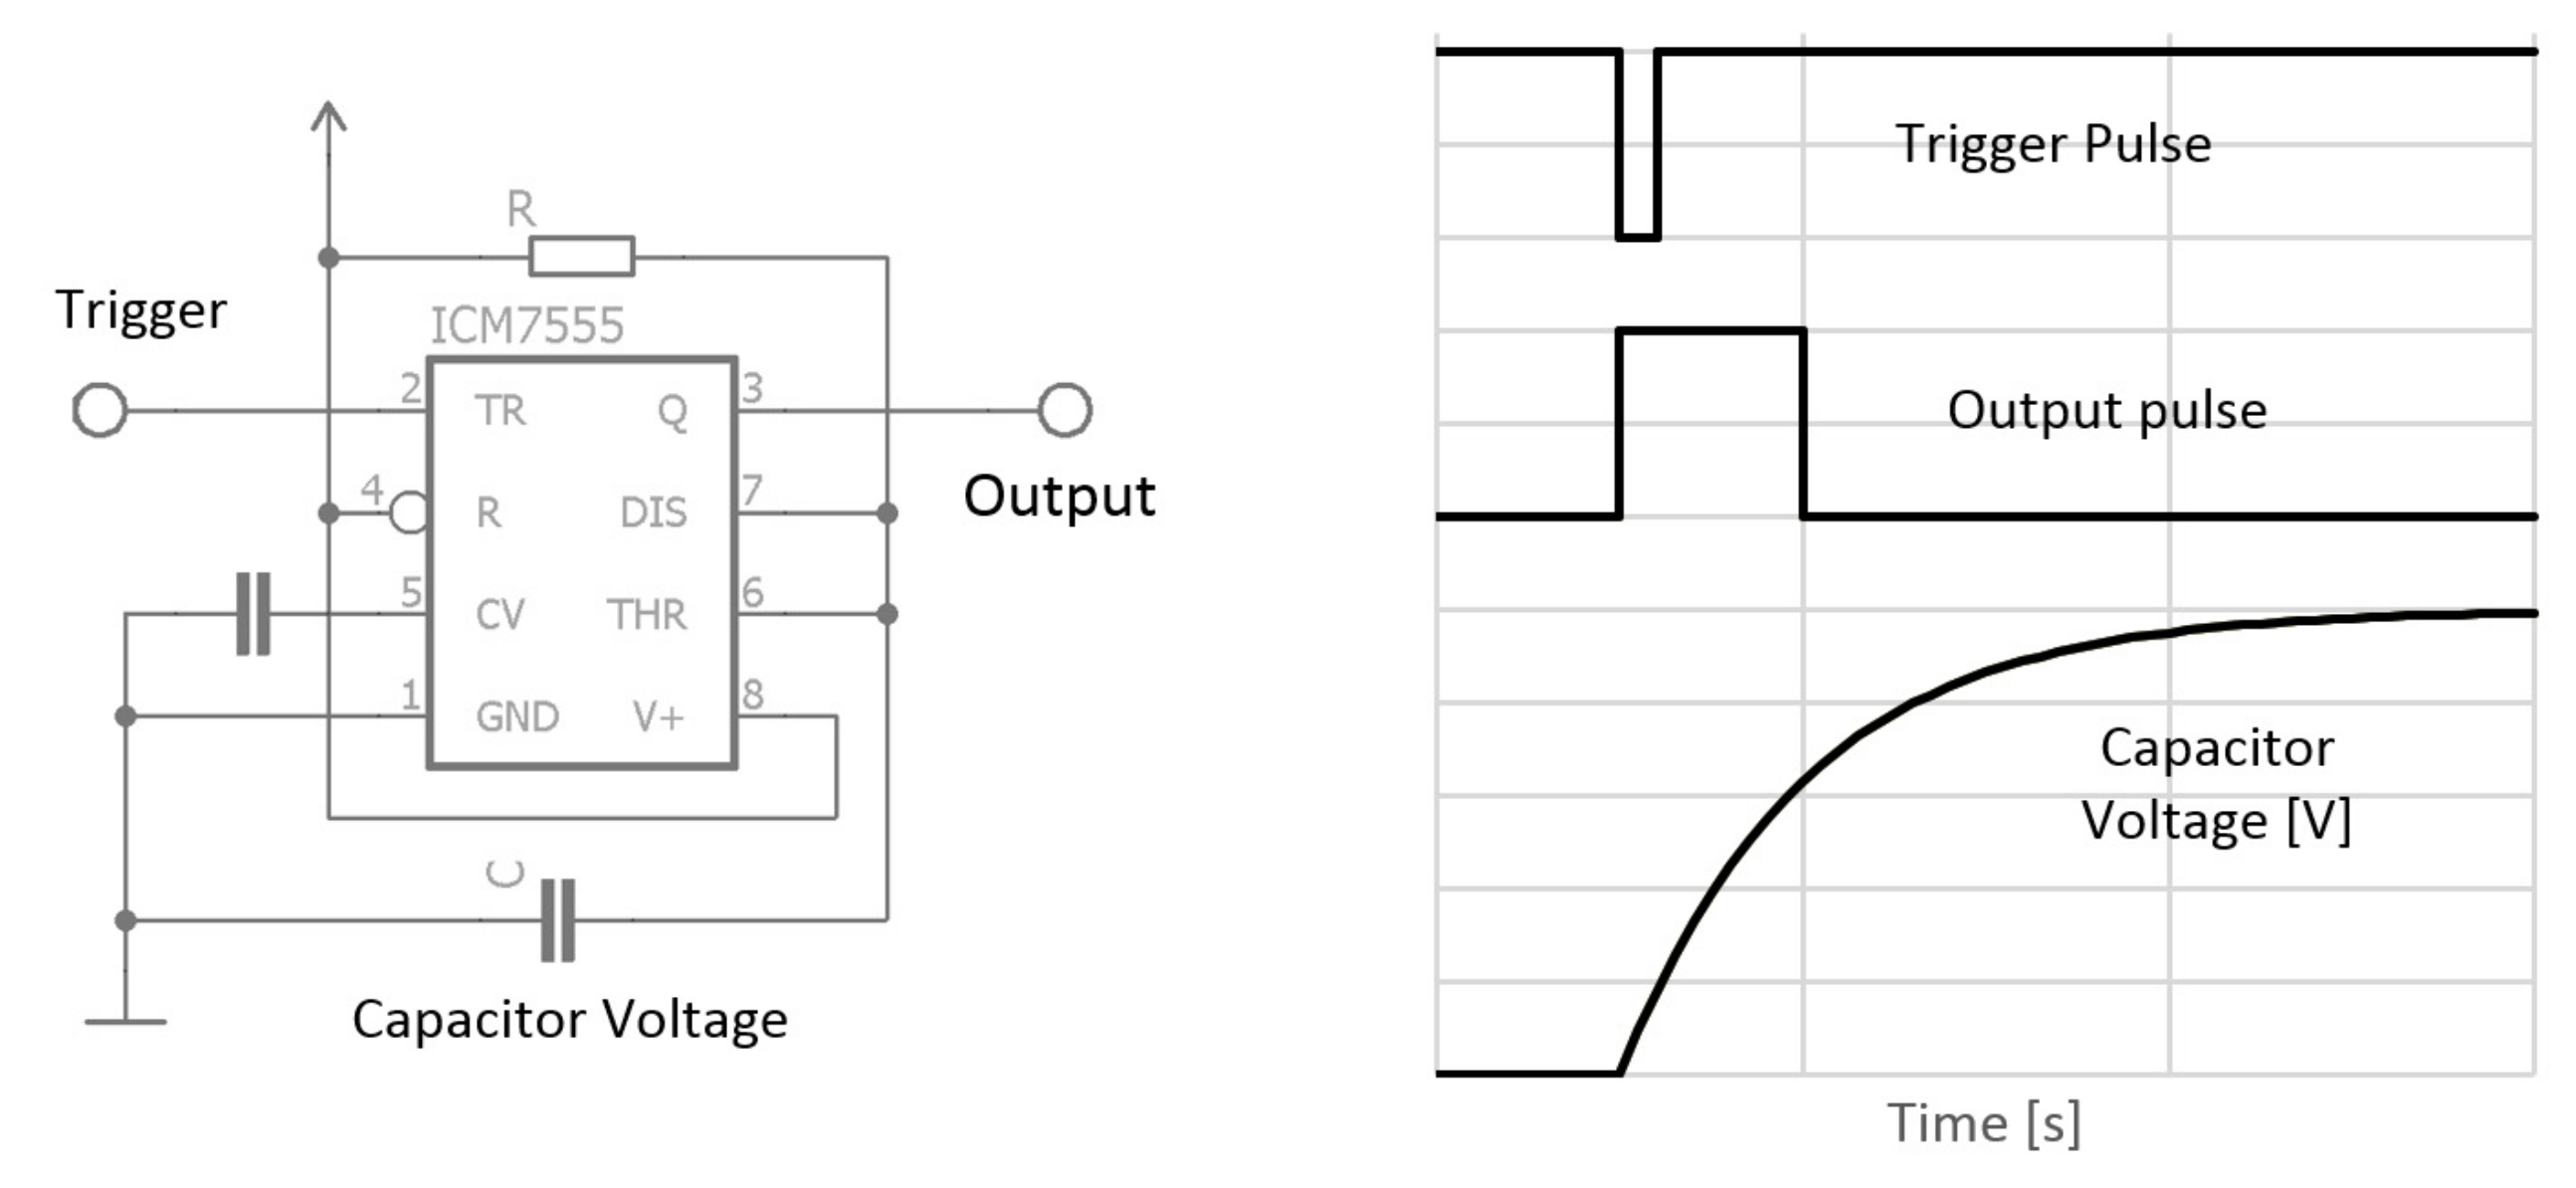
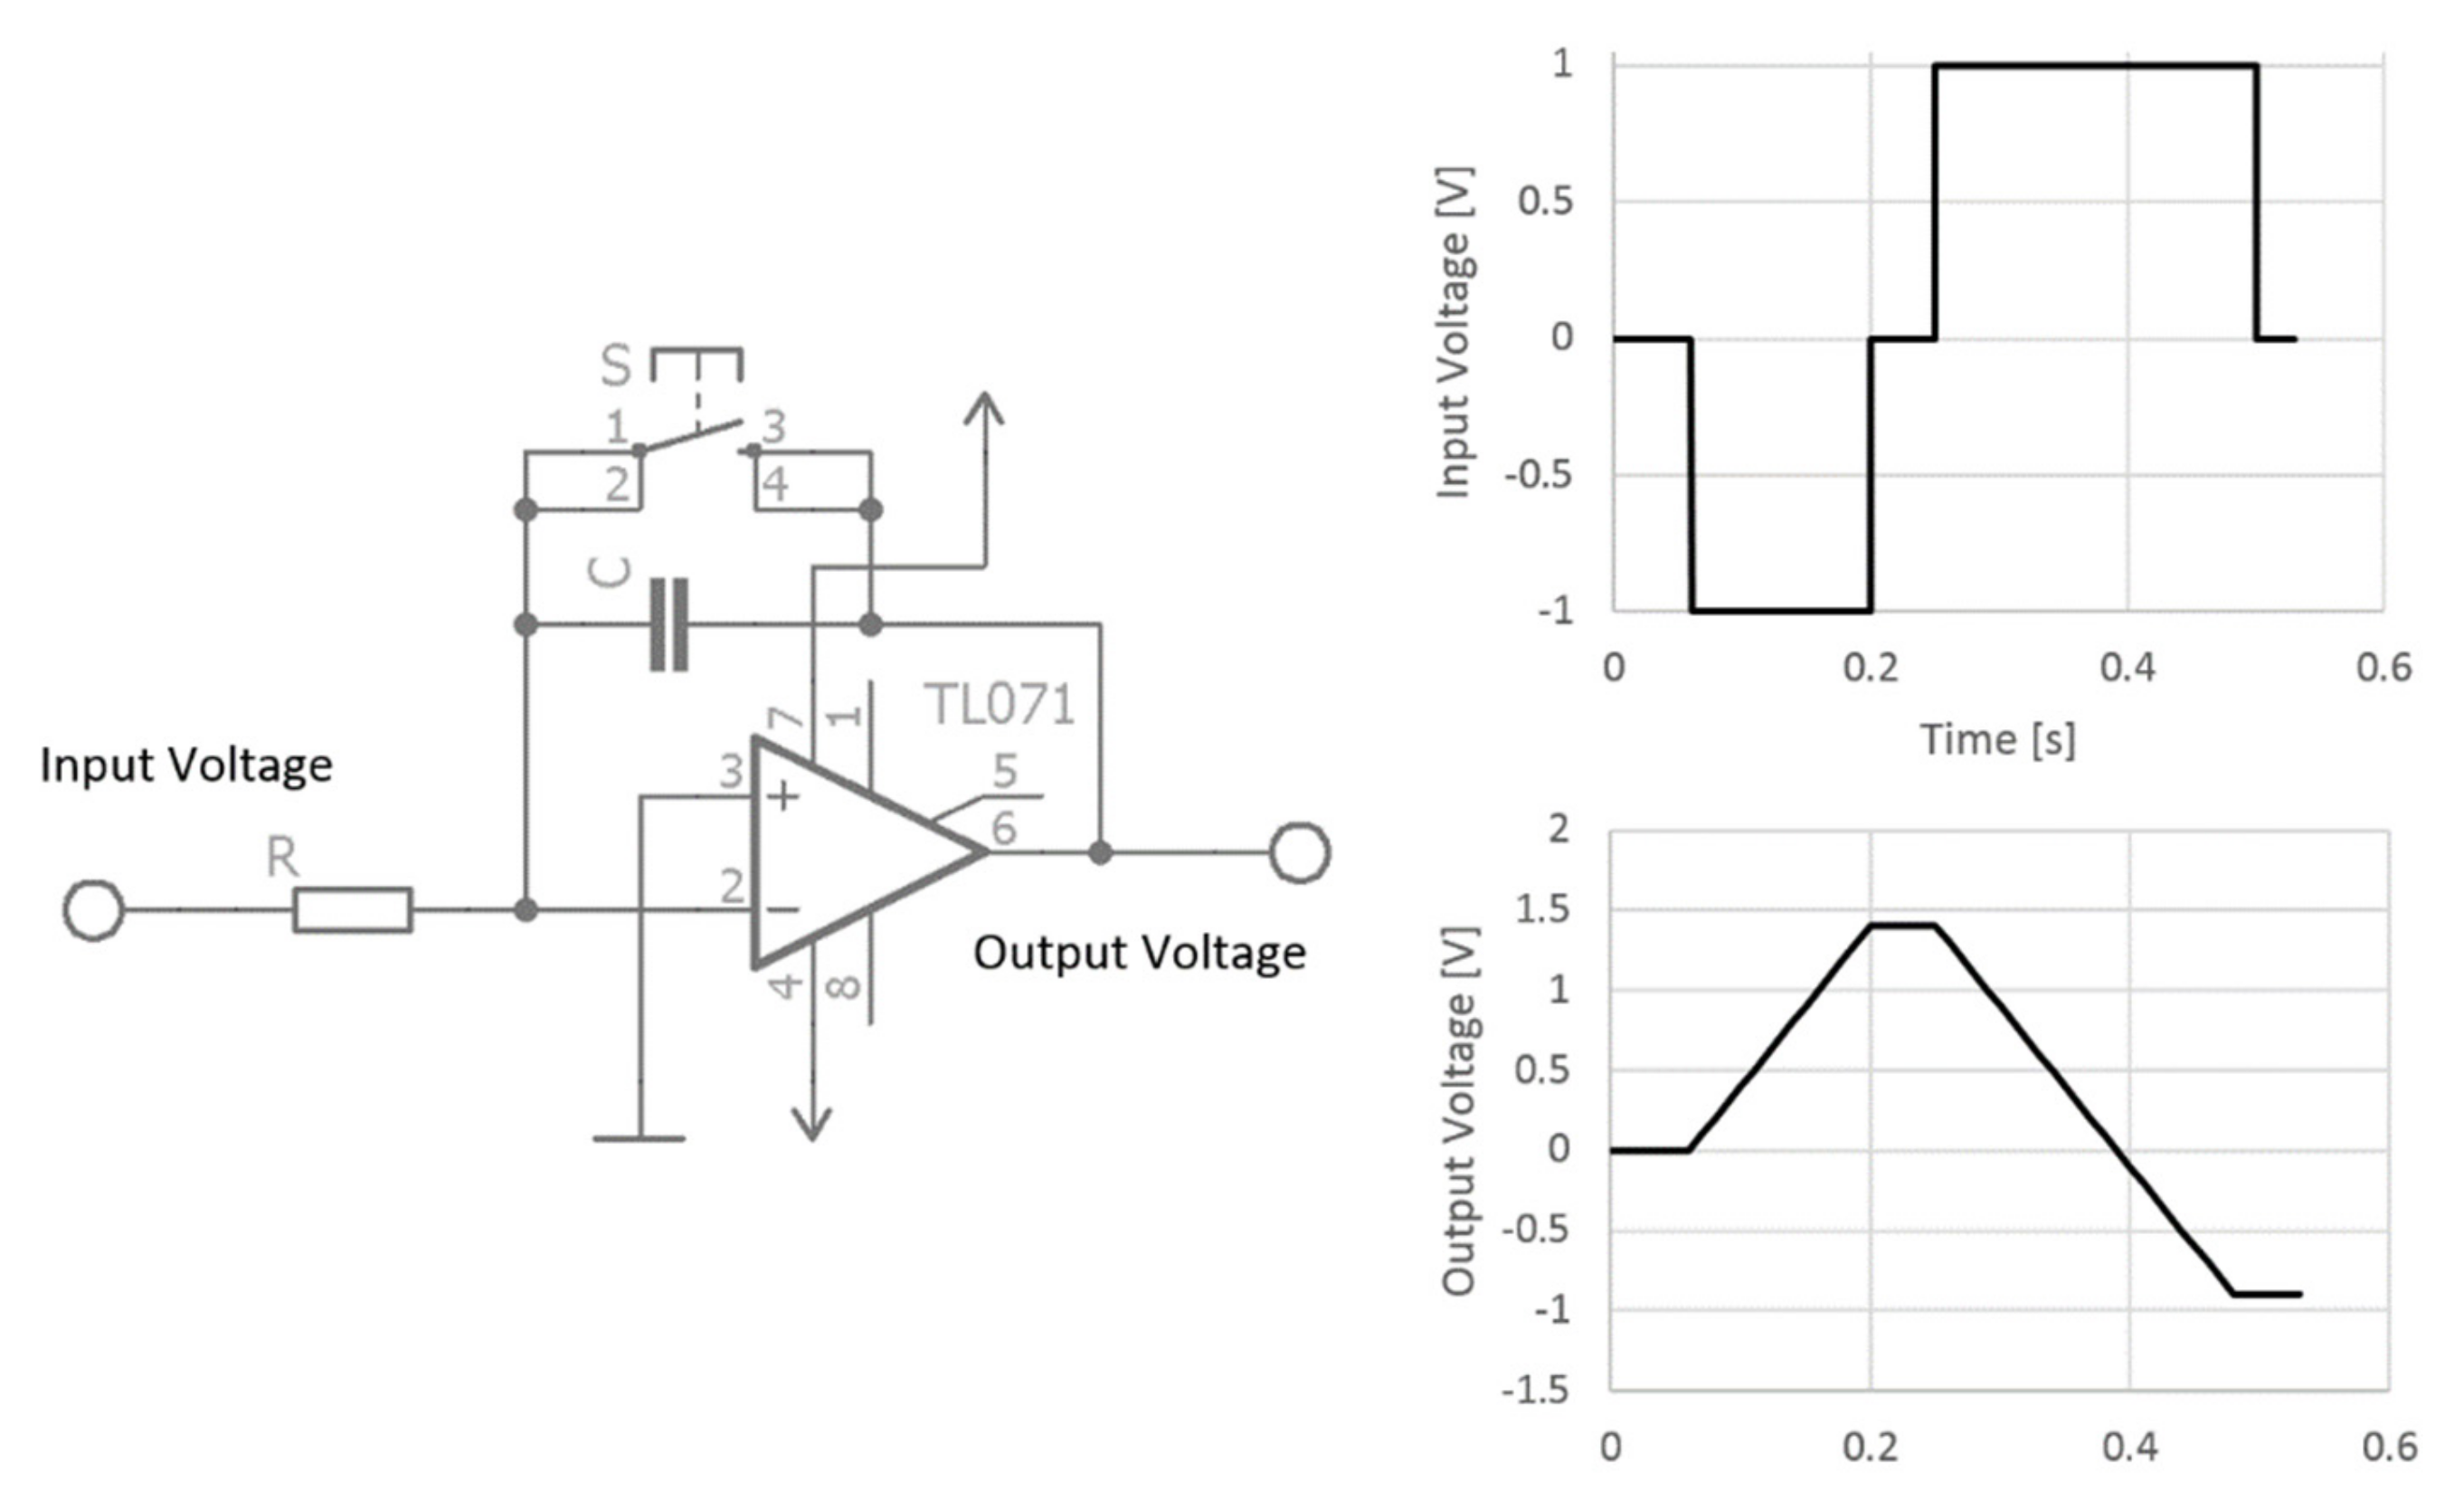
Figure 1). The sophisticated circuits used in commercial portable devices are often trade secrets of their producers and are not so easy to adapt for use in automatized systems. If the resistance measurement approach is used, there are two methods which are applicable: They are subjected to further analysis here. Both of the analyzed methods use the capacitor charge principle in a different way.
This study describes experimental work which aimed to obtain wood moisture monitoring data indirectly using two electrical methods. The main aims of this research work are first, to introduce the theoretical principles of both measurement methods used, and second, to evaluate their applicability and finally to verify them based on the experimental results obtained. Both methods are applied to samples made of spruce wood. The experimental results were evaluated via a statistical approach based on Bland-Altman plots. Originally, the Bland-Altman procedure [
23] was used in medicine to compare two clinical measurements that each produce some error in the data they measure [
24]. Bland-Altman plots are now extensively used to evaluate the agreement between two different instruments or two measurement techniques. They allow the identification of any systematic difference between measurements, or possible outliers. The results of this statistical analysis method determine the applicability of both, monitoring methods and the overall consistency between them. The statistical analysis also identifies the moisture content range for which the methods should obtain acceptable results if properly applied.
3. Materials and Methods
An experimental investigation was carried out using the two abovementioned electrical resistance-based methods, and the measurement results were statistically evaluated. In the initial part of this research, the spruce wood samples were prepared, and test circuits were developed for their calibration using resistor fields. Then, the samples were conditioned, measured, and weighed on a continuous basis over three months. Finally, the obtained data were analyzed and statistically evaluated. Through this approach, a complex characterization of resistance could be comprehensively obtained from the measurements to verify the applicability of both methods used. All of the information on time-dependent moisture parameters measured from the samples was expected to show a clear picture of the evolution of moisture content can be provided if these test circuits are integrated within wood-based material or a real-world structure.
3.1. Sample Preparation Procedure
Three samples were prepared in the form of blocks with a cross section of 47.0 × 27.5 mm and a length of 90.0 mm (
Figure 7). They were made of planed spruce wood, dried by electric oven at 105 °C and drilled with diameter 3 mm with deep 20 mm (
Figure 7c).
3.2. Circuit Setup and Calibration Procedure
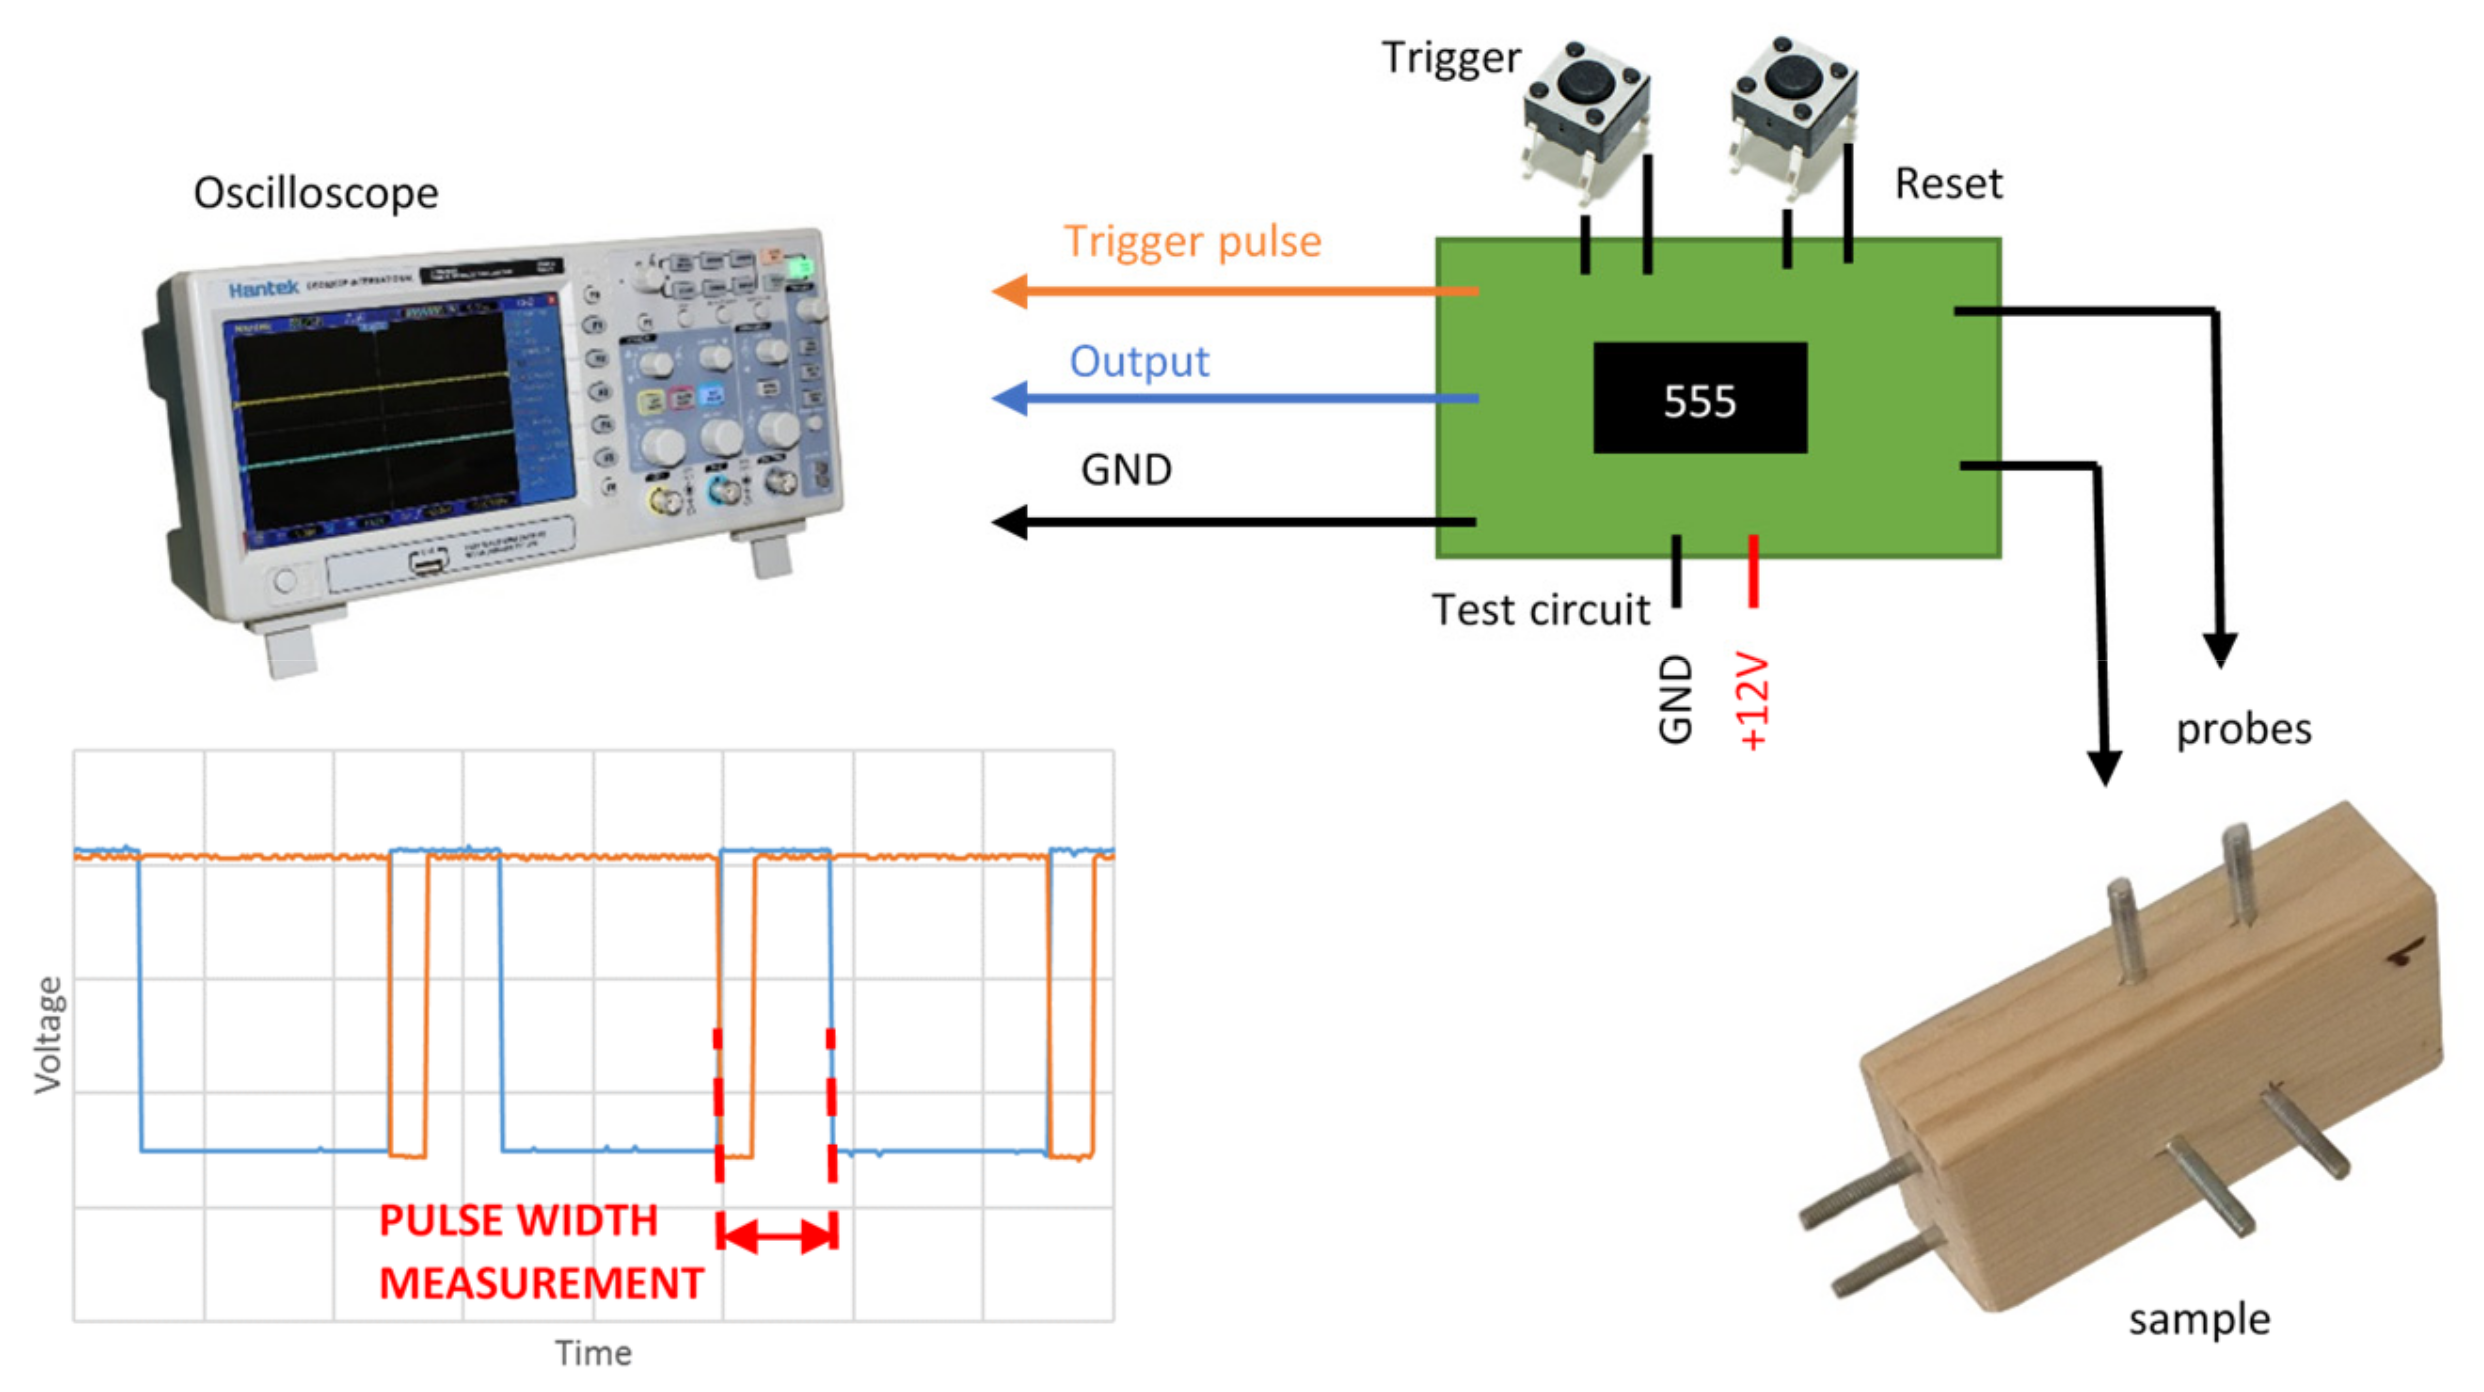
Test circuits were built on test printed circuit boards (PCBs) with through hole technology (THT) and surface-mount device (SMD) electronic parts. The trigger pulses for measurements were initialized by push buttons. The voltage response of the trigger and the output of the circuits were measured by a digital oscilloscope with a 25 MHz bandwidth. The RC circuit with a 555 timer chip used a 12 V single power supply, while the integrating circuit had a dual power supply with −12 V and +12 V rails. A polypropylene capacitor was chosen with the value 1 nF.
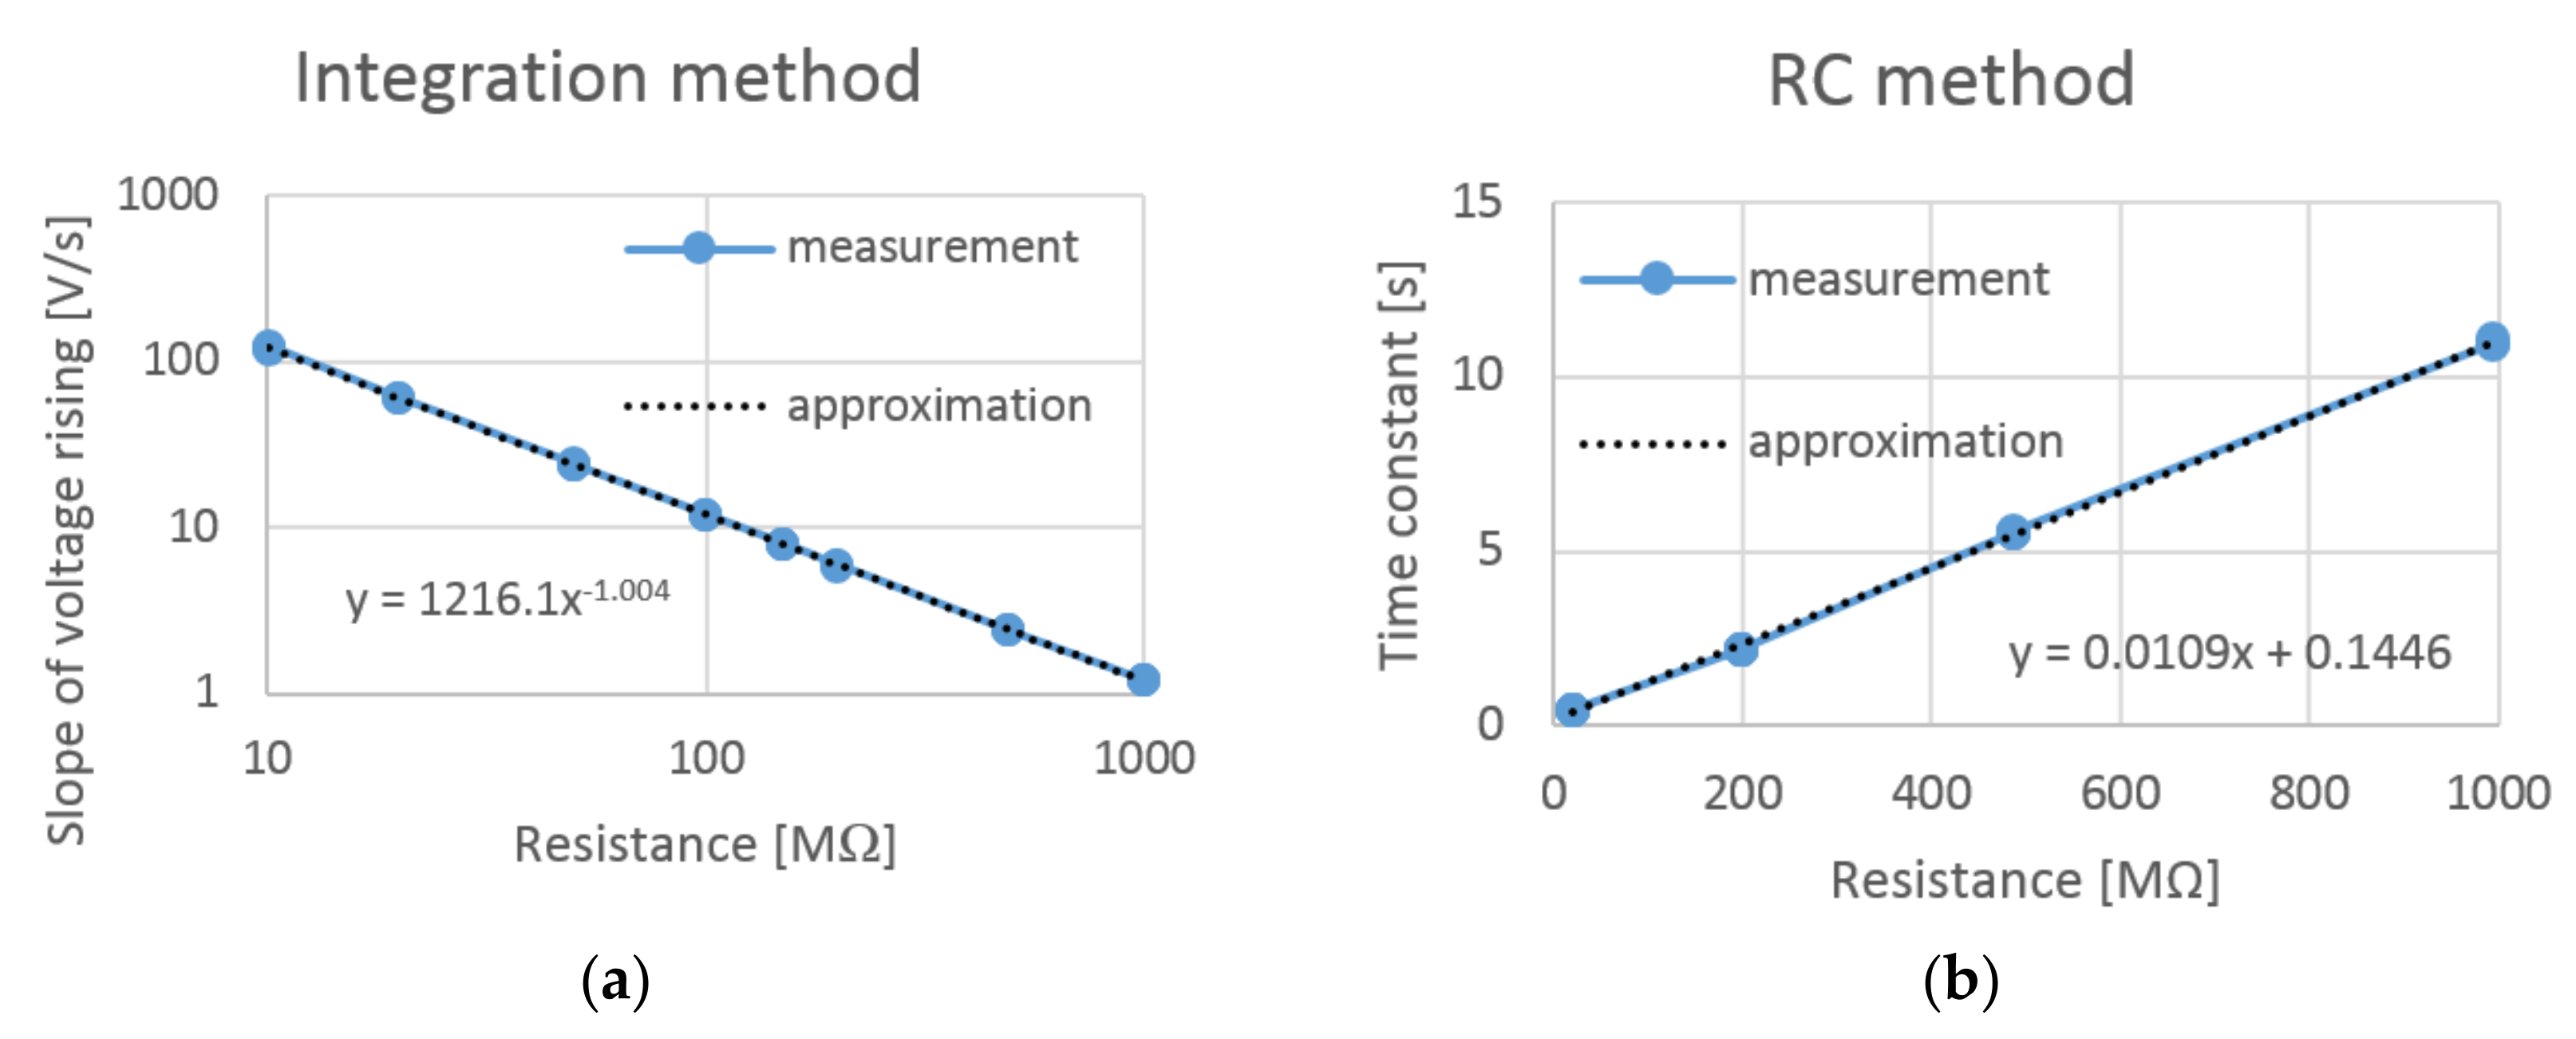
Both circuits were calibrated with two resistor fields. The first test field consisted of 15 resistors with 10 MΩ resistance, and the second test field had 50 resistors with 20 MΩ resistance. Each resistor was measured separately with two digital Ohmmeters and the results were averaged. The total resistance of the first field was set to 148.87 MΩ with a maximum error of 1.5 MΩ, and 993.4 MΩ with a maximum error of 9.9 MΩ. Several combinations of resistors were tested by both experimental circuits. The proportional constants of the circuits were identified according to the obtained data using statistical analysis (
Figure 8).
3.3. Sample Conditioning and Measurement Procedure
The samples were conditioned in a desiccator above a solution of salt in accordance with technical standard EN 12751. Sodium chloride and potassium chloride were used in desiccator. Relative humidity at laboratory temperature (21 °C) reached approximately 76% with the first solution and about 86% with the second. The environment in the desiccator was monitored by a temperature and relative humidity probe (
Figure 7b). The resistance and weight of the samples were measured at specified intervals by the circuits and a laboratory balance with a resolution of 0.01 g and an accuracy of 0.05 g. Each measurement was taken three times for each electrode location and the results were averaged. The whole conditioning period lasted for roughly three months.
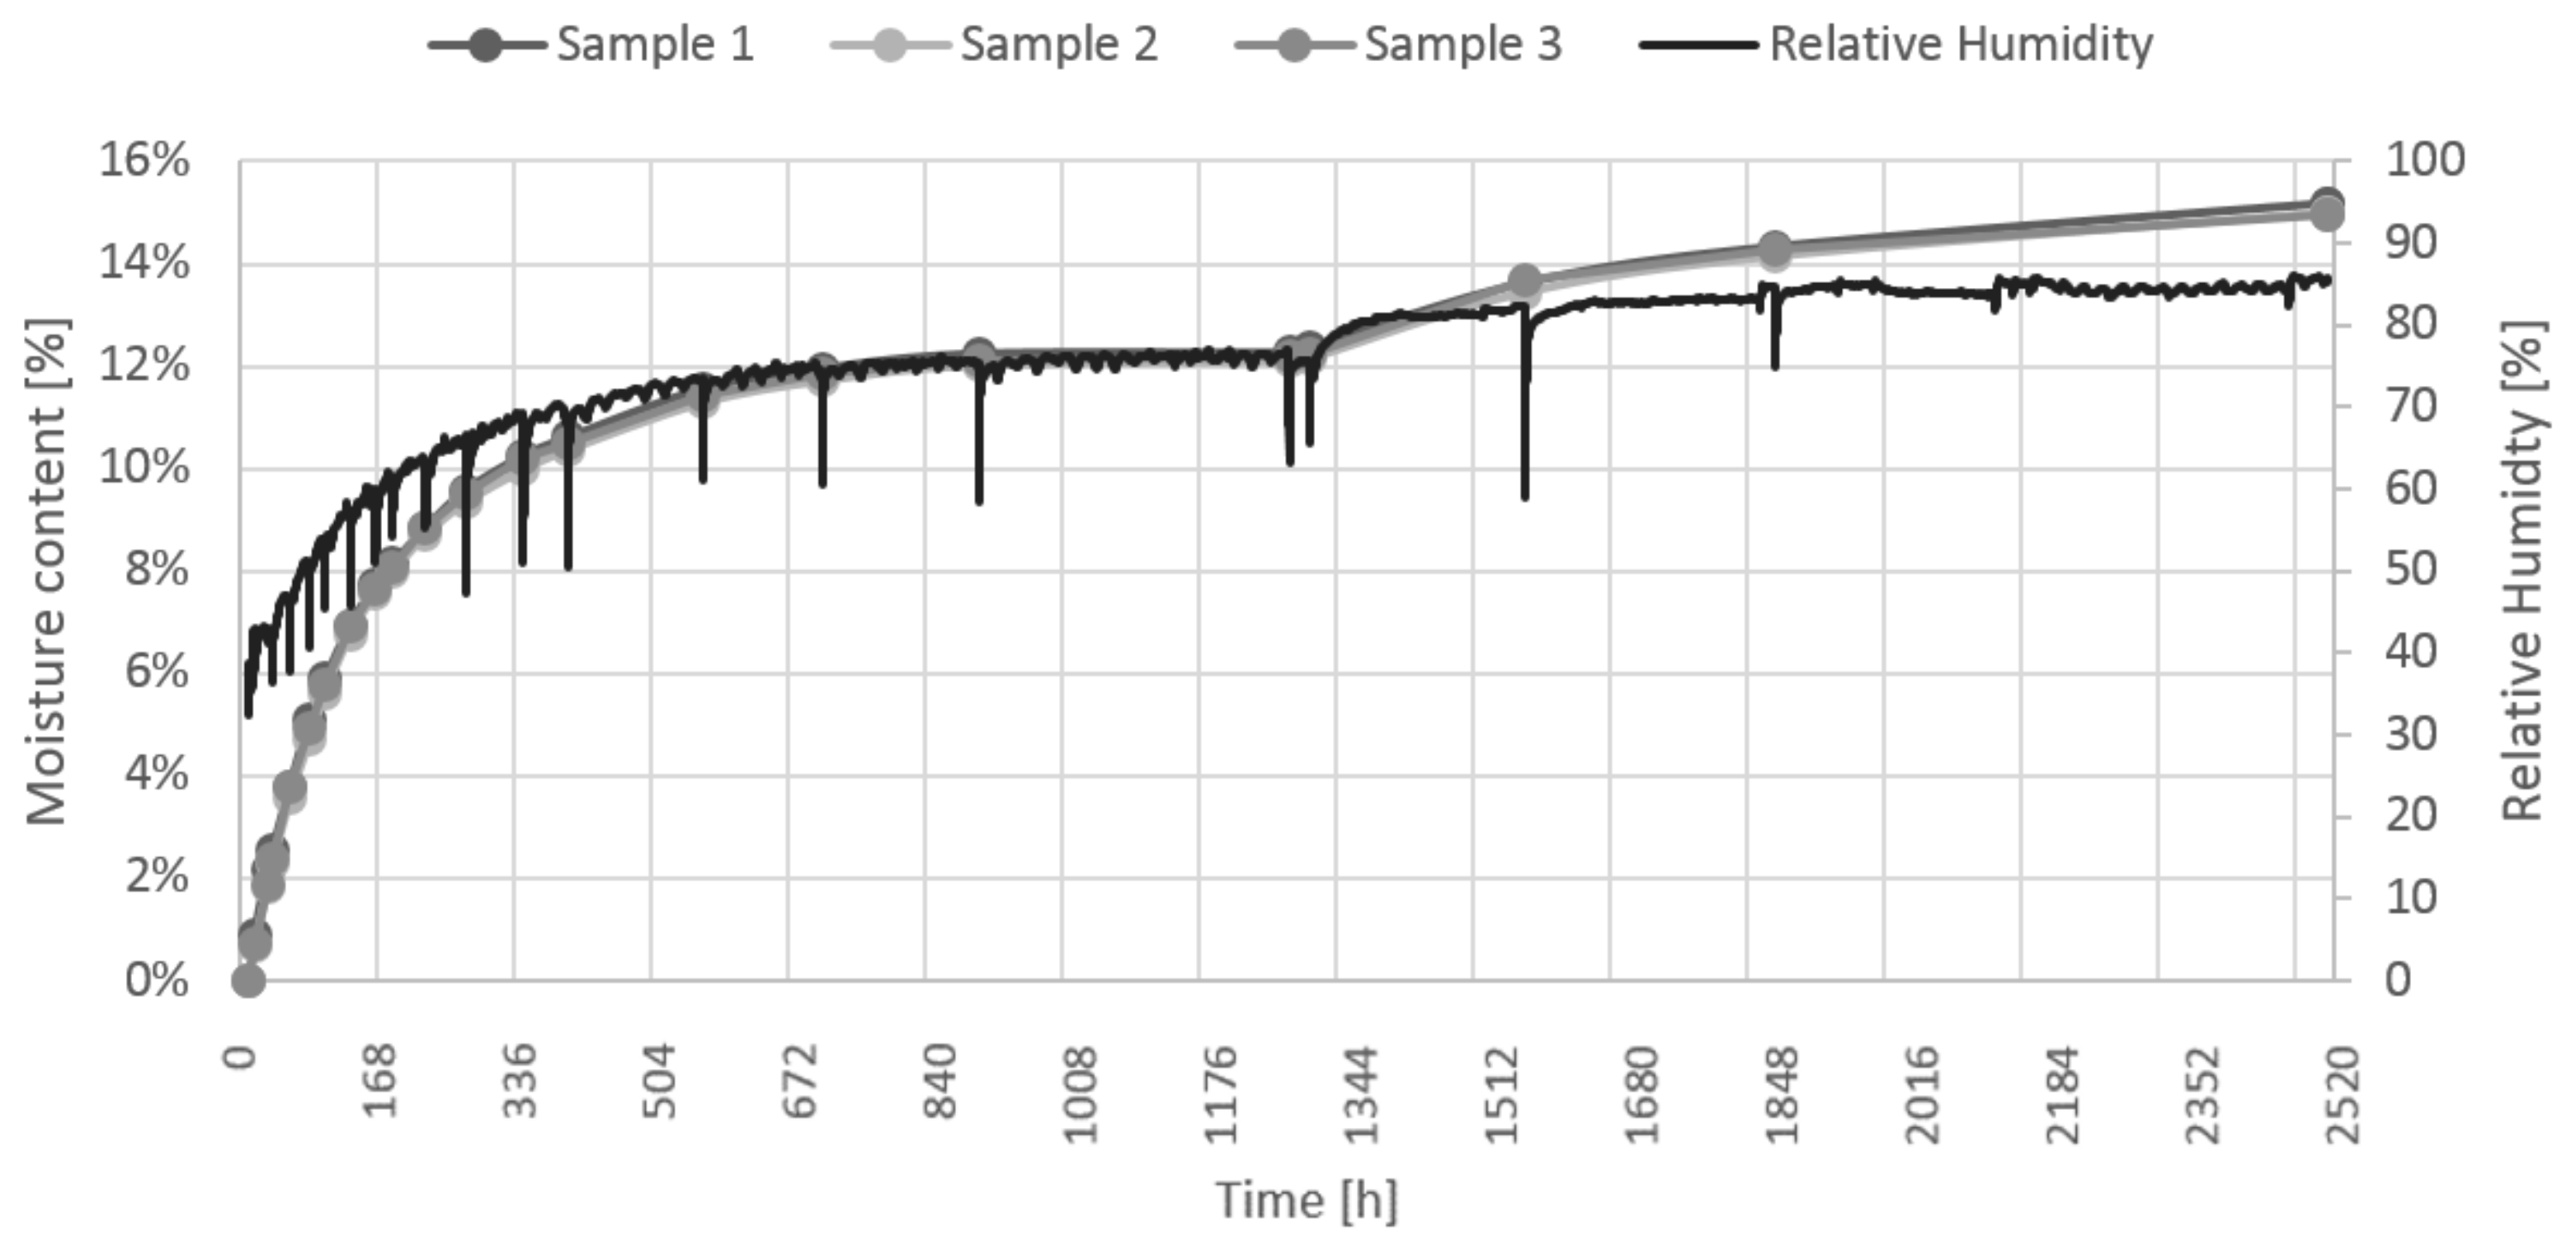
The evolution of sample moisture content was identified by weighing, and the relative humidity in the desiccator was measured (
Figure 9). Dry samples were placed into desiccator with solution of sodium chloride for first 1300 h. A logarithmic fast increase of moisture content at the beginning of conditioning can be identified, later continuing more slowly until finally resulting in its equilibrium. In the next step, after 200 h of equilibrium conditions, the samples were placed into another desiccator with higher partial pressure of water vapor. The vapor pressure slowly rises again to reach equilibrium, approaching 2500 h of measurement.
Resistance value of samples could be distorted by nonlinear distribution of moisture in depth form surface of a sample. The conditioning process takes a long time, however the expectation of quasi linear distribution of moisture in the sample is more realistic closer to states where equilibrium states are reached in desiccator.
3.4. Statistical Analysis
In the real world, every value measured at a given assembly or sensor often differs slightly, thanks to variations in the repeatability and accuracy of methods. The methods used in this research are no exception, and they can be expected to provide slightly varied results, sometimes with higher and sometimes with lower differences. The comparison of both methods requires statistical analysis, which was attempted via the application of the Bland-Altman procedure, which allows the identification of any systematic difference between measurements, as well as possible outliers. The mean difference is the estimated bias, and the standard deviation (SD) of the differences measures the random fluctuations around this mean. The 95% limits of agreement, i.e., ±1.96 SD of the difference, are computed to determine the most likely difference between two measurements conducted using two methods. If the differences within the ±1.96 SD are not physically important, the two methods may be used interchangeably. The 95% limits of agreement are often unreliable estimates of population parameters, especially for small sample sizes. For small sets of data, like those in the presented study, it is appropriate to use a two-sided 1 − (α/2) value of Student’s t-distribution with (n − 1) degree of freedom as a constant, which multiplies the standard deviation when calculating the limits of agreement.
6. Discussion
The main advantage of RC circuits is the simplicity of adapting timer circuits to emit digital signals. It is easier to integrate this kind of circuit in the sensors utilized by today’s digital electronic devices. The key limitation of such circuits is their long capacitor charge period at lower moisture contents. Sometimes, it may be necessary for a capacitor to charge for a relatively huge time; this would not be recorded by the controller, which evaluates the signal from the 555 timer chip at low moisture contents. The second problem is the resolution of charging time, which could be very small at higher moisture contents and, thus, could cause higher repeatability errors to affect measurements.
The integration method shows voltage changes, which allows the identification of lower moisture content much faster than an RC circuit. The main disadvantage of the integration method is the need for a symmetric power supply, as well as other circuits for the post-processing of analog signals. Post-processing circuits for analog signals are expensive and sensitive. The sensitivity of these circuits could lead to worse measurement repeatability and accuracy at lower moisture contents.
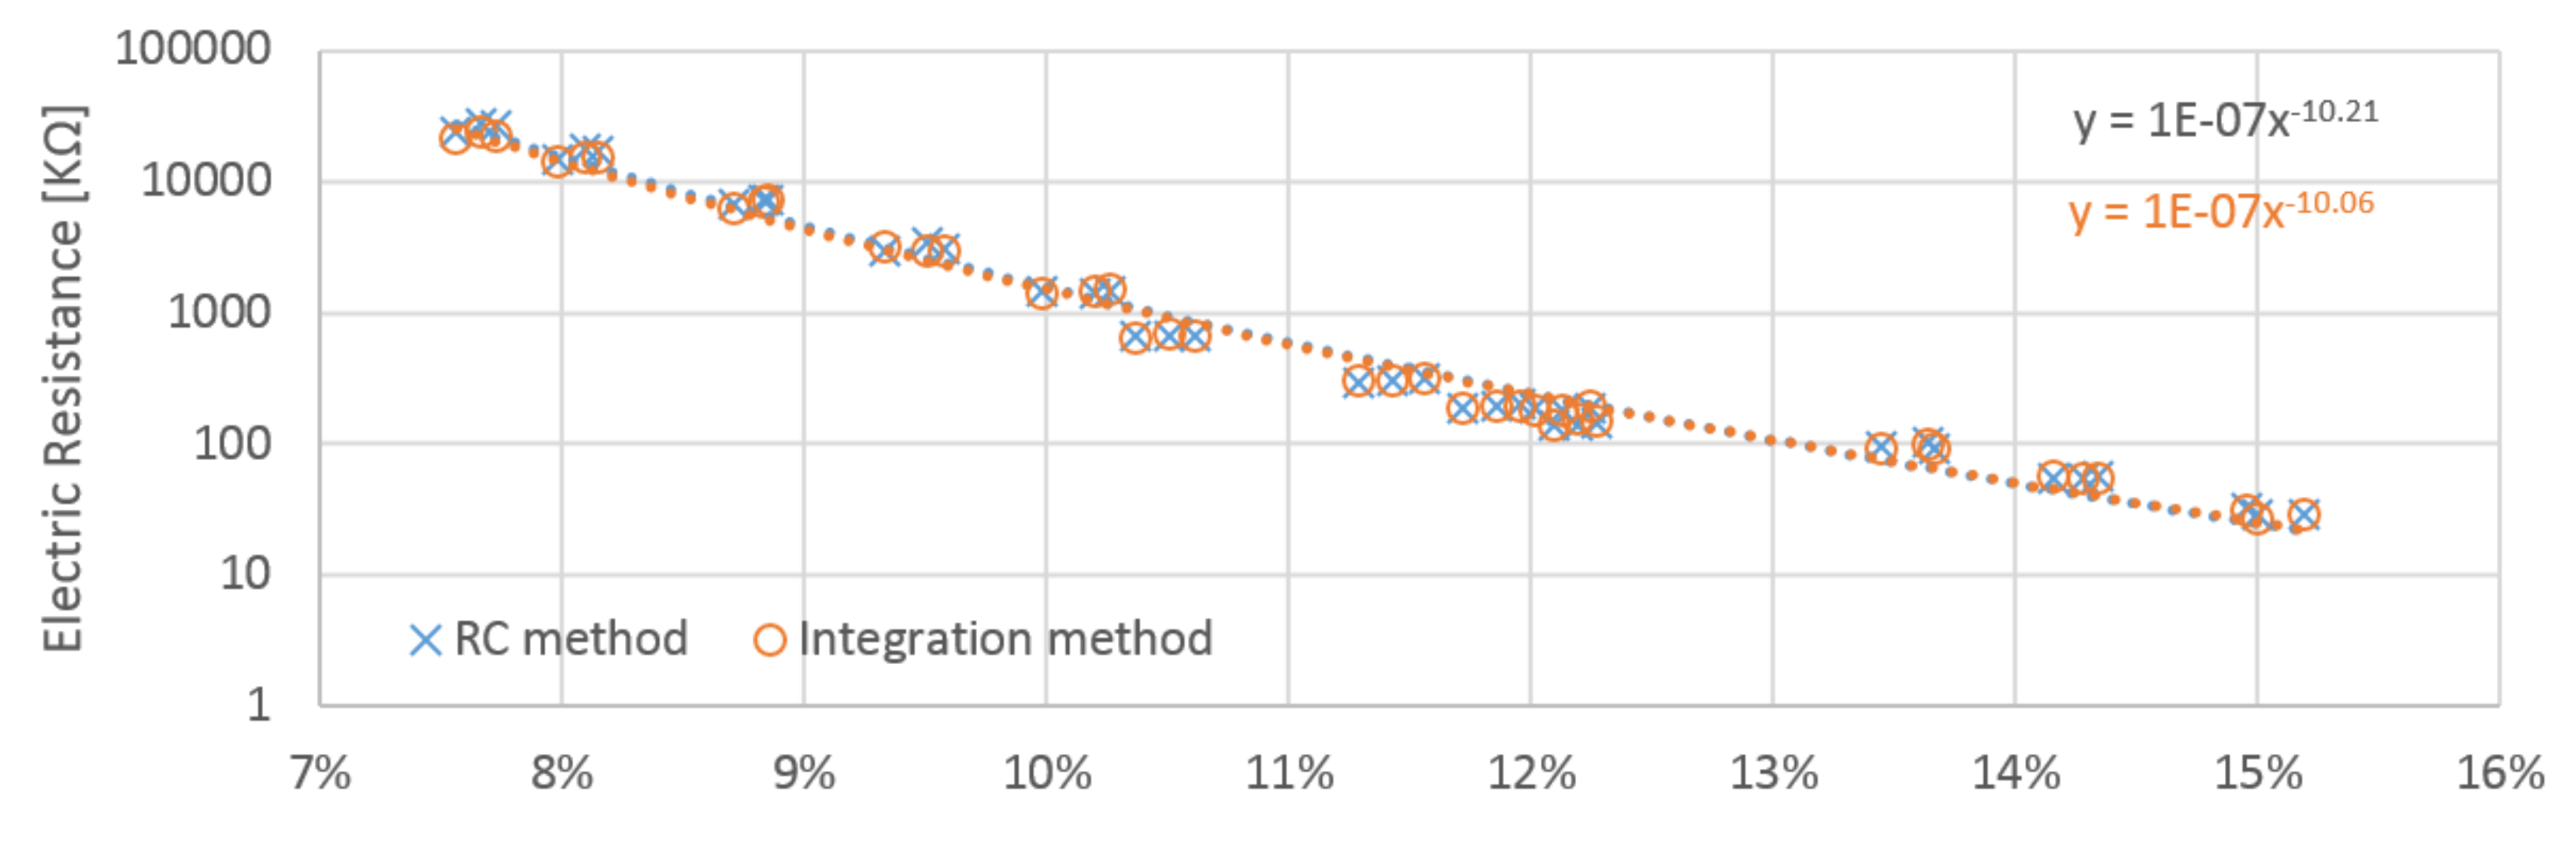
The range of differences between the two proposed methods is statistically important for small moisture contents of approximately below 8% (which correspond to high resistances), regardless of the fibers’ direction. At moisture contents under 8%, wood has very high resistance and these methods of measurement are affected by significant errors. Based on the results of the statistical analysis, it is recommended that the threshold moisture content for the use of the proposed methods be set at 8%. Both of the proposed methods show good agreement for a range of moisture contents above this threshold.
The threshold value of moisture content 8%, revealed by statistical analysis, is in line with findings of other authors. Papez et al. [
29] performed moisture measurement by local resistivity sensors with a measurement range of 7–30%. The calibration curves were developed by Fernandez-Golfin et al. [
30] for the estimation of ten hardwoods by means of electrical resistance measurement. All resistance measurements by Fernandez-Golfin et al. were taken by advanced laboratory tool AGILENT 4339B high resistance meter. They reported 8.0% as the lowest value of measurable moisture content.
The direct comparison with laboratory methods was not performed in this study. However, the uncertainty of the presented method can be deduced from comparison with other authors. Some of them, e.g., Fernandez-Golfin et al. [
30] and Moron et al. [
31], developed similar circuits and calibrated them with laboratory methods. Fernandez-Golfin et al. [
30] predicted the moisture content of wood with an error ±1.0%. They also revealed that the measuring direction has negligible influence (error of estimation <±0.5%) on moisture content estimates, below the moisture content of about 15%. Moron et al. [
31] compared results of moisture content measurement conducted by their capacitance meters with those based on the variation of electromagnetic transmittance of timber. They reported similar accuracy (below 1%) between both methods in measurement range 1 MΩ to 100 GΩ. Their results show how low power and low-cost circuits can be similar to high precision, cost, and size instruments.


