3.1. Preform Characterization
Table 1 summarizes the results of the characterization of the SiC
p/C preform.
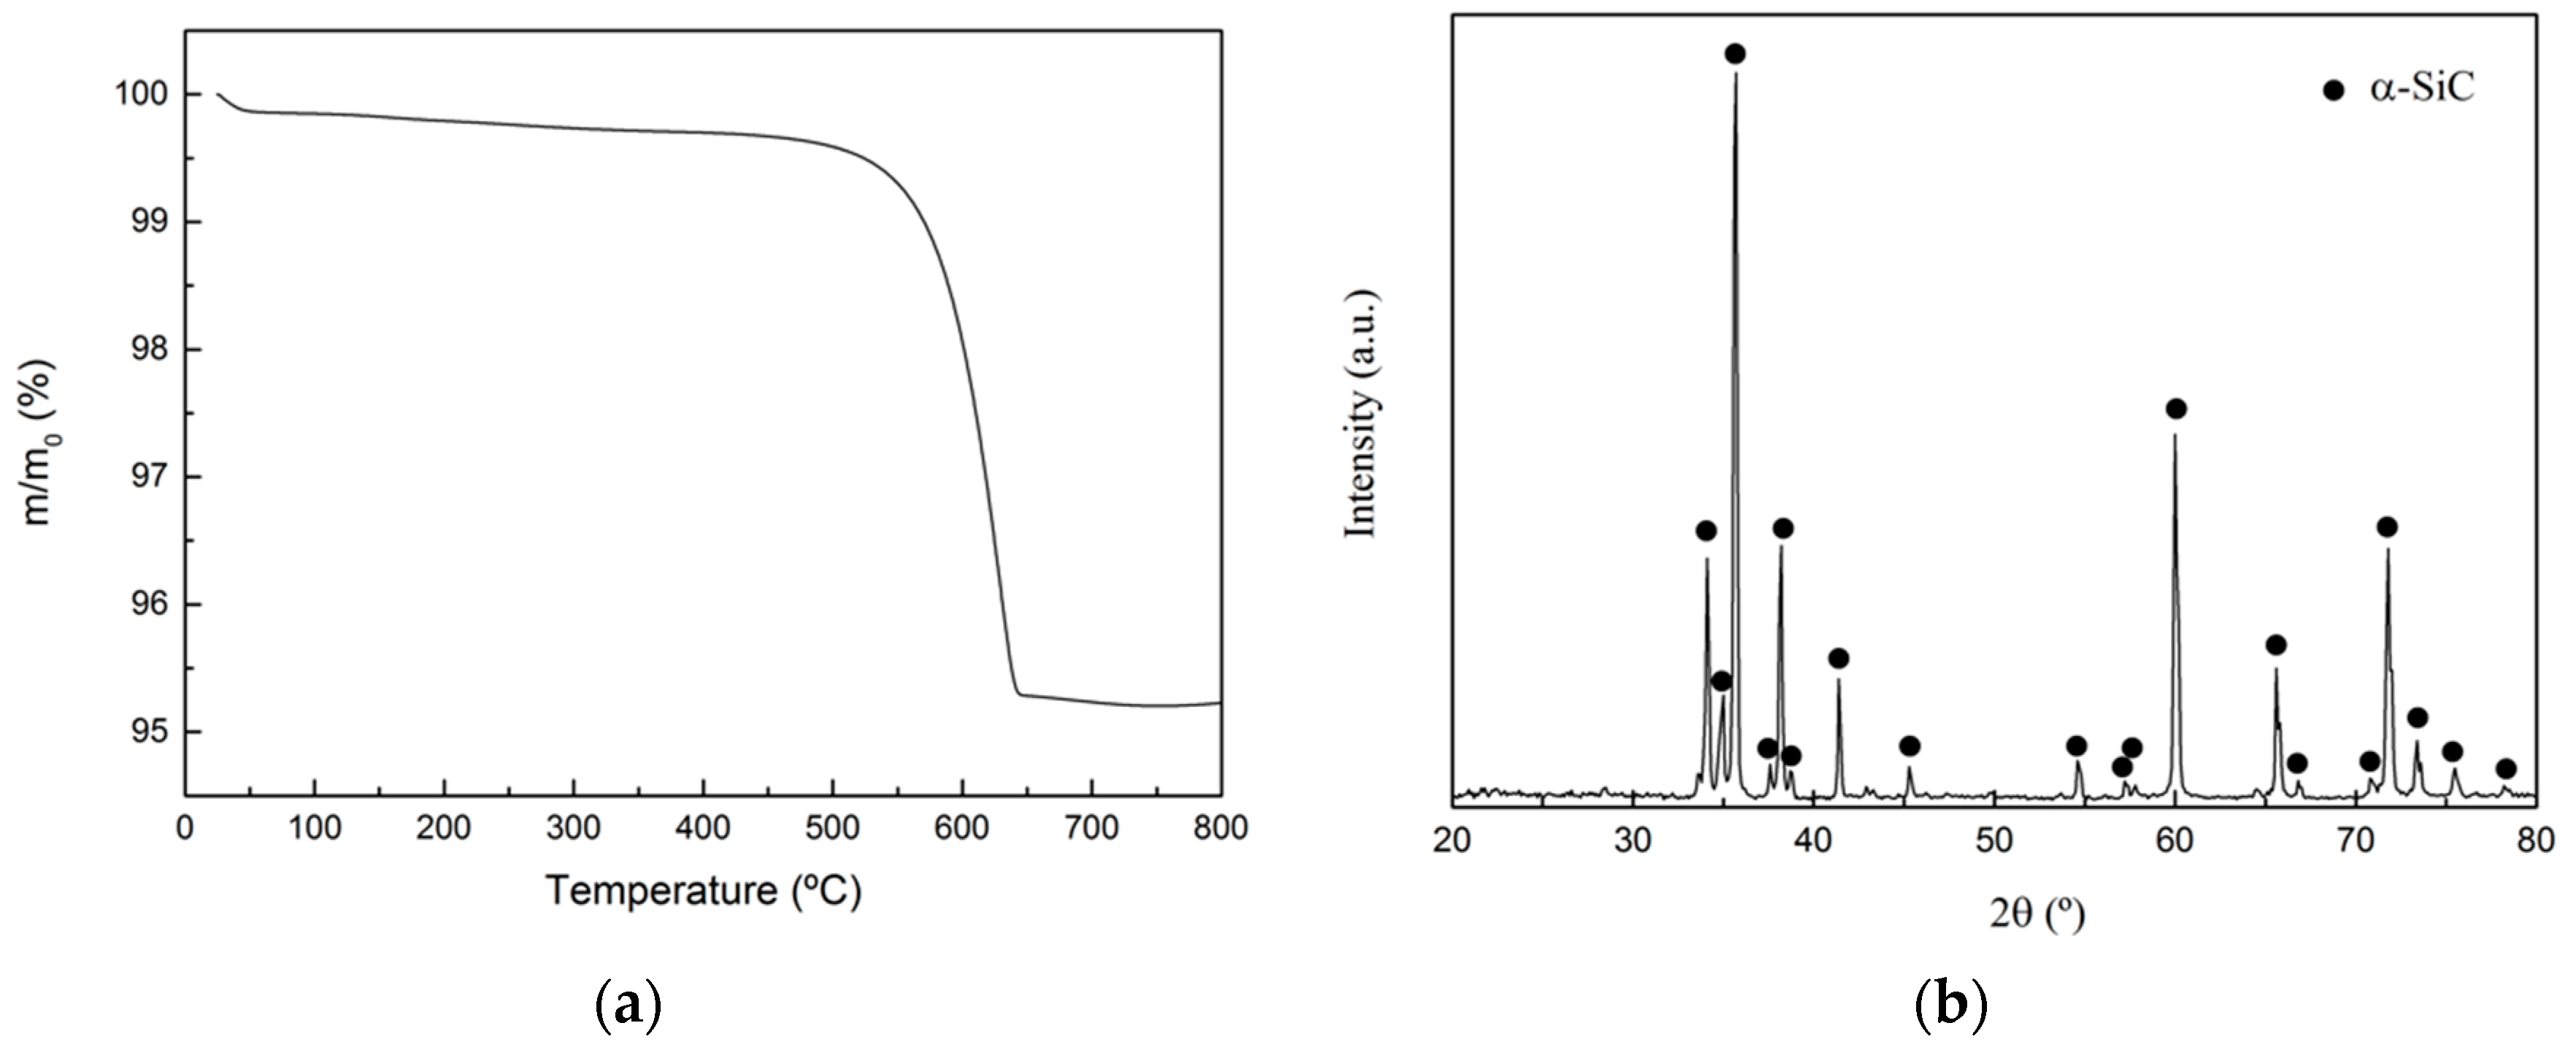
The composition was obtained by TGA in an oxidizing atmosphere (N
2:O
2 = 4:1) in the range 25–800 °C and it is 95.3 wt.% SiC and 4.7 wt.% C. The corresponding thermogram is shown in
Figure 1a where the first initial mass loss corresponds to moisture in the sample, and the mass loss at 600 °C corresponds to the combustion of the C phase. The remaining mass corresponds to SiC, which remains unaltered in this temperature range. XRD tests indicated that α-SiC is the only crystalline phase present in the preform (see
Figure 1b), exhibiting a mixture of the 4H and 6H polytypes.
The bulk density of the preform ranges from 2.10–2.20 g/cm3, while the He density is 3.10 g/cm3. Considering these values, the open porosity was calculated, yielding a value of around 30%.
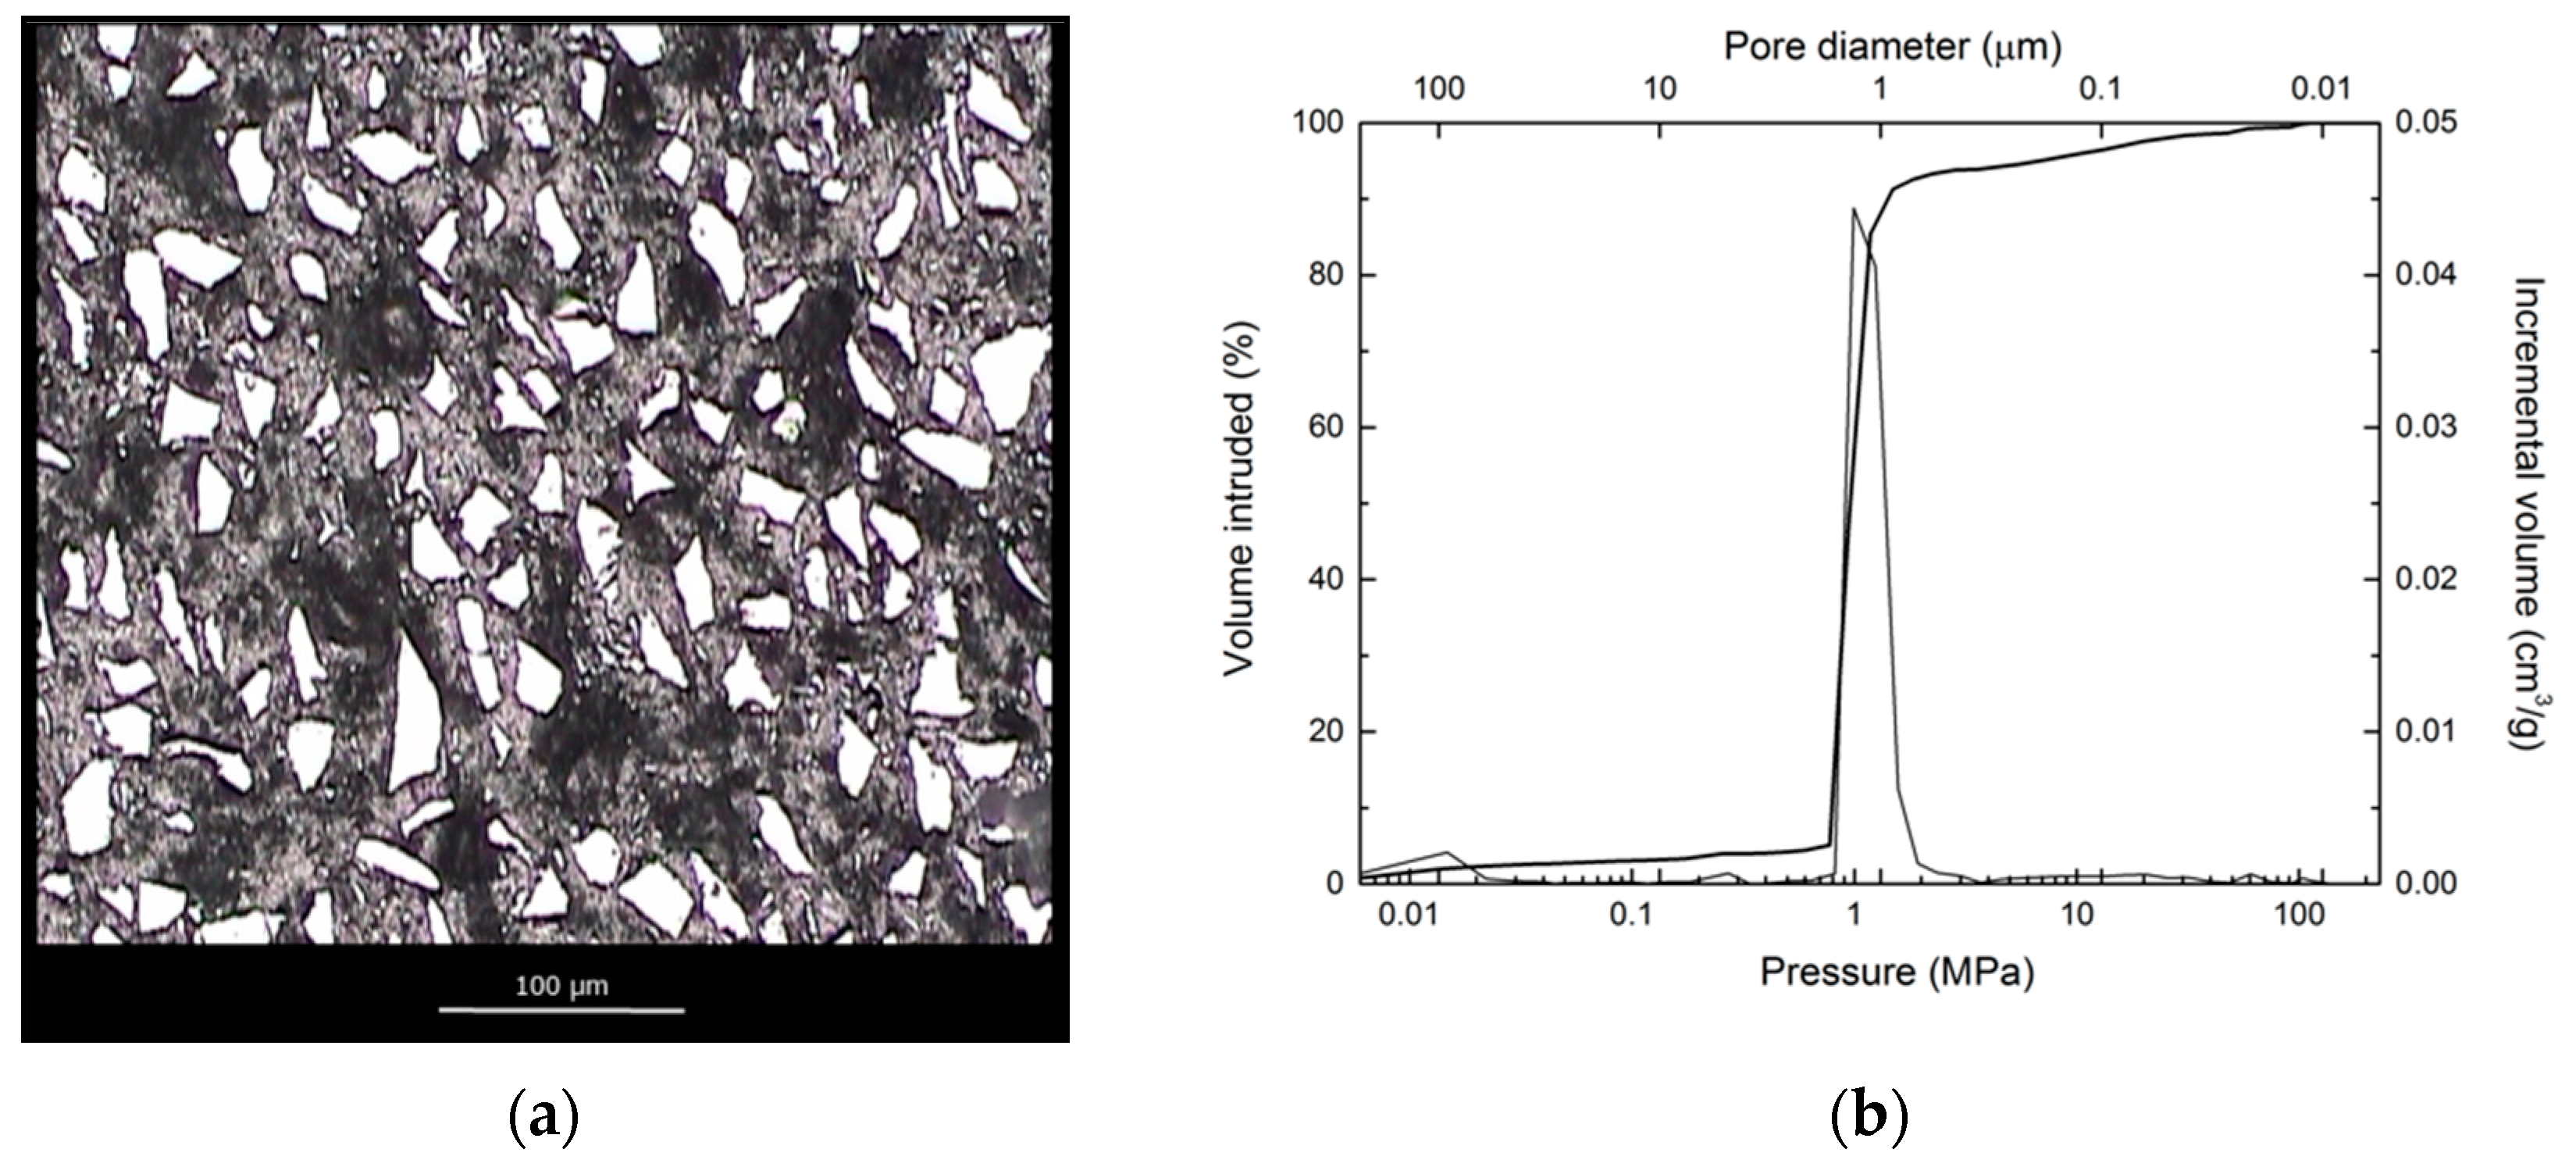
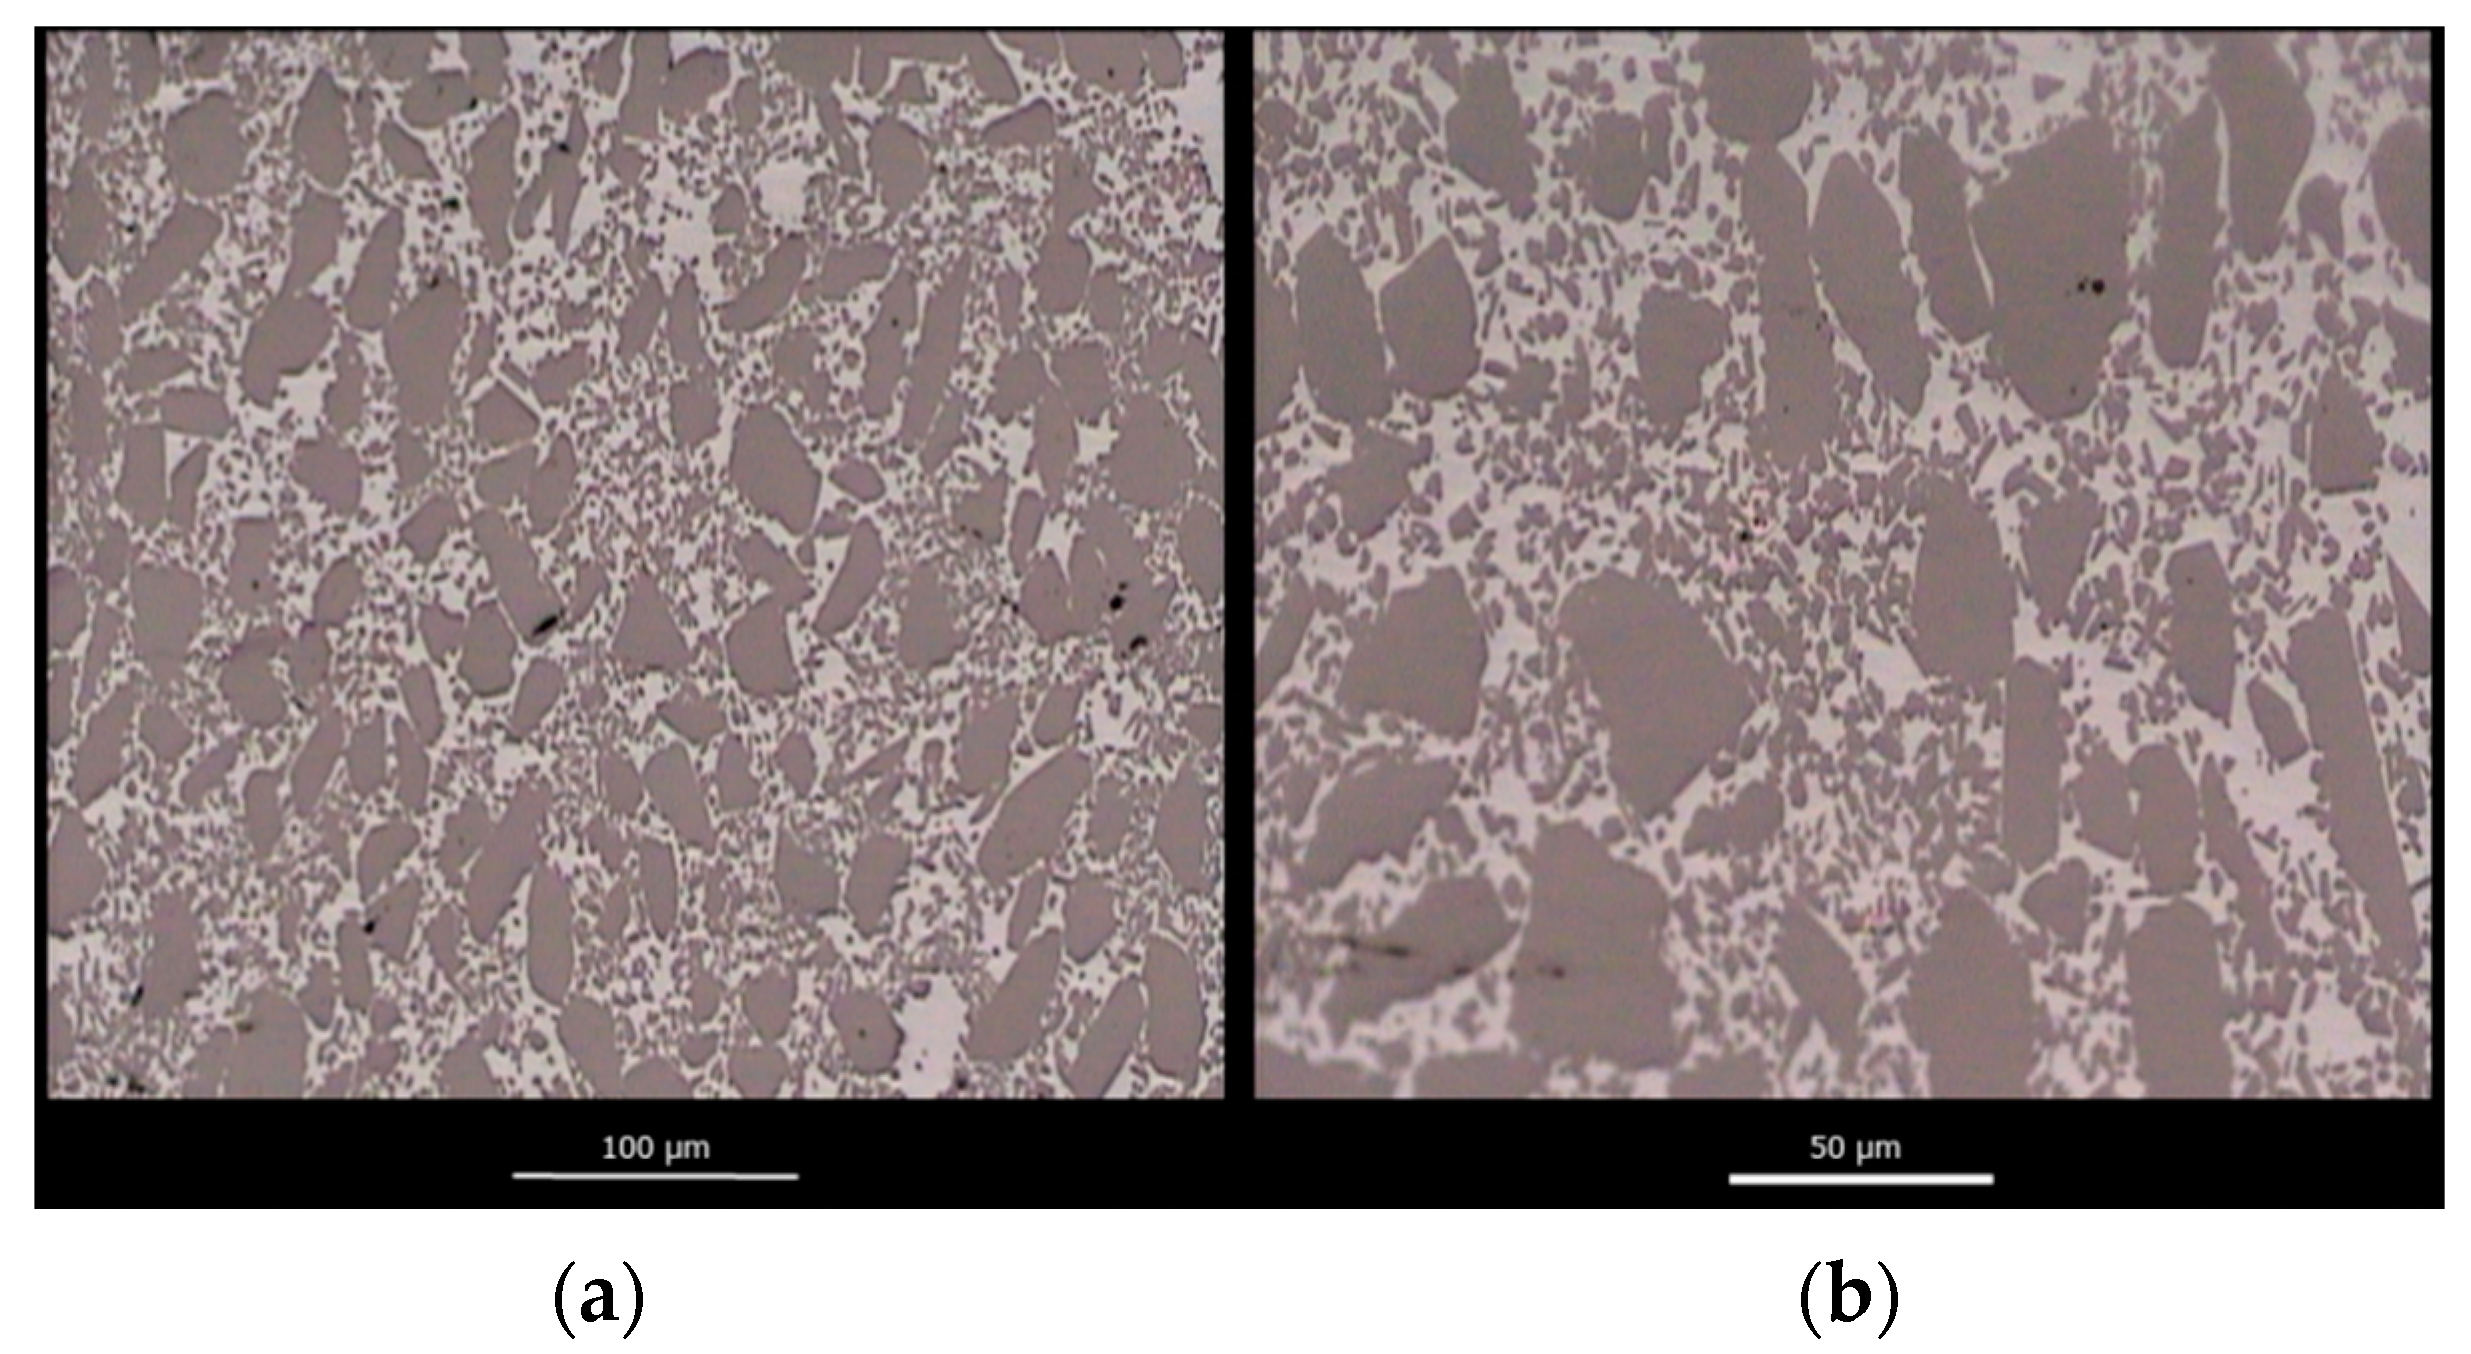
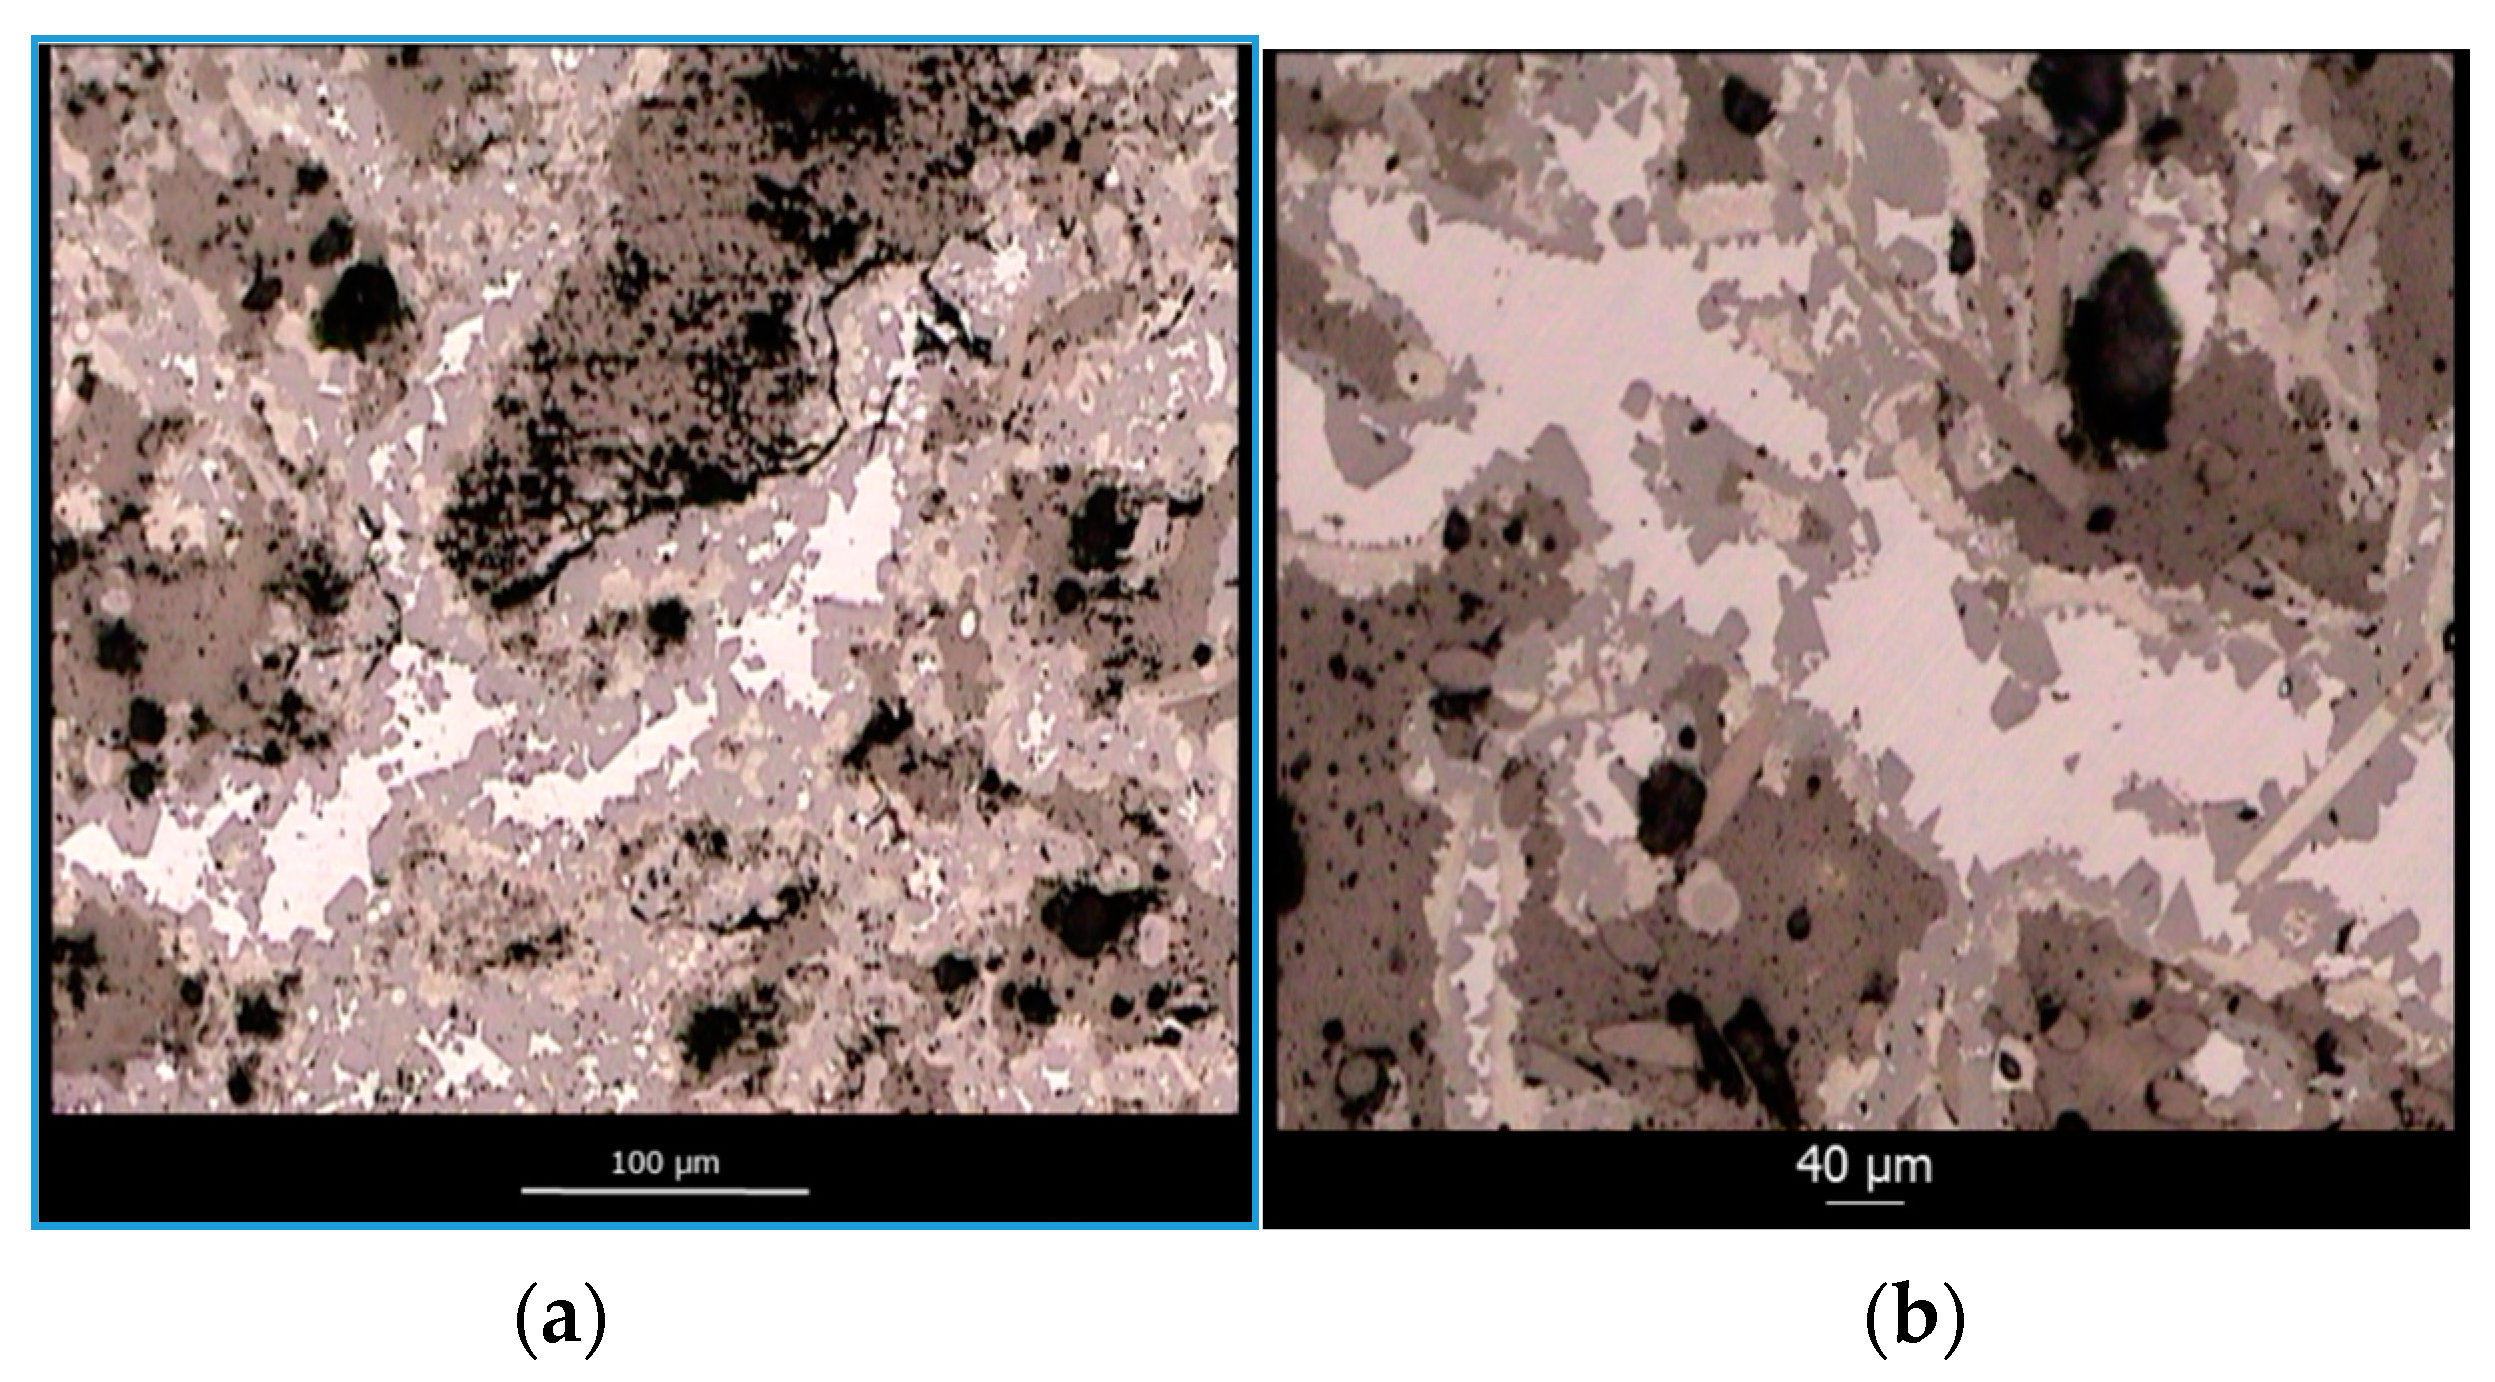
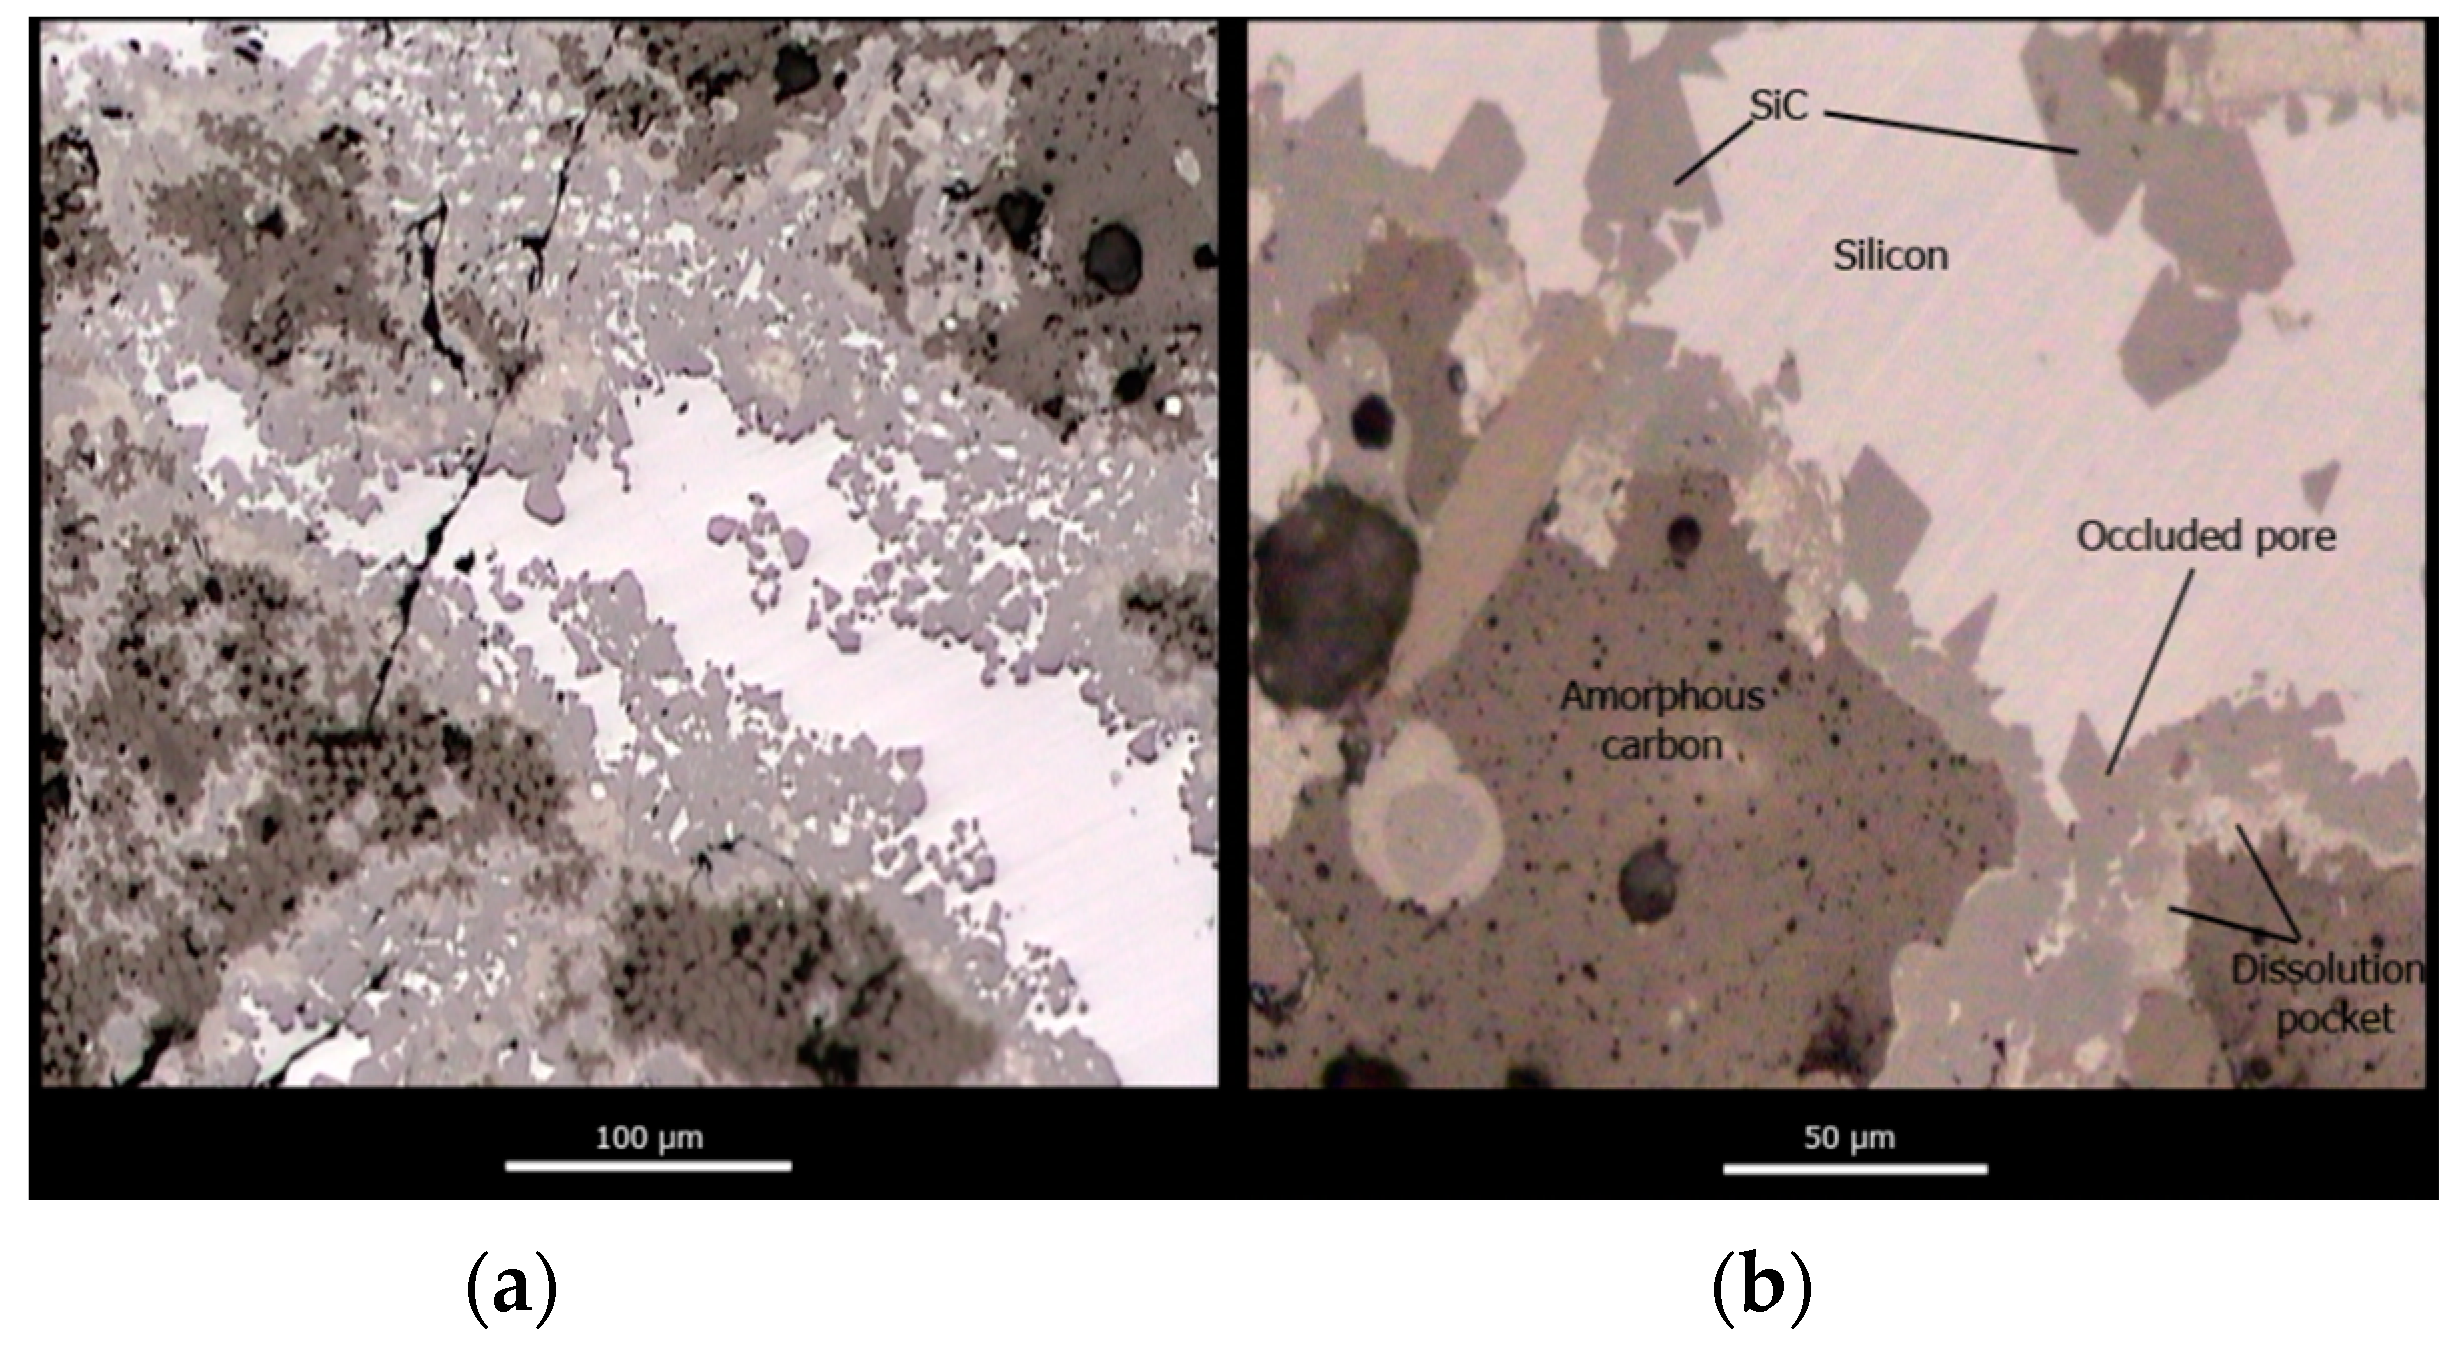
Figure 2a shows an optical microscope image of a polished cross-section of the preform, where the α-SiC phase is depicted in white, the C phase in grey and the porosity in black. A homogeneous distribution of the phases and the porosity is clearly observed.
Mercury porosimetry showed a narrow pore size distribution around a pore size of 1 micron (P = 1 MPa). The intrusion curve and the pore size distribution derived from it are shown in
Figure 2b.
Table 2 summarizes the results of the characterization of the C
f/C preform.
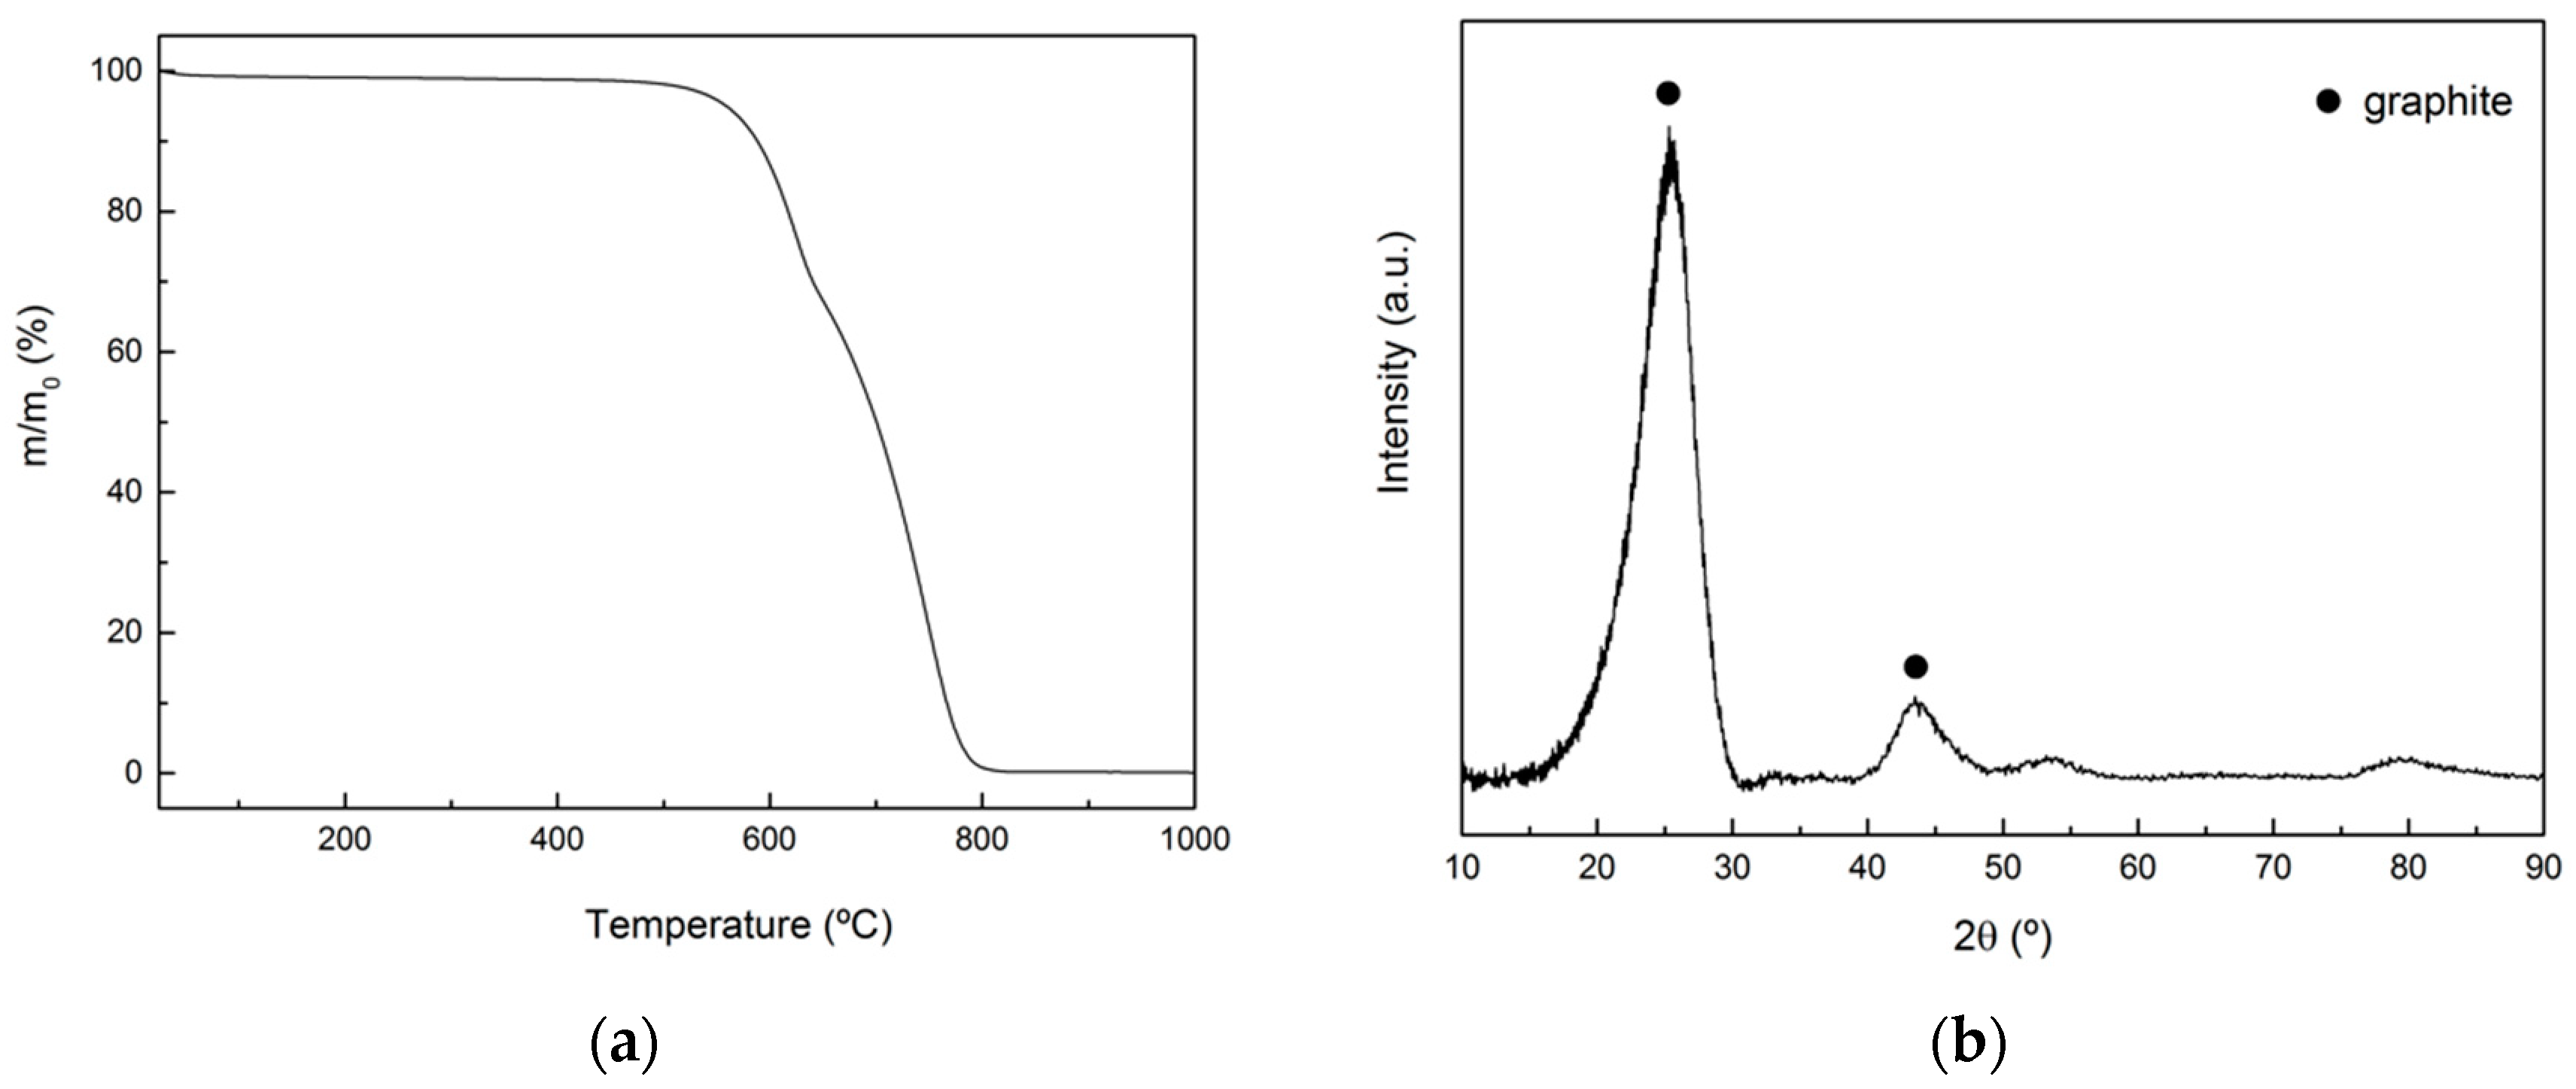
The composition was obtained by TGA in oxidizing atmosphere (N
2:O
2 = 4:1) in the range 25–900 °C and it is 70 wt.% carbon fiber and 30 wt.% carbon binder. The corresponding thermogram is shown in
Figure 3a, where the first initial mass loss corresponds to moisture in the sample, and the mass loss at 600 °C corresponds to the combustion of the amorphous C binder (product of pyrolysis of the phenolic resin). The final mass loss observed at 750 °C corresponds to the combustion of the PAN-derived carbon fibers, which are thermally more stable than the amorphous C binder. XRD tests indicated that carbon fibers are the only crystalline phase (See
Figure 3b). However, they present low crystallinity (very broad diffraction peak) as the spacing between graphitic layers calculated from the position of the 0002 peak (0.35 nm) is far from the theoretical one for perfect graphite (0.33 nm).
The bulk density of the preform ranges from 1.20–1.25 g/cm3, while the He density is 1.83 g/cm3. Considering these values, open porosity was calculated yielding a value of around 30%.
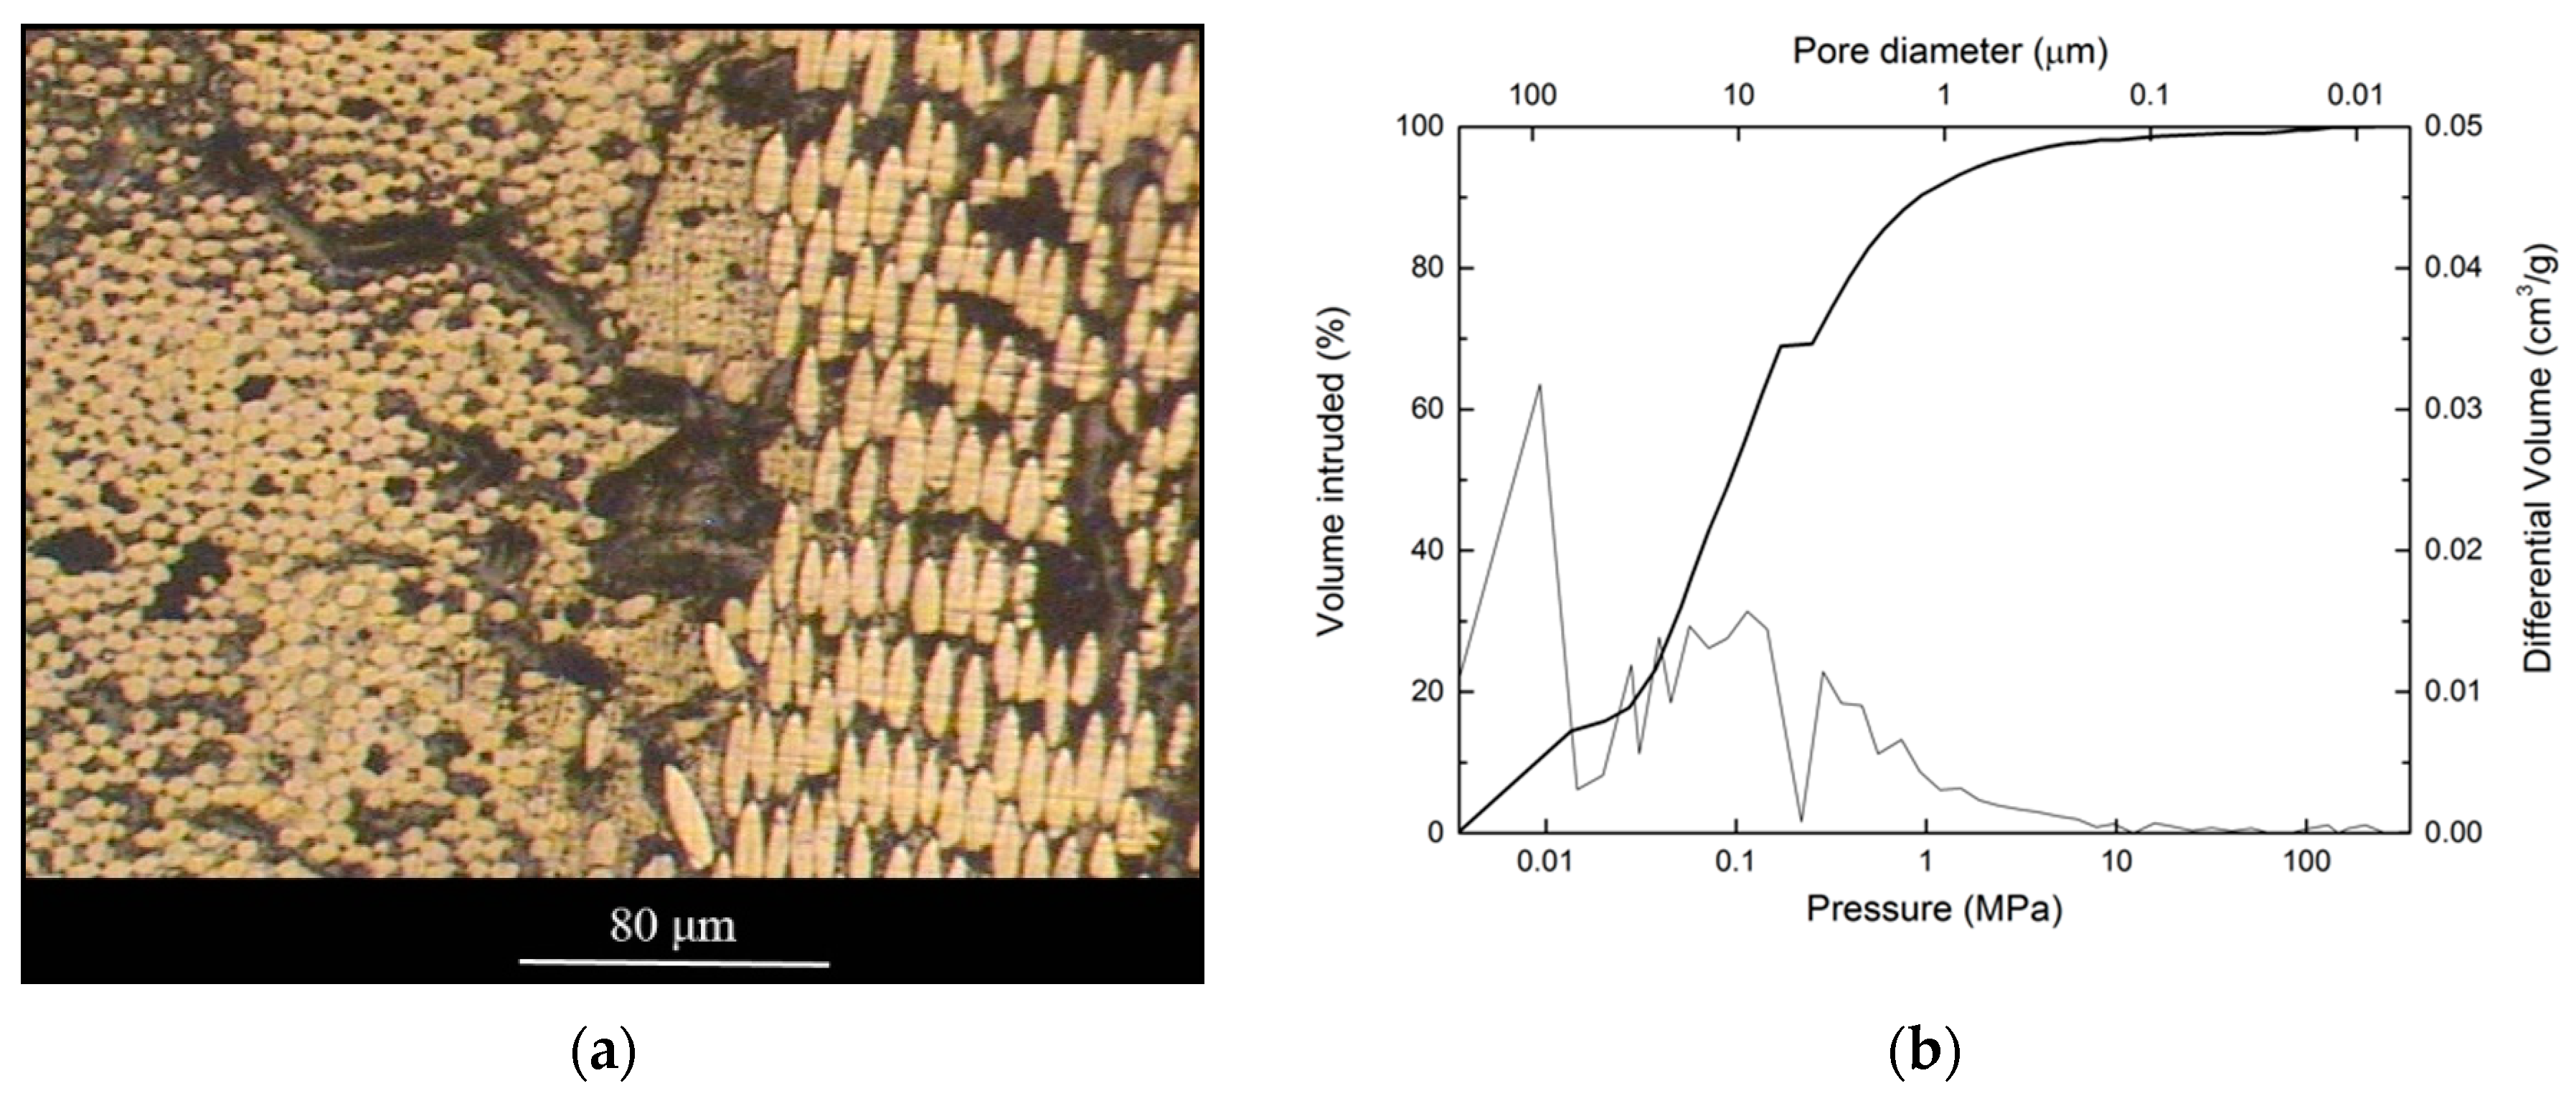
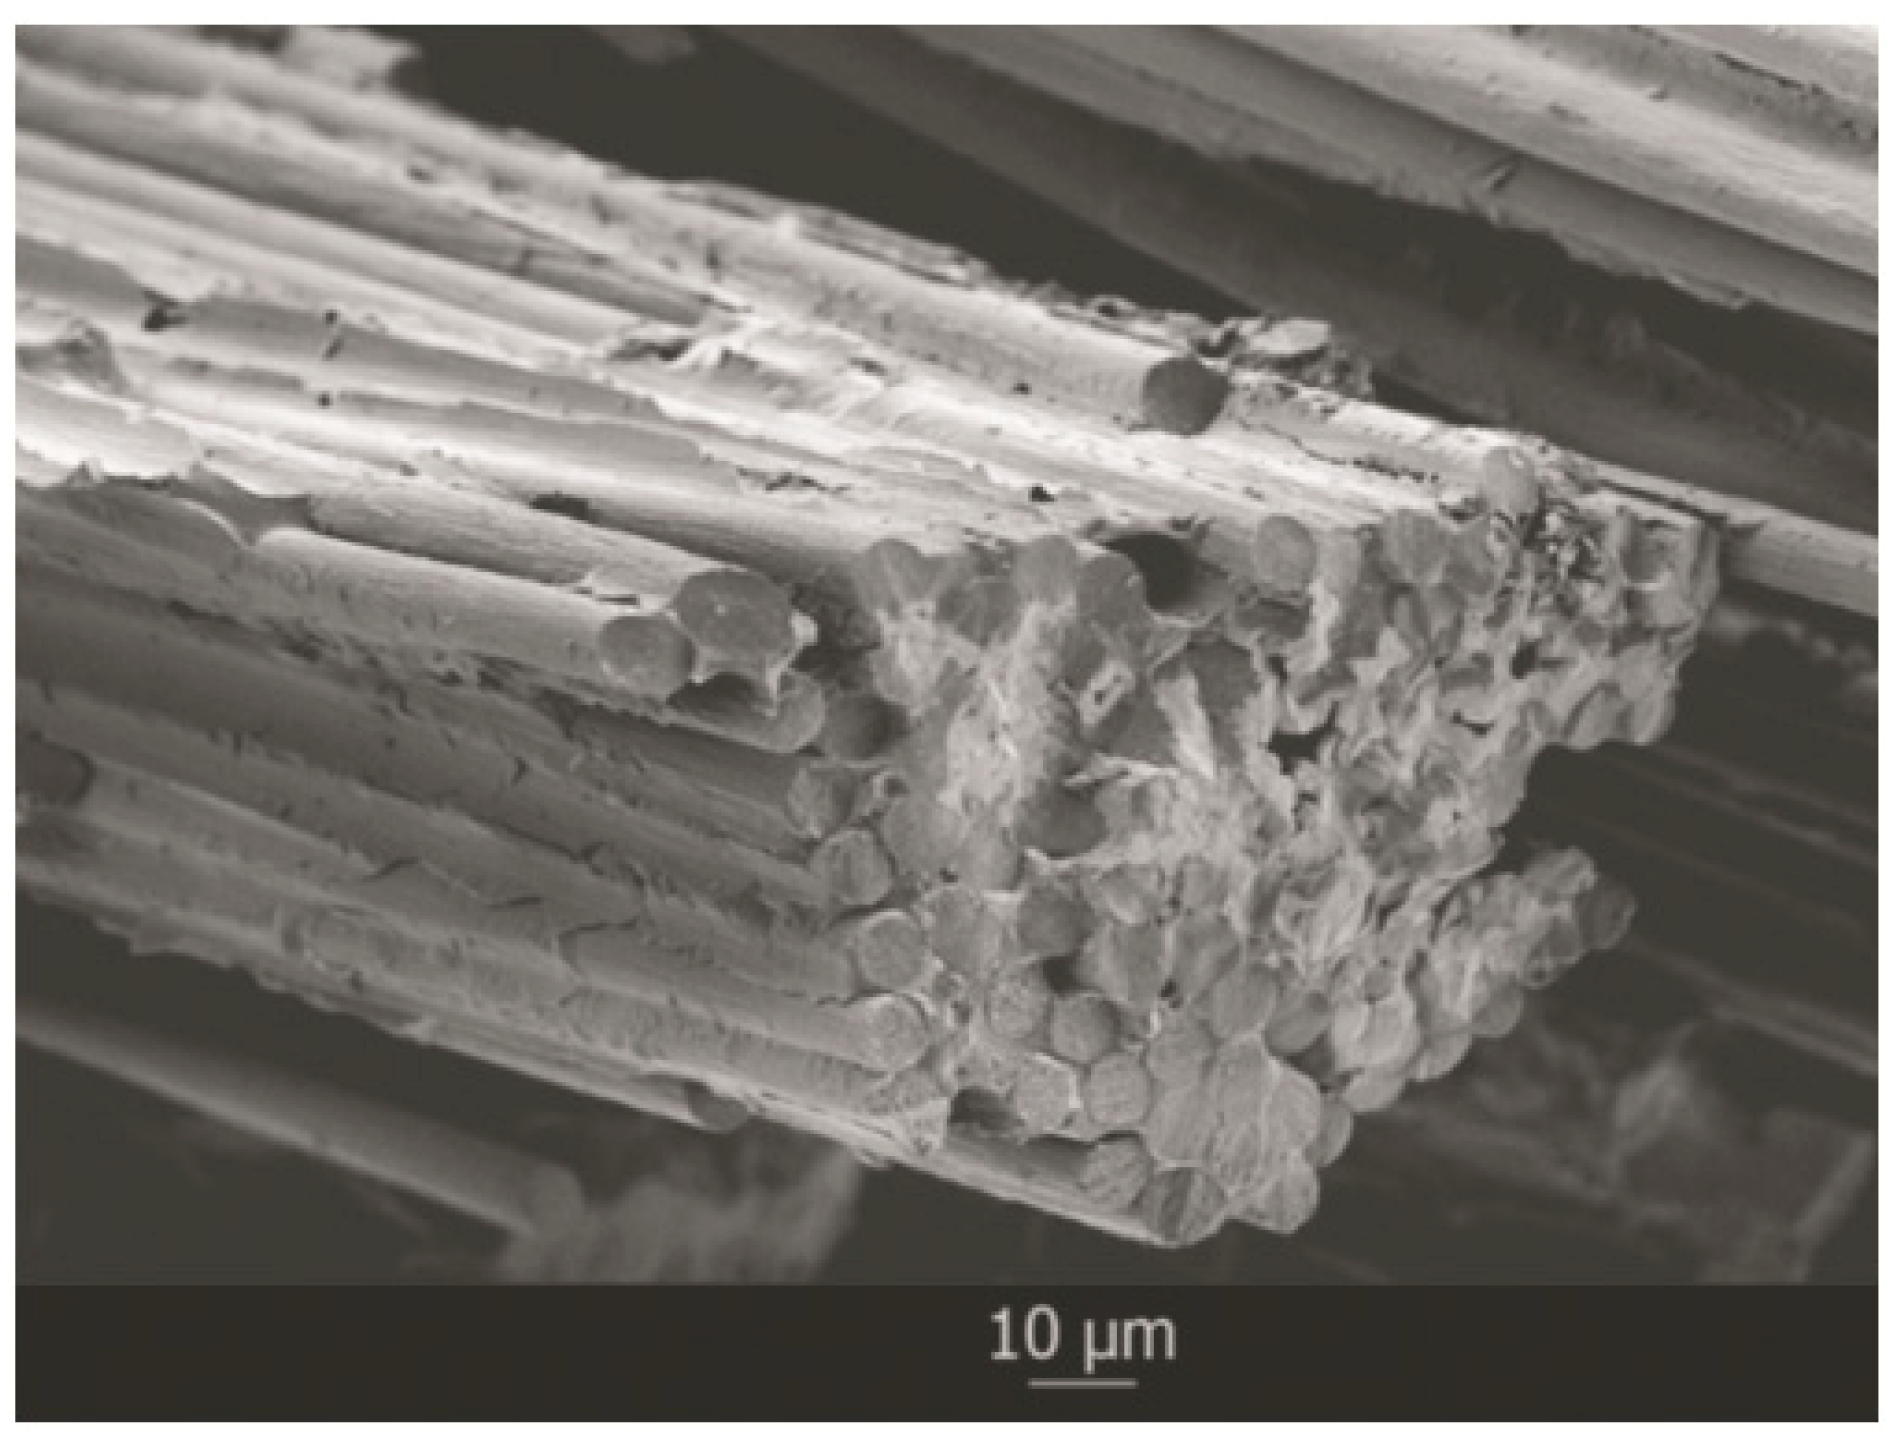
Figure 4a shows an optical microscope image of a polished cross-section of the preform, where the cross-section of the carbon fibers is easily distinguished as they appear in the shape of circles or ellipses, depending on the direction of the fiber. By looking at the microstructure, it becomes clear that fibers are randomly oriented and grouped in fiber bundles. The carbon binder is observed surrounding the fibers and fiber bundles, and porosity of different sizes is distinguished.
Figure 4b shows the intrusion curve and the pore size distribution obtained from mercury porosimetry. A broad distribution of pore sizes around two values, 2 and 10 μm, is observed. This is in agreement with the porosity observed in
Figure 4a. The pores with sizes around 2 μm correspond to the interfiber spaces, while the pores with sizes around 10 μm correspond to the interbundle spaces. The high initial intrusion can be attributed to the filling between the pieces of sample rather than to actual porosity of the material.
3.2. Infiltration of SiCp/C and Cf/C Porous Preforms
The time required for full infiltration of a typical 5 mm-thick preform was calculated for both preforms using Darcy’s Equation:
where
h is the infiltrated distance,
K is the permeability,
t is the time,
is the fluid dynamic viscosity,
is the porosity of the system and Δ
P the pressure drop that drives the infiltration. The permeability is proportional to the pore radius according to:
where
is a proportionality constant and
r is the average pore radius. In the case of systems where the liquid wets the solid and infiltration proceeds spontaneously (
θ < 90°), the pressure drop is the capillary pressure (
Pc) given by:
where
λ is a geometrical factor,
is the surface tension of the liquid,
θ is the contact angle of the liquid on the solid,
is the porosity of the system, and
r is the average pore radius.
Table 3 shows the parameters for the SiC systems used to calculate the infiltration time.
This model suggests that vertical infiltration of a preform of 5 mm thickness should be achieved within a fraction of seconds, 0.54 s for the SiC
p/C preform and 0.05 s for the C
f/C preform. However, it must be considered that the time required for full infiltration of a 3D sample is greater, since the melt has to spread in the x- and z-directions, and usually, permeability in the x-direction is a couple of orders of magnitude lower for uniaxially pressed materials than in the z-direction [
24]. Nevertheless, this model is likely to predict a time for full infiltration of a couple of orders of magnitude faster than the real one, since infiltration in the C
f/C preform should be limited by the chemical reaction at the infiltration front. Furthermore, none of these models take into account the pore reduction or closure phenomena, which might play a major role in infiltration kinetics. The infiltration time calculated for the SiC
p/C preform should be closer to the real infiltration times since the chemical reaction should not delay infiltration as much as in the C
f/C preform.
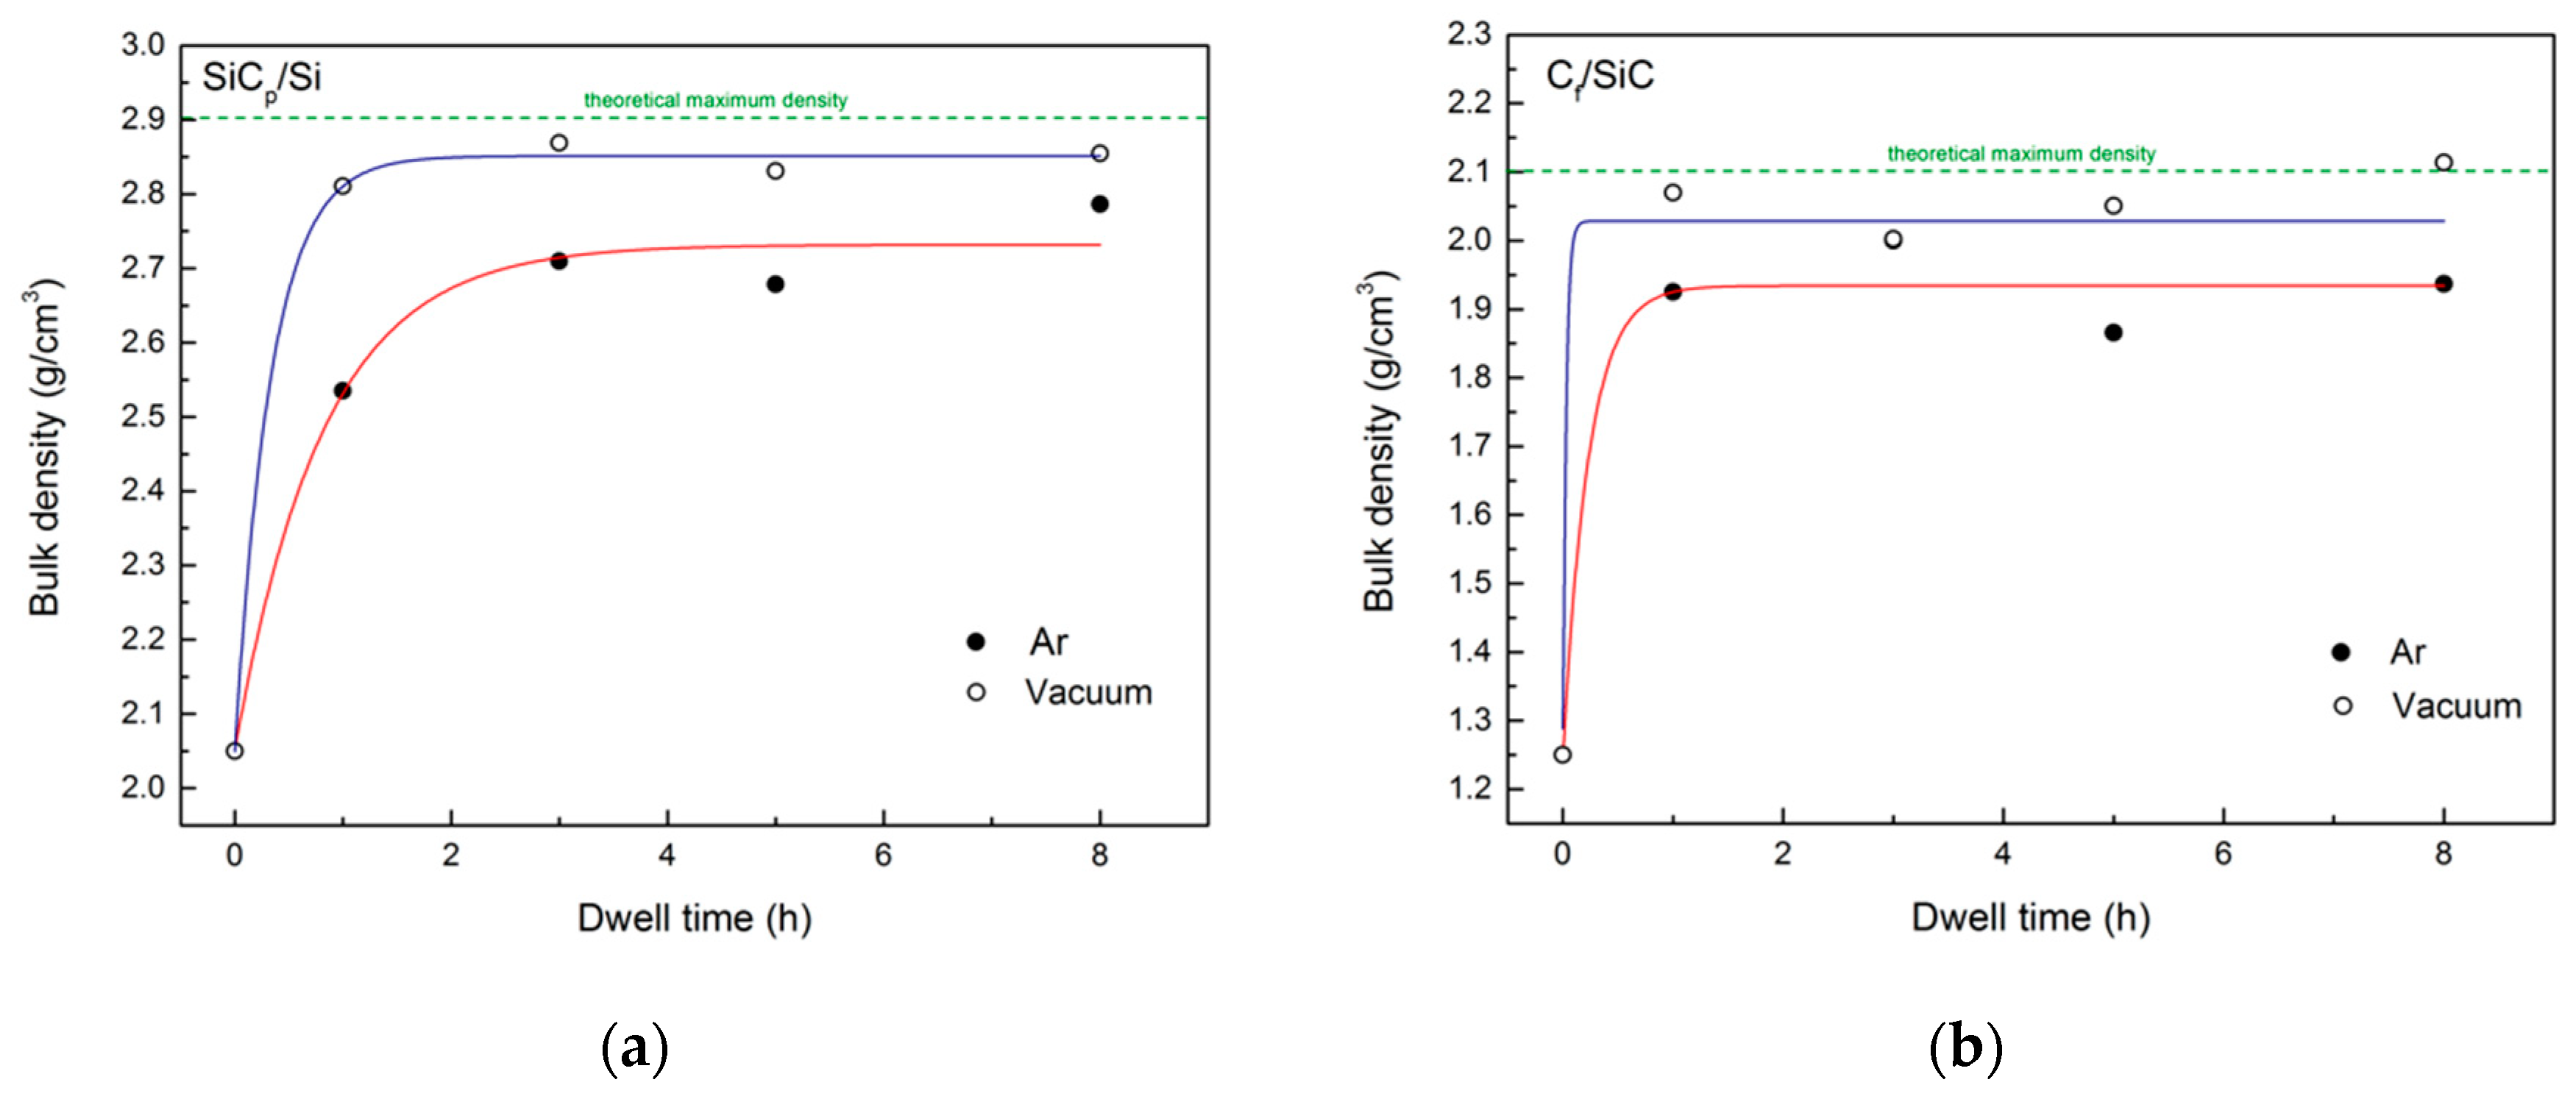
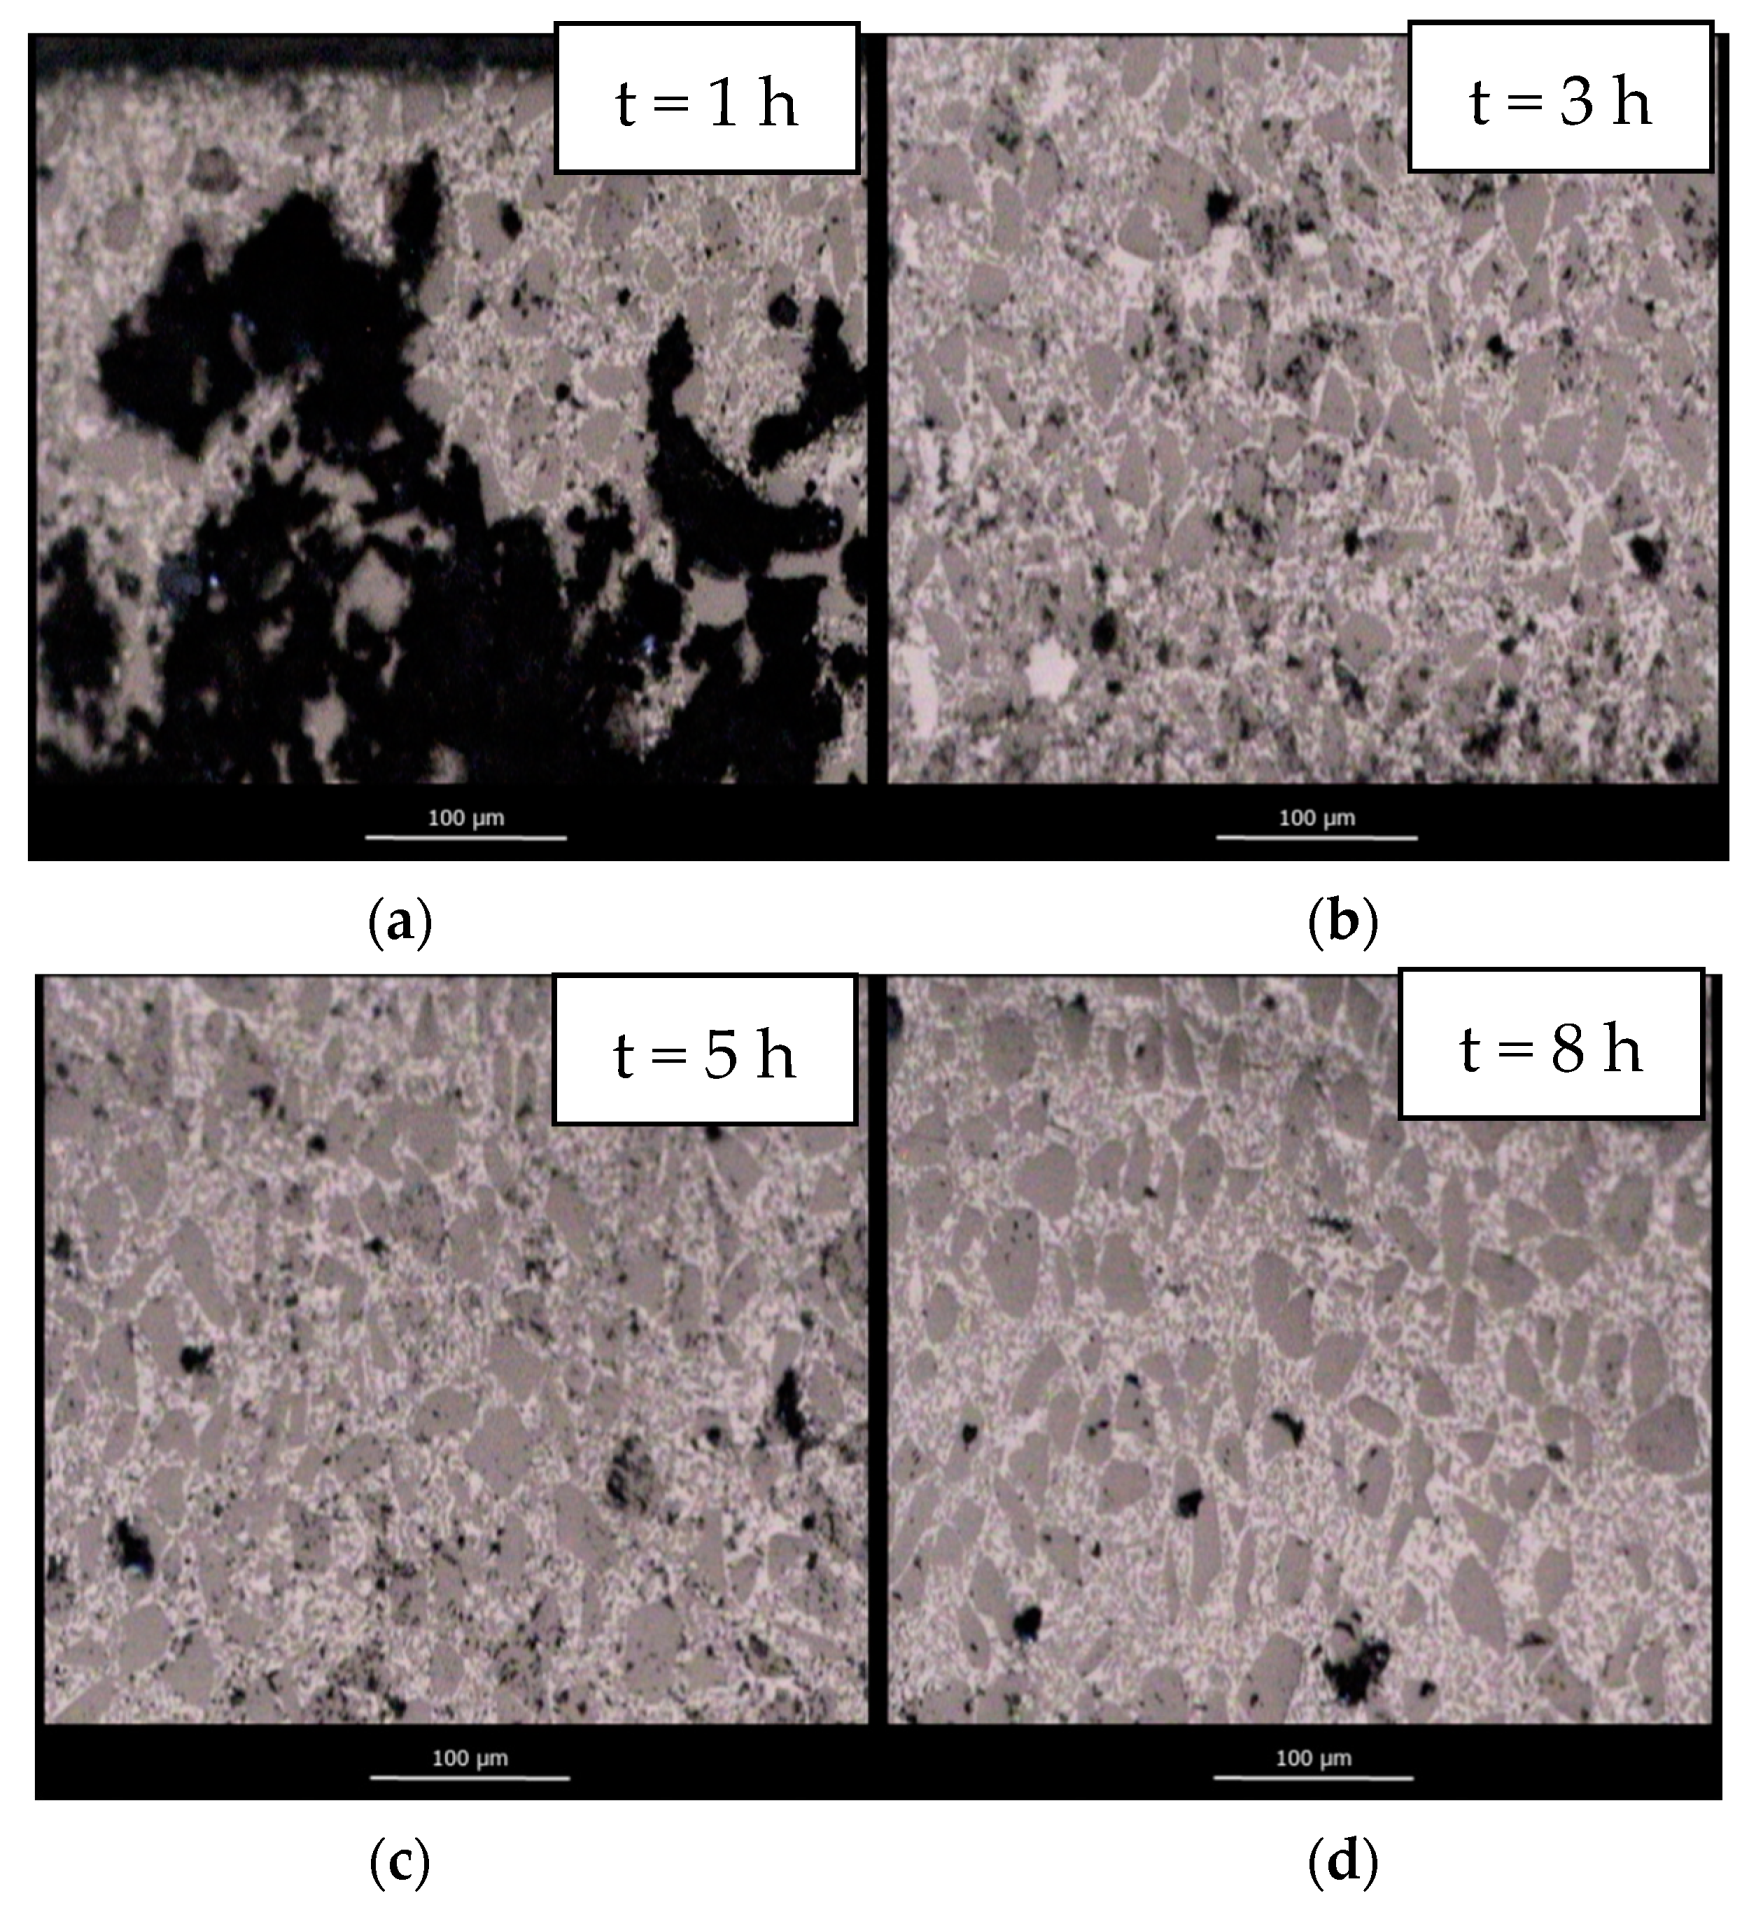
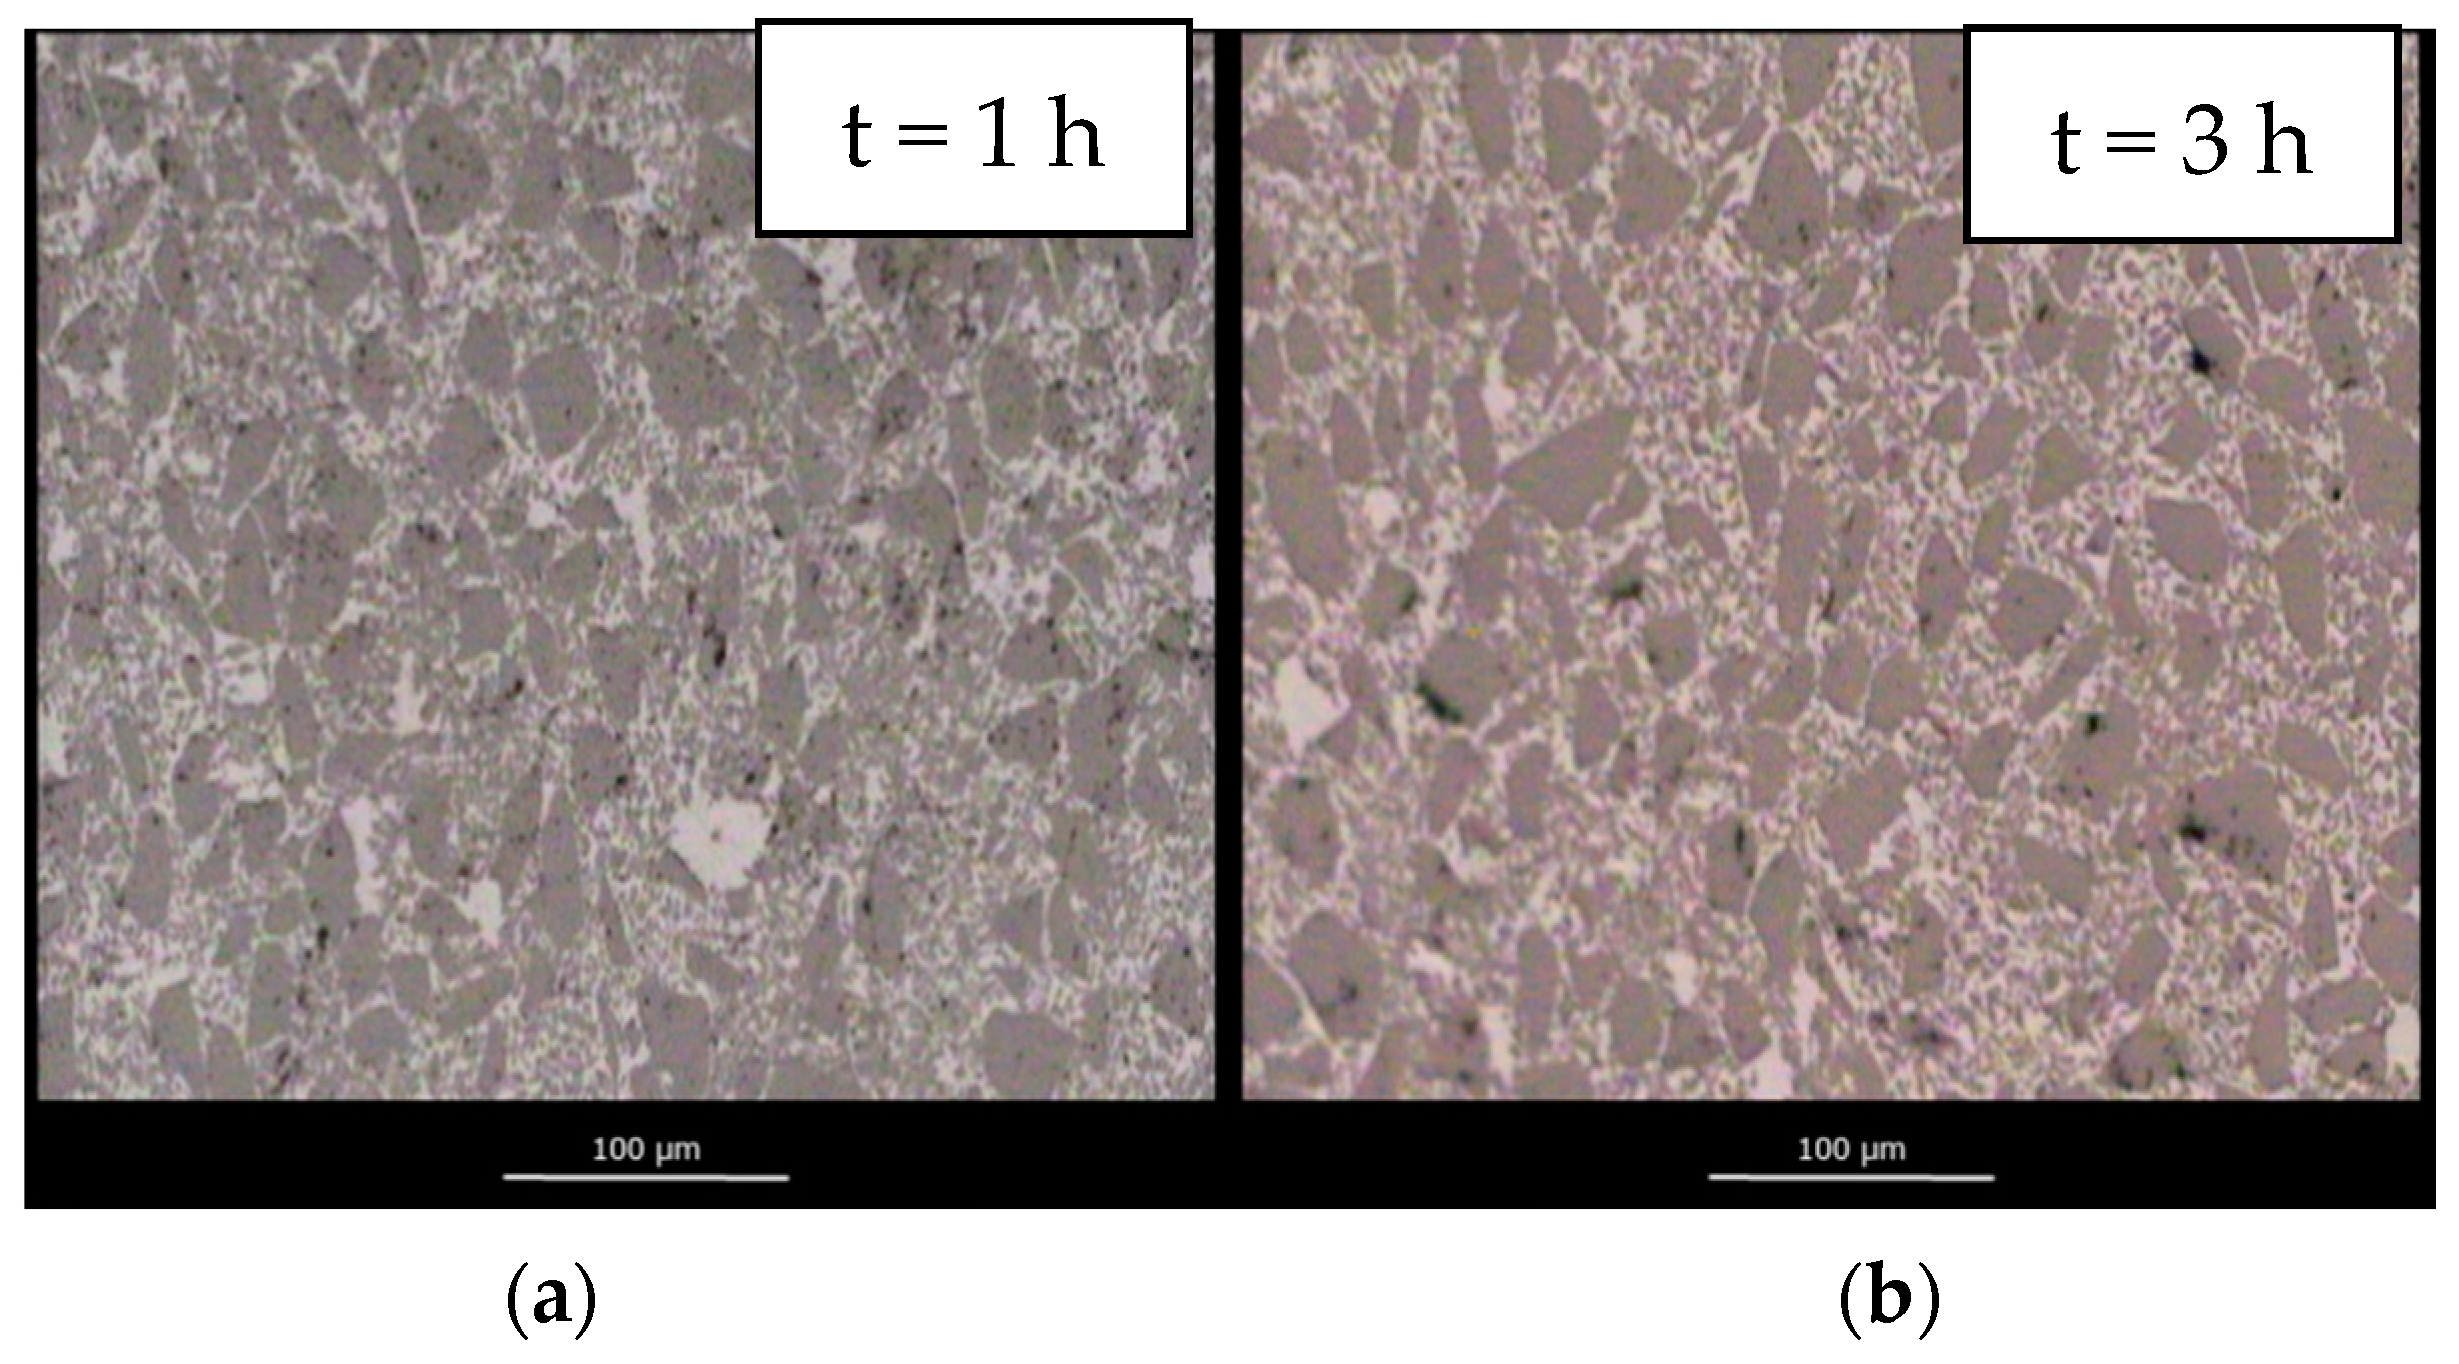
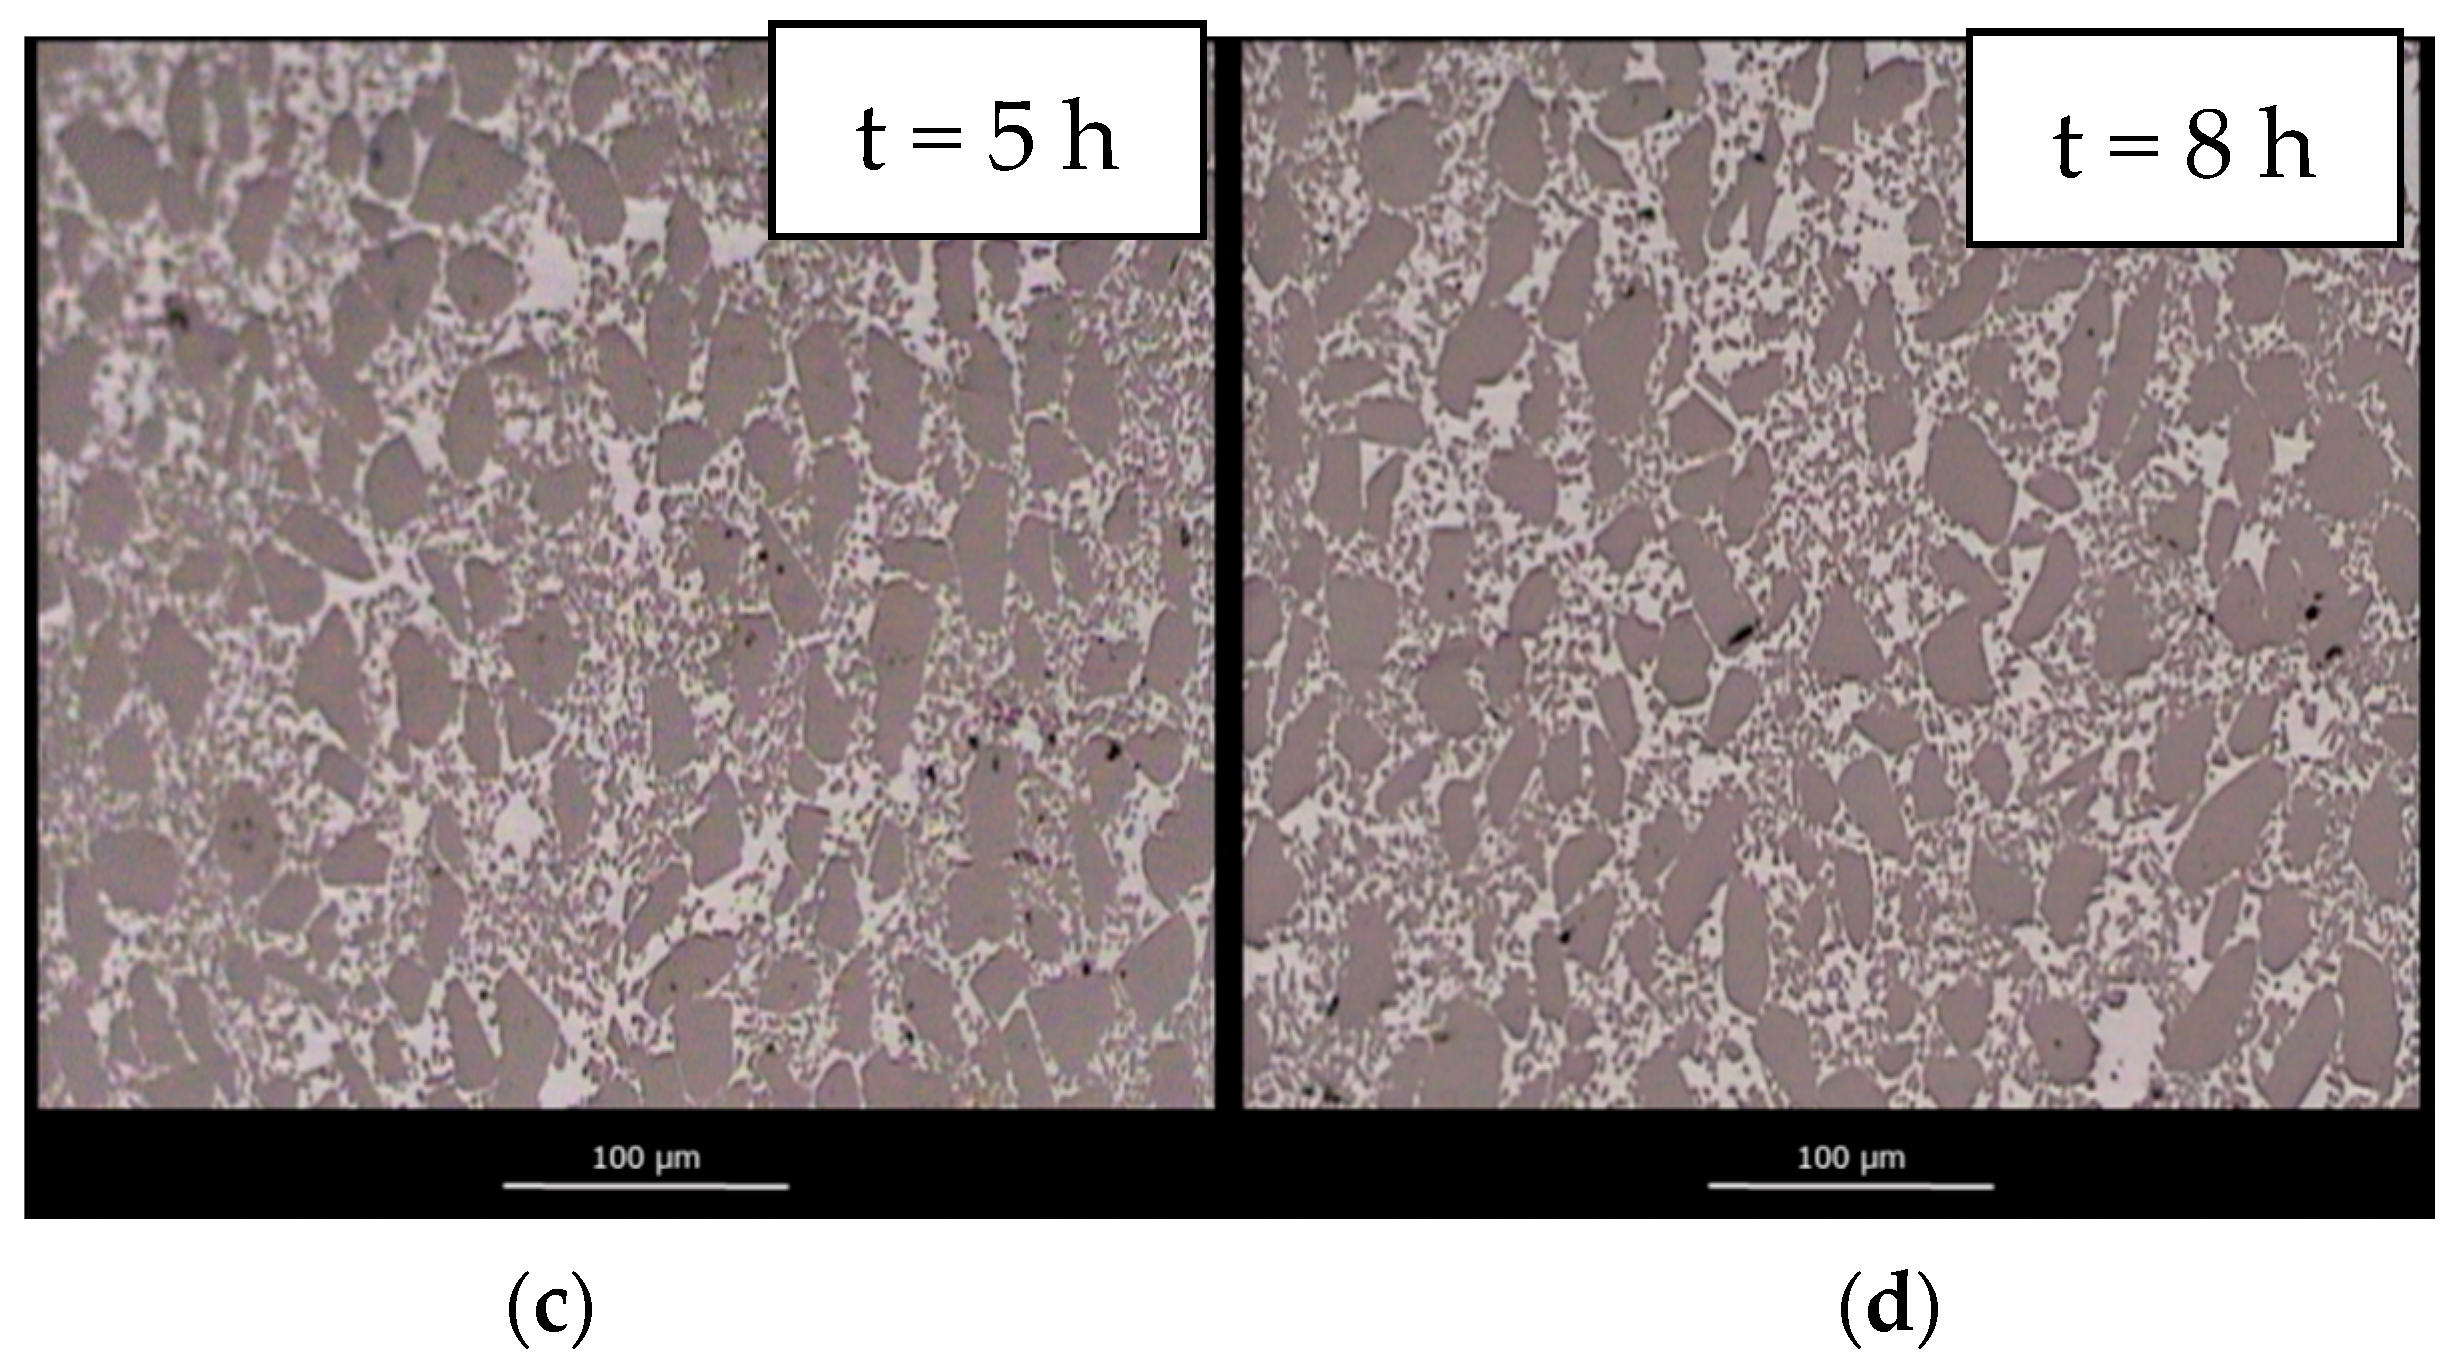
Figure 5 shows the evolution of bulk density of the infiltrated specimens with different dwell times in the furnace at 1450 °C for both kinds of preforms under Ar flow (black dots) and under a vacuum atmosphere (white dots). The red and blue lines are guides to the eye.
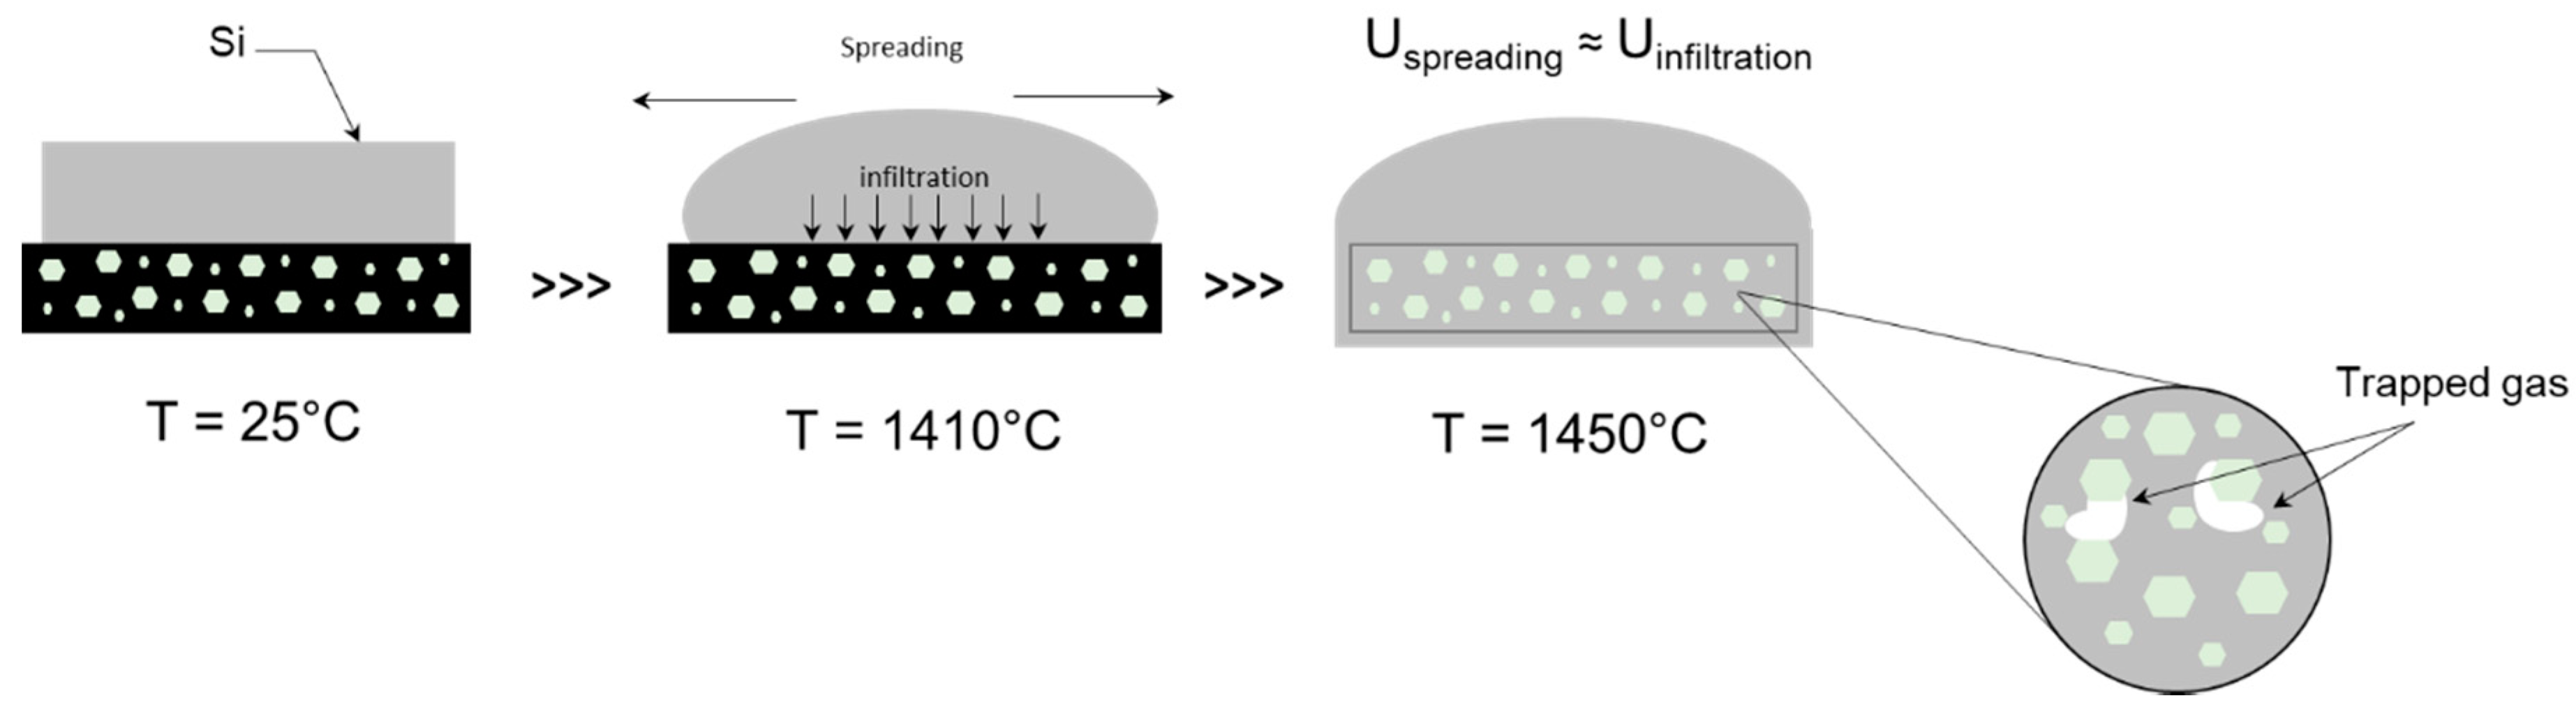
In general, lower densities are obtained when infiltrating under Ar flow, most likely because of gas entrapment within the pores of the preform. Because of the set up used for infiltration, the surface of the preform can be rapidly covered with Si after it melts, preventing gas inside the pores from exiting the preform (see
Figure 6).
The fact that longer dwell times yield denser materials provides more evidence of this phenomenon, as gas bubbles can diffuse through the melt and out of the preform if given sufficient time. Further proof of gas bubbles entrapment is provided by the evolution of bulk density with dwell time obtained for infiltrations performed under vacuum. Not only are higher values of bulk density are obtained but also a density value that is close to the theoretical maximum density is obtained after 1 h at 1450 °C. The huge difference in density between the sample infiltrated for 1 h in Ar and under vacuum can only be explained because of gas remaining within the microstructure for the sample infiltrated in Ar, as models suggest that full vertical infiltration should occur in the first few minutes.
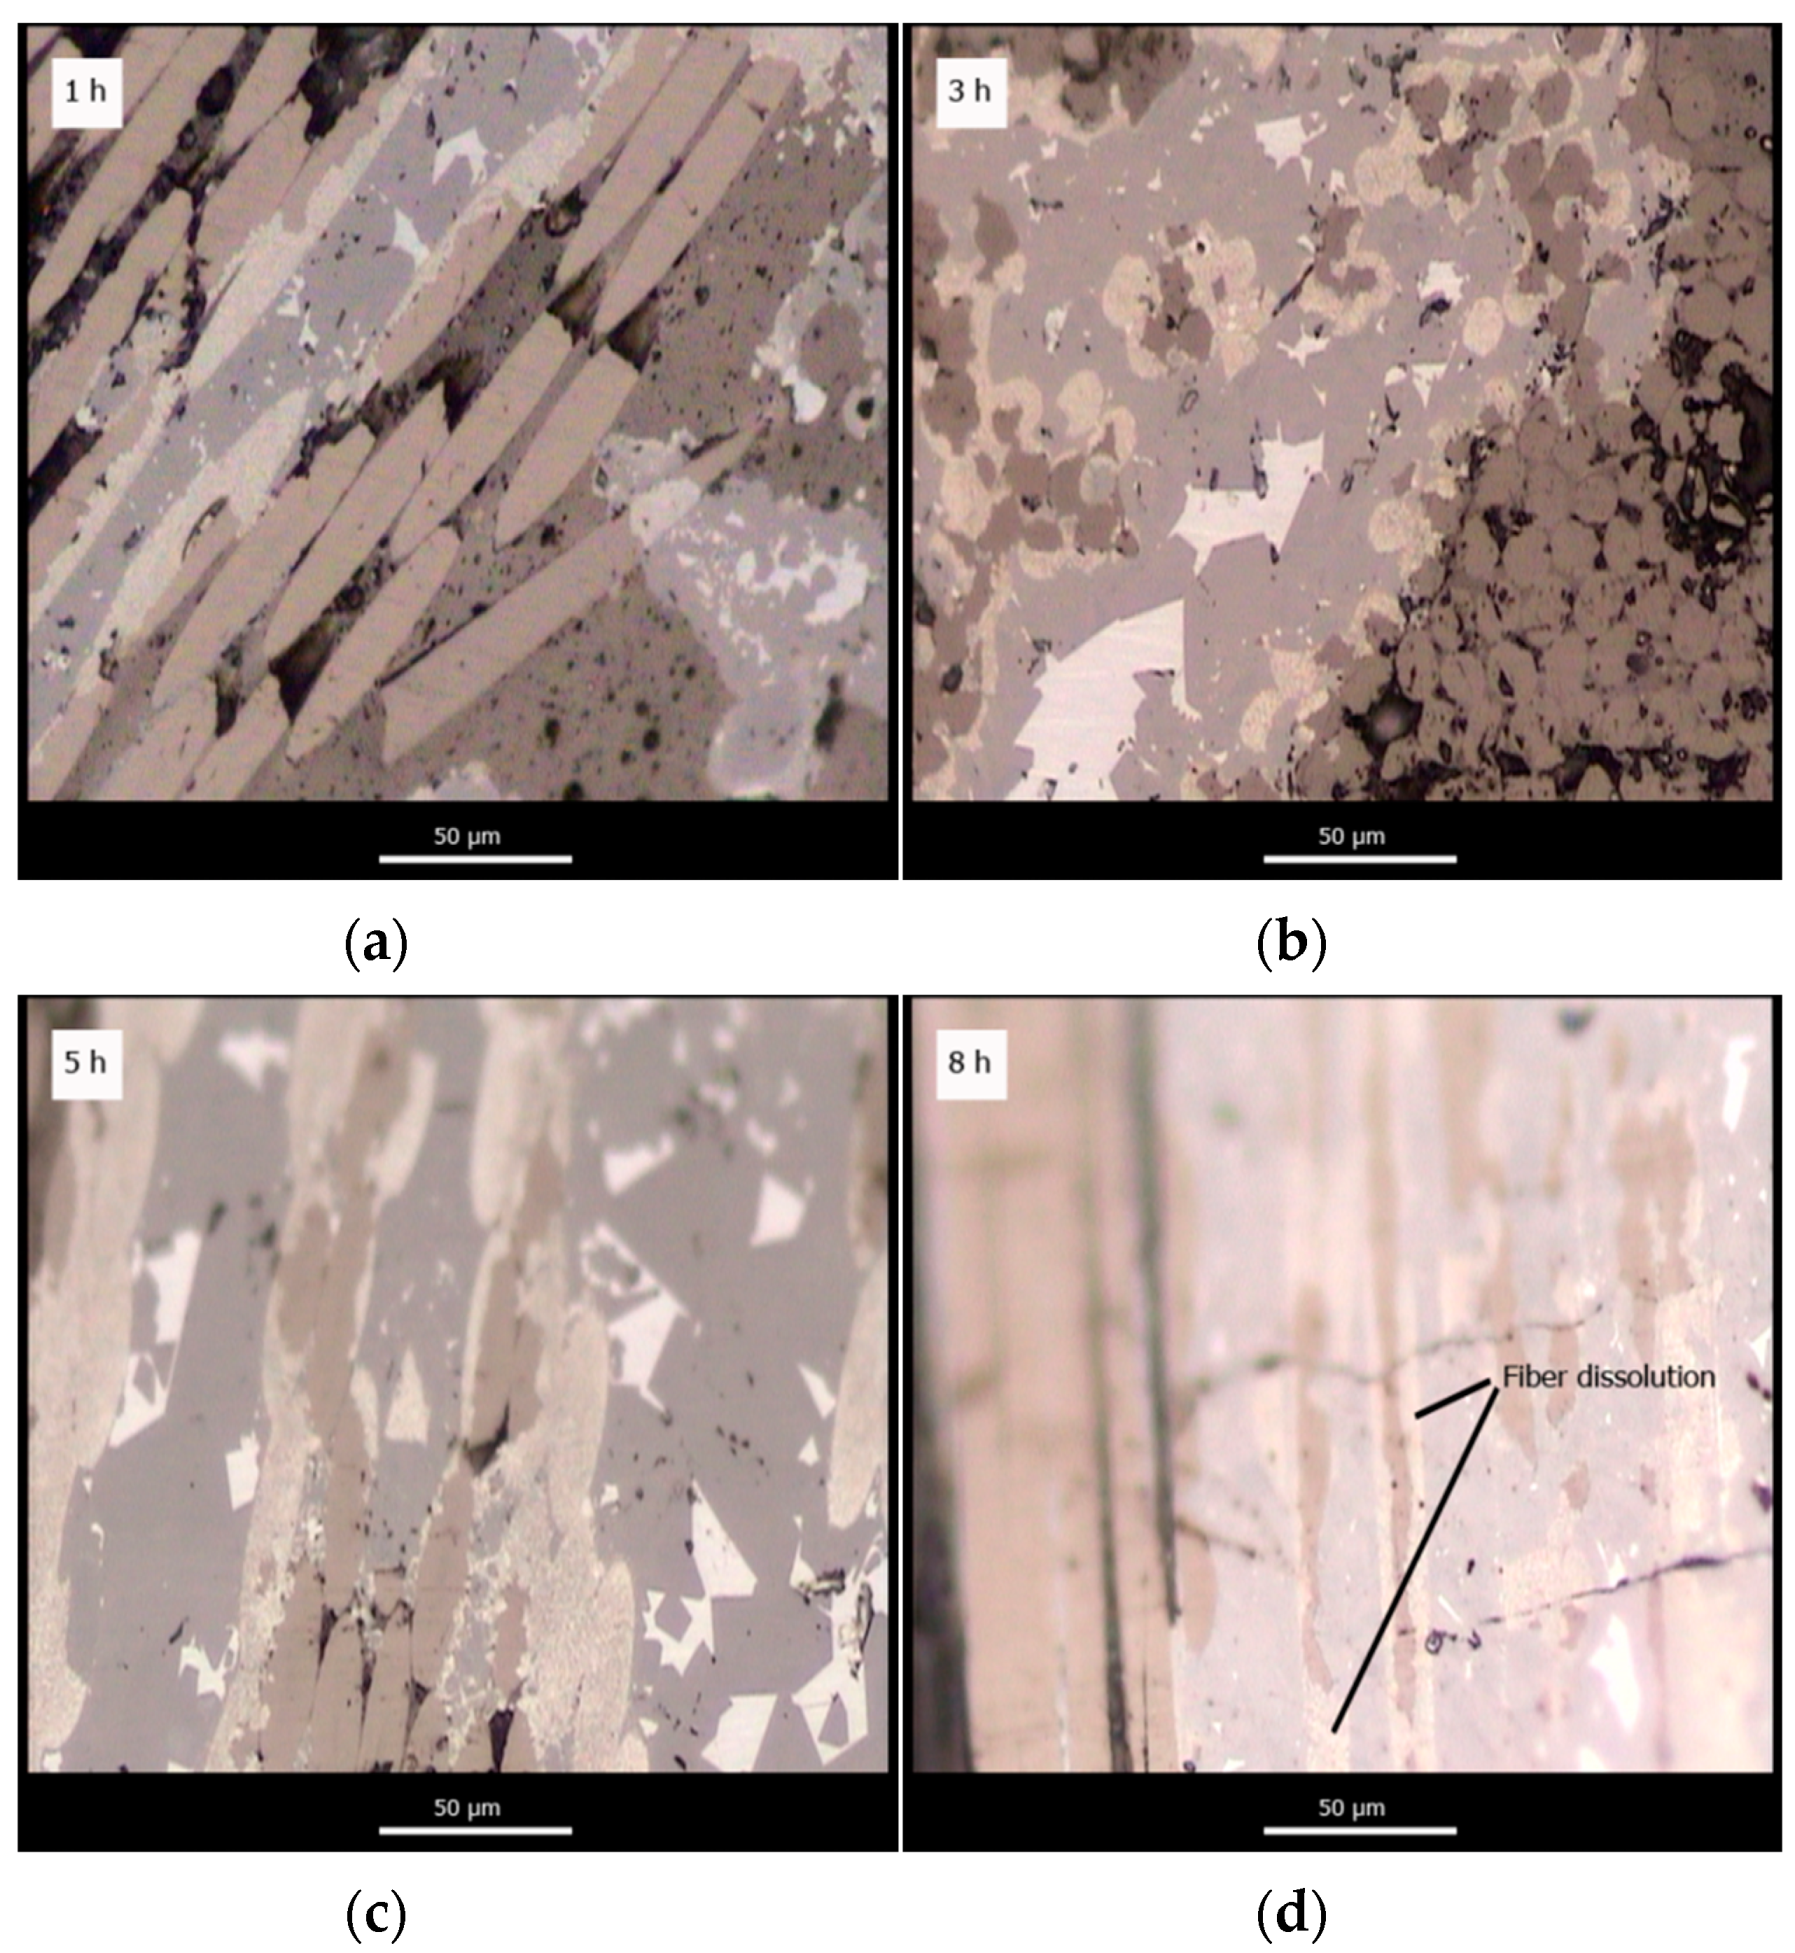
The difference between densities achieved under Ar or vacuum is smaller for the C
f/SiC composite than for SiC/C (see
Figure 5). Because pores are wider for the C
f/C preform, and spreading of liquid Si and thus infiltration proceeds slower because they are limited by the chemical reaction at the infiltration front, gas can escape the pores more easily as they are filled. Nevertheless, the slightly higher densities obtained with vacuum suggest that gas can remain trapped within the smallest pores of the preform during infiltration.


