The Development of a New Shock Absorbing Uniaxial Graded Auxetic Damper (UGAD)


Abstract
1. Introduction
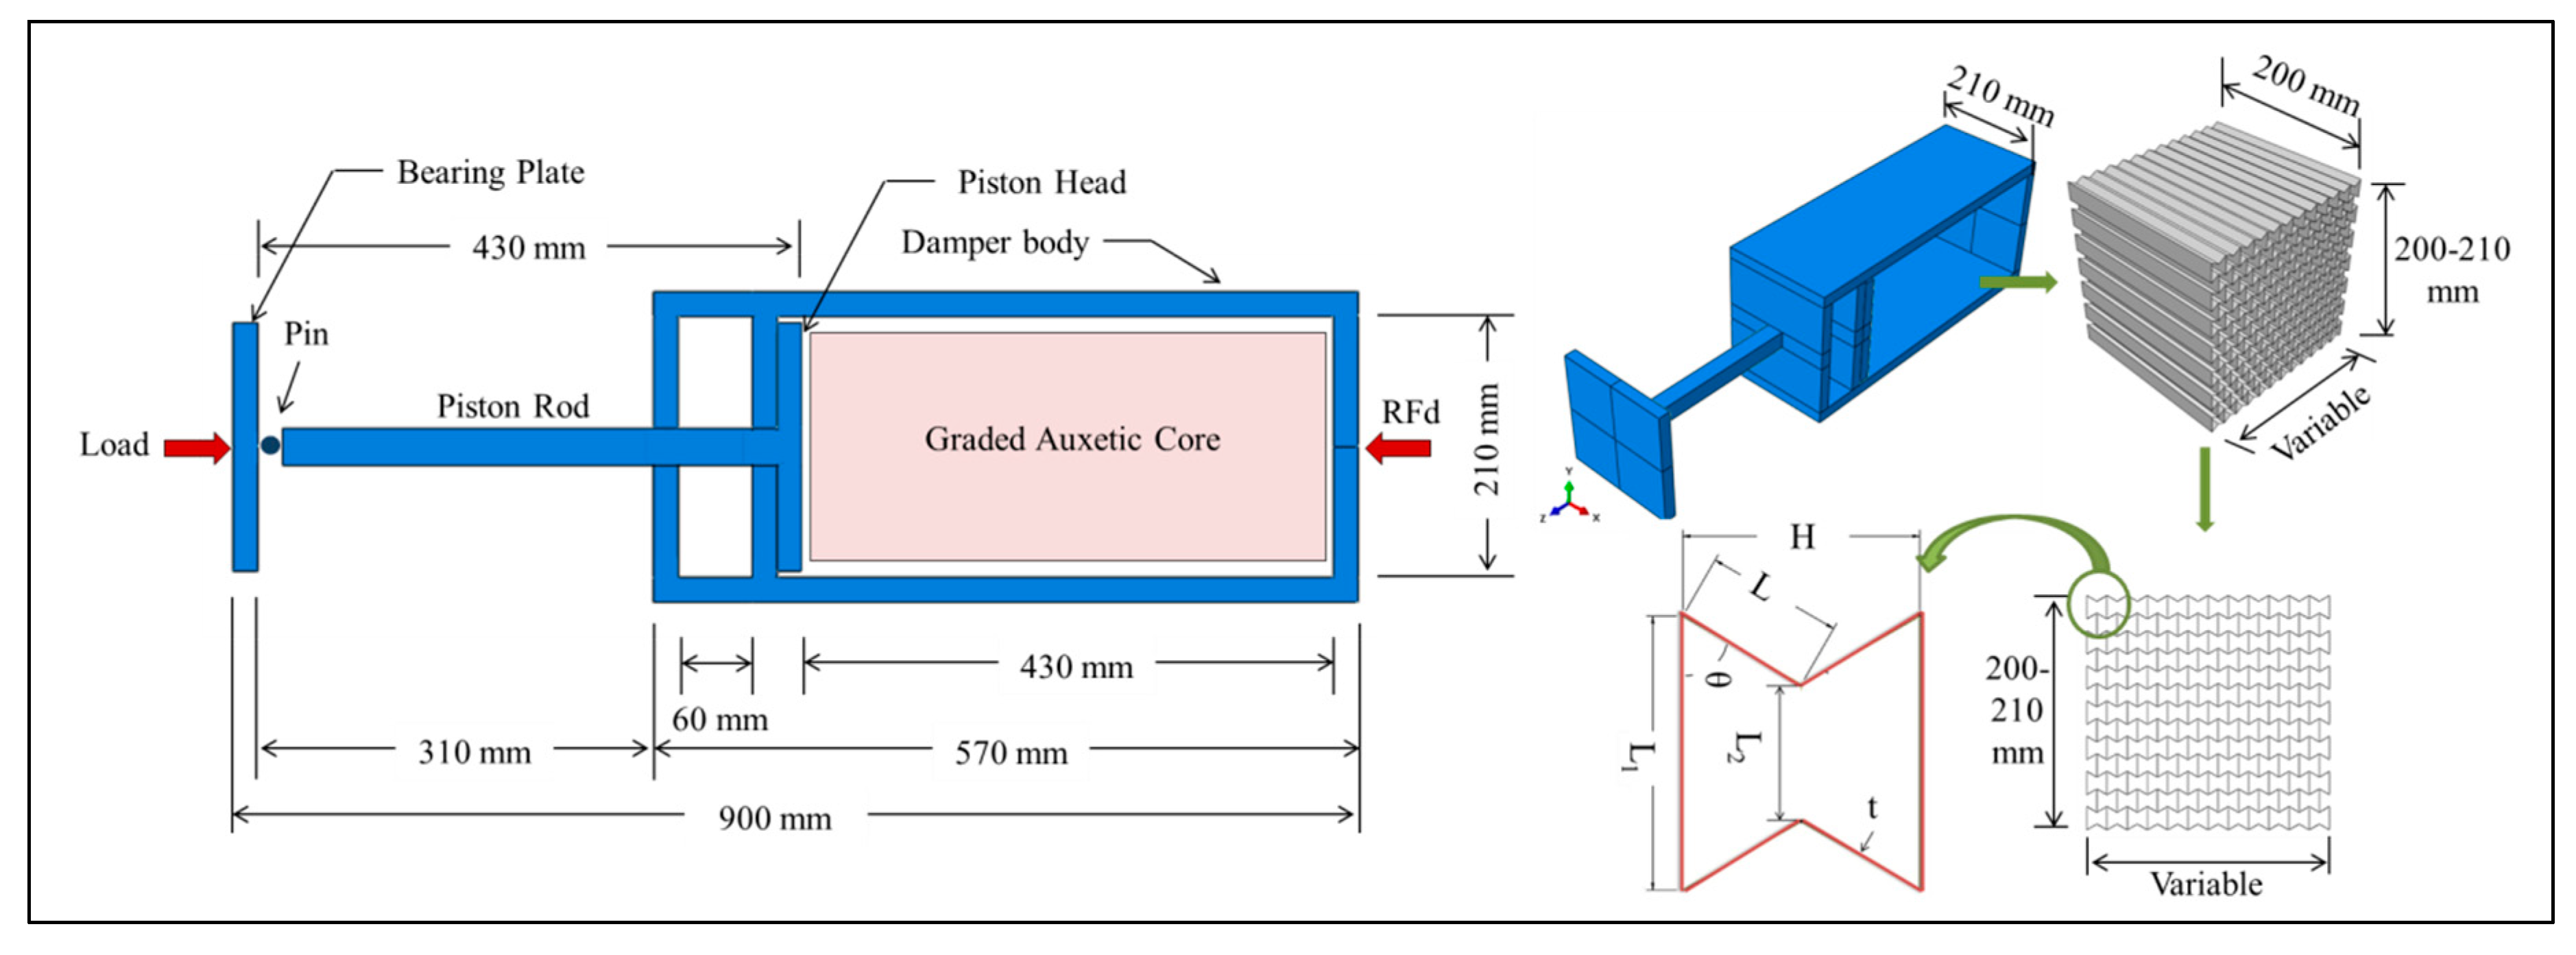
2. General Concept of the UGAD
3. Modelling Techniques and Assumptions
3.1. Numerical Model
3.2. Constitutive Law for The Auxetic Core
3.3. Loading
4. Parametric Study
4.1. Loading Direction
4.2. Cell Dimension
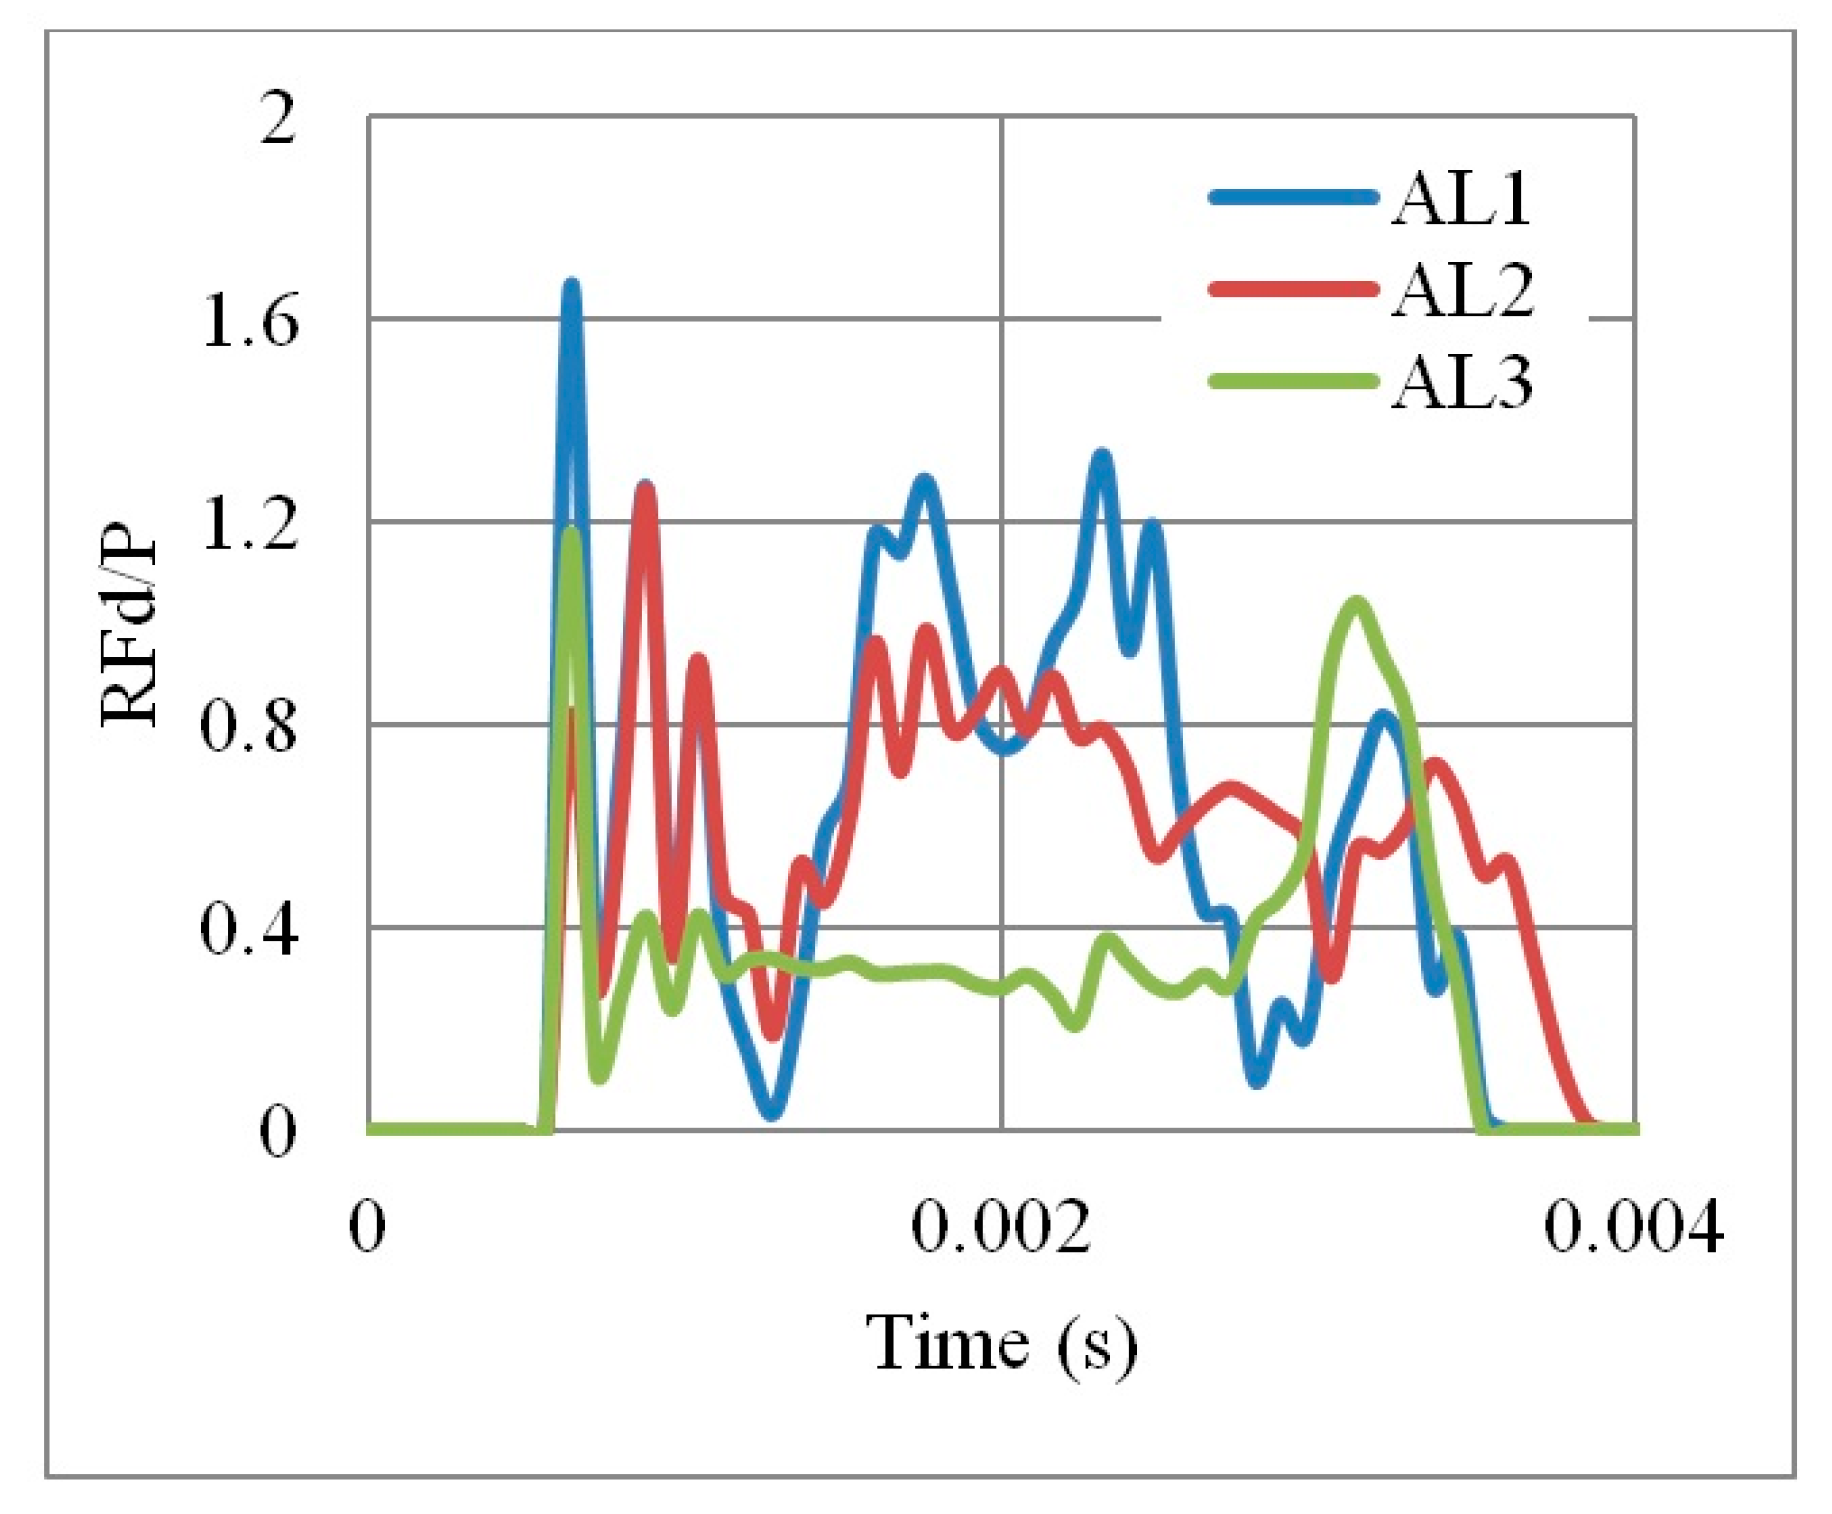
4.3. Aluminium Grade
4.4. Cell Angle
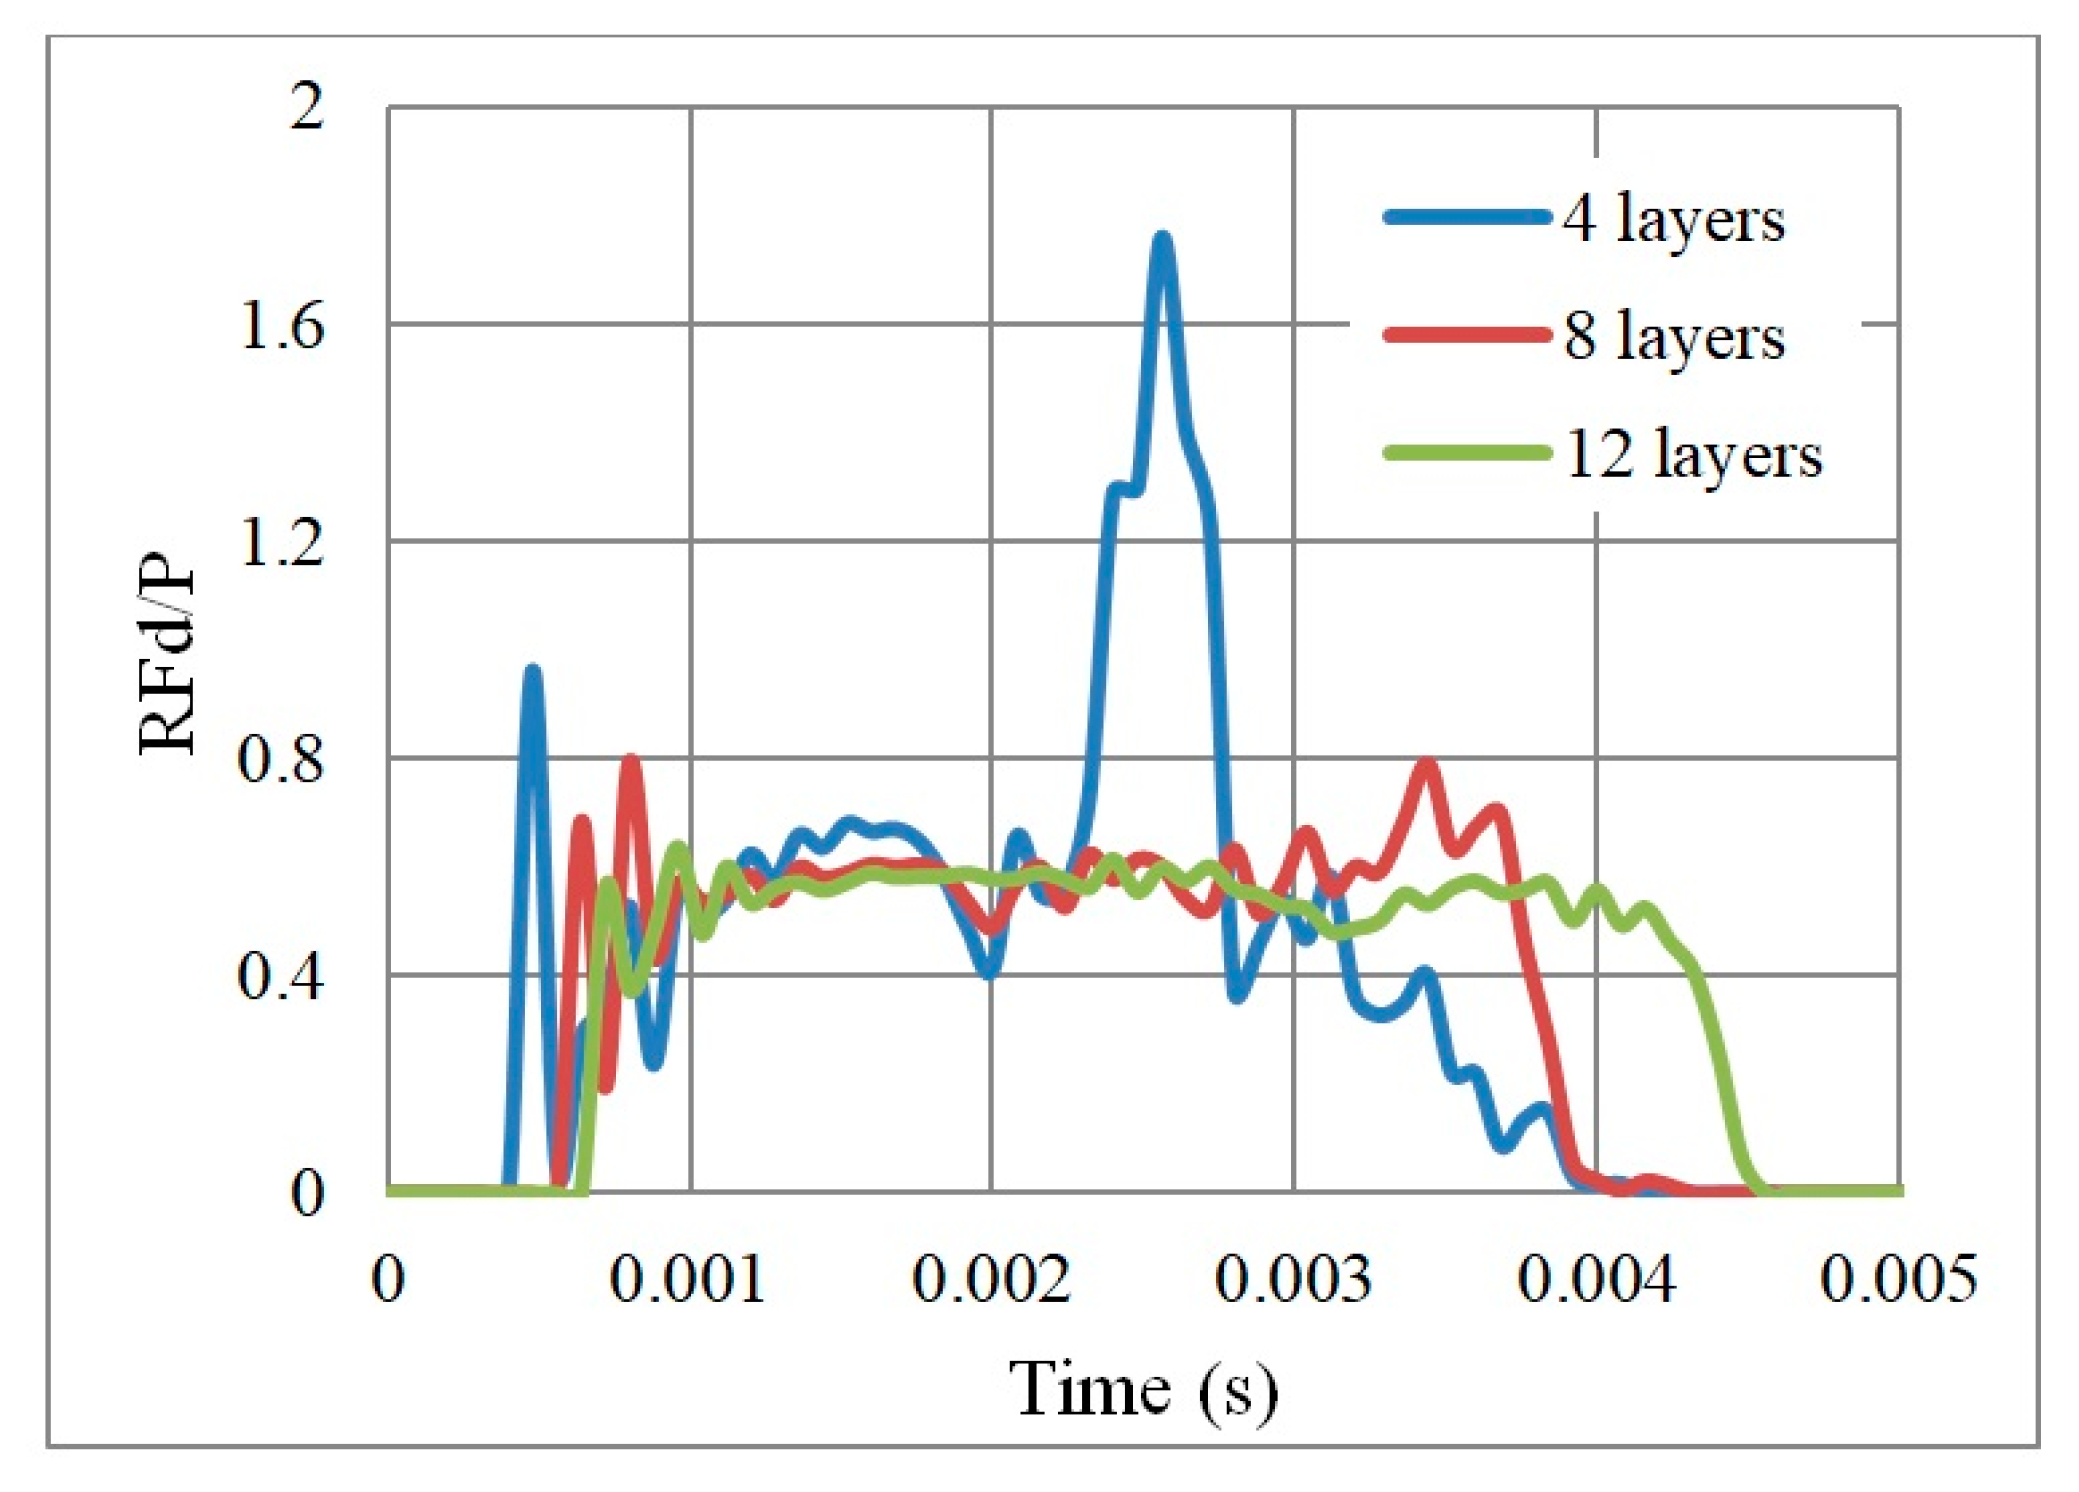
4.5. Number of Layers
4.6. Cell Wall Thickness t
5. Final Properties of the UGAD
6. UGAD Applications
7. Conclusions
Author Contributions
Funding
Conflicts of Interest
References
- De Silva, C.W. Vibration Damping, Control, and Design; CRC Press: Boca Raton, FL, USA, 2007. [Google Scholar]
- Adhikari, S. Structural Dynamic Analysis with Generalized Damping Models: Analysis; ISTE and John Wiley Sons: London, UK, 2013. [Google Scholar]
- Lewandowski, R.; Pawlak, Z.R. Dynamic analysis of frames with viscoelastic dampers modelled by rheological models with fractionalderivatives. J. Sound Vib. 2011, 330, 923–936. [Google Scholar] [CrossRef]
- Al-Rifaie, H.; Wilkinson, S. Improving the seismic performance of buildings by increasing structural damping. In Proceedings of the Fifteenth International Conference on Civil, Structural and Environmental Engineering Computing, Prague, Czech Republic, 1–4 September 2015; Kruis, J., Tsompanakis, Y., Topping, B.H.V., Eds.; CivilComp Press: Stirlingshire, UK, 2015. [Google Scholar]
- Al-Rifaie, H.; Glema, A.; Malendowski, M. Vertical seismic load effects on the response of structures with toggle brace dampers. In Proceedings of the Fifteenth International Conference on Civil, Structural and Environmental Engineering Computing, Prague, Czech Republic, 1–4 September 2015; Kruis, J., Tsompanakis, Y., Topping, H.V., Eds.; Civil–Comp Press: Stirlingshire, UK, 2015. [Google Scholar]
- Yang, M.; Qiao, P. High energy absorbing materials for blast resistant design. Blast Prot. Civ. Infrastruct. Veh. Using Compos. 2010, 88–119. [Google Scholar] [CrossRef]
- Monir, H.S. Flexible blast resistant steel structures by using unidirectional passive dampers. J. Construct. Steel Res. 2013, 90, 98–107. [Google Scholar] [CrossRef]
- Zhu, F.; Lu, G.; Ruan, D.; Wang, Z. Plastic deformation, failure and energy absorption of sandwich structures with metallic cellular cores. Int. J. Prot. Struct. 2010, 1, 507–541. [Google Scholar] [CrossRef]
- Lee, W. Cellular solids, structure and properties. Mater. Sci. Technol. 2000, 16, 233. [Google Scholar]
- Peroni, L.; Avalle, M.; Peroni, M. The mechanical behaviour of aluminium foam structures in different loading conditions. Int. J. Impact Eng. 2008, 35, 644–658. [Google Scholar] [CrossRef]
- Gibson, L.J.; Ashby, M.F. Cellular Solids: Structure and Properties; Cambridge University Press: Cambridge, UK, 1999. [Google Scholar]
- Dharmasena, K.P.; Wadley, H.N.; Xue, Z.; Hutchinson, J.W. Mechanical response of metallic honeycomb sandwich panel structures to high–intensity dynamic loading. Int. J. Impact Eng. 2008, 35, 1063–1074. [Google Scholar] [CrossRef]
- Li, X.; Zhang, P.; Wang, Z.; Wu, G.; Zhao, L. Dynamic behavior of aluminum honeycomb sandwich panels under air blast: Experiment and numerical analysis. Compos. Struct. 2014, 108, 1001–1008. [Google Scholar] [CrossRef]
- Rathbun, H.; Radford, D.; Xue, Z.; He, M.; Yang, J.; Deshpande, V. Performance of metallic honeycombcore sandwich beams under shock loading. Int. J. Solids Struct. 2006, 43, 1746–1763. [Google Scholar] [CrossRef]
- Hu, L.; Yu, T. Dynamic crushing strength of hexagonal honeycombs. Int. J. Impact Eng. 2010, 37, 467–474. [Google Scholar] [CrossRef]
- Okumura, D.; Ohno, N.; Noguchi, H. Post–buckling analysis of elastic honeycombs subject to in–plane biaxial compression. Int. J. Solids Struct. 2002, 39, 3487–3503. [Google Scholar] [CrossRef]
- Zou, Z.; Reid, S.; Tan, P.; Li, S.; Harrigan, J. Dynamic crushing of honeycombs and features of shock fronts. Int. J. Impact Eng. 2009, 36, 165–176. [Google Scholar] [CrossRef]
- Ruan, D.; Lu, G.; Wang, B.; Yu, T.X. In–plane dynamic crushing of honeycombs—a finite element study. Int. J. Impact Eng. 2003, 28, 161–182. [Google Scholar] [CrossRef]
- Xu, S.; Beynon, J.H.; Ruan, D.; Lu, G. Experimental study of the out-of-plane dynamic compression of hexagonal honeycombs. Compos. Struct. 2012, 94, 2326–2336. [Google Scholar] [CrossRef]
- Nia, A.A.; Sadeghi, M. The effects of foam filling on compressive response of hexagonal cell aluminum honeycombs under axial loading-experimental study. Mater. Des. 2010, 31, 1216–1230. [Google Scholar]
- Hou, X.; Deng, Z.; Zhang, K. Dynamic crushing strength analysis of auxetic honeycombs. Acta Mech. Solida Sin. 2016, 29, 490–501. [Google Scholar] [CrossRef]
- Imbalzano, G.; Linforth, S.; Ngo, T.D.; Lee, P.V.S.; Tran, P. Blast resistance of auxetic and honeycomb sandwich panels: Comparisons and parametric designs. Compos. Struct. 2018, 183, 242–261. [Google Scholar] [CrossRef]
- Lim, T. Auxetic Materials and Structures; Springer: Singapore, 2014. [Google Scholar]
- Lakes, R. Foam Structures with a Negative Poisson’s Ratio. Science 1987, 235, 1038–1040. [Google Scholar] [CrossRef] [PubMed]
- Lakes, R. Advances in negative Poisson’s ratio materials. Adv. Mater. 1993, 5, 293–296. [Google Scholar] [CrossRef]
- Alderson, A. A triumph of lateral thought. Chem. Ind. 1999, 17, 384–391. [Google Scholar]
- Yang, W.; Li, Z.M.; Shi, W.; Xie, B.H.; Yang, M.B. Review on auxetic materials. J. Mater. Sci. 2004, 39, 3269–3279. [Google Scholar] [CrossRef]
- Alderson, A.; Alderson, K. Auxetic materials. Proc. Inst. Mech. Eng., Part G J. Aerosp. Eng. 2007, 221, 565–575. [Google Scholar] [CrossRef]
- Liu, Y.; Hu, H. A review on auxetic structures and polymeric materials. Sci. Res. Essays 2010, 5, 1052–1063. [Google Scholar]
- Greaves, G.N. Poisson‘s ratio over two centuries: challenging hypotheses. Notes Rec. R. Soc. 2013, 67, 37–58. [Google Scholar] [CrossRef] [PubMed]
- Prawoto, Y. Seeing auxetic materials from the mechanics point of view: a structural review on the negative Poisson’s ratio. Comput. Mater. Sci. 2012, 58, 140–153. [Google Scholar] [CrossRef]
- Yeganeh-Haeri, A.; Weidner, D.J.; Parise, J.B. Elasticity of or-cristobalitez a silicon dioxide with a negative Poisson’s ratio. Science 1992, 257, 31. [Google Scholar] [CrossRef] [PubMed]
- Wang, X.T.; Wang, B.; Wen, Z.H.; Ma, L. Fabrication and mechanical properties of CFRP composite three-dimensional double-arrow-head auxetic structures. Compos. Sci. Technol. 2018, 164, 92–102. [Google Scholar] [CrossRef]
- Yang, L.; Harrysson, O.; West, H.; Coemier, D. Mechanical properties of 3D re-entrant honeycomb auxetic structures realized via additive manufacturing. Int. J. Solids Struct. 2015, 69, 475–490. [Google Scholar] [CrossRef]
- Novak, N.; Starčevič, L.; Vesenjak, M.; Ren, Z.; Vesenjaka, M. Blast response study of the sandwich composite panels with 3D chiral auxetic core. Compos. Struct. 2019, 210, 167–178. [Google Scholar] [CrossRef]
- Dudek, K.K.; Gatt, R.; Mizzi, L.; Dudek, M.R.; Attard, D.; Evans, K.E.; Grima, J.N. On the dynamics and control of mechanical properties of hierarchical rotating rigid unit auxetics. Sci. Rep. 2017, 7, 46529. [Google Scholar] [CrossRef]
- Zhang, X.; Ding, H.; An, L.; Wang, X. Numerical investigation on dynamic crushing behavior of auxetic honeycombs with various cell–wall angles. Adv. Mech. Eng. 2015, 7, 679678. [Google Scholar] [CrossRef]
- Scarpa, F.; Pastorino, P.; Garelli, A.; Patsias, S.; Ruzzene, M. Auxetic compliant flexible PU foams: static and dynamic properties. Phys. Status Solidi B 2005, 242, 681–694. [Google Scholar] [CrossRef]
- Scarpa, F.; Yates, J.R.; Ciffo, L.G.; Patsias, S. Dynamic crushing of auxetic open-cell polyurethane foam. Proc. Inst. Mech. Eng. Part C J. Mech. Eng. Sci. 2002, 216, 1153–1156. [Google Scholar] [CrossRef]
- Allen, T.; Shepherd, J.; Hewage, T.A.M.; Senior, T.; Foster, L.; Alderson, A. Low-kinetic energy impact response of auxetic and conventional open-cell polyurethane foams. Phys. Status Solidi B 2015, 252, 1631–1639. [Google Scholar] [CrossRef]
- Lim, T.; Alderson, A.; Alderson, K. Experimental studies on the impact properties of auxetic materials. Phys. Status Solidi B 2014, 251, 307–313. [Google Scholar] [CrossRef]
- Yang, E.C.; Ruan, D.; Tran, P.; Ngo, T.D. Impact resistance and failure analysis of plain woven curtains. Int. J. Prot. Struct. 2015, 6, 113–136. [Google Scholar] [CrossRef]
- Hou, Y.; Neville, R.; Scarpa, F.; Remillat, C.; Gu, B.; Ruzzene, M. Graded conventional-auxetic Kirigami sandwich structures: Flatwise compression and edgewise loading. Compos. Part B Eng. 2014, 59, 33–42. [Google Scholar] [CrossRef]
- Schenk, M.; Guest, S.; Mcshane, G. Novel stacked folded cores for blast-resistant sandwich beams. Int. J. Solids Struct. 2014, 51, 4196–4214. [Google Scholar] [CrossRef]
- Lira, C.; Innocenti, P.; Scarpa, F. Transverse elastic shear of auxetic multi re-entrant honeycombs. Compos. Struct. 2009, 90, 314–322. [Google Scholar] [CrossRef]
- Evans, K.E.; Alderson, A. Auxetic materials: Functional materials and structures from lateral thinking! Adv. Mater. 2000, 12, 617–628. [Google Scholar] [CrossRef]
- Scarpa, F.; Blain, S.; Lew, T.; Perrott, D.; Ruzzene, M.; Yates, J. Elastic buckling of hexagonal chiral cell honeycombs. Compos. Part A Appl. Sci. Manuf. 2007, 38, 280–289. [Google Scholar] [CrossRef]
- Miller, W.; Smith, C.; Evans, K. Honeycomb cores with enhanced buckling strength. Compos. Struct. 2011, 93, 1072–1077. [Google Scholar] [CrossRef]
- Liu, W.; Wang, N.; Luo, T.; Lin, Z.; Qiong, Z. In-plane dynamic crushing of re-entrant auxetic cellular structure. Mater. Des. 2016, 100, 84–91. [Google Scholar] [CrossRef]
- Scarpa, F.; Ciffo, L.G.; Yates, J.R. Dynamic properties of high structural integrity auxetic open cell foam. Smart Mater. Struct. 2003, 13, 49–56. [Google Scholar] [CrossRef]
- Grujicic, M.; Galgalikar, R.; Snipes, J.; Yavari, R.; Ramaswami, S. Multi-physics modeling of the fabrication and dynamic performance of all-metal auxetic-hexagonal sandwich-structures. Mater. Des. 2013, 51, 113–130. [Google Scholar] [CrossRef]
- Imbalzano, G.; Tran, P.; Ngo, T.D.; Lee, P.V.; Lee, P.V.S. A numerical study of auxetic composite panels under blast loadings. Compos. Struct. 2016, 135, 339–352. [Google Scholar] [CrossRef]
- Pikhitsa, P.V.; Choi, M.; Kim, H.J.; Ahn, S.H. Auxetic lattice of multipods. Phys. Status Solidi B 2009, 246, 2098–2101. [Google Scholar] [CrossRef]
- Hughes, T.; Marmier, A.; Evans, K. Auxetic frameworks inspired by cubic crystals. Int. J. Solids Struct. 2010, 47, 1469–1476. [Google Scholar] [CrossRef]
- Bückmann, T.; Stenger, N.; Kadic, M.; Kaschke, J.; Frölich, A.; Kennerknecht, T.; Eberl, C.; Thiel, M.; Wegener, M. Tailored 3D mechanical metamaterials made by dip-in direct-laser-writing optical lithography. Adv. Mater. 2012, 24, 2710–2714. [Google Scholar] [CrossRef]
- Lee, J.H.; Singer, J.P.; Thomas, E.L. Micro-/Nanostructured Mechanical Metamaterials. Adv. Mater. 2012, 24, 4782–4810. [Google Scholar] [CrossRef]
- Côté, F.; Deshpande, V.; Fleck, N.; Evans, A.; Deshpande, V. The out-of-plane compressive behavior of metallic honeycombs. Mater. Sci. Eng. A 2004, 380, 272–280. [Google Scholar] [CrossRef]
- Wang, K.; Chang, Y.H.; Chen, Y.; Zhang, C.; Wang, B. Designable dual-material auxetic metamaterials using three-dimensional printing. Mater. Des. 2015, 67, 159–164. [Google Scholar] [CrossRef]
- Shen, J.; Zhou, S.; Huang, X.; Xie, Y.M. Simple cubic three-dimensional auxetic metamaterials. Phys. Status Solidi B 2014, 251, 1515–1522. [Google Scholar] [CrossRef]
- Critchley, R.; Stokes, K.R.; Corni, I.; Wharton, J.A.; Walsh, F.C.; Wood, R.J.K. The preparation of auxetic foams by three-dimensional printing and their characteristics. Adv. Eng. Mater. 2013, 15, 980–985. [Google Scholar] [CrossRef]
- Ajdari, A.; Nayeb-Hashemi, H.; Vaziri, A. Dynamic crushing and energy absorption of regular, irregular and functionally graded cellular structures. Int. J. Solids Struct. 2011, 48, 506–516. [Google Scholar] [CrossRef]
- Zheng, Z.; Yu, J.; Li, J. Dynamic crushing of 2D cellular structures: A finite element study. Int. J. Impact Eng. 2005, 32, 650–664. [Google Scholar] [CrossRef]
- Greaves, G.N.; Greer, A.L.; Lakes, R.S.; Rouxel, T. Poisson’s ratio and modern materials. Nat. Mater. 2011, 10, 823–837. [Google Scholar] [CrossRef] [PubMed]
- Wu, W.; Song, X.; Liang, J.; Xia, R.; Qian, G.; Fang, D. Mechanical properties of anti-tetrachiral auxetic stents. Compos. Struct. 2018, 185, 381–392. [Google Scholar] [CrossRef]
- Alderson, K.L.; Coenen, V.L. The low velocity impact response of auxetic carbon fibre laminates. Phys. Status Solidi B 2008, 245, 489–496. [Google Scholar] [CrossRef]
- Coenen, V.L.; Alderson, K.L. Mechanisms of failure in the static indentation resistance of auxetic carbon fibre laminates. Phys. Status Solidi B 2011, 248, 66–72. [Google Scholar] [CrossRef]
- Johnson, G.R.; Cook, W.H. A constitutive model and data for metals subjected to large strains, high strain rates and high temperatures. In Proceedings of the 7th International Symposium on Ballistics, Hague, The Netherlands, 19–21 April 1983; pp. 541–547. [Google Scholar]
- Johnson, G.R.; Cook, W.H. Fracture characteristics of three metals subjected to various strains, strain rates, temperatures and pressures. Eng. Fract. Mech. 1985, 21, 31–48. [Google Scholar] [CrossRef]
- Grązka, M.; Janiszewski, J. Identification of johnson–cook equation constants using finite element method. Eng. Trans. 2012, 60, 215–223. [Google Scholar]
- Shrot, A.; Baker, M. Determination of Johnson–Cook parameters from machining simulations. Comput. Mater. Sci. 2012, 52, 298–304. [Google Scholar] [CrossRef]
- Systèmes, D. Abaqus Documentation; Dassault Systemes Simulia Corporation: Johnston, RI, USA, 2016. [Google Scholar]
- Brar, N.S.; Joshi, V.S.; Harris, B.W.; Elert, M.; Furnish, M.D.; Anderson, W.W.; Proud, W.G.; Butler, W.T. Constitutive Model Constants for Al7075-T651 and Al7075-T6. AIP Conf. Proc. 2009, 1195, 945. [Google Scholar]
- Szymczyk, M.; Sumelka, W.; Łodygowski, T. Numerical investigation on ballistic resistance of aluminium multi-layered panels impacted by improvised projectiles. Arch. Appl. Mech. 2018, 88, 51–63. [Google Scholar] [CrossRef]
- ASM Specification Aerospace Metals. Aluminum 6063–T4. Available online: http://asm.matweb.com (accessed on 20 February 2019).
- Al-Rifaie, H.; Sumelka, W. Numerical analysis of reaction forces in blast resistant gates. Struct. Eng. Mech. 2017, 63, 347–359. [Google Scholar]
- Reid, S.; Peng, C. Dynamic uniaxial crushing of wood. Int. J. Impact Eng. 1997, 19, 531–570. [Google Scholar] [CrossRef]
- Wang, H.; Lu, Z.; Yang, Z.; Li, X. A novel re-entrant auxetic honeycomb with enhanced in-plane impact resistance. Compos. Struct. 2019, 208, 758–770. [Google Scholar] [CrossRef]
- Wang, H.; Lu, Z.; Yang, Z.; Li, X. In-plane dynamic crushing behaviors of a novel auxetic honeycomb with two plateau stress regions. Int. J. Mech. Sci. 2019, 151, 746–759. [Google Scholar] [CrossRef]


| Fixed Parameters | Variable Parameters | |
|---|---|---|
| UGAD chamber internal space 210 × 210 × 430 mm | dimensions: | Cell dimensions L1, L2, L and H while L1 = 2 L |
| Auxetic core extrusion depth = 200 mm | Cell wall thickness t | |
| Auxetic core height = 200–210 mm | Cell angle | |
| Cell wall aspect ratio = t/L = 0.10, 0.15, 0.20 | Number of layers |
| Symbol | AL Grade | Strength | Yield Point (MPa) | Applications |
|---|---|---|---|---|
| AL 1 | 7075-T6 | High | 546 | Aerospace and defence |
| AL 2 | 6061-T6 | Medium | 324 | General Structural Applications |
| AL 3 | 6063-T4 | Low | 90 | Door, windows, furniture |
| Description | Unit | AL7075−T6 [72] | AL6061−T6 [73] | AL6063−T4 [74] | |
|---|---|---|---|---|---|
| E | Modulus of Elasticity | MPa | 71.7 × 10³ | 69 × 103 | 68.9 × 10³ |
| ν | Poisson’s ratio | − | 0.33 | 0.33 | 0.33 |
| ρ | Mass density | t/mm3 | 2.81 × 10⁻⁹ | 2.703 × 10⁻⁹ | 2.703 × 10⁻⁹ |
| A | Yield Strength | MPa | 546 | 324 | 89.6 |
| B | Ultimate Strength | MPa | 678 | 113 | 172 |
| n | Work−hardening exponent | − | 0.71 | 0.42 | 0.42 |
| Reference Strain rate | s−1 | 1 × 10⁻⁴ | 1 × 10⁻⁴ | 1 × 10⁻⁴ | |
| C | Strain rate factor | − | 0.024 | 0.002 | 0.002 |
| Critical Damage | − | 0.3 | 0.3 | 0.3 | |
| Damage threshold | − | 0 | 0 | 0 | |
| Specific heat | mm2 k/s2 | 960 × 106 | 910 × 106 | 910 × 106 | |
| χ | Inelastic heat fraction | − | 0.9 | 0.9 | 0.9 |
| Melting Temperature | k | 750 | 925 | 616 | |
| Room Temperature | k | 293 | 293.2 | 293.2 | |
| m | Thermal−softening exponent | − | 1.56 | 1.34 | 1.34 |
| − | − | −0.068 | −0.77 | −0.77 | |
| − | − | 0.451 | 1.45 | 1.45 | |
| − | − | −0.952 | 0.47 | 0.47 | |
| − | − | −0.036 | 0.00314 | 0.00314 | |
| − | − | 0.697 | 1.6 | 1.6 |
| Time (s) | Direction D1 | Direction D2 |
|---|---|---|
| 0 |  |  |
| 0.001 |  |  |
| 0.002 |  |  |
| 0.003 |  |  |
| 0.004 |  |  |
| A | B | C | |
|---|---|---|---|
| Shape |  |  |  |
| L | 5 | 10 | 15 |
| t | 1 | 2 | 3 |
| Total Length | 208 | 208 | 208 |
| Total Height | 205 | 200 | 210 |
| No. of Layers | 24 × 27 | 12 × 13 | 8 × 9 |
| Mass (kg) | 7.212 | 7.158 | 7.639 |
| Fixed Factors | = 60°, t/L = 0.2, Extrusion depth = 200 mm, pulse load 500,000 N in 0.002 s | ||
| Angle = 45° | Angle = 60° | Angle = 75° | |
|---|---|---|---|
| Shape |  |  |  |
| Total Length | 198 | 208 | 193 |
| Total Height | 201 | 200 | 194 |
| No. of Layers | 14 × 15 | 12 × 13 | 10 × 11 |
| Mass (kg) | 12.4 | 9.3 | 6.6 |
| Fixed Parameters | Loading direction D1, Cell dimension B (L = 10 mm), Grade AL3, t = 2.6 mm, t/L = 0.26, Extrusion depth = 200 mm, pulse load 500,000 N in 0.002 s | ||
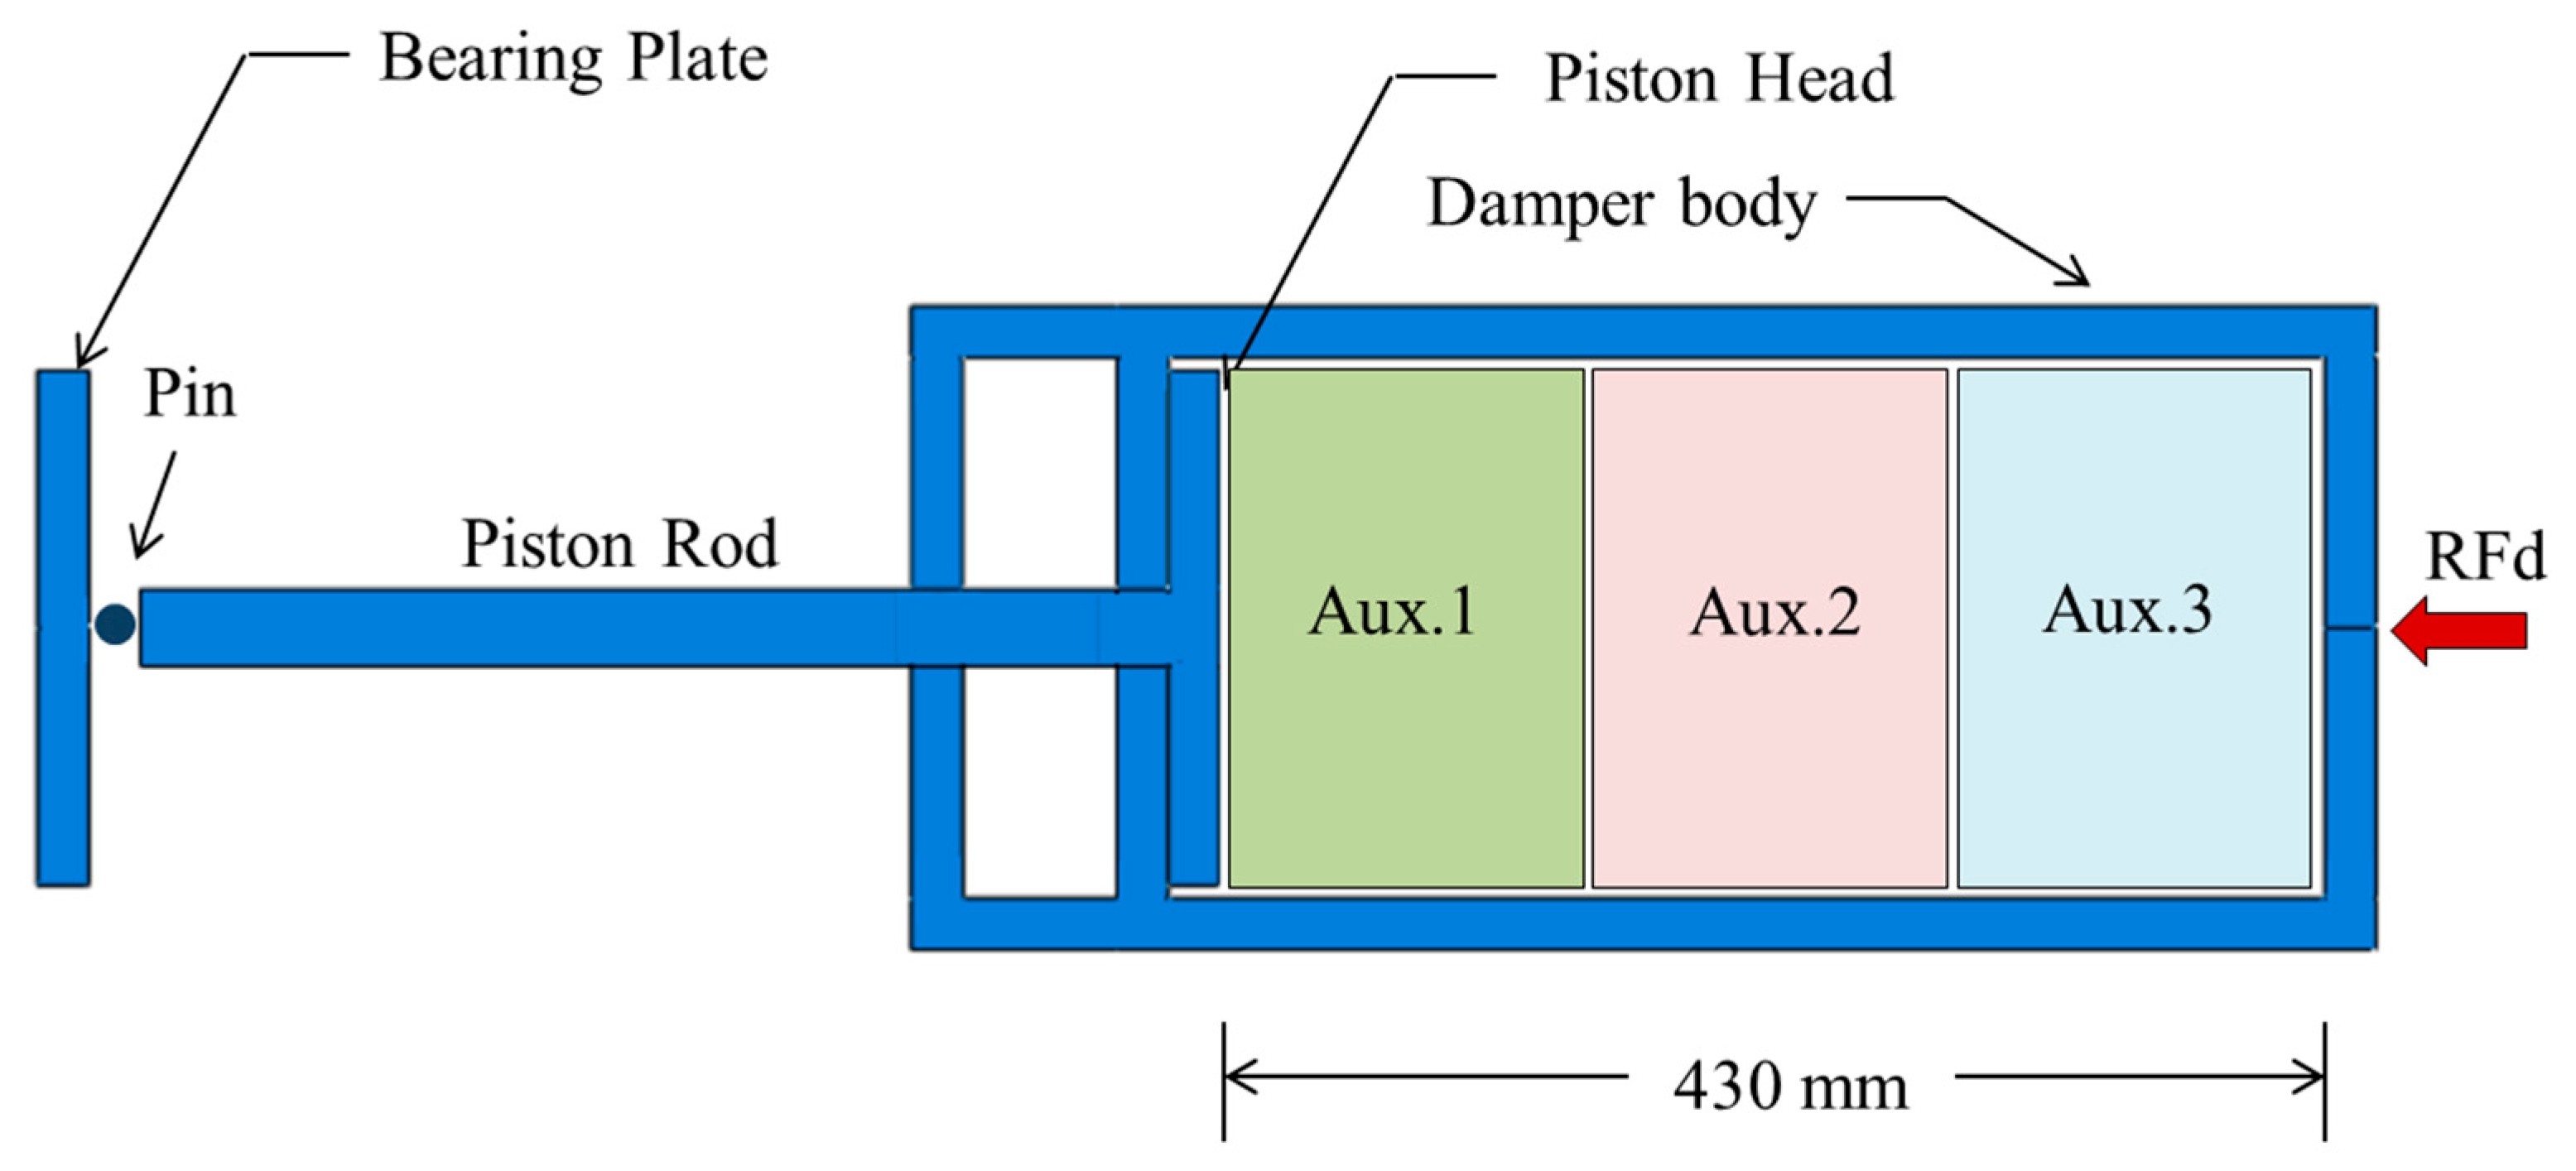
| Aux.1 | Aux.2 | Aux.3 | |
|---|---|---|---|
| Shape |  |  |  |
| Shared Parameters | L = 10 mm, cell angle = 60°, Grade AL3 (= 2.703 × t/mm3), Size = 140 × 200 × 200 mm, volume of one core V = 5.6 × 106 mm3 | ||
| t(mm) | 1.4 | 1.8 | 2.2 |
| t/L | 0.14 | 0.18 | 0.22 |
| Mass (ton) | 0.00338 | 0.00434 | 0.00530 |
| Mass (kg) | 3.38 | 4.34 | 5.30 |
| Density (t/mm3) | 6.036 × 10⁻¹⁰ | 7.75 × 10⁻¹⁰ | 9.46 × 10⁻¹⁰ |
| Relative Density | 0.223 | 0.287 | 0.35 |
| Void Ratio % | 77.7 | 71.3 | 65 |
© 2019 by the authors. Licensee MDPI, Basel, Switzerland. This article is an open access article distributed under the terms and conditions of the Creative Commons Attribution (CC BY) license (http://creativecommons.org/licenses/by/4.0/).
Share and Cite
Al-Rifaie, H.; Sumelka, W. The Development of a New Shock Absorbing Uniaxial Graded Auxetic Damper (UGAD). Materials 2019, 12, 2573. https://doi.org/10.3390/ma12162573
Al-Rifaie H, Sumelka W. The Development of a New Shock Absorbing Uniaxial Graded Auxetic Damper (UGAD). Materials. 2019; 12(16):2573. https://doi.org/10.3390/ma12162573
Chicago/Turabian StyleAl-Rifaie, Hasan, and Wojciech Sumelka. 2019. "The Development of a New Shock Absorbing Uniaxial Graded Auxetic Damper (UGAD)" Materials 12, no. 16: 2573. https://doi.org/10.3390/ma12162573
APA StyleAl-Rifaie, H., & Sumelka, W. (2019). The Development of a New Shock Absorbing Uniaxial Graded Auxetic Damper (UGAD). Materials, 12(16), 2573. https://doi.org/10.3390/ma12162573