Article

Optimization of Low-Cost Ti-35421 Titanium Alloy: Phase Transformation, Bimodal Microstructure, and Combinatorial Mechanical Properties

1
Tech Institute for Advanced Materials & College of Materials Science and Engineering, Nanjing Tech University, Nanjing 210009, China
2
School of Materials Science and Engineering, Central South University, Changsha 410083, China
*
Author to whom correspondence should be addressed.
Materials 2019, 12(17), 2791; https://doi.org/10.3390/ma12172791
Submission received: 14 August 2019 / Revised: 24 August 2019 / Accepted: 28 August 2019 / Published: 30 August 2019
(This article belongs to the Section Materials Simulation and Design)

Abstract

:
A sophisticated understanding of phase transformations and microstructure evolution is crucial in mechanical property optimization for the newly developed low-cost Ti-35421 (Ti-3Al-5Mo-4Cr-2Zr-1Fe wt.%) titanium alloy. The phase transformations in dual-phase Ti-35421 were studied by experiments and thermo-kinetic modeling. The phase transformation reactions and temperature ranges were determined as β→αlamellar [410–660 °C], αlamellar→β [660–740 °C], αlath→β [740–825 °C]. The Gibbs-Thomson effect and multicomponent diffusivities were proven to be responsible for the distinguishing behaviors of growth and dissolution between two α phases. The aging temperature of 540 °C was optimized based on calculations. It introduced a bimodal microstructure containing stubby α lamellae and β matrix. The mechanical properties of bimodal Ti-35421 were tested and compared with baseline alloy Ti-B19 and other near-β titanium alloys. The 540 °C aged alloy exhibits an optimal combination of mechanical properties with tensile strength of 1313 MPa, yield strength of 1240 MPa, elongation of 8.62%, and fracture toughness of 75.8 MPa·m1/2. The bimodal Ti-35421 shows comparable performance to Ti-B19 but has lower cost in raw materials and processing. The results also demonstrate that thermo-kinetic modeling can effectively be utilized in tailoring microstructure and enhancing mechanical properties.

1. Introduction

Near-β titanium alloys have already been applied in the aerospace industry to fabricate landing gears and engine parts [1,2,3,4,5]. However, the main impediment to the widespread use of titanium alloys is the soaring cost in raw materials and processing. The cost comprises the costly extraction of pure Ti, the multi-pass melting and thermo-mechanical processing, the high waste rate, and the expensive alloying elements like V, Nb, Mo, etc. [6,7,8,9]. Therefore, great efforts have been made to reduce the cost of titanium alloys, meanwhile to maintain or improve strength, ductility, and fracture toughness. Fe is a common element which is much cheaper than V, Nb, and Mo and has the ability to stabilize β phase. A few Fe alloyed near-β titanium alloys, such as Ti-1.5 Al-6.8 Mo-4.5 Fe, have been developed and demonstrated excellent mechanical properties [10,11,12]. Moreover, the addition of Fe facilitates thermo-mechanical processing by reducing flow stress [13], thus saves heat and electric consumption. In brief, the alloying of Fe can reduce the costs of raw materials and processing in titanium industry.
Ti-3Al-5Mo-4Cr-2Zr-1Fe (Ti-35421, wt.%) alloy was a newly developed low-cost near-β titanium alloy with Ti-3Al-5Mo-5V-4Cr-2Zr (Ti-B19, wt.%) [14] as the baseline alloy. The chemical composition of Ti-35421 was designed by replacing 5% V in Ti-B19 with 1% Fe and keeping the Mo equivalent unchanged. Due to the β-stabilizing effect, the synergy among Mo, Cr, and Fe provided solid-solution strengthening and ductility of β phase. The chemical composition of Al was unchanged to maintain the strengthening from the precipitation of α phase. Zr is neutral element which can improve hot working property of the alloy. Thus, the product prototype of Ti-35421 already has high strength of 900 to 1450 MPa, and moderate ductility of 6–15% [15]. Similar to other near-β titanium alloys, the mechanical properties of Ti-35421 fluctuated with amount and morphology of α phase, showing a large adjustable window. The industrial application of Ti-35421 alloy requires good combinatorial mechanical properties. It refers to a combination of high/acceptable strength, ductility, and fracture toughness. Solid-solution Treatment and Aging (STA) is a commonly used heat treatment in near-β titanium alloys. It consists of solid-solution treatment in the α + β phase region followed by cooling to the target temperature in the α + β phase region and then aging at the final temperature. It is capable of introducing the bimodal microstructure in which the fine lamellar α phase enhances strength [16,17]; the coarse plate or equiaxed α is beneficial to ductility [18]; and the synergy of two α phases and β matrix might boost fracture toughness [19,20]. However, the quantitative description of microstructure development and mechanical performance is still pending. A deep understanding of the phase transformations and microstructural modifications occurring during STA are thus required to allow the improvement of the mechanical performances of Ti-35421.
In this work, aging temperature in STA and combinatorial mechanical properties are optimized based on the thermo-kinetic investigation of growth and dissolution of α phases. For this purpose, the phase transformation reactions and temperature ranges in the alloy after solid-solution treatment are studied by combing dilatometry, microstructure observation, and thermo-kinetic modeling. The growth and/or dissolution behaviors of αlamellar and αlath are quantitatively described. The temperature dependent growth rate is also predicted. Whereafter, it is to observe the microstructure and test the mechanical properties of alloy aged at the selected temperature. The effect of STA aging temperature on microstructure development and mechanical properties is discussed.

2. Materials and Methods

2.1. Material

The Ti-35421 alloy ingot was fabricated by vacuum consumable arc melting three times. The raw materials were grade 0A sponge Ti (Ti wt.% > 99.8%), high purity Al (99.9 wt.%), Cr (99.9 wt.%), Fe (99.9 wt.%) and Zr (99.9 wt.%), and Al-80Mo master alloys. The chemical composition of the ingot was determined by titration. The actual chemical composition is listed in Table 1, showing small deviation from the nominal chemical composition. A slab with 74 mm in thickness was formed from the as-cast ingot via multi-pass forging in the β phase region. The forged slab was then hot rolled in the α + β phase region down to 22 mm in thickness. It was confirmed by the metallographic method that the β-transus temperature was approximately 815 ± 10 °C. The obtained rolled sheet was subjected to solid-solution treatment at 780 °C for 1 h followed by air cooling to obtain a dual-phase microstructure of β + αlath. This preset microstructure was employed as initial microstructure in this work. The chemical compositions of β and αlath phases were detected by an Electron Probe Micro-Analyzer (EPMA, JEOL JXA 8900, Tokyo, Japan).

2.2. Dilatometric Test

The temperatures of phase transformation reactions which take place in the β + αlath alloy were determined by dilatometric test on Netzsch® DIL-402C (Selb, Germany). The tests were carried out under an argon atmosphere (purity ≥ 99.99%) from room temperature to 1000 °C at a heating rate of 1 °C/min. The specimens were wire cut from the solid solution-treated alloy and polished into Ф 5 mm × 25 mm cylinders. The phase transformation temperature and length change of specimens were recorded by sensors to plot the dilatometric curve.

2.3. Heat Treatment

The specimens with initial microstructure were heat treated following two schemes for different purposes. The first scheme was continuously heating to the temperatures of the dilatometric readings with the same rate of 1 °C/min followed by a water quench. The heat-treated specimens were reserved for microstructure observation and to figure out the reactions of phase transformation corresponding to the dilatometric signals. The second scheme was 8 h aging at temperatures in different metastable phase regions followed by air cooling. It was to optimize the mechanical properties as the responses to different aging temperatures. Both heating and isothermal heat treatments were carried out in a Carbolite GVA 12/450 vacuum furnace (Hope, UK).

2.4. Microstructure Observation

The heat-treated microstructure of Ti-35421 was observed by Scanning Electron Microscopy (SEM) on NOVATM Nano SEM 230 (FEI, Hillsboro, OR, USA). The specimens for SEM observation were mechanically polished with SiC paper and diamond paste (1 μm), and then with colloidal silica (OP-S). The finished specimens showed a mirror-like surface. With the SEM images, the phase size and fraction were obtained by using Image-Pro Plus software (Media Cybernetics, Inc., Rockville, MD, USA). The phase size and fraction were repetitively measured in different areas, thus the average values of phase fraction, length, and width of lath and lamellar α phases were of statistical significance. The phase constitution were detected on the Bruker D8 (Billerica, MA, USA) X-Ray Diffractometer using Cu Kα radiation (λ = 1.5406 Å). It was operated at 40 kV, 40 mA with the scanning rate of 4°/min and 2θ range of 30°–65°.

2.5. Mechanical Properties

Ultimate tensile strength, yield tensile strength, and elongation of the alloy were examined on an ETM205D (Wance, Shenzhen, China) testing machine with a nominal strain rate of 1 mm/min at room temperature. Standard cylindrical tensile specimens were cut out parallel to the rolling direction (RD) by wire electric discharge machining, a gauge length and diameter being 100 mm and 10 mm, according to ASTM E8/E8M–09 [21]. The measurement of Mode-I fracture toughness in the condition of plane strain, KIC, was performed on an MTS 370 (Eden Prairie, MN, USA) with an electro-hydraulic servo system. The chevron-notched half compact-tension specimens with the thickness of 20 mm were wire cut with L-T (rolling-long transverse) orientations from the plates and machined as per ASTM standard E399-06 [22]. The opening direction of the pre-crack was selected paralleling to the long transverse direction, and the direction of crack propagation was paralleling to the rolling direction. The fracture toughness was calculated using the formula given in the ASTM standard E399, and the final value of mode-I fracture toughness was obtained by averaging the testing values of three measurements.

3. Results and Discussions

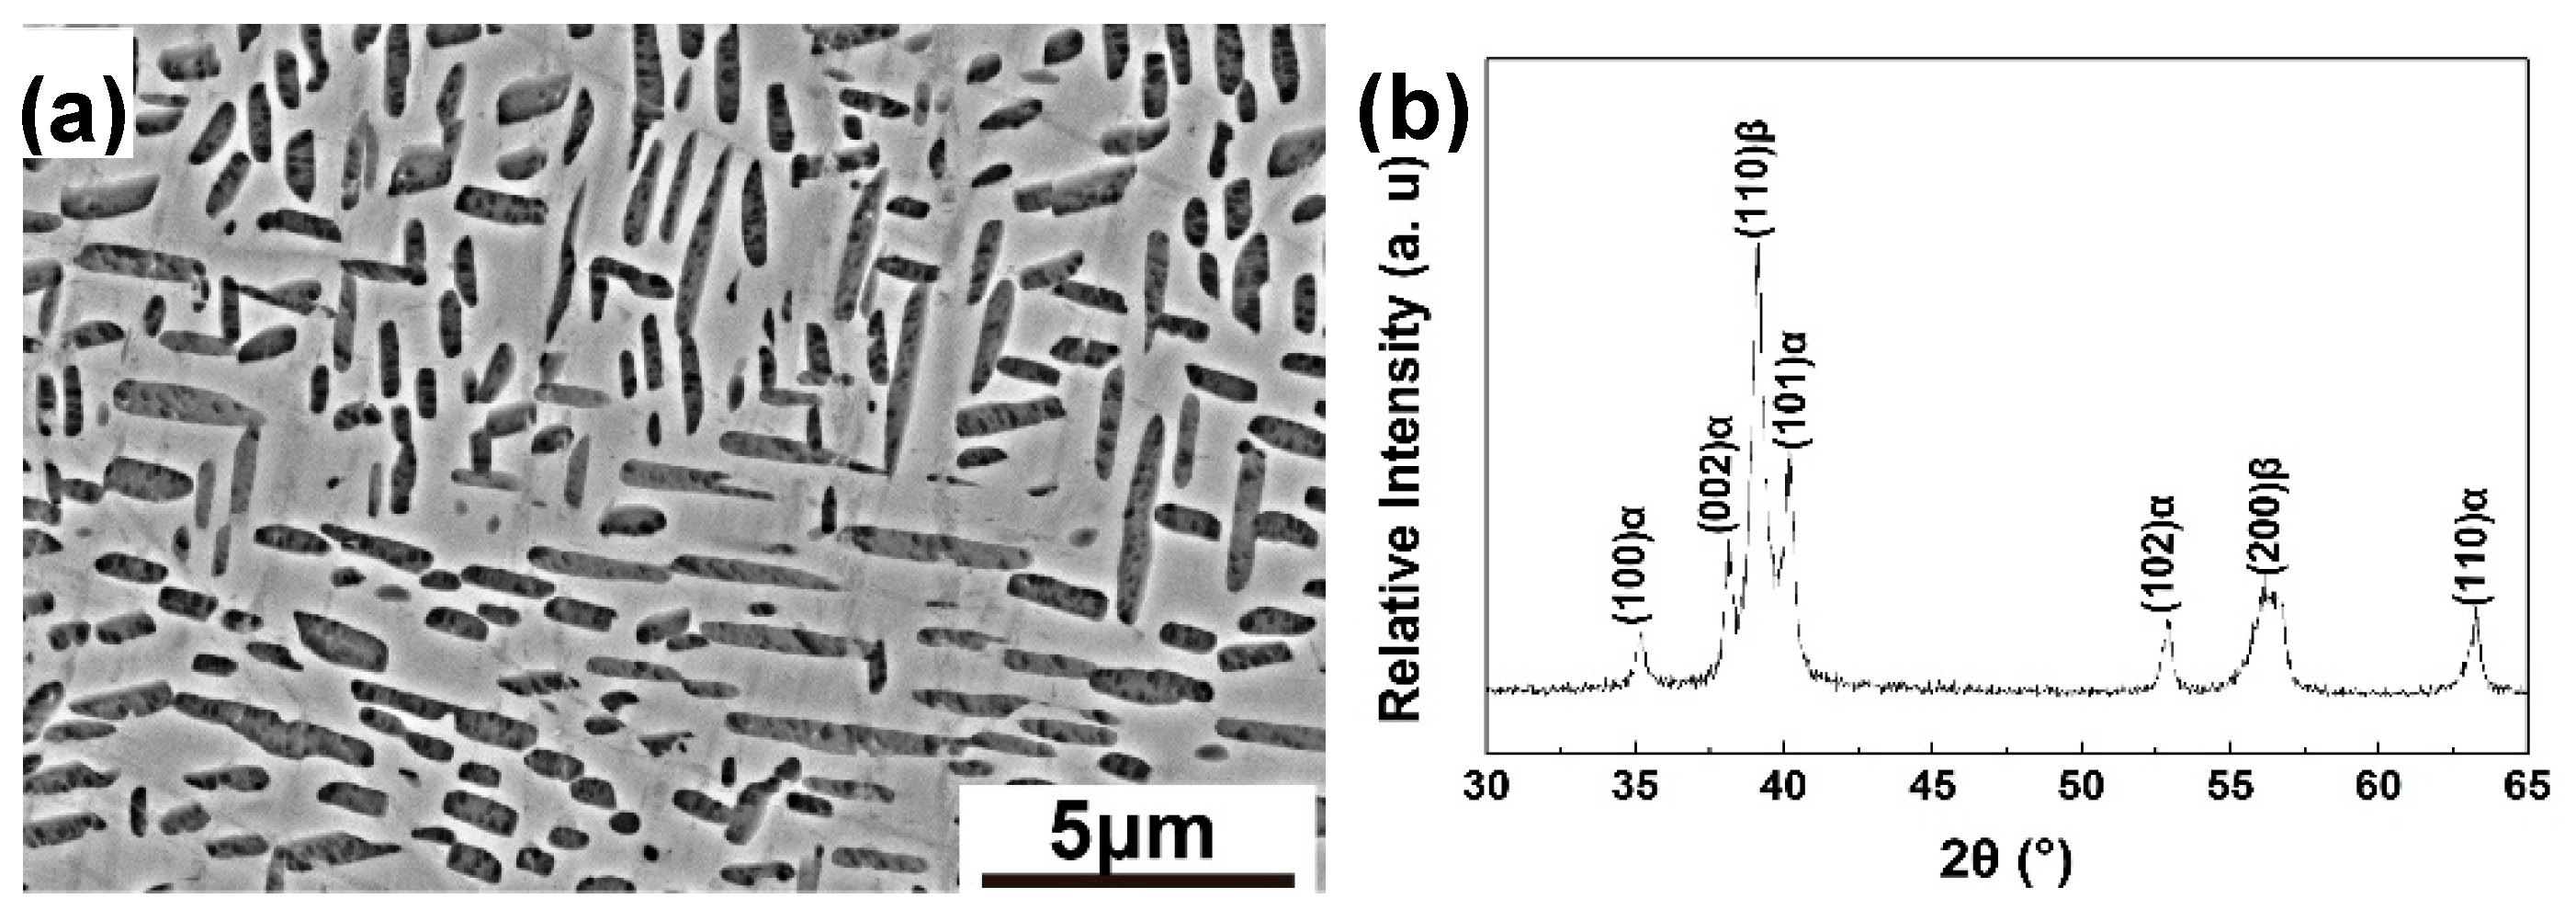
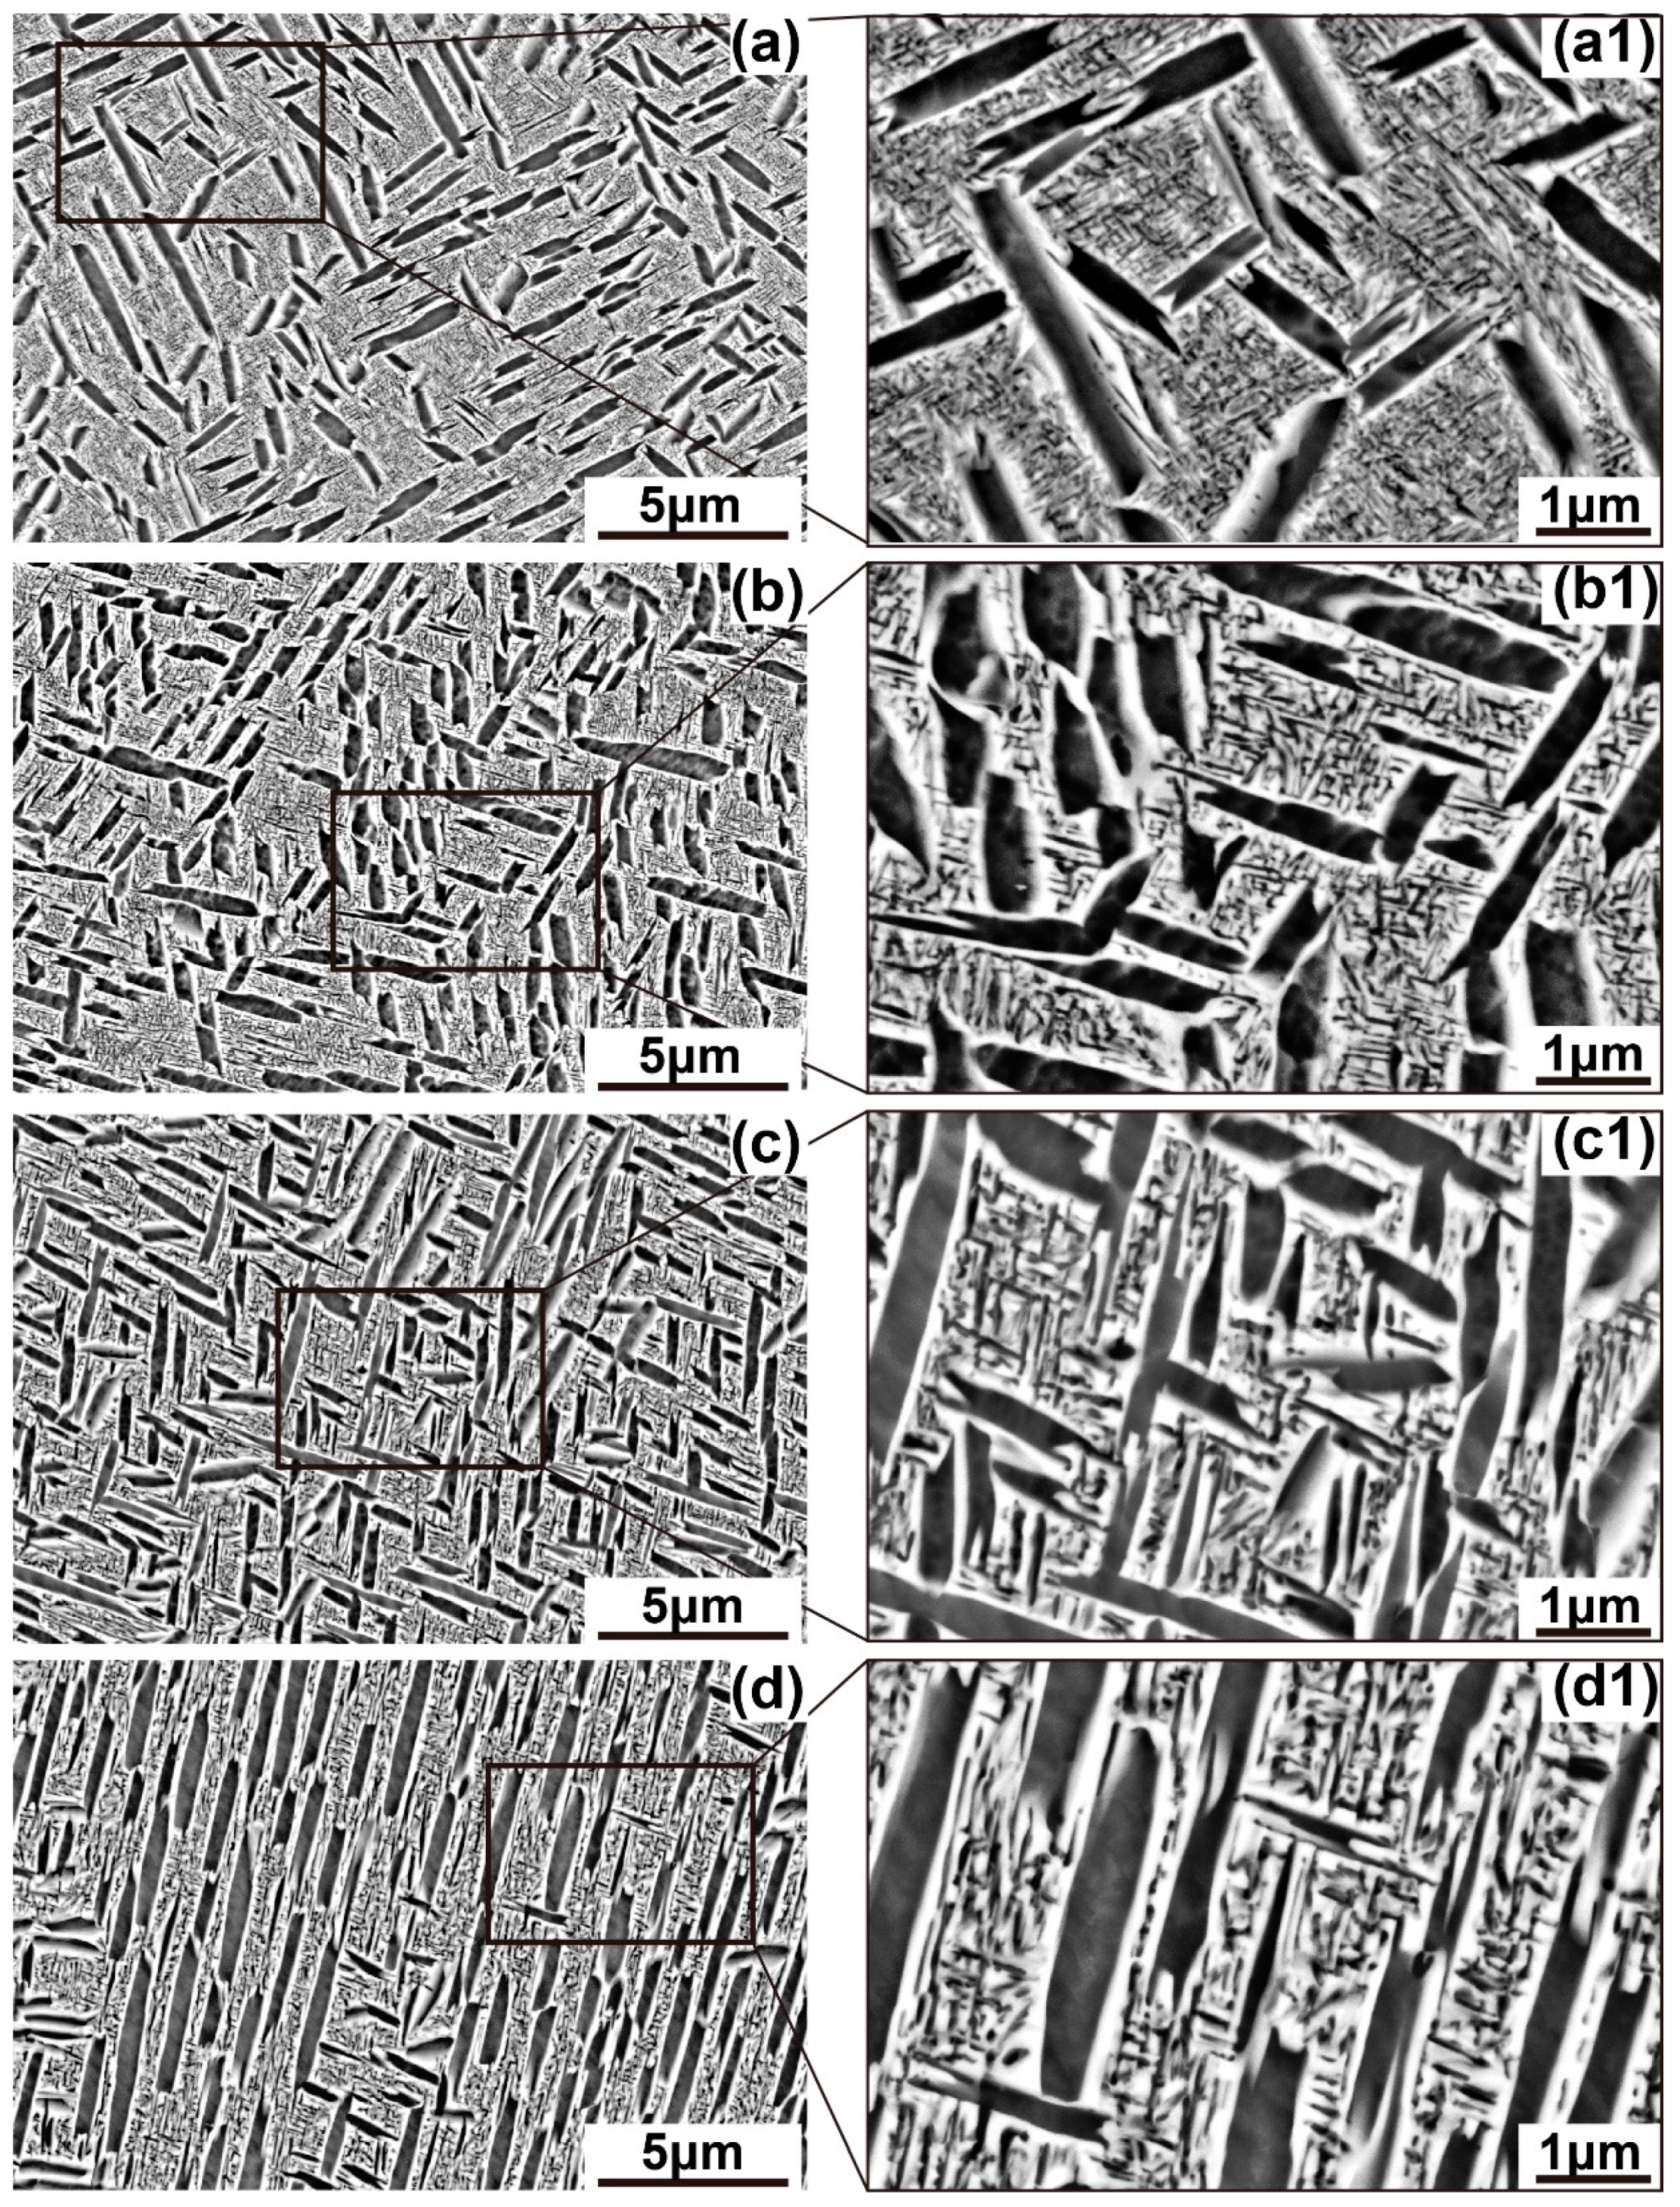
3.1. Initial Microstructure of Solid Solution Treated Alloy

The dual-phase microstructure and XRD pattern of Ti-35421 after solid-solution treatment is shown in Figure 1. The dark grey αlath phase accounting for 30.8% in volume fraction is embedded in the light grey β matrix. The αlath phase shows anisotropic morphology, with an average length of 1.37 μm and an average width of 0.42 μm. The chemical composition of β phase is Ti-4.69 Al-2.80 Mo-3.00 Cr-0.87 Zr-0.62 Fe (at. %), and that of αlath phase is Ti-5.99 Al-1.62 Mo-1.79 Cr-0.81 Zr-0.25 Fe (at. %).

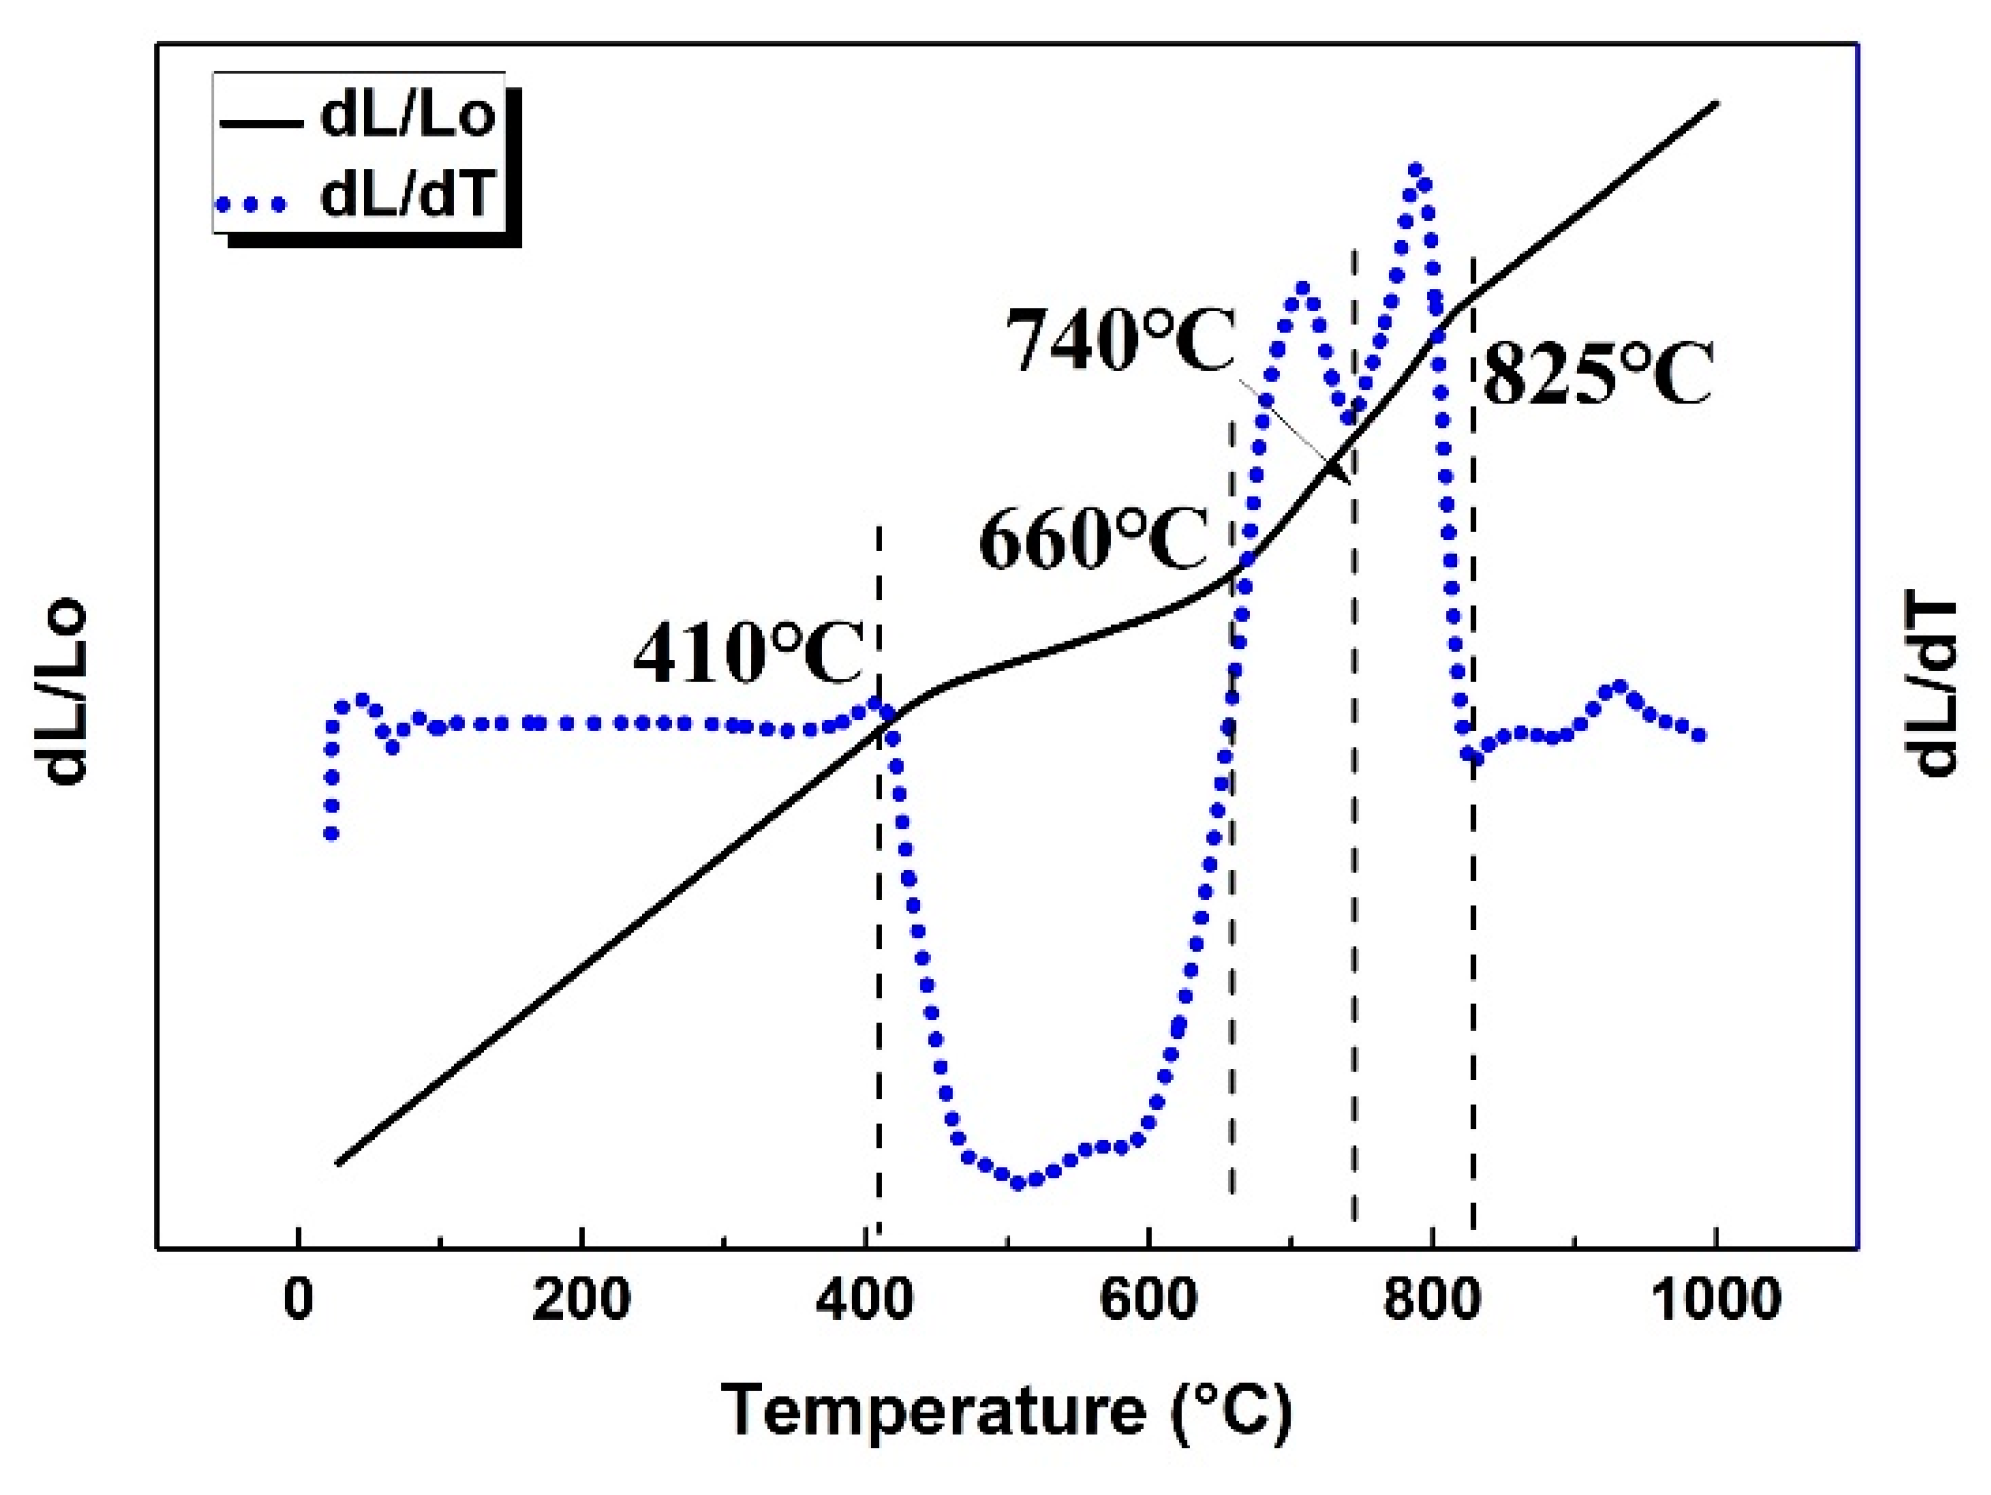
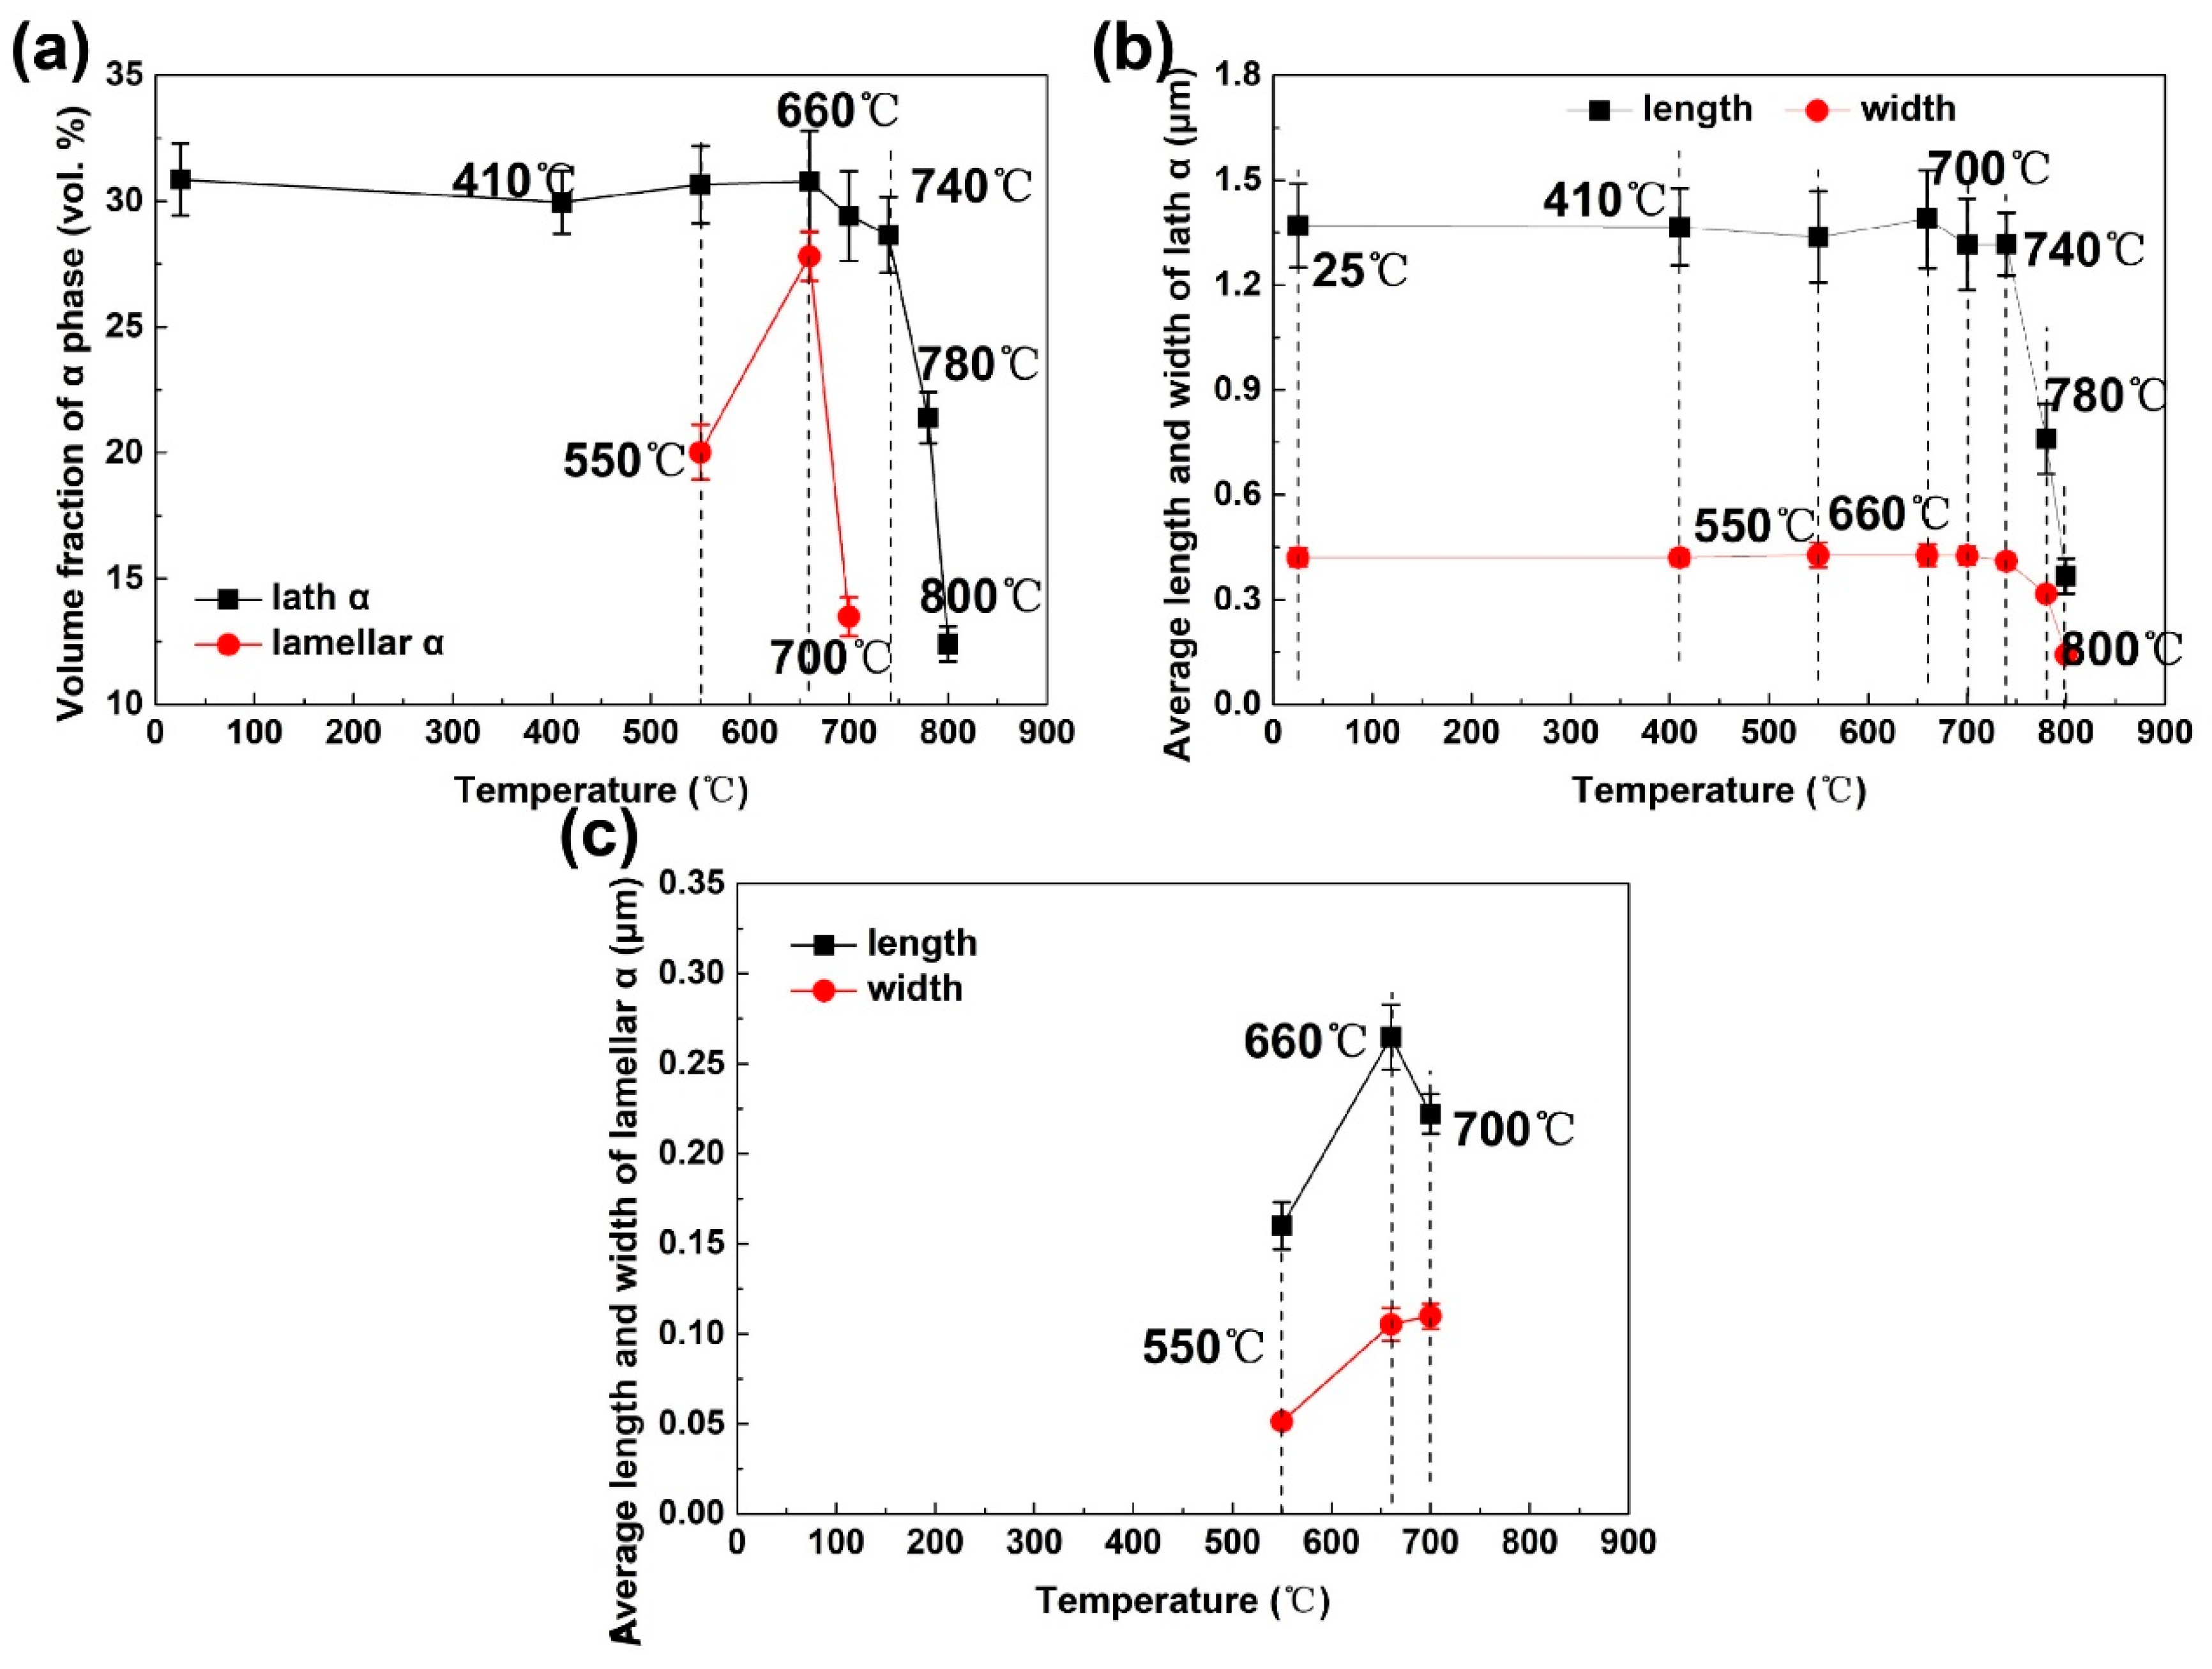
3.2. Phase Transformation Reactions and Temperature Ranges

The phase transformation reactions and their temperature ranges were determined by combining dilatometry and microstructure observation. Figure 2 shows the dilatometric curve and its derivative curve at the heating rate of 1 °C/min. There are three peaks or valleys deviating from the horizontal line of the derivative curve, which indicate the occurrence of phase transformations: (1) negative deviation from 410 to 660 °C; (2) positive deviation from 660 to 740 °C; (3) positive deviation from 740 to 825 °C.
To identify the phase transformation reactions occurring at the temperatures of dilatometric readings, the specimens were heated to 410, 550, 660, 700, 740, 780, 800, and 840 °C at 1 °C/min individually followed by quench for microstructure observation and phase identification (see Figure 3). In the SEM images, the αlath phase is almost unchanged in size and volume fraction between 410 and 740 °C (Figure 3a–d), yet undergoes dissolution from 740 to 840 °C (Figure 3e–h). There is αlamellar phase showing differences in size and volume fraction from αlath. It experienced nucleation, growth, and dissolution during the heating, indicating by the changes of lengths and widths of αlamellar. The αlamellar phase starts to precipitate in β matrix at 410 °C, followed by a growth in length and width between 550 and 660 °C (Figure 3b,c). Up to 660 °C, the αlamellar phase begins to dissolve back to β phase, exhibiting decreases in volume fraction and length as well as a slight increase in average width (Figure 3d). At 740 °C, the αlamellar phase disappears in the SEM image, indicating completion of the dissolution (Figure 3e). Above 740 °C (Figure 3f,g), the αlath shows obvious decrease in length, width, and volume fraction. It is completely dissolved back into β matrix at 840 °C (Figure 3h). The alloy thus shows a single β phase microstructure at 840 °C. The variations of average lengths, average widths, and phase fractions of αlath and αlamellar phases are summarized in Figure 4 and Table 2. Therefore, the phase transformation reactions of dual-phase Ti-35421 and their temperature ranges are determined β→αlamellar [410–660 °C], αlamellar →β [660–740 °C], αlath→β [740–825 °C].

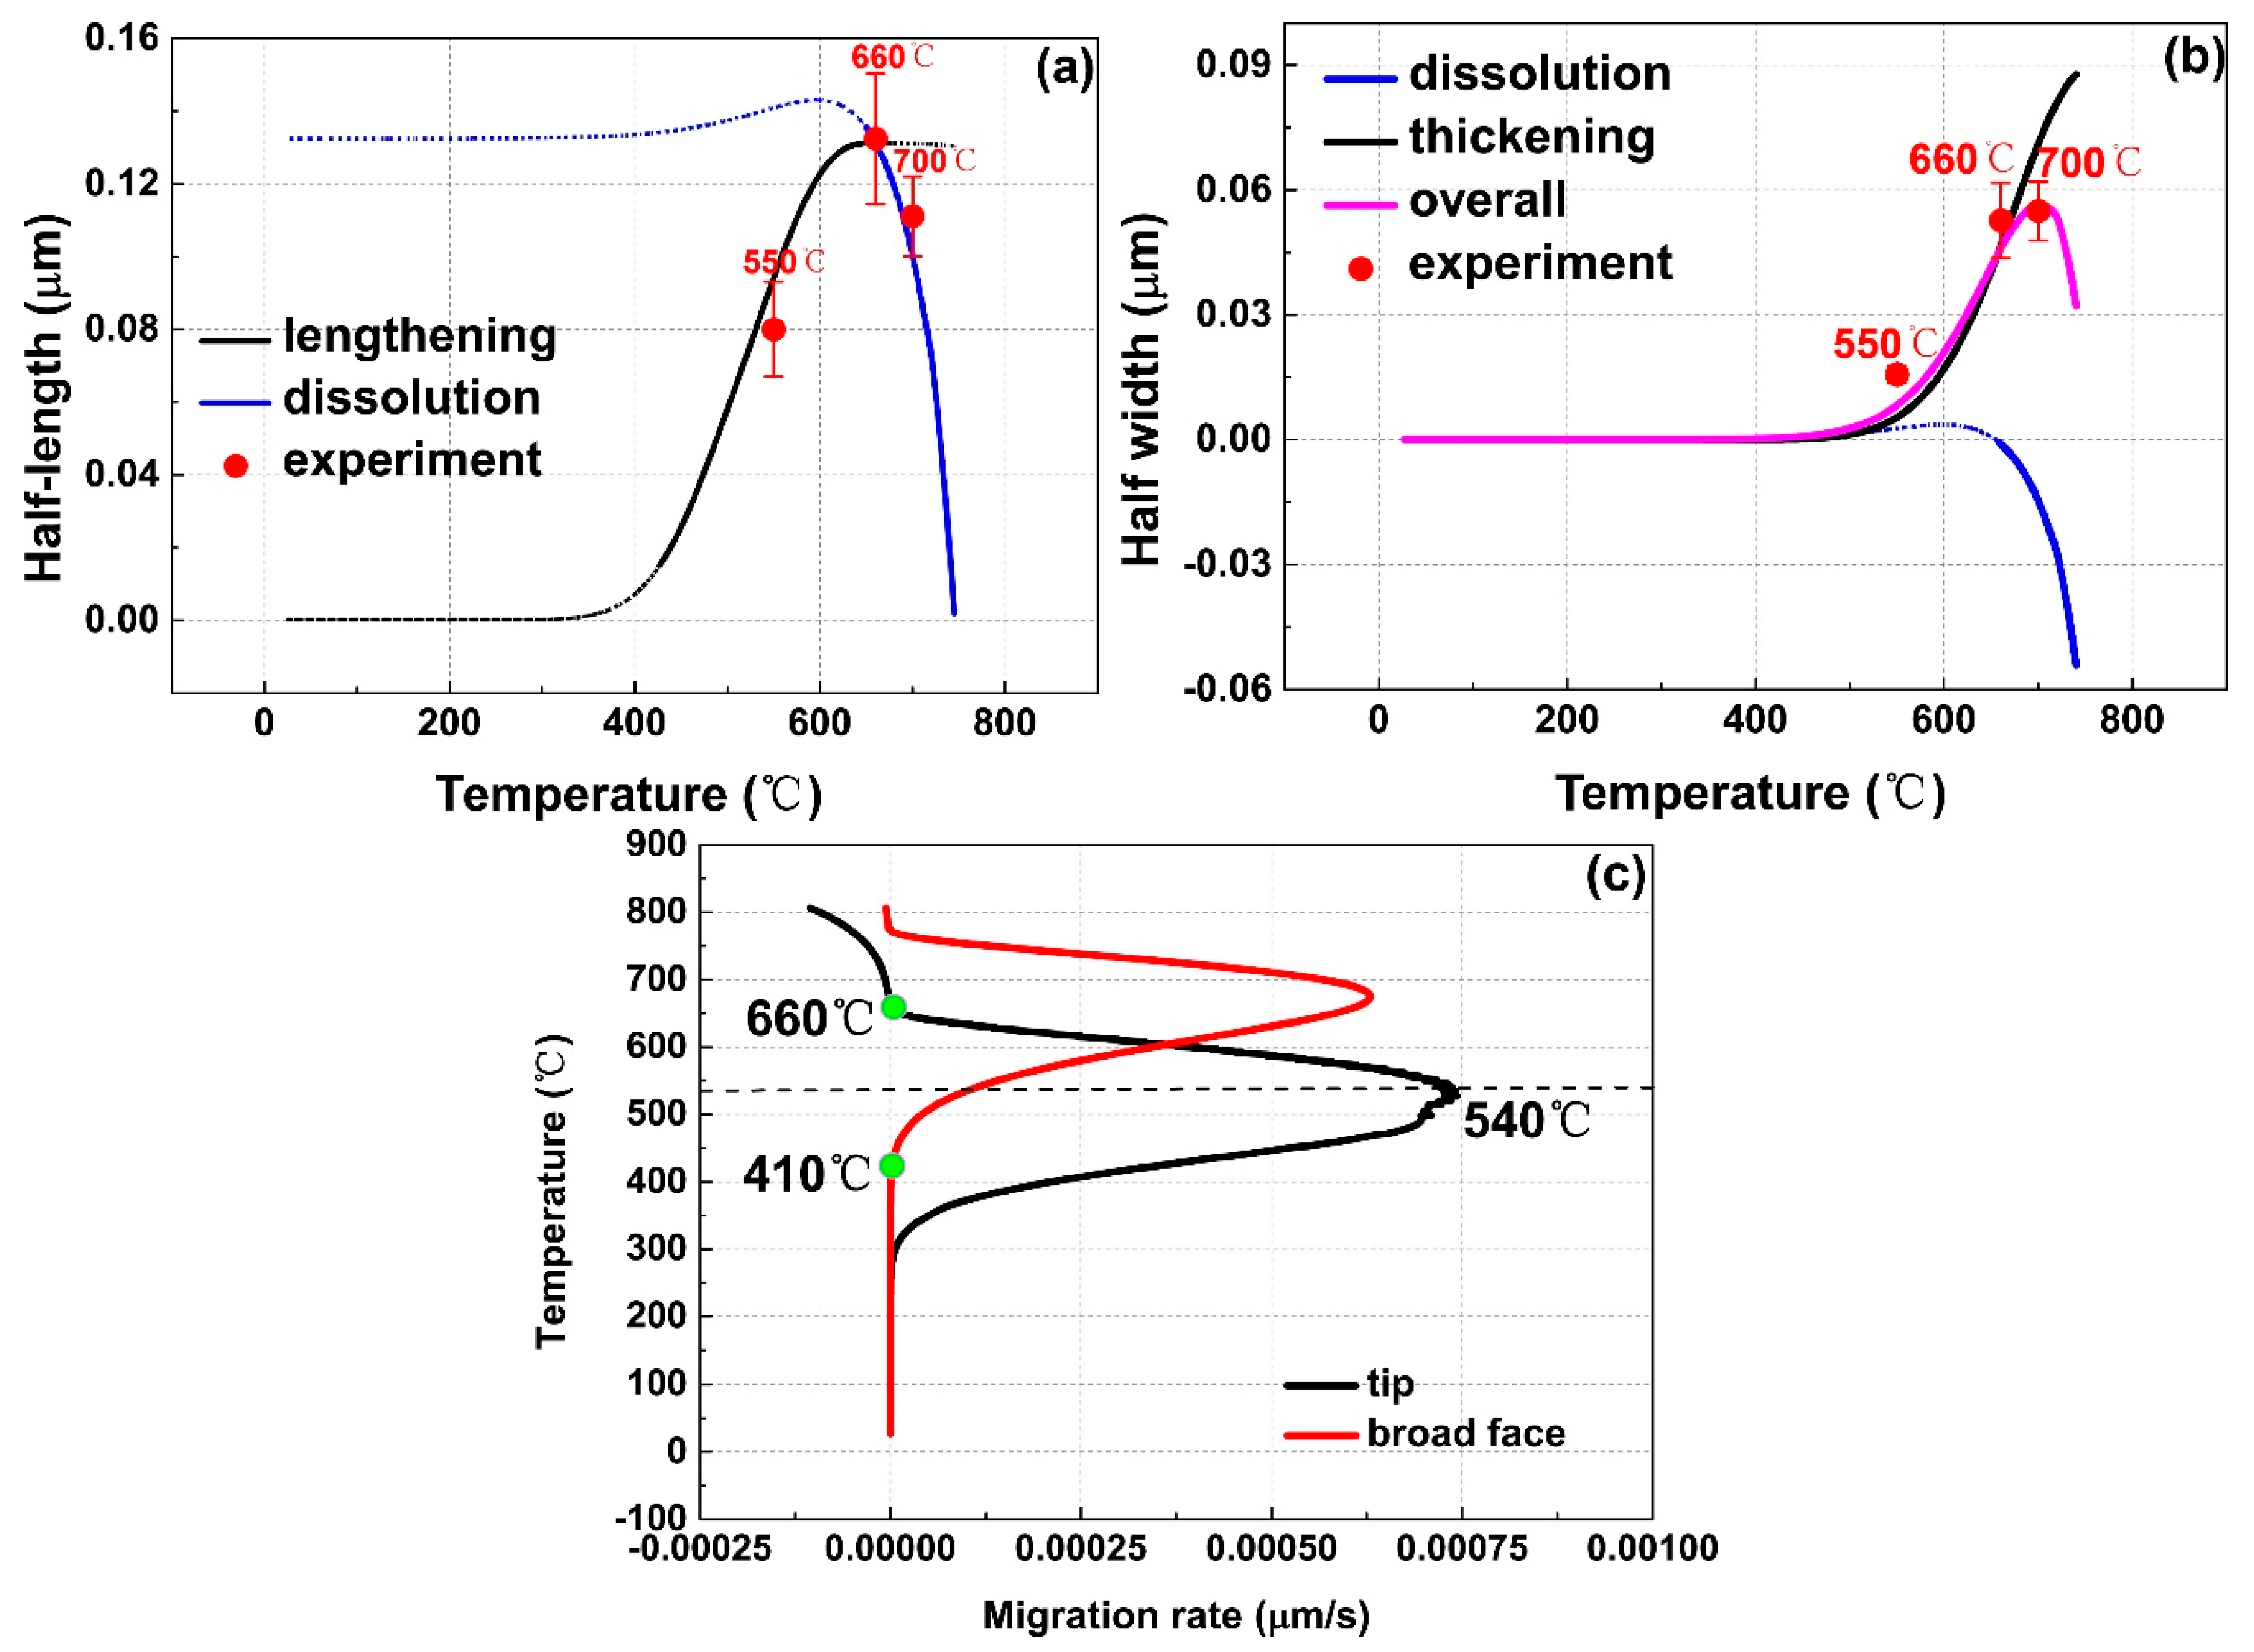
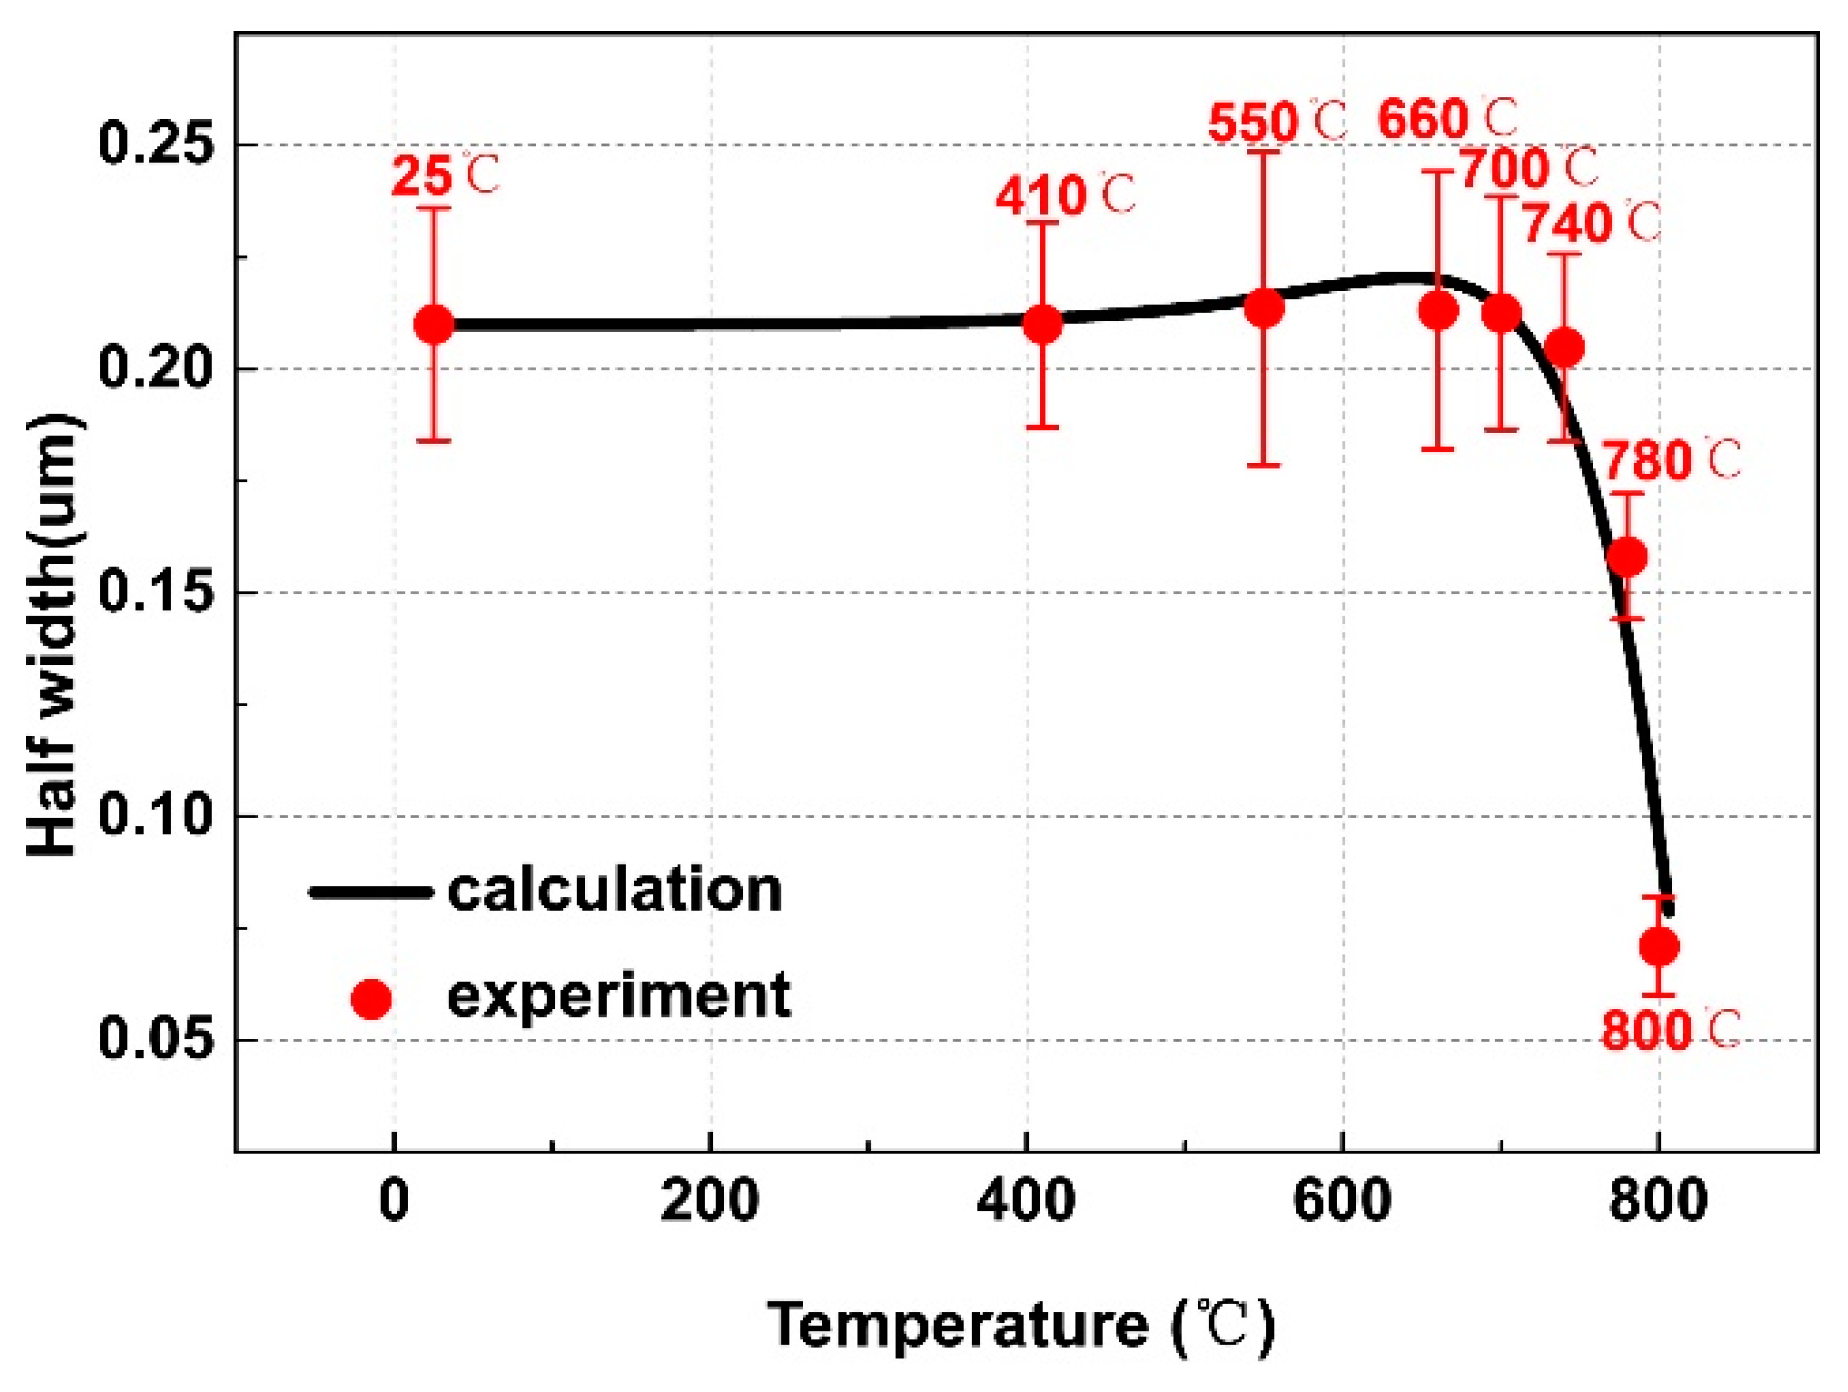
3.3. Thermo-Kinetic Modeling of Growth and Dissolution

With the discrete experimental data in Section 3.2, thermo-kinetic modeling was implemented to evaluate growth and dissolution of α phases in continuous functions, and then to determine the optimal temperature which can introduce the bimodal microstructure of αlath and dispersed αlamellar. Following the strategy of previous work of present authors [23], different models were applied to lengthening of αlamellar tip, dissolution of αlamellar tip, thickening of αlamellar (broad face of αlamellar), and dissolution of αlath (broad face of αlath) based on the following assumptions. (1) The local equilibrium condition at each time/temperature step was approximately satisfied at the interface; (2) the Gibbs-Thomson effect played a part in lengthening/dissolution of the αlamellar tip because of the tip curvature, but did not work in thickening/dissolution of the broad face. The details of the modeling can be found in Appendix A and in [24,25,26]. By selecting the appropriate diffusion coefficients from the handbook [27], the interface migration distances in calculations were compared with the experiments. Then, the interface migration rate was calculated. The specific diffusion mechanism which governed growth/dissolution of the α phases were determined.
Figure 5a shows the migration distances of αlamellar tip by using lengthening and dissolution models, individually. The sigmoid shaped curve in black predicts the lengthening of αlamellar tip, which integrated the lengthening rate based on the modified Ivantsov equation with the Gibbs-Thomson effect. The curve in blue indicates the dissolution of αlamellar tip, which was obtained by implementing an integral of Aaron’s dissolution rate equation together with the Gibbs-Thomson calibration. The two curves intersect at 661 °C, coincided with the onset dissolution temperature of αlamellar in the experiment. Thus, the curve in solid describes the real migration distances of αlamellar tip. The calculated lengthening distances are in good agreement with half values of the αlamellar length at 550, 660, and 700 °C in the experiment, considering that an α lamella has two tips. More important is that the lengthening/dissolution rate of αlamellar tip has been calculated and shown in Figure 5c, which is unable to be directly extracted from the experiment. The shape of the curve is similar to that in Porter’s textbook [25]. The low lengthening rate is attributed to the small diffusion coefficients at low temperature and the small supersaturation at high temperature. The calculated rate shows a maximum at 540 °C. It is located in the deepest valley on the derivative dilatometric curve (Figure 2). The temperature with high lengthening rate and observable thickening rate will be employed as the base to optimize the bimodal microstructure and mechanical properties in Section 3.4. Above 661 °C, the rates show negative values, indicating the occurrence of dissolution.
Figure 5b depicts thickening and shrinkage of the broad face of αlamellar. The thickening curve of the broad face (in black) shows a similar sigmoid shape as that of αlamellar tip. The difference lies in that the onset of thickening is shifted to higher temperature due to the absence of the Gibbs-Thomson effect. The interface migration distances at 550 and 660 °C predicted by the single coarsening model are good enough to be compared with half widths of αlamellar. However, it is not true for that at higher temperatures.At 700 °C, the dissolution of αlamellar tip due to the Gibbs-Thomson effect would give rise to an additional diffusion flux along the broad face. Thus, both dissolution of αlamellar tip and thickening of αlamellar broad face do substantial contributions to the formation of stubby α lamellae. The summation of both effects determines a parabolic-like kinetic curve illustrated in magenta above 660 °C. Additionally, the half-width of αlamellar phase predicted by the two-factor kinetics coincides with the experimental value at 700 °C. In Figure 5c, the lengthening/dissolution rate of αlamellar broad face also exhibits the bell shape. The difference of onset temperatures between broad face thickening and tip lengthening is more clearly shown, which is crucial in tailoring the aspect ratio of α lamella.
The dissolution of αlath broad face follows simple kinetics of planar interface due to the large curvature at the αlath tip and the negligible Gibbs-Thomson effect. Figure 6 illustrates the dissolution curve of αlath broad face. The measured average widths in the entire temperature range are well represented by the calculation.

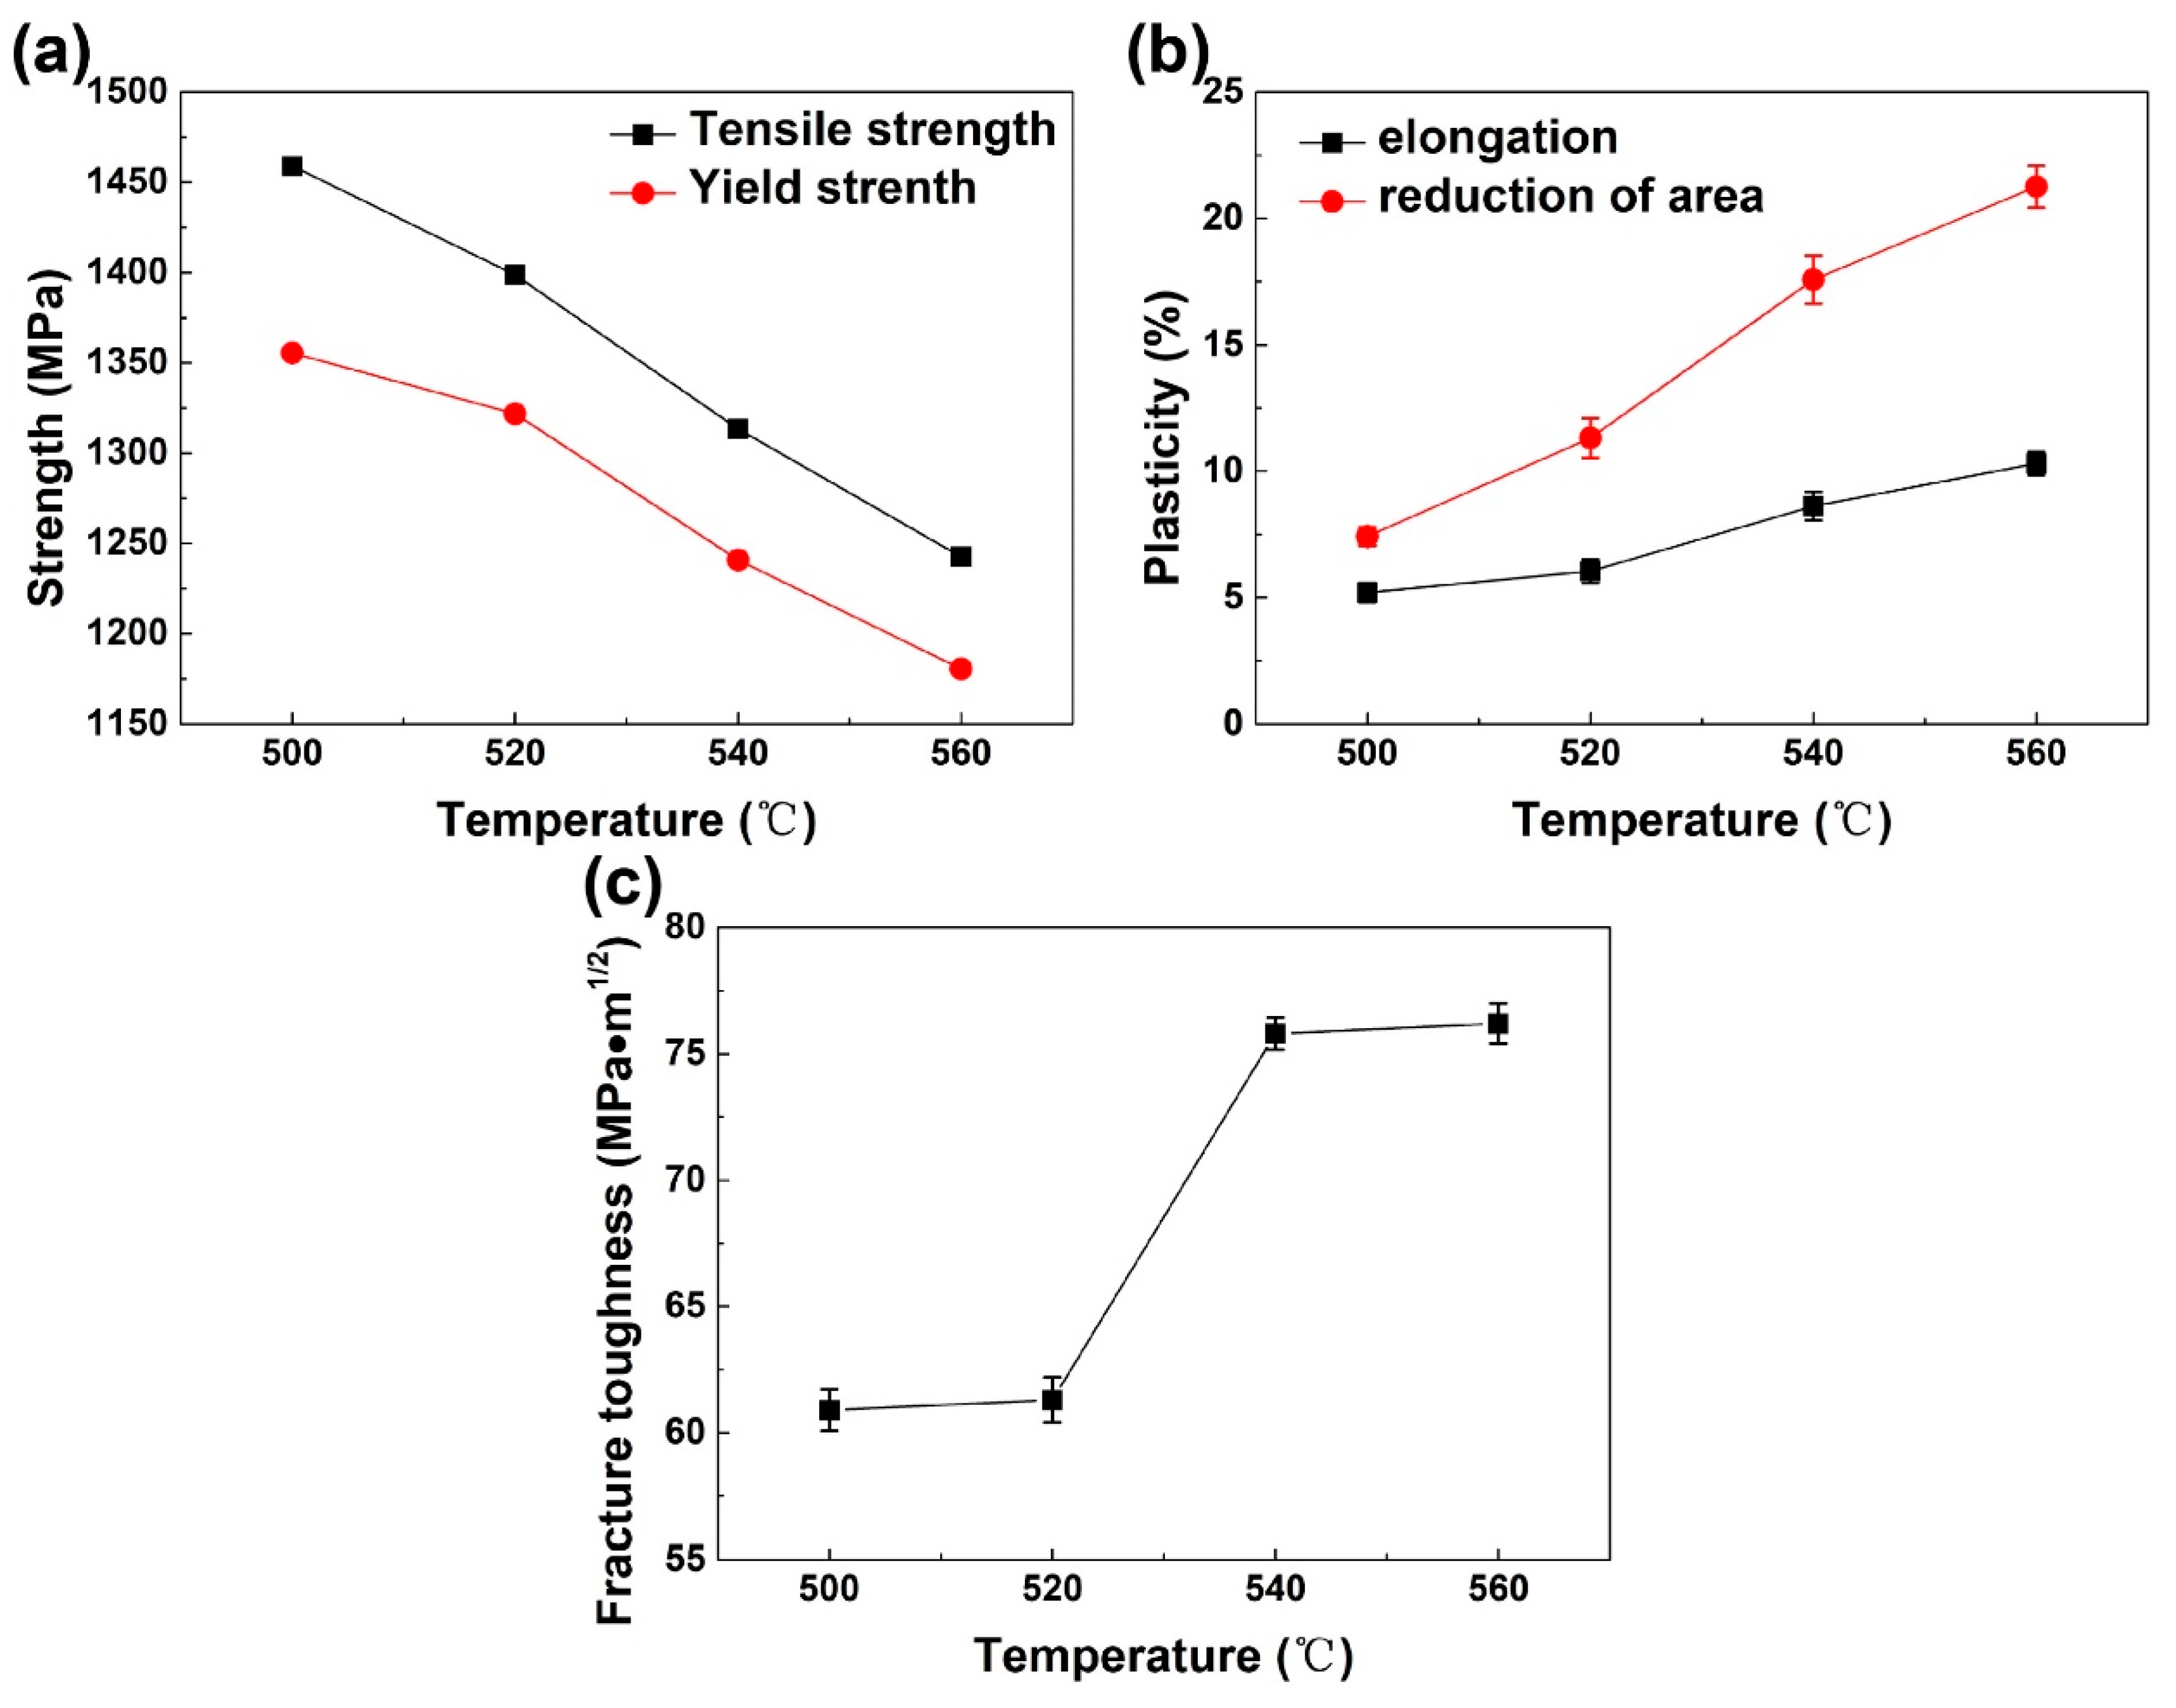
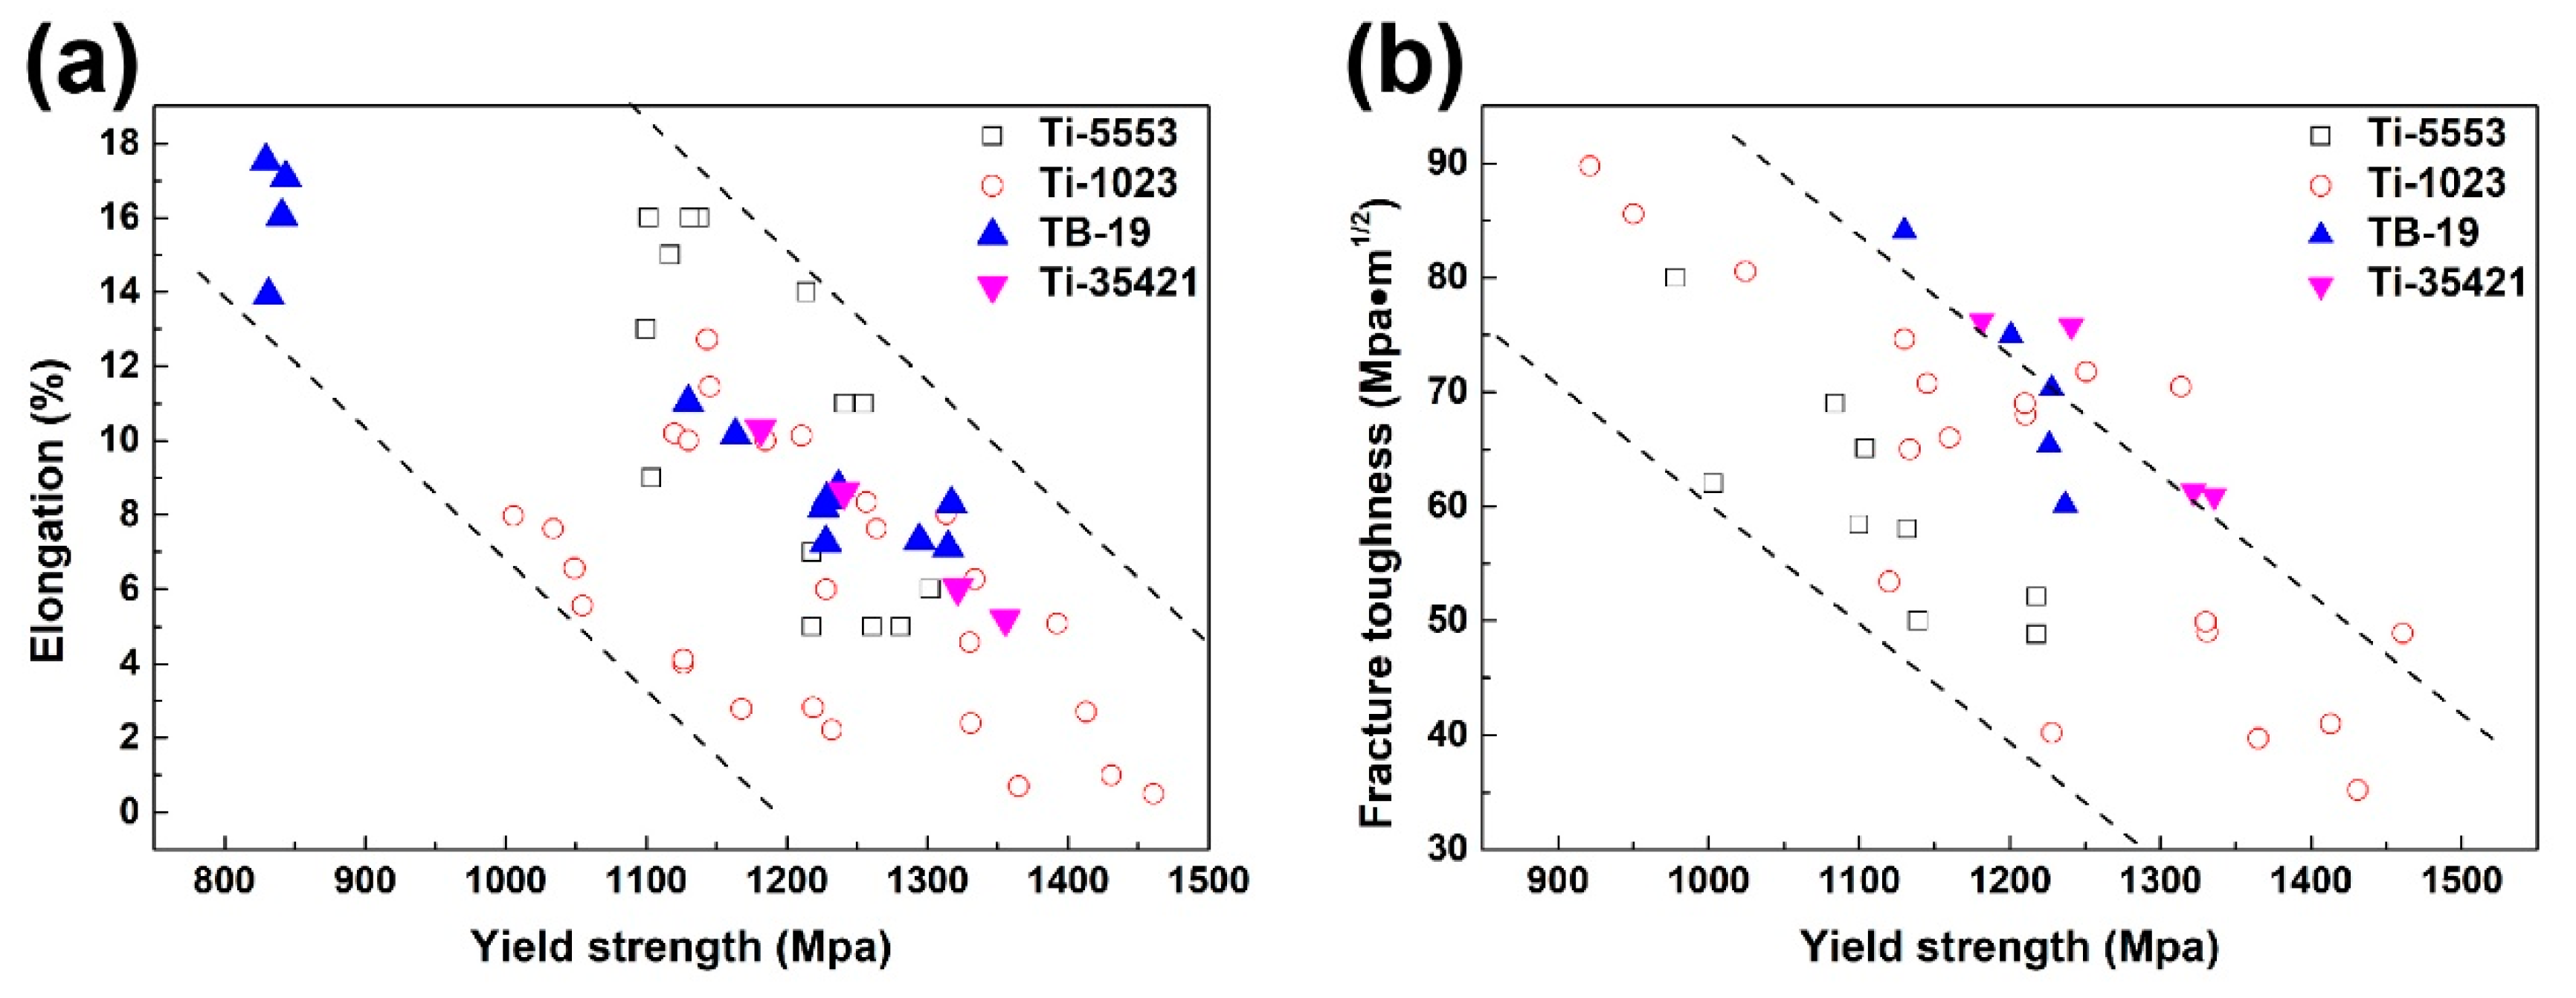
3.4. Mechanical Properties Dependent on Aging Temperature and Microstructure Features

Since the αlath phase hardly changed in the temperature range of 410–740 °C, mechanical properties optimization of the bimodal Ti-35421 alloy would mainly depend on the microstructure tailoring for the αlamellar phase. The aging temperature then plays important roles in determining αlamellar size and volume fraction. In Figure 5c, the calculated lengthening rate of αlamellar tip has the maximum value at 540 °C, and the thickening rate of αlamellar broad phase has a moderate value. It infers that aging at temperatures around 540 °C is capable of introducing more dispersed αlamellar in a shorter time. Meanwhile, αlamellar tip and broad face can grow in an appropriate velocity ratio. Therefore, the isothermal aging has been carried out at 500, 520, 540, and 560 °C, respectively, followed by the tests of mechanical properties. The aging time was set to 8 h which ensured the completion of αlamellar precipitation at all temperatures and avoided ripening as far as possible, so that the relationship between mechanical properties, microstructure features, and aging temperatures could be studied.
The bimodal microstructure of Ti-35421 after aging is displayed in Figure 7. The microstructure features of αlamellar and αlath phases were extracted from SEM images. The variations of microstructure features with aging temperatures are plotted in Figure 8; and the data are summarized in Table 3. There are only slight changes in average length, width, and volume fraction of αlath phase with the variation of aging temperatures. It is contrasted with the remarkable changes in αlamellar. The volume fraction of αlamellar precipitates decreases as the aging temperature increases. However, the average length of α lamellae is monotonically increasing from 500 °C to 560 °C. The average width of αlamellar at 500 °C is almost identical to that at 520 °C, much smaller than that at 540 °C and 560 °C.
The results of mechanical property tests demonstrate the bimodal Ti-35421 has a wide performance window by tailoring the microstructure and adjusting the aging temperatures. The ultimate tensile strength, yield tensile strength, elongation, reduction of area, and Mode I fracture toughness (KIC) can be achieved in a range of 1240.52–1459.03 MPa, 1180.40–1355.54 MPa, 5.20–10.31%, 7.42–21.26%, and 60.9–76.2 MPa·m1/2, respectively. Figure 9 depicts the mechanical property variations of aged Ti-35421 with the aging temperatures. And the data are summarized in Table 4. The trade-off between strength and plasticity is clearly shown by comparing Figure 9a,b. The tensile strength and yield strength of the bimodal alloy decrease dramatically with the increase of aging temperature. The elongation and area reductions are on the contrary, which monotonously increase along with the increased aging temperature. KIC shows different temperature dependence from other properties. It exhibits a jump from 520 to 540 °C and two platform values at 500–520 °C and 540–560 °C.
Figure 10 depicts the dependency relationships between microstructure features and mechanical properties. The more αlamellar in smaller size is beneficial to strength but reduces the performance of plasticity. The microstructure dependent KIC also exhibits an approximate step function shape on the bottom row of Figure 10. It infers that the fracture toughness of bimodal Ti-35421 is closely linked to the kinetics of αlamellar growth/dissolution at different temperatures. As is demonstrated in Figure 5c, the migration rate of αlamellar broad face is low in comparison with that of αlamellar tip at 500–520 °C. The elongated fine αlamellar might introduce the stress concentration at the lamella tips. Due to the dispersed distribution of the αlamellar, the overlap of stress concentration zones would be detrimental to the fracture toughness. Above 540 °C, the migration rate of αlamellar broad face dramatically increases, therefore, the αlamellar tip and broad face can grow in an appropriate ratio. The reduction in the aspect ratio of αlamellar results in optimum balance of strength, ductility, and fracture toughness [28]. Therefore, the optimal combinatorial mechanical performance was obtained in the alloy aged at 540 °C, especially considering the damage tolerance.The ultimate tensile strength, yield strength, elongation, reduction of area, and fracture toughness were measured 1313.39 MPa, 1240.81 MPa, 8.62%, 17.58%, and 75.8 MPa·m1/2, respectively.
Figure 11 compares the combinatorial mechanical performance of Ti-35421 at the above aging temperatures with Ti-B19 [29] and other conventional near-β Ti alloys [19,30,31,32]. Here, the combinations of elongation/yield strength and elongation/fracture toughness were selected as the representatives. Under the same performance of the yield strength, Ti-35421 is comparable to Ti-B19 in ductility and Mode I fracture toughness. It demonstrated that the substitution of Fe for V not only lowered the cost of raw materials but maintained the mechanical performances. Thus, the new developed Ti-35421 is promising in marine and aeronautic applications.

4. Conclusions

A low-cost Ti-3Al-5Mo-4Cr-2Zr-1Fe (Ti-35421) alloy was prepared with the baseline alloy of TB-19. The expensive alloying element V was substituted by the lower-priced element Fe. The phase transformations in Ti-35421 alloy with the preset microstructure of β + αlath were studied by combing experiments and thermo-kinetic modeling. The phase transformation reactions and temperature ranges were determined as (1) β→αlamellar [410–660 °C], (2) αlamellar→β [660–740 °C], (3) αlath→β [740–825 °C]. The Gibbs-Thomson effect and multicomponent diffusion coefficients played important roles in the growth/dissolution of αlamellar phase. The optimized aging temperature of 540 °C was obtained based on the calculation. It was capable of introducing bimodal microstructure with stubby αlamellar phase. The mechanical properties of bimodal Ti-35421 were tested and compared with Ti-B19 and other near-β titanium alloys. The 540 °C aged bimodal alloy exhibited optimal combinatorial mechanical properties of ultimate tensile strength of 1313.39 MPa, yield strength of 1240.81 MPa, elongation of 8.62%, and Mode I fracture toughness of 75.8 MPa·m1/2. The performance is comparable to two commercial near-β titanium alloys. The results demonstrated that it is feasible to reduce the cost of titanium alloys by substituting Fe for V. It was also manifested that thermo-kinetic modeling can effectively be utilized in tailoring microstructure and enhancing mechanical properties.

Author Contributions

Conceptualization, H.C. and Y.C.; methodology, F.C. and G.X.; validation, F.C. and G.X.; formal analysis, F.C.; investigation, F.C.; data curation, F.C.; writing—original draft preparation, F.C.; writing—review and editing, G.X.; visualization, F.C. and G.X.; project administration, H.C. and Y.C.; funding acquisition, G.X., F.C., and H.C.

Funding

This research was funded by the Natural Science Funds of China (Grants No. 51801101 and 51701094), and National Defense Fundamental Research Fund (JCKY2018414C020). The APC was funded by Chinese Postdoctoral Science Fund (Grant No. 2019M651812). G.X. acknowledges the support from Natural Science Funds of Jiangsu Province Grant No. BK20171014.

Conflicts of Interest

The authors declare no conflict of interest.

Appendix A

A.1. Lengthening Model of αlamellar Tip

The modified Ivantsov equation, Equation (A1), with the Gibbs-Thomson calibration was employed to calculate the average lengthening rate of αlamellar tip.
Ω = π P exp ( 1 erf P ) ( 1 + ρ c ρ Ω S ( P ) )
The demanded lengthening rate v is embedded in the Peclet number P.
P = v ρ 2 D
The Peclet number indicates the ratio of convection and diffusion. The tip radius ρ is time and temperature dependent. For simplicity, ρ was calculated under the equilibrium condition:
ρ = 2 σ V m μ T i β μ T i α .
Interfacial energy σ was assumed 0.2 J/m2. Vm is molar volume of the alloy which was estimated following Vegard’s law. μ T i α and μ T i β are the chemical potentials of Ti in α and β phases, respectively. D is the diffusion coefficient. For a multicomponent and multiphase system, an appropriate D should be selected in different kinetic cases. In the lengthening of αlamellar tip, the diffusion coefficient of α phase was employed. It was averaged over the chemical diffusion coefficients of partitioned elements.
In the last parenthesis of Equation (A1), the second term was introduced by Trivedi [33,34] to calibrate the effect of interfacial curvature on the local composition. ρc is the critical radius for growth and was set to 9.0 × 10⁻¹⁰ m. S(P) was approximated as 2/πP in accord with [24]. Ω is the non-dimensional supersaturation of each partitioned element and expressed as
Ω = x 0 β x β / α ( x α / β x 0 β ) ( x α / β x β / α ) .
x 0 β is the mole fraction of alloying element in β phase before αlamellar precipitation. x α / β and x β / α are mole fractions of alloying elements on the α and β sides of α/β interface. The values of them were derived from the thermodynamic calculation by using Thermo-Calc® software (2015b) with TTTi3 database. For multicomponent Ti-35421 alloy, Ω was evaluated as the weighted summation of the partitioned alloying elements. The Gibbs-Thomson correction to Ω was implemented by using the effective temperature Teff which described the temperature shift due to the Gibbs-Thomson effect.
T e f f = T e q ( 1 μ T i β μ T i α H m ) .
Teq is the equilibrium transformation temperature; Hm denotes formation enthalpy of α phase in mole; μ T i α , μ T i β , Hm, and Teq were all read from the TTTi3 database.
With the lengthening rate v, the lengthening distance of the αlamellar tip during the heating can be achieved by
L = v d t = 298 T 60 v   d T .
The integration value L is half-length of the α lamella.

A.2. Dissolution Model of αlamellar Tip

The Aaron equation, Equation (A7) was employed to calculate the average dissolution rate of αlamellar tip.
v = k Ω D t .
The supersaturation Ω was calculated by Equation (A4) at an effective temperature. By which, the Gibbs-Thomson effect was taken into consideration. In dissolution, both average diffusion coefficients D α of α phase and D β of β phases were taken into consideration. The diffusion coefficient of the system followed the equation of
D = D α + D β ( D α ) 1 m ( D β ) m .
m is the normalized mole fractions between αlamellar and β matrix. The formalism of Equation (A8) was similar to the modeling in the phase-field community [35]. The shrunken distance of single αlamellar tip was obtained by integration Equation (A6) with respect to time/temperature.

A.3. Thickening Model of αlamellar Broad Face

Due to the ledge mechanism, thickening rate of the broad face is proportional to lengthening rate of the tip with a kinetic coefficient defined as the ratio of ledge height h to terrace spacing b.
v t h i c k e n = h b v l e n g t h e n .
The ledge height h was set as 2.94 Å based on the atomic diameter of Ti. b served as an adjustable parameter between 20 and 50 times of h considering that the spacing of terrace changes in the range of 20–50 atoms under high-resolution TEM observation. When calculating vlengthen with the Ivantsov equation, the last parenthesis of Equation (A1) should be removed, and there was no necessity to calibrate Ω by using effective temperature Teff.

A.4. Dissolution Model of αlamellar Broad Face below Teq

There were two factors contributing to the dissolution of αlamellar broad face, i.e., the compensation flux due to the dissolution of αlamellar tip and thickening of αlamellar broad face. The rate of former followed Equation (A7), while the latter followed Equation (A9). By taking the integrations with respect to temperature, the migration distances of the interface due to the individual factors can be calculated. The migrated distance of αlamellar broad face was the summation of those from two factors.

A.5. Dissolution model of αlamellar Broad Face above Teq and αlath Broad Face

The dissolution of the broad faces in αlamellar above Teq and αlath followed simple kinetics of planar interface
v = k h b Ω D t .
Ω at the equilibrium state was employed without being calibrated by using Teff. The diffusion coefficient of the system followed Equation (A8). Additionally, the different values should be assigned to b for αlamellar and αlath due to the different spacings of terraces in two α phases.

References

  1. Boyer, R.R. An overview on the use of titanium in the aerospace industry. Mater. Sci. Eng. A 1996, 213, 103–114. [Google Scholar]
  2. Williams, J.C.; Edgar, A.S.J. Progress in structural materials for aerospace systems. Acta Mater. 2003, 51, 5775–5799. [Google Scholar] [CrossRef]
  3. Raghunathan, S.L.; Stapleton, A.M.; Dashwood, R.J.; Jackson, M.; Dye, D. Micromechanics of Ti-10V-2Fe-3Al: In situ synchrotron characterisation and modelling. Acta Mater. 2007, 55, 6861–6872. [Google Scholar] [CrossRef]
  4. Ivasishin, O.M.; Markovsky, P.E.; Matviychuk, Y.V.; Semiatin, S.L.; Ward, C.H.; Fox, S. A comparative study of the mechanical properties of high-strength β-titanium alloys. J. Alloys Compd. 2008, 457, 296–309. [Google Scholar] [CrossRef]
  5. Chen, F.; Xu, G.; Zhang, X.; Zhou, K. Exploring the Phase Transformation in β-Quenched Ti-55531 alloy during continuous heating via dilatometric measurement, microstructure characterization, and diffusion analysis. Met. Mater. Trans. A 2016, 47, 5383–5394. [Google Scholar] [CrossRef]
  6. Sachdev, A.K.; Kulkarni, K.; Fang, Z.Z.; Yang, R.; Girshov, V. Titanium for automotive applications: Challenges and opportunities in materials and processing. JOM 2012, 64, 553–565. [Google Scholar] [CrossRef]
  7. Crowli, G. How to Extract Low-Cost Titanium. Adv. Mater. Process 2003, 161, 25–27. [Google Scholar]
  8. Ezugwu, E.O.; Wang, Z.M. Titanium alloys and their machinability—A review. J. Mater. Process. Technol. 1997, 68, 262–274. [Google Scholar] [CrossRef]
  9. Cui, C.; Hu, B.; Zhao, L.; Liu, S. Titanium alloy production technology, market prospects and industry development. Mater. Des. 2011, 32, 1684–1691. [Google Scholar]
  10. Philippart, I.; Rack, H.J. High temperature dynamic yielding in metastable Ti-6.8 Mo-4.5 F-1.5 Al. Mater. Sci. Eng. A 1998, 243, 196–200. [Google Scholar] [CrossRef]
  11. Hu, Y.M.; Floer, W.; Krupp, U.; Christ, H.J. Microstructurally short fatigue crack initiation and growth in Ti-6.8 Mo-4.5 Fe-1.5 Al. Mater. Sci. Eng. A 2000, 278, 170–180. [Google Scholar] [CrossRef]
  12. Koch, B.; Birgit, S. Strain controlled fatigue testing of the metastable β-titanium alloy Ti-6.8 Mo-4.5 Fe-1.5 Al (Timetal LCB). Mater. Sci. Eng. A 2011, 528, 5999–6005. [Google Scholar] [CrossRef]
  13. Zhu, X.; Chang, H.; Xie, Y.; Ding, L.; Li, H.; Cui, Y.; Zhou, L. Hot deformation behavior of two kinds of TC4-xFe alloys based on processing map. Rare Met. Mater. Eng. 2017, 46, 204–210. [Google Scholar]
  14. Chang, H.; Zeng, W.; Luo, Y.; Zhou, Y.; Zhou, L. Phase transformation and microstructure evolution in near beta Ti-B19 titanium alloy during aging treatment. Rare Met. Mater. Eng. 2006, 35, 1589–1592. [Google Scholar]
  15. Li, D. A Study on Microstructure and Mechanical Properties of Ti-35421 Alloy with High Strength and Toughness. Master’s Thesis, Nanjing Tech University, Nanjing, China, 2017. [Google Scholar]
  16. Shekhar, S.; Sarkar, R.; Kar, S.K. Bhattacharjee, A. Effect of solution treatment and aging on microstructure and tensile properties of high strength β titanium alloy, Ti-5Al-5V-5Mo-3Cr. Mater. Des. 2015, 66, 596–610. [Google Scholar] [CrossRef]
  17. Li, C.L.; Mi, X.J.; Ye, W.J.; Hui, S.X.; Yu, Y.; Wang, W.Q. A study on the microstructures and tensile properties of new beta high strength titanium alloy. J. Alloys Compd. 2013, 550, 23–30. [Google Scholar] [CrossRef]
  18. Welk, B.A. Microstructural and Property Relationships in Titanium Alloy Ti-5553. Master’s Thesis, The Ohio State University, Columbus, OH, USA, 2010. [Google Scholar]
  19. Srinivasu, G.; Natraj, Y.; Bhattacharjee, A.; Nandy, T.K.; Rao, G.N. Tensile and fracture toughness of high strength β Titanium alloy, Ti-10V-2Fe-3Al, as a function of rolling and solution treatment temperatures. Mater. Des. 2013, 47, 323–330. [Google Scholar] [CrossRef]
  20. Fan, J.K.; Li, J.S.; Kou, H.C.; Hua, K.; Tang, B. The interrelationship of fracture toughness and microstructure in a new near β titanium alloy Ti-7Mo-3Nb-3Cr-3Al. Mater. Charact. 2014, 96, 93–99. [Google Scholar] [CrossRef]
  21. ASTM International. ASTM E8/E8M–09, Standard Test Methods for Tension Testing of Metallic Materials; ASTM International: West Conshohocken, PA, USA, 2009. [Google Scholar]
  22. ASTM International. ASTM E399-06. Standard Test Method for Linear-Elastic Plane-Strain Toughness KIC of Metallic Materials; ASTM International: West Conshohocken, PA, USA, 2006. [Google Scholar]
  23. Chen, F.W.; Xu, G.; Zhang, X.Y.; Zhou, K.C.; Cui, Y. Effect of α morphology on the diffusional β ↔ α transformation in Ti-55531 during continuous heating: Dissection by dilatometer test, microstructure observation and calculation. J. Alloys Compd. 2017, 702, 352–365. [Google Scholar] [CrossRef]
  24. Liu, Z.; Chang, Y.A. On the applicability of the Ivantsov growth equation. J. Appl. Phys. 1997, 82, 4838–4841. [Google Scholar] [CrossRef]
  25. Shiflet, G.J.; Aaronson, H.I.; Courtney, T.H. Kinetics of coarsening by the ledge mechanism. Acta Met. 1979, 27, 377–385. [Google Scholar] [CrossRef]
  26. Aaron, H.B.; Kotler, G.R. Second phase dissolution. Met. Trans. 1971, 2, 393–408. [Google Scholar] [CrossRef]
  27. Madelung, O. Landolt-Börnstein New Series Group III; Springer: Berlin/Heidelberg, Germany, 1982. [Google Scholar]
  28. Chen, C.C.; Hall, J.A.; Boyer, R.R. High strength beta titanium alloy forgings for aircraft structural applications. In Titanium 80: Science and Technology, Proceedings of the Fourth International Conference on Titanium, Kyoto, Japan, 19–22 May 1980; Kimura, H., Izumi, O., Eds.; Stanford University Press: Palo Alto, CA, USA, 1980. [Google Scholar]
  29. Chen, J.; Chang, H.; Li, H. Effect of heat treatment on optimization matching between strength and toughness of Ti-B19 alloy. Acta Met. Sin. 2002, 38, 108–111. [Google Scholar]
  30. Fanning, J.C. Properties of TIMETAL 555 (Ti-5Al-5Mo-5V-3Cr-0.6 Fe). J. Mater. Eng. Perform. 2005, 14, 788–791. [Google Scholar] [CrossRef]
  31. Kar, S.K.; Suman, S.; Shivaprasad, S.; Chaudhuri, A.; Bhattacharjee, A. Processing-microstructure-yield strength correlation in a near β Ti alloy, Ti-5Al-5Mo-5V-3Cr. Mater. Sci. Eng. A 2014, 610, 171–180. [Google Scholar] [CrossRef]
  32. Wang, X.Y.; Liu, J.R.; Lei, J.F.; Cao, M.Z.; Liu, Y.Y. Effects of primary and secondary a phase on tensile property and fracture toughness of Ti-1023 alloy. Acta Met. Sin. 2007, 43, 1129–1137. [Google Scholar]
  33. Trivedi, R. The role of interfacial free energy and interface kinetics during the growth of precipitate plates and needles. Met. Trans. 1970, 1, 921–927. [Google Scholar]
  34. Trivedi, R.; Pound, G.M. Growth Kinetics of plate-like precipitates. J. Appl. Phys. 1969, 40, 4293–4300. [Google Scholar] [CrossRef]
  35. Chen, Q.; Ma, N.; Wu, K.; Wang, Y. Quantitative phase field modeling of diffusion-controlled precipitate growth and dissolution in Ti-Al-V. Scr. Mater. 2004, 50, 471–476. [Google Scholar] [CrossRef]
Figure 1. (a) Back-scatter Scanning Electron Microscopy (SEM) image and (b) XRD pattern of Ti-35421 after solid solution.
Materials 12 02791 g001
Figure 2. Dilatometric curve (in solid) and the derivative curve (dotted curve) at 1 °C/min during the continuous heating process.
Materials 12 02791 g002
Figure 3. SEM images of the microstructure at (a) 410, (b) 550, (c) 660, (d) 700, (e) 740, (f) 780, (g) 800, and (h) 840 °C during 1 °C/min heating.
Materials 12 02791 g003
Figure 4. The variations of (a) volume fraction of lath and lamellar α phases, (b) average length and width of lath α, and (c) average length and width of lamellar α with temperatures.
Materials 12 02791 g004
Figure 5. (a) Calculated growth (black) and dissolution (blue) curves for αlamellar tip; (b) thickening (black), dissolution (blue), and real interface migration (magenta) curves for αlamellar broad face are compared with the measured average length and width of α lamellae at different temperatures (red disc). (c) The calculated migration rates of tip and broad face in lamellar α phase.
Materials 12 02791 g005
Figure 6. Calculated kinetic curves describe negligible growth and remarkable re-dissolution of α lath. The calculation results are compared with average half-width of lath α phase in the experiment.
Materials 12 02791 g006
Figure 7. SEM images of bimodal microstructure after aging for 8 h: (a,a1) 500 °C, (b,b1) 520 °C, (c,c1) 540 °C, and (d,d1) 560 °C.
Materials 12 02791 g007
Figure 8. The variations of (a) volume fraction of lath and lamellar α phases, (b) average length and width of lath α, and (c) average length and width of lamellar α with temperatures.
Materials 12 02791 g008
Figure 9. The variations of mechanical properties with aging temperatures: (a) strength, (b) plasticity, and (c) fracture toughness.
Materials 12 02791 g009
Figure 10. The variations of (a, a1, a2) strength, (b, b1, b2) plasticity, and (c, c1, c2) fracture toughness with microstructure features of (ac) volume fraction of αlamellar, (a1c1) average length of αlamellar, and(a2c2) average width of αlamellar.
Materials 12 02791 g010
Figure 11. Performance comparison between Ti-35421, Ti-B19, Ti-5553, and Ti-1023: (a) yield strength vs. elongation, (b) yield strength vs. fracture toughness. (Ti-B19 [29], Ti-5553 [30,31], Ti-1023 [19,32]).
Materials 12 02791 g011
Table 1. Actual chemical composition of the Ti-35421 alloy by titration.
Ti/wt.%Al/wt.%Mo/wt.%Cr/wt.%Zr/wt.%Fe/wt.%O/wt.%
Balance3.035.023.801.870.9950.087
Table 2. Microstructure features of α phases quenched from different temperatures during 1 °C/min heating.
Temperature/°Cαlathαlamellar
Average Length/μmAverage Width/μmVolume Fraction/vol. %Average Length/μmAverage Width/μmVolume Fraction/vol. %
251.370 ± 0.1200.420 ± 0.02630.86 ± 1.43
4101.373 ± 0.1120.420 ± 0.02329.95 ± 1.25
5501.341 ± 0.1330.427 ± 0.03530.66 ± 1.540.160 ± 0.0130.031 ± 0.00220.02 ± 1.09
6601.389 ± 0.1440.426 ± 0.03130.78 ± 2.010.265 ± 0.0180.105 ± 0.00927.81 ± 0.98
7001.320 ± 0.1430.425 ± 0.02629.41 ± 1.780.222 ± 0.0110.109 ± 0.00713.49 ± 0.78
7401.321 ± 0.0960.409 ± 0.02128.65 ± 1.49
7800.764 ± 0.1010.316 ± 0.02121.39 ± 1.02
8000.372 ± 0.0530.142 ± 0.01112.40 ± 0.69
Table 3. Microstructure features of α phases after aging for 8 h.
Temperature/°Cαlathαlamellar
Average Length/μmAverage Width/μmVolume Fraction/vol. %Average Length/μmAverage Width/μmVolume Fraction/vol. %
5001.404 ± 0.1510.425 ± 0.05129.16 ± 1.240.065 ± 0.0110.031 ± 0.00533.49 ± 1.27
5201.390 ± 0.1120.421 ± 0.04929.96 ± 1.170.092 ± 0.0100.037 ± 0.00629.18 ± 1.49
5401.359 ± 0.110.429 ± 0.05630.26 ± 1.410.161 ± 0.0170.072 ± 0.00926.55 ± 1.28
5601.316 ± 0.120.430 ± 0.06129.01 ± 1.380.218 ± 0.0210.089 ± 0.00925.21 ± 0.98
Table 4. Mechanical properties of the alloy after aging for 8 h.
Temperature/°CStrengthPlasticityFracture Toughness KIC/MPa·m1/2
Tensile Strength σs/MPaYield Strength σy/MPaElongation δ/%Reduction of Area ψ/%
5001459.03 ± 4.361355.54 ± 4.675.20 ± 0.387.42 ± 0.3760.9 ± 0.82
5201398.66 ± 3.231321.74 ± 4.826.04 ± 0.4711.31 ± 0.7861.3 ± 0.89
5401313.39 ± 3.481240.81 ± 4.988.62 ± 0.5617.58 ± 0.9675.8 ± 0.64
5601242.52 ± 3.941180.40 ± 3.6710.31 ± 0.4621.26 ± 0.8376.2 ± 0.79

