3.1. Fiber Drawing and General Insights
In
Figure 1, the SiO
2 radial composition profiles for the 4 segments investigated are displayed. Additionally, several typical fiber parameters are reported in
Table 1. At this point, it is worth noting that this work focuses on SiO
2 incorporation, and therefore the composition profiles of the other elements are left out of the present analysis. The principal time-related characteristics of the MCM fiber fabrication process clearly identified from
Figure 1 are:
- (i)
The first fiber segment of the draw already exhibits a graded-index profile with a lower concentration of SiO2 at its core center relative to later segments. This concentration increases over time. As opposed to this, the initial precursor composition decreases (not presented here) as it is diluted by the SiO2.
- (ii)
For a constant fiber cladding diameter, the fiber core diameter decreases as the fiber is being drawn and, therefore, the initial inner diameter / outer diameter (ID/OD) ratio is not preserved during the draw. Moreover, it is worth noting that the initial segments collected generally present a larger ID/OD ratio with respect to the initial ratio (e.g., 2/10 versus 1/10 here).
- (iii)
The concentration profile sharpens over time, i.e., the silica composition profile is less flat at the core center as draw time increases. This concentration profile is indicative of a diffusion-controlled incorporation of silica into the molten core.
In view of the sharp core/cladding interface observed in
Figure 1 (but also well visible from refractive index profiles in these systems [
7]), coupled with the reduction of the core diameter, it appears that the silica species principally diffuse into the molten core precursor, and not the other way around (i.e., core species diffusing into the SiO
2 cladding). In order to gain better insights into why silica is incorporated into the molten core, one may consider the dissolution of a solid rod into a “low” viscosity melt, as it has extensively been investigated in the literature (e.g., [
9,
10,
11,
12]). In these studies, a rod material (the solute) was progressively dissolved into a melt/slag (the solution) and, then, diffused into it through a diffusion-controlled dissolution mechanism. However, it must be pointed out that in each studied case, the precursor (e.g., sapphire [
9], MgO [
12]) remained well below its melting temperature. In the present case, at the temperature achieved during the molten core method (typically ~2000 °C), the situation is different. Both the precursor and the silica glass are in a molten state, and the precursor is brought well above its melting temperature (by ~100 K in the present study). Because of this particularity, here the precursor becomes the low viscosity solution into which the higher viscosity fused silica (the solute) dissolves. To put this into perspective,
Table 2 reports selected viscosity values for materials of interest at various temperatures, and additional viscosity data can be found in [
13] for a large number of aluminosilicate systems.
From
Table 2, it can be seen that the molten core precursors (and many silicate systems, again from Ref. [
13]) exhibit low viscosities of, at most, a few hundreds of Pa·s, and generally are several order of magnitudes lower than the viscosity of molten silica at the draw temperature. It is interesting to note that, as the temperature increases, the difference in viscosity values in aluminosilicate systems is greatly reduced [
13]. On a lighter, but no less informative note, the viscosity of molten Al
2O
3 or YAG at the fiber draw temperature is only × 10 higher than cold (12 °C) wine [
17]. This surely depicts the “liquid” character of the molten core compared to its surrounding silica cladding. However, it is evident that the progressive incorporation of SiO
2 into the molten core (>60 mol % in 10 min under the draw conditions employed here) would increase the viscosity.
In this section typical characteristics of the MCM draw were discussed. From this discussion the low viscosity of the precursor in the molten state with respect to the silica cladding was highlighted. Following this, during the fiber drawing process, the molten core precursor can be considered the solution and the silica from the surrounding preform the solute. This intermediate conclusion sets the basis for the modeling section that follows.
3.2. Preliminary Assumptions and Modeling Equations
The fiber draw process is first addressed and discussed in view of making several assumptions and simplifications. The draw process is separated into three steps (above, inside, and below the heat-zone, respectively):
Above the heat-zone: The preform, comprising the precursor core inside the glass cladding, is placed inside the draw furnace and, while inside, remains above the heating element or heat-zone (i.e., the precursor is in the solid state and has not yet melted). The fiber draw temperature is assumed to be reached only inside the heat-zone, and, therefore, above the heat zone, the temperature is below the actual furnace setpoint such that dissolution is assumed here to be negligible. In [
18], diffusion at a sapphire/fused SiO
2 interface for 4 h at 1800 °C (i.e., below the sapphire melting point) yielded an aluminosilicate layer of only ~300 μm thickness. Here, the timescale is much shorter (~10 min, i.e., × 24 shorter) and the solid rod interface is not always in contact with the silica preform as it sits inside the silica capillary. Consequently, it is reasonable to neglect any interaction occurring between the silica glass and the precursor at this stage. However, and for completeness, it is worth pointing out that in the case of powder mixtures and low melting temperature precursors (e.g., fluorides such as SrF
2 as in Ref. [
3]), one may expect interactions/reactions to take place in the furnace as the sample approaches the heat zone. This is not the case in this present study. Additionally, formation of intermediate low melting temperature phases can further complicate the analysis and are ignored herein.
Inside the heat-zone: When the desired draw temperature is reached (in the present case, 2050 °C), the preform is lowered into the heat-zone (40 mm long here). Since, in this region, the temperature is now above the melting temperature of the precursor, the latter is expected to melt shortly thereafter. For a silica preform of 30 mm outer diameter, the preform diameter entering the heat zone is ~11 mm, and the preform diameter exiting the heat zone (and hence the furnace) is 125 μm, i.e., the size of the fiber. The previous value of ~11 mm was determined experimentally from observation of the preform neckdown post-draw and is shorter than the initial 30 mm preform OD. This likely is due to the silica tube narrowing inside the furnace, although still above the heat zone element. It is worth pointing out that the YAG crystal has an OD of 1.5 mm, which is smaller than the initial 3 mm preform ID, permitting the tapering to take place while the precursor crystal remains in its solid state. At the heat-zone entrance, the silica tube ID should be 1.5 mm (the diameter of the YAG rod) while its OD is 11 mm, and therefore the ID/OD is found to be ~0.14 (1.5 mm/11 mm), close but slightly higher than the original value of 0.1 corresponding to the 3 mm/30 mm dimension of the silica tube preform. Further investigations are necessary to better comprehend how the precursor material influences the ID/OD preform ratio as it enters the heat-zone and progressively melts. It is in this “active region” (i.e., the heat-zone) that silica incorporation into the molten core mostly takes place. At this point, the concept of an effective diameter, deff, is introduced, and will be used later to set the modeling equations. The effective diameter is defined as the averaged inner preform diameter within the heat-zone (again which corresponds to the active region). In this experiment, the preform outer radius at the heat-zone center is ~5.5 mm (i.e., 11/2 mm assuming a cone-like shape). By taking the preform ID/OD = 0.14 ratio to be constant in this region, then deff = 700 μm (at t = 0), and the effective radius Reff = 350 μm (also at t = 0) will be later used in the modeling section. Introducing deff (and Reff) has the advantage of simplifying the modeling as will be seen later. Additionally, a constant temperature is assumed throughout the heating element, which is also set for simplicity.
Below the heat-zone: The fiber has reached its final targeted geometry (e.g., 125 μm cladding diameter), and quickly exits the furnace (speed of ~30 m/min) where the glass is quenched and, consequently, any further dissolution of SiO2 is ceased.
Additional assumptions are made when considering interaction between SiO2 and the precursor inside the heat-zone. First, the diffusion coefficient (D) of SiO2 into the molten core is assumed constant throughout the draw. This certainly introduces further uncertainties since D is a function of viscosity/composition, and the composition of the molten core changes as a function of time. However, since, at these high temperatures the viscosity values somewhat converge as discussed above, the impact of compositional change on D is assumed to be small. Second, free and forced convective flows are ignored and left for future modeling work as it brings additional complexity.
Now let us consider that the radial compositional profile for each fiber core segment collected is a function of time (
t), core radius (
R), and silica concentration at the core center (
cm). Additionally, as was discussed previously, the core diameter reduction was associated with an increase in silica concentration, and, from this observation, it becomes evident that these two features are related to each other. Therefore,
dR/dt and
dcm/dt (variations of
R and
cm with respect to time, respectively) must follow a similar dependency. Here, first order kinetics equations are employed, which originate from the well-known Noyes-Whitney equation [
19], and are employed herein to describe the dissolution kinetics of cladding silica into the molten core. Because it was stated above that the process is diffusion-controlled, the Noyes-Whitney equation can be transformed into the Nernst–Brunner equation [
20], and this is the final form that will be used (Equations (1) and (2)). Additionally, the silica concentration profile in the fiber core can be considered using Fick’s second law in cylindrical coordinates (Equation (3)) [
21]. Thus, one gets the following equations:
By integrating Equations (1)–(3), one obtains:
To help the reader, all the parameters used in Equations (1)–(6) are summarized in
Table 3.
The silica composition profile (cR) is calculated from r = 0 to r = Reff, and then scaled to the final fiber core geometry. However, Reff (Equations (4) and (5)) is also a function of time and was found to slightly decrease (~15% within ~2000 s) after analyzing the preform post draw. This decrease of Reff is assumed to depend linearly with time and, thus, Reff (t) = Reff (t = 0) − 2.625 × 10⁻⁶ × t. Further analysis should permit a better understanding of the time dependence of the effective preform radius. Additionally, tx (in Equation (6)) corresponds to the time spent by the preform inside the heat-zone. This time is very sensitive to the preform shape, draw furnace hot-zone thermal profile, feed and draw speeds, and can range from tens of seconds to several minutes. Here, assuming a constant feed rate of 0.5 mm/min, tx is estimated to be ~40 s.
3.3. Modeling Results and Discussion
Equation (4) first was used to fit the core radius data of the four fiber segments and the results are reported in
Figure 2a. Here
Reff (
t = 0) is set to 0.0350 cm (i.e.,
deff/2), which, once again, corresponds to the averaged effective radius, and
R0,
Rs, and
D, are fit parameters. The fit is performed, and results are displayed in
Figure 2a (red curve). From the fit, one obtains a diffusion coefficient of SiO
2 into the melt of D = 1.25 × 10
−6 cm
2/s, along with
R0 = 38.9 μm, and
Rs = 5.1 μm. By keeping these values constant but taking
Reff at any time t to be the constant value
Reff (
t = 0), the blue curve in
Figure 2a is obtained. There is no significant difference between the two cases, and one may simply use a constant
Reff as a first approximation. Now, if the core compositions at the fiber segment core centers are fitted using Equation (5), one finds D = 1.67 × 10
−6 cm
2/s, and
cs = 82.9 mol %. It is interesting to point out that this value of D is found to be somewhat similar to the previously calculated value (D = 1.25 × 10
−6 cm
2/s), and tends to indicate that the two processes, namely silica diffusion and diameter reduction, are directly related to each other, as suggested above and not entirely unexpected. The diffusion coefficient values found here fall within the same order of magnitude as what has been reported in the literature (e.g., Refs. [
22,
23]). Consequently, D = 1.25 × 10
−6 cm
2/s is used throughout the rest of this analysis. Employing this later D value in Equation (5) to fit the data (
Figure 2b), one obtains
cs = 86.6 mol %, which is reasonably close to the previously obtained value of 82.9 mol %. Again, in
Figure 2b one can note that by holding
Reff constant throughout the modeling, only a slight deviation is noticed with respect to a varying
Reff.
Now that
D,
cm (t), and
tx, are calculated, the silica composition profile for each fiber segment can then be computed using Equation (6). Thus, combining Equations (4)–(6) together, the complete silica composition profile at any given time can be estimated. In
Figure 3a, the computed profiles are compared to the measured ones from EDX, and, in
Figure 3b, the profiles are computed for a 50 min time lapse (10 min to 60 min of draw with a 1-minute time interval). In
Figure 3a, a core diameter mismatch between calculated and measured profiles can be observed. Additionally, the measured profiles typically exhibit higher SiO
2 concentration with respect to the computed ones. This is attributed to the electron beam probe radius being on the order of few μm, thereby shifting the concentration profiles to higher SiO
2 contents and larger apparent core radii. Besides these mismatches, the general MCM draw features as discussed above are well visible.
These results demonstrate that by simply knowing (or assuming) cs and with knowledge of core diameters over a fairly large range of drawn fiber length, silica concentration profiles during the entire draw range can be computed. This work, therefore, is expected to ease the future development of optical fibers when the MCM is employed.
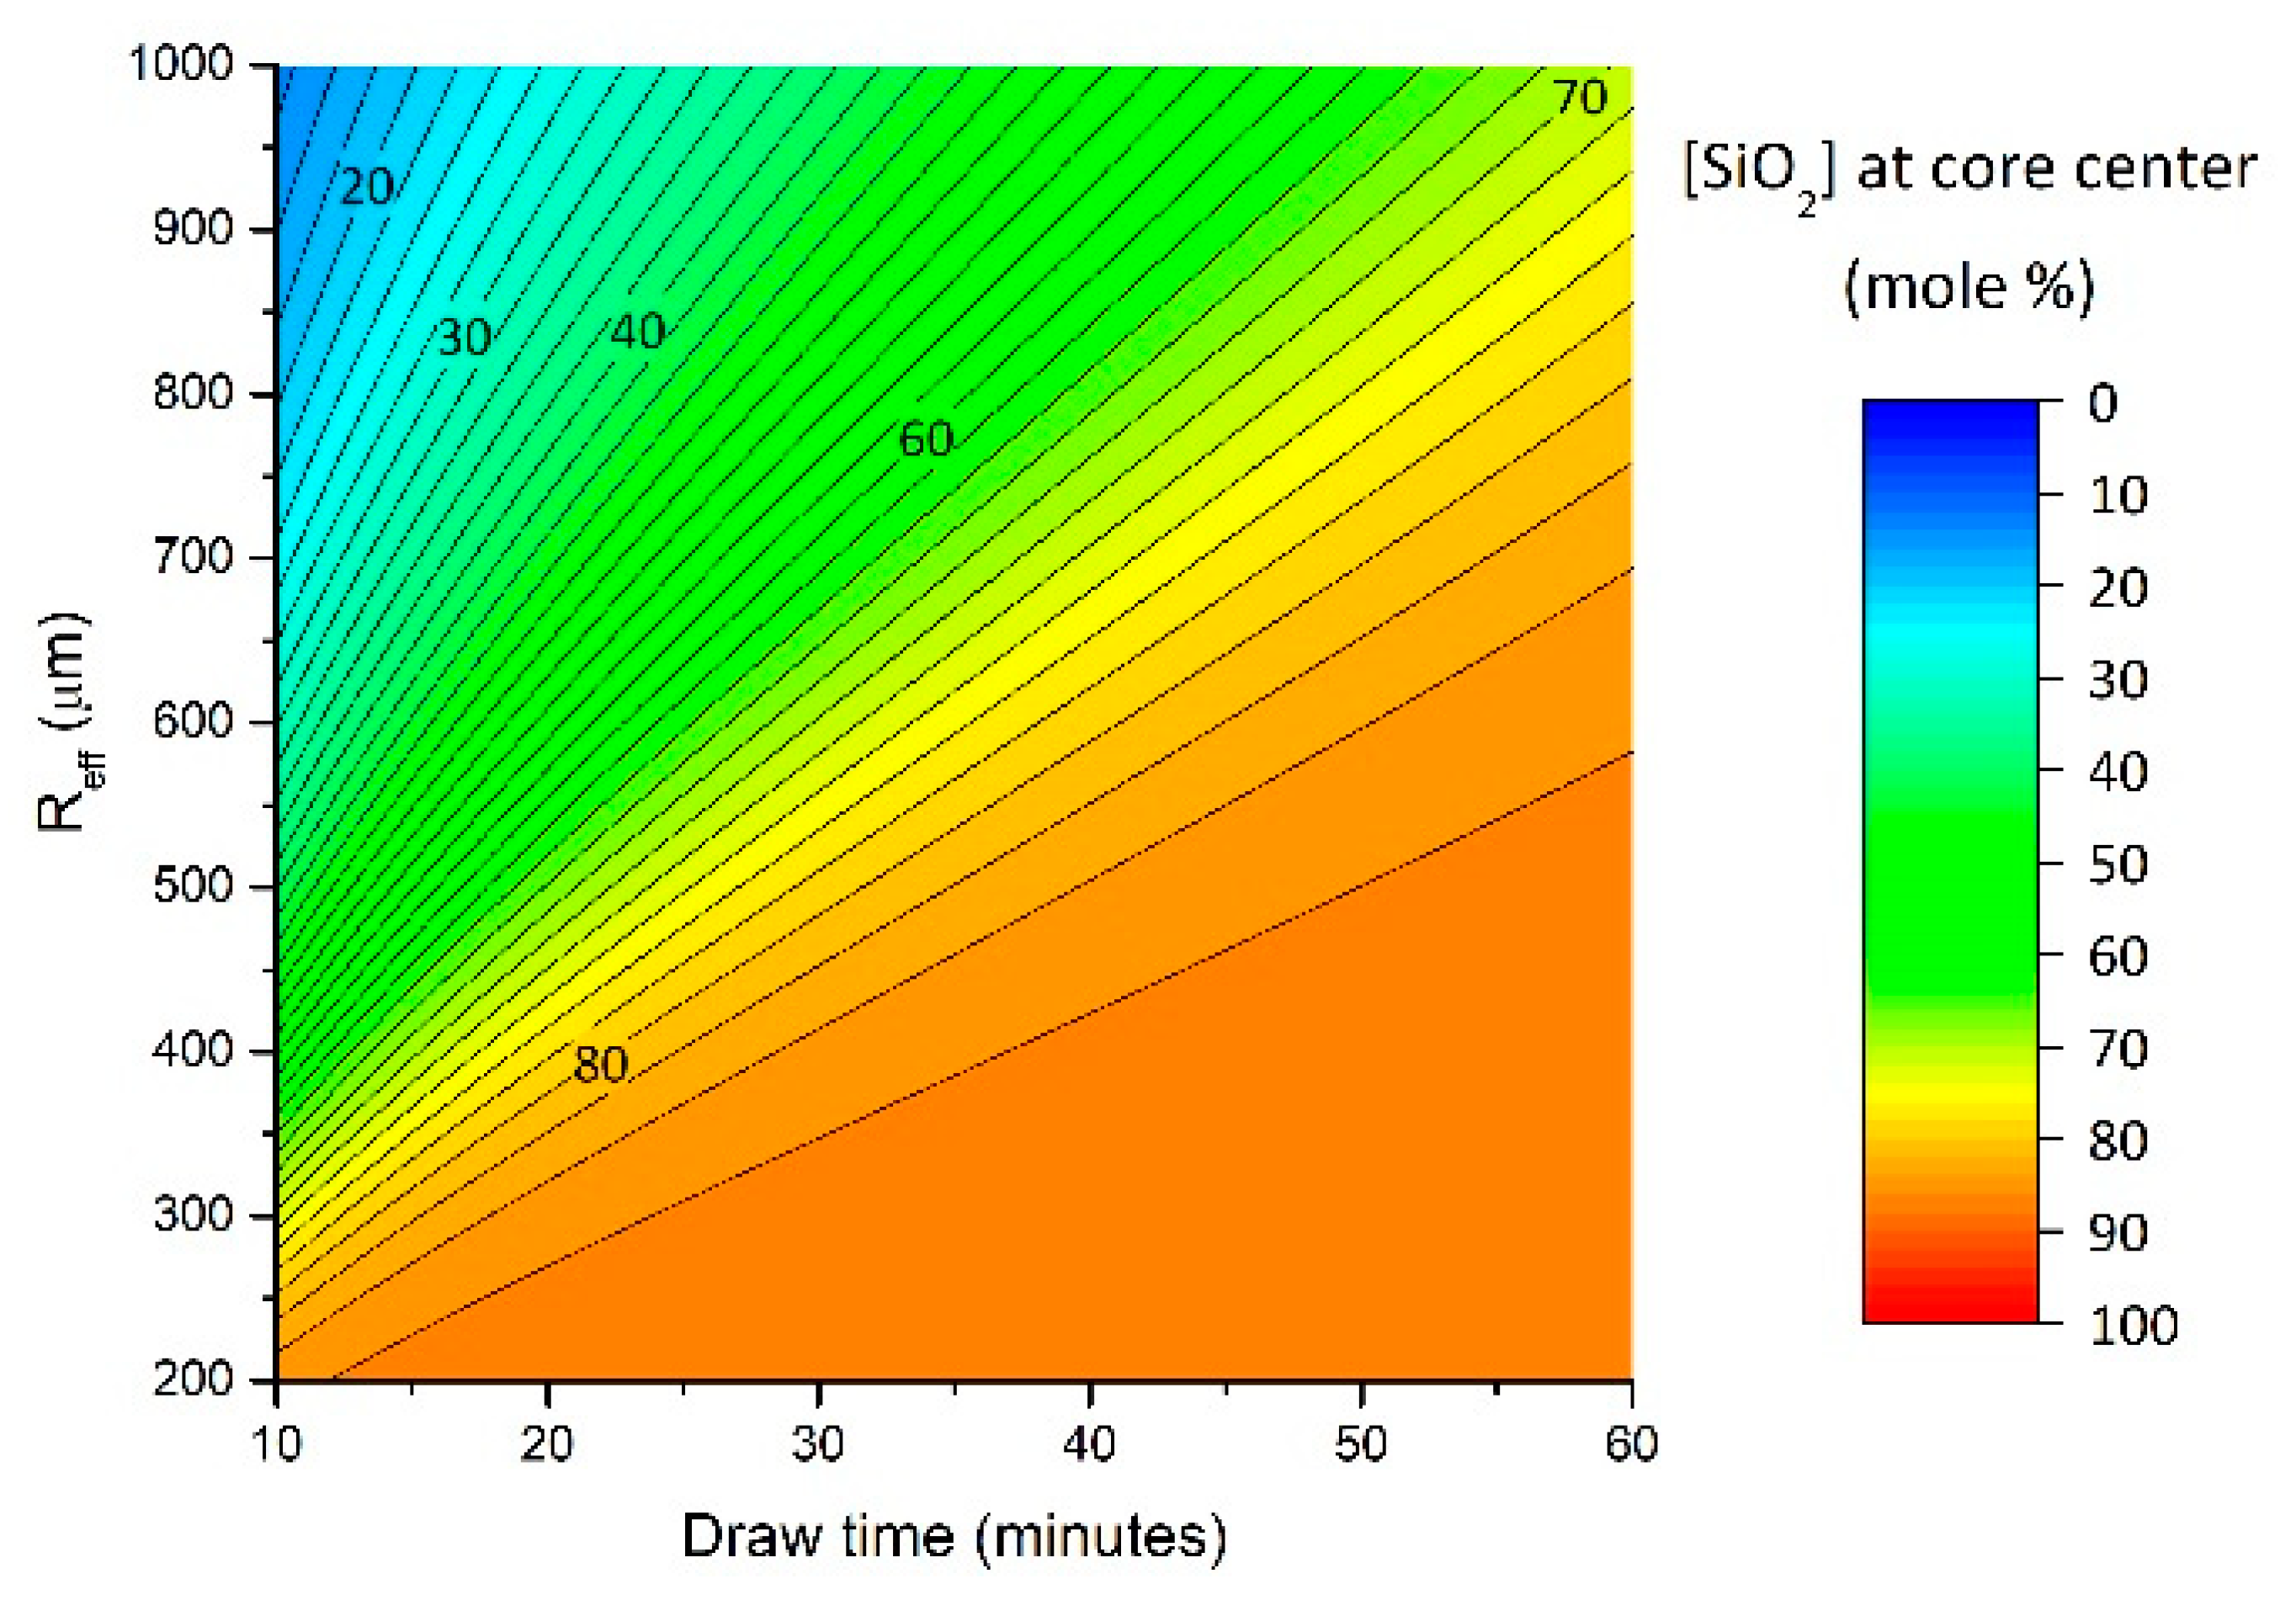
Additionally, the model presented here can make interesting predictions, although these need to be further validated. For instance,
Reff factors into Equations (4)–(6). One may wonder how the silica concentration at the fiber core center would evolve if the initial
Reff value was modified. To answer this question, the model was used and
Reff is varied (from 0.2 mm to 1 mm), everything else being held constant. The results are reported in
Figure 4, and clearly suggests maximizing
Reff would yield reduced silica concentration into the final fiber core. As an example, after ~20 min of draw time, the SiO
2 concentration at the fiber core center is expected to change from ~80 mol % to ~70 mol % when
Reff varies from 350 μm to 450 μm. Here, the authors would like to emphasize that further experiments must be carried out to further validate these expected trends, as other factors not yet accounted for and presently ignored may play a dominant role.
Based on the above results, it is suggested that drawing a cane instead of an optical fiber would also increase
Reff, thus increase the volume in which silica has to diffuse, and, consequently, decrease the silica concentration in the resultant molten core at a given length. On the other hand, increasing the fiber outer cladding size with constant feed speed would result in a longer time spent by the precursor in the furnace. These two effects are expected to somewhat counteract each other. Increasing the feed speed (hence the draw speed) would promote “step-index like” fiber profiles, as
tx (the time spent by the molten precursor in the heat-zone) would be reduced. To further control silica incorporation, a post-feeding molten core method can be employed as in [
5], in which a precursor is added during fiber drawing. Finally, the effect of temperature has not been discussed. It is fair to ask to what extent changing the drawing temperature (e.g., 2000 °C versus 2100 °C) would impact the silica dissolution rate. Obviously the silica cladding would exhibit a different viscosity (
Table 2) and this would somehow impact the rate at which silica diffuses into the fiber core. An interesting future step would be to investigate and clarify such temperature effects.


