3.1. Bulk PMMA
In order to demonstrate that the force field and simulation parameters were chosen correctly, the polymer physical properties must be realistically represented in the simulation. As it was mentioned in the previous section, the densities of the samples and the coefficient of thermal expansion were calculated and compared with the experimental ones. The results with the theoretical and experimental values, available in the literature [
48,
49], are reported in
Table 3. The densities and coefficients of thermal expansion, obtained for PMMA at different temperatures by means of MD simulations, are in good agreement with the experimental ones.
Glass transition temperature (T
g) is a unique property of polymers. Below T
g, polymers behave like glass that is hard and brittle, and above T
g, polymers act like rubber that is soft and viscous [
55,
56]. Although polymers possess two completely different states below or above T
g, glass transition is a second order phase transition, so that many first order properties, for example, volume, change gradually when the temperature increases. Therefore, T
g can be derived from fitting the intercept of the two linear trend lines at a low and a high temperature, respectively. There are several ways to estimate T
g from MD simulations. In particular, in reference [
57] T
g was determined through tracing the variations in the macroscopic (thermal conductivity, volume, thermal expansion and Young’s modulus) and microscopic properties (radial distribution functions, mean squared displacement, non-bonded energy) of the polymer during temperature cooling scans. The authors [
57] found that the density and volume method was less time consuming in determining the T
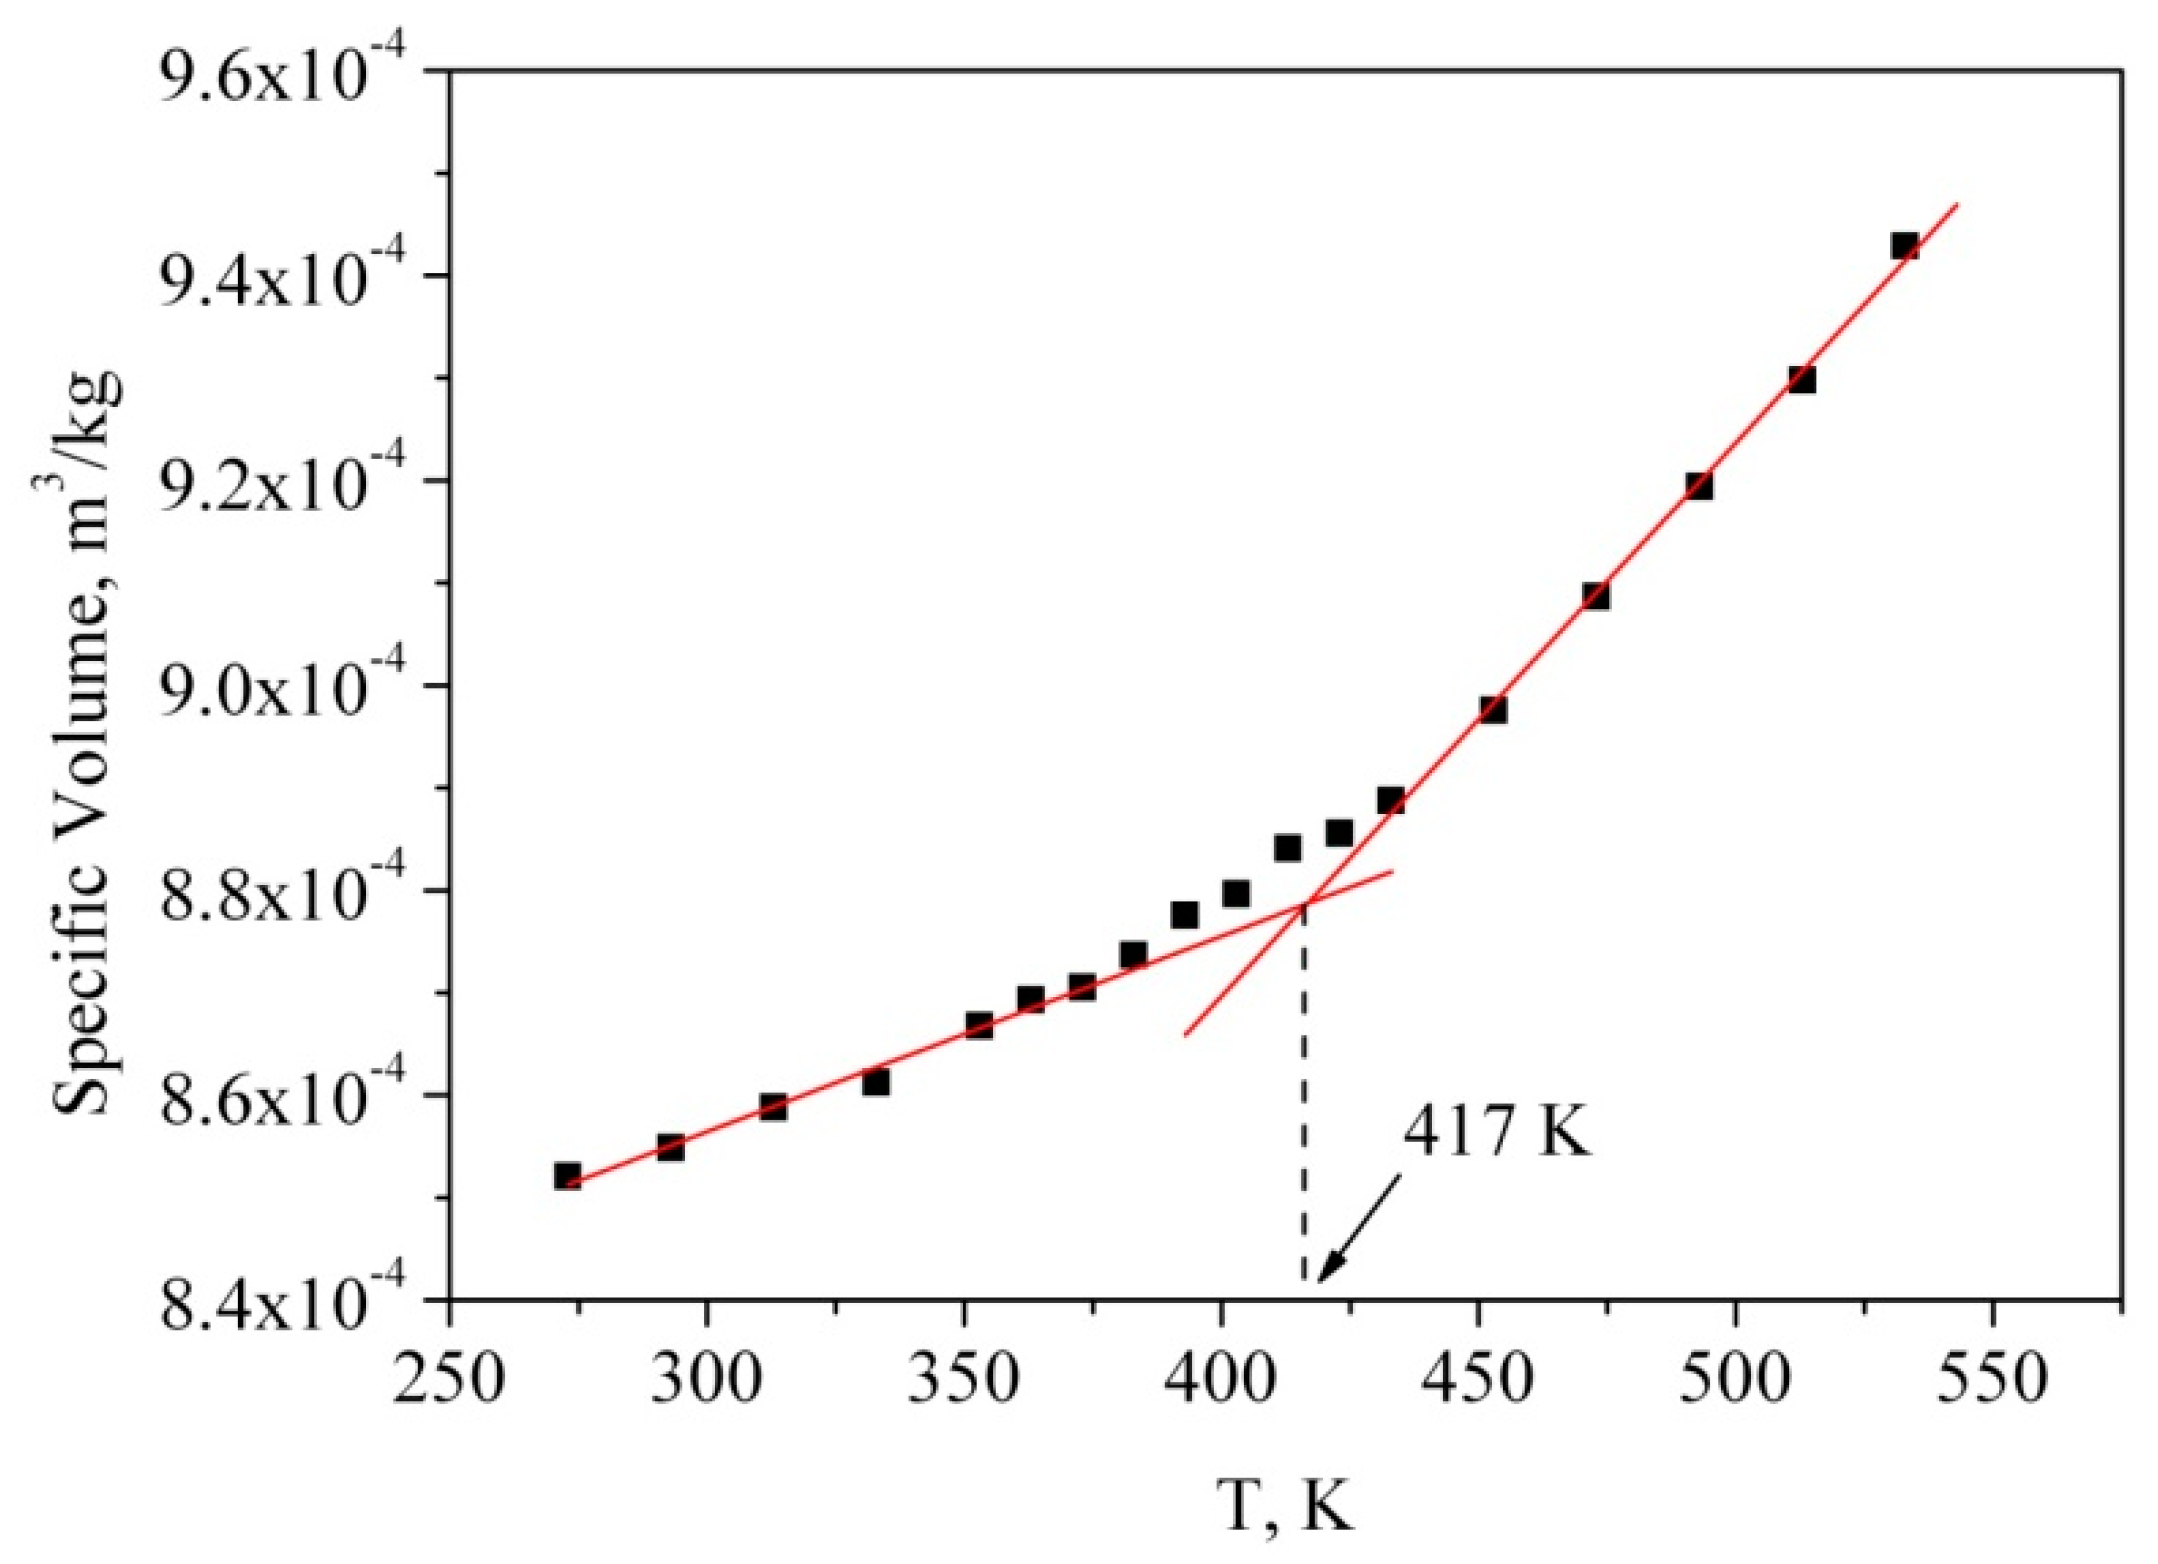
g than the thermal conductivity and Young’s modulus method. Therefore, we calculated the specific volume, i.e., the inverse density, at each temperature during the cooling process. The temperature dependence of the specific volume of the bulk PMMA is shown in
Figure 2.
The temperature gradient of specific volume has a discontinuity at Tg, therefore, the intersection between the lines obtained as interpolation of specific volume values below and above Tg is the estimation of the glass transition temperature. We used this method to obtain the simulated glass transition temperature of the polymer (T
g = 417 K). The glass transition temperature value obtained from the simulation was found to be a little higher than the corresponding experimental values (*T
g = 378 K [
58], T
g = 363–387 [
59]). These deviations could be caused by the extremely fast cooling rate of the MD simulation (≈10
9 K/s) relative to the real experiment (≈0.3 K/s) [
59]. Moreover, as it was mentioned in reference [
57], the T
g obtained from MD simulations, is dependent on the polymerization degree, i.e., the higher the polymerization degree is, the higher the glass transition temperature is (T
g = 450 K and T
g = 381 K for polymerization degree of PMMA 100 and 10, respectively, at a cooling rate 20 K/ns).
Glass transition of polymers is well correlated with mobility of polymer chains, which can be affected by chemical constituents and intermolecular interactions. When a polymer is heated above T
g, the intermolecular interactions become weaker and, as a result, the mobility and flexibility of the chains increase. In order to examine the mobility of PMMA during the glass transition process, the mean squared displacement (MSD) was calculated. The MSD curves were calculated by the relation:
where
ri(
t) is the position vector of atom
i at time
t; the symbol <…> denotes the average for all the atoms as well as for all the time origins.
The steeper slope of MSD indicates higher mobility of the polymer chain. As one can see in
Figure 3, the slopes of MSD above T
g are much higher than those below T
g, showing higher mobility of the polymer chains above the glass transition temperature (namely 417 K).
In reference [
57] the same behavior of temperature dependence of MSD curves of PMMA is observed. Namely, the MSD curves remain constant with variation in temperature below 470 K and MSD values notably increased with temperatures raised above 470 K. The difference between our results and data presented in reference [
57] is probably due to a small number of PMMA molecules in the MD cell (only 3) which was simulated by M. Mohammadi and coauthors compared with our simulation box containing 27 molecules.
In order to understand how the structural behavior of the polymer samples depends on temperature, we calculated the radius of gyration (
Rg), which is one of the most important quantities in conformational statistics of polymer chains [
60,
61,
62]. The radius of gyration was calculated by the following Equation:
where
mi is the mass of site
i and
ri is the position of site
i relative to the center of mass of the molecule. As can be seen from
Figure 4, there is an abrupt change in the slope of
Rg as a function of temperature around 417 K. Thus, at temperatures above 417 K, significant changes in the structure of the polymer are observed, i.e., the polymer transitions from a glassy state to a highly elastic state. It should be noted that the Tg value obtained from the temperature dependence of the specific volume of the bulk PMMA coincides with the value obtained from
Rg(T).
3.2. PMMA in sc-CO2
The first stage of dissolution of any polymer is its swelling. Swelling is the process of absorption of a low molecular weight solvent by a polymer, accompanied by an increase in the mass and volume of the polymer and a change in the conformation of its macromolecules. Because the PMMA solubility is negligible in sc-CO
2 (it is less than 0.001 percentile weight of the extracted amount per unit mass of CO
2 at 333 K and 20 MPa) [
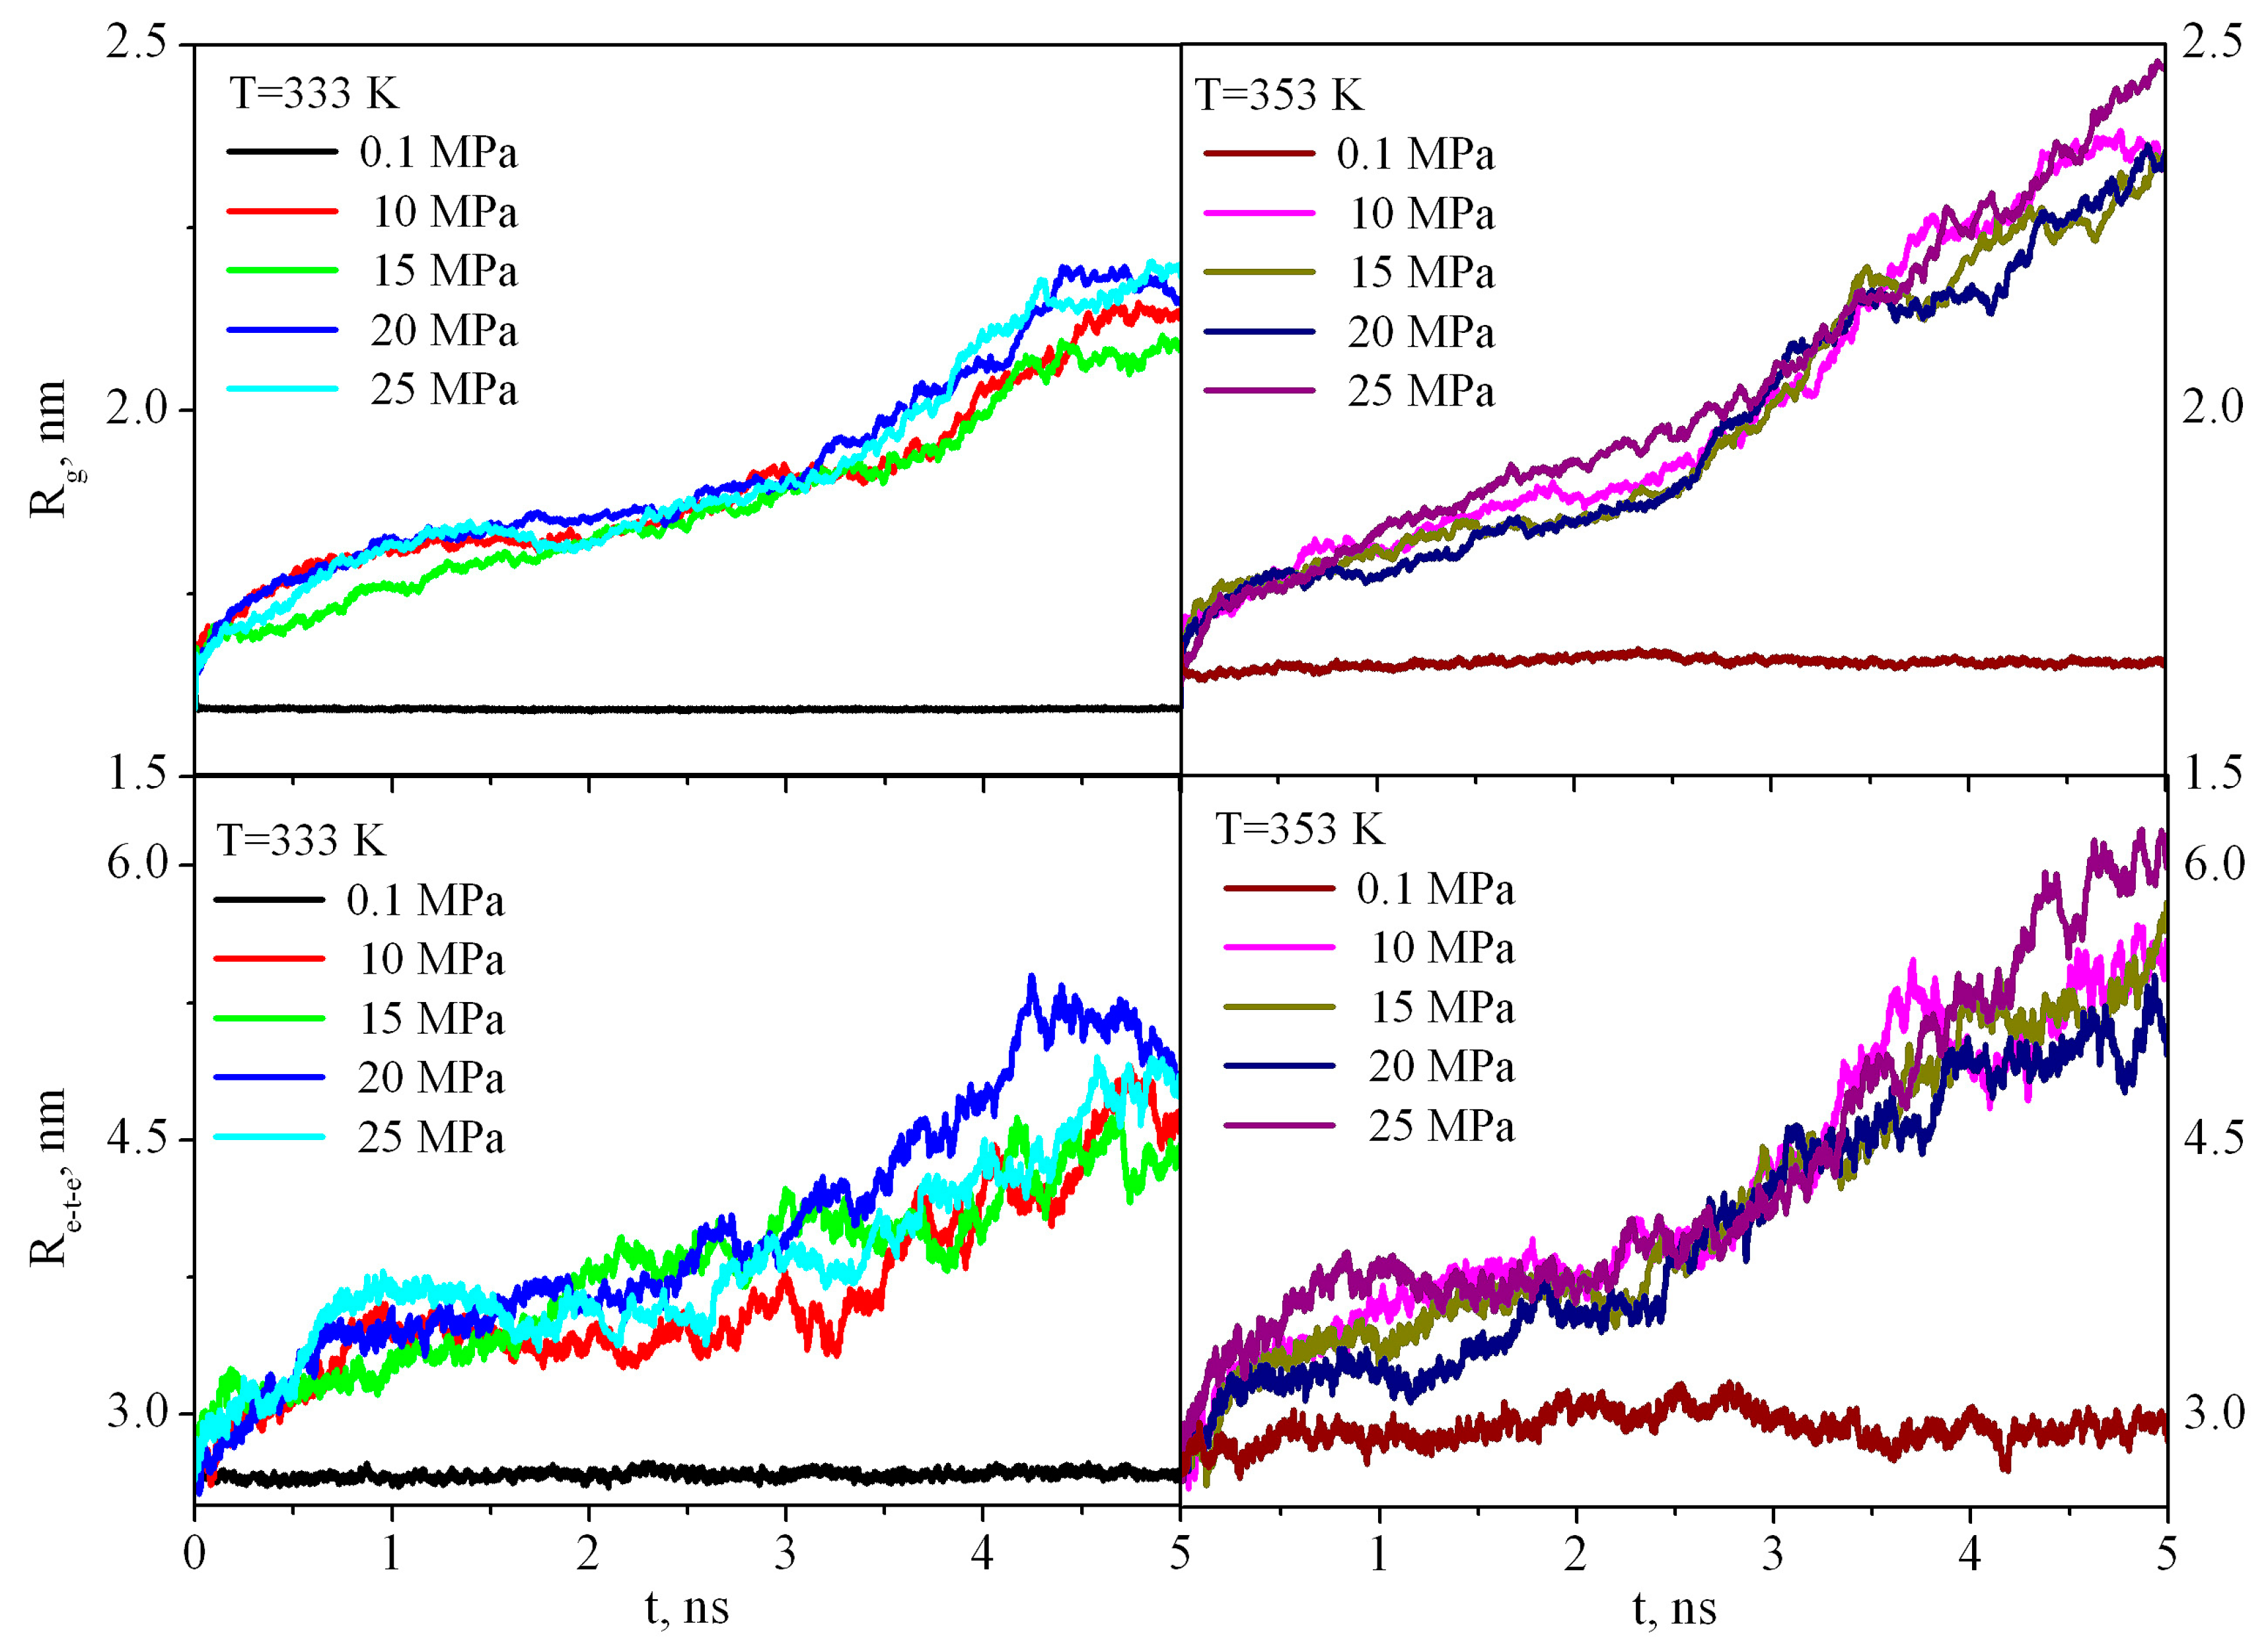
25], the dissolution process stops at the stage of swelling, and, thus, one can discuss limited swelling of PMMA in supercritical carbon dioxide. PMMA swelling in sc-CO
2leads to an increase in the end-to-end distance R
ete and radius of gyration
Rg (
Figure 5) in comparison with the bulk PMMA where R
ete and
Rg fluctuate around a constant value during the entire simulation time.
In order to investigate the mobility of PMMA segments, we calculated the self-diffusion coefficients of the PMMA from the slope of the MSD according to the Einstein’s relation [
63] as follows:
As
Table 4 shows, the PMMA swelling in CO
2 changes the mobility of the chains. The self-diffusion coefficient of the polymer in the supercritical solvent is three orders of magnitude higher than in the bulk.
PMMA in sc-CO
2 has comparatively higher mobility, and thus requires a lower temperature compared with the bulk PMMA to obtain the same segment mobility. The increase in mobility of the polymer molecules after adding CO
2 can be understood as a plasticization effect due to the increased space between the chain segments.
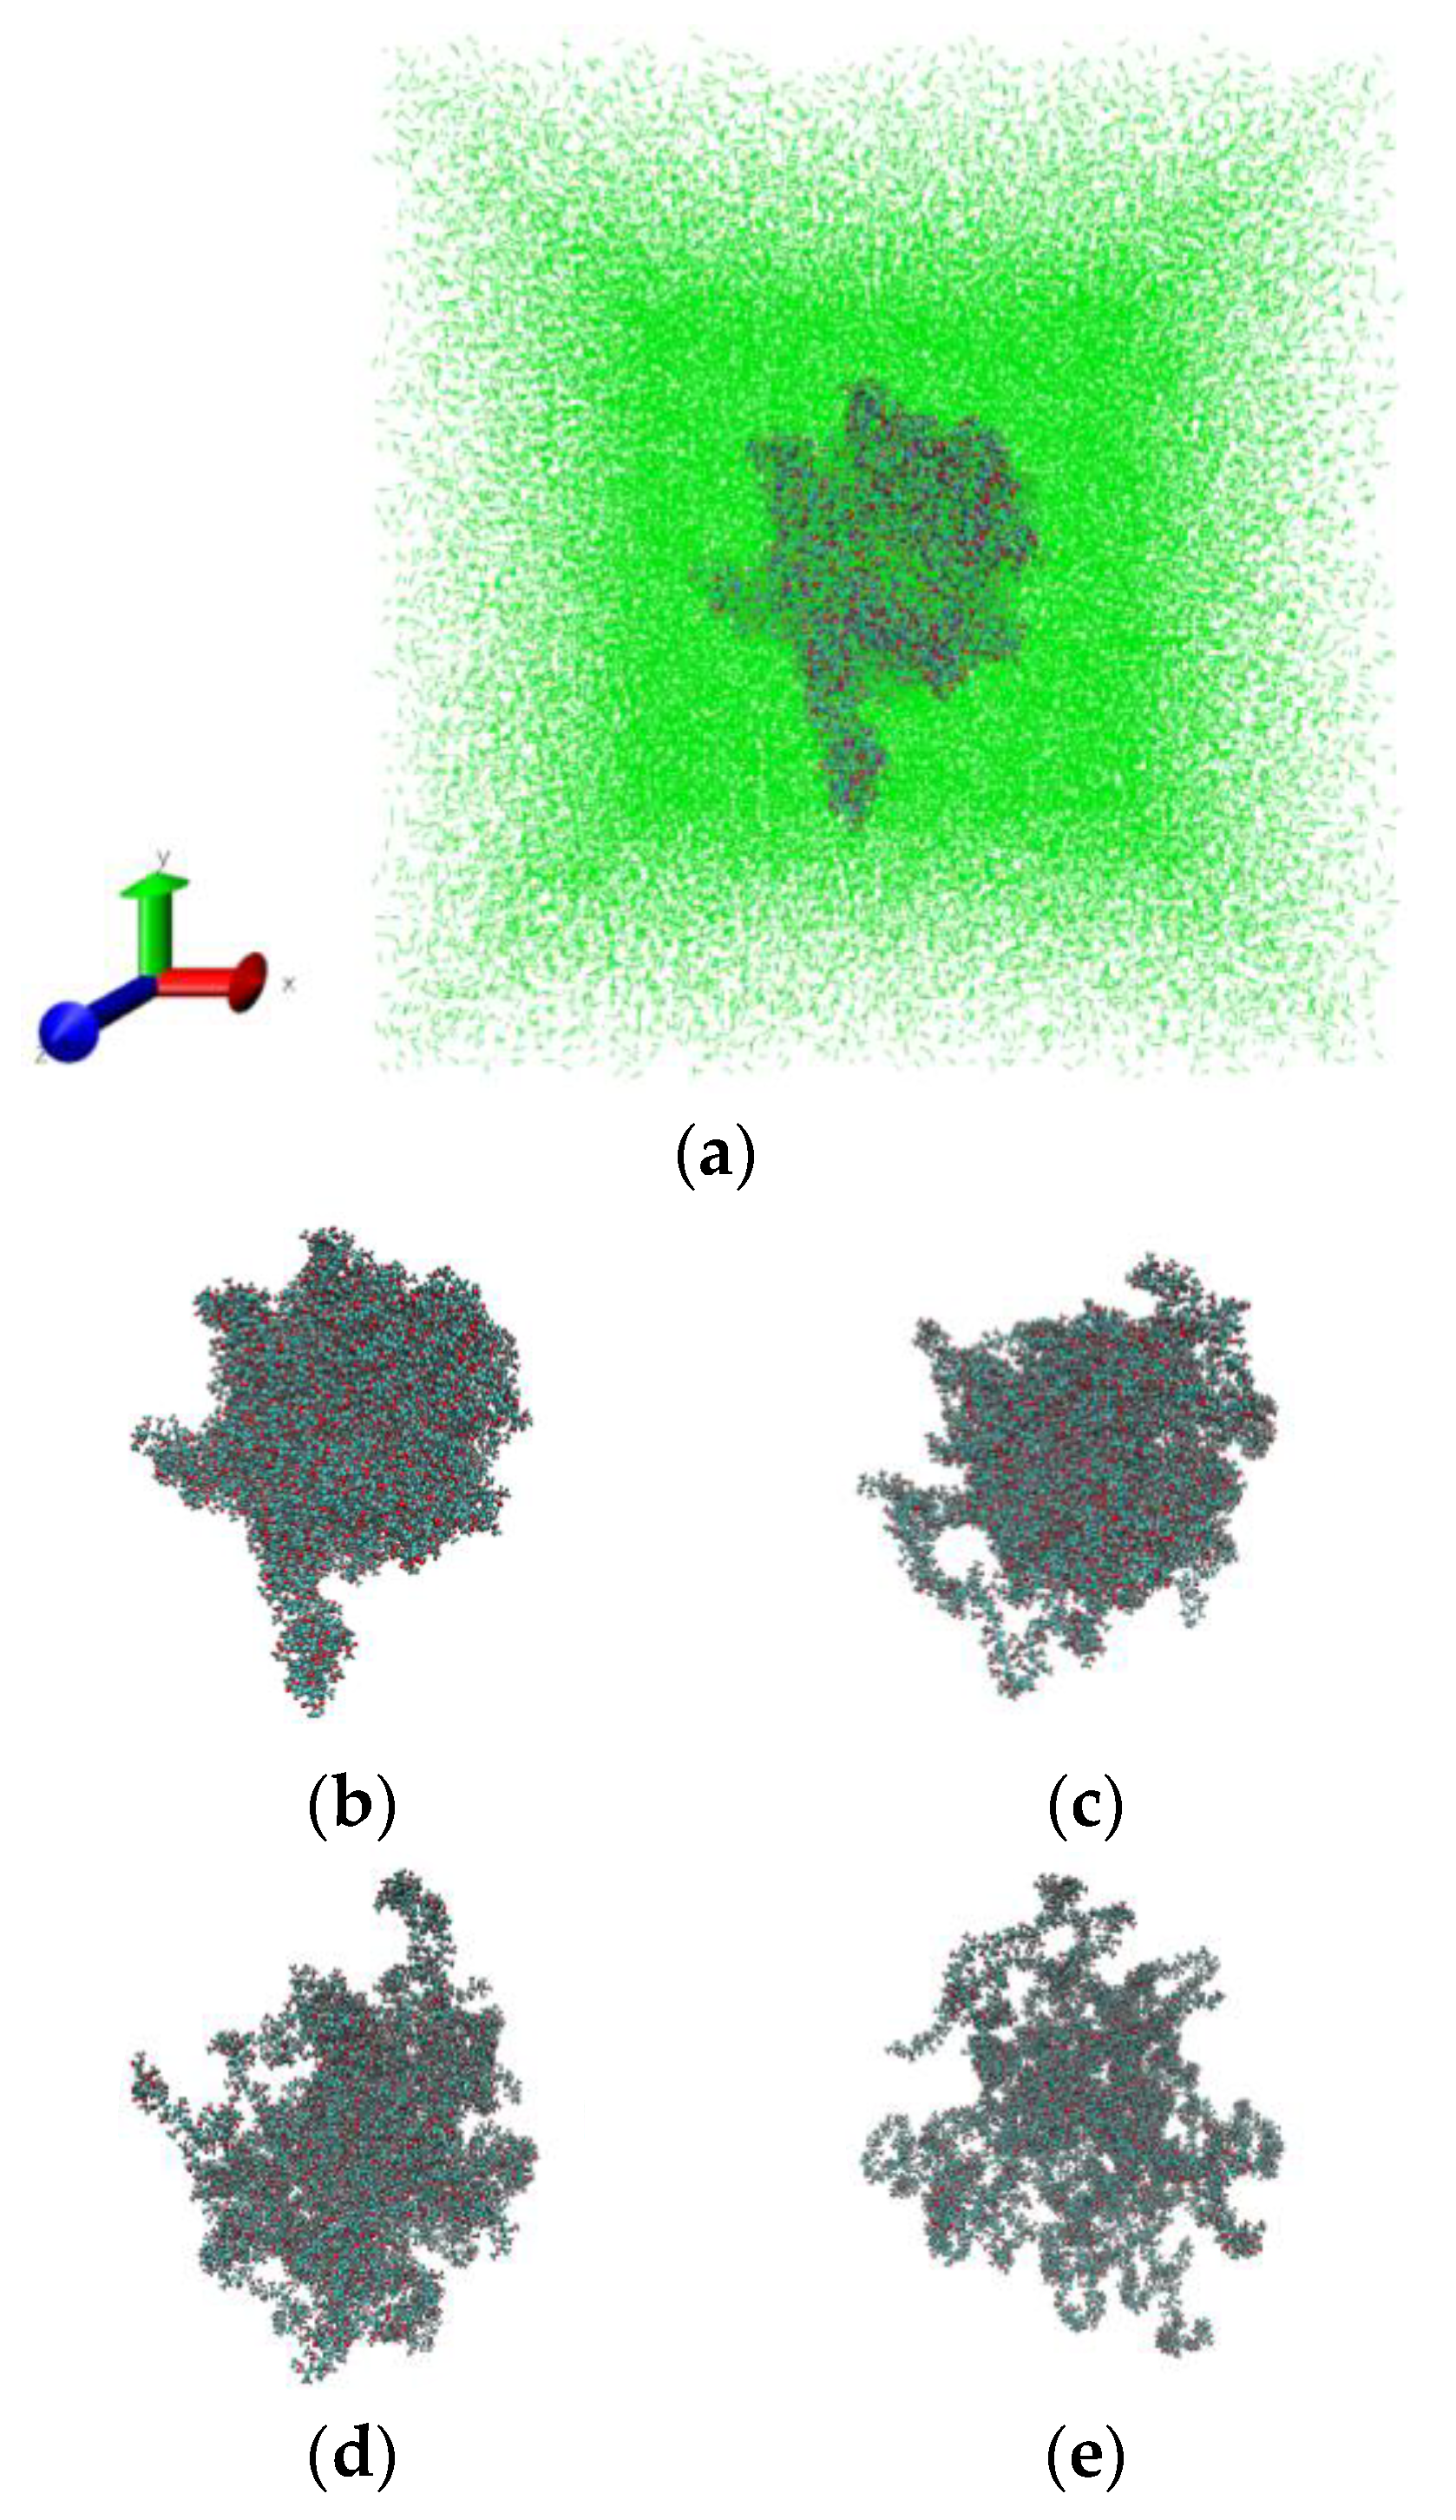
Figure 6 illustrates the swelling process of PMMA in sc-CO
2 at 333 K and 25 MPa. The snapshots have been made by using the visualization program VMD [
64].
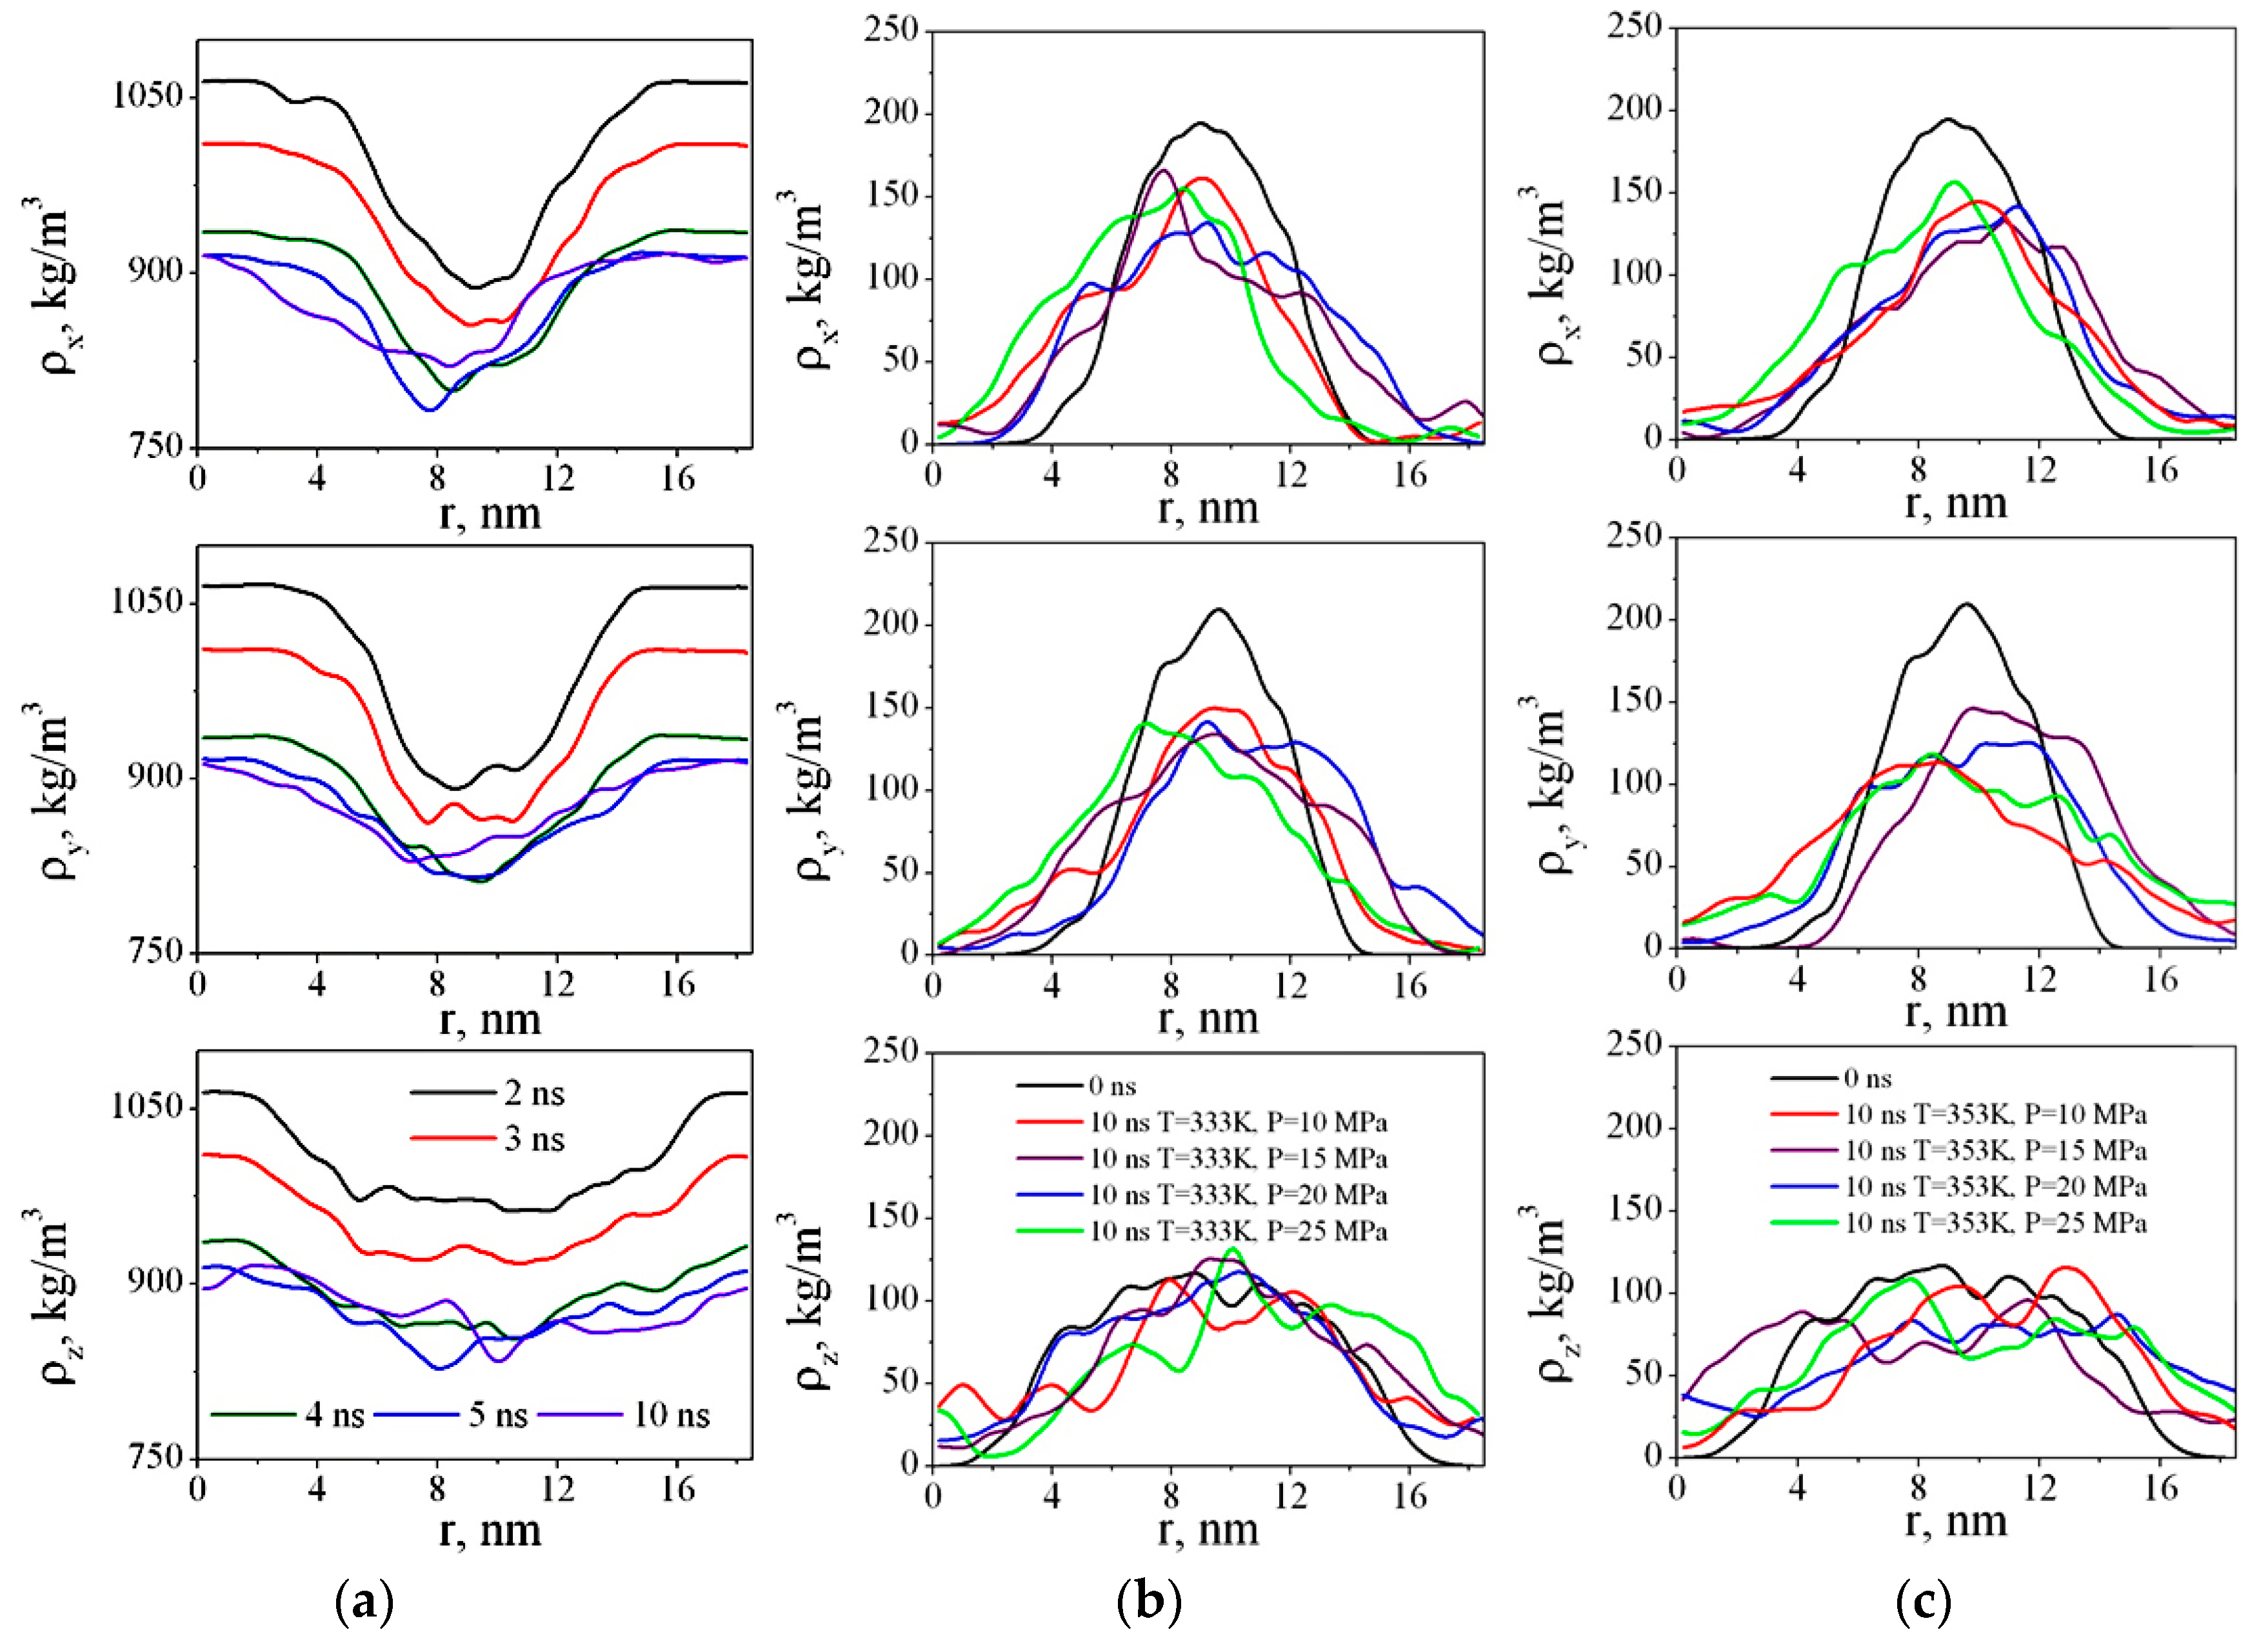
We have calculated the density of CO
2 and PMMA in x, y, and z directions for each nanosecond (
Figure 7).
Figure 7a shows dependences ρ
x(r), ρ
y(r), and ρ
z(r) after 2, 3, 4, 5, and 10 ns.
Figure 7b,c show the density profiles of PMMA versus time during polymer swelling in sc-CO
2. As we can see, in the first four nanoseconds after the beginning of the simulation, more dramatic changes in the PMMA structure are observed. The CO
2 molecules gradually diffuse into the polymer and the difference in the solvent density at the edges of the box (i.e., outside the polymer) and closer to the center of the box (i.e., in the area where the polymer is located) decreases. The density profiles of PMMA become wider and lower (
Figure 7b,c), meaning the polymer adsorbs the solvent molecules and swells.
The ability of polymers to swell is characterized by the degree of swelling (α), which is defined as the amount of solvent absorbed by the polymer, per unit mass or volume of the polymer:
where
m0 and
V0 are the mass and volume of the original polymer, respectively;
m and
V are, respectively, the mass and volume of the swollen polymer, and
mads is the mass of the solvent adsorbed by the polymer. We try to estimate the degree of PMMA swelling by using the first method, namely, focusing on the mass. The calculation was carried out as follows: the mass of carbon dioxide molecules, located at a distance of 0.5 nm from any PMMA atom was calculated at the initial time (
m0(CO
2)) and every ns (
mt(CO
2)). Then we found the change in the mass of carbon dioxide near PMMA, compared to the initial value:
mads(CO
2) =
mt(CO
2)–
m0(CO
2), i.e., the mass of the solvent adsorbed by the polymer, and then used Equation (4).
Limited swelling occurs over a long time and is determined by the rate of diffusion of the solvent molecules into the polymer. In the simplest case, the swelling process proceeds as a first-order reaction, therefore the swelling rate is equal to:
where
k is the swelling rate constant,
αmax is the maximum degree of swelling.
Thus, the swelling kinetics Equation has the following form:
Using Equation (7), the degree of PMMA swelling obtained from MD by means of Equation (4) was described as a function of time (
Figure 8). The standard deviation was about 0.99.
Table 5 shows the coefficients of the swelling equation for all of the systems.
Certainly, the maximum degree of PMMA swelling in sc-CO
2obtained from MD simulations is significantly different from the experimental results. For example, in reference [
64,
65,
66] it has been shown that the equilibrium degree of swelling of PMMA in sc-CO
2 can be as high as 20 wt %, and the authors of reference [
26] obtained a volume degree of PMMA swelling of 32 ± 6% at 323K and 12.5 MPa and 37 ± 5% at 311 K and 12.5 MPa. In the recent work of R. Li et al. [
24] the swelling ratio, which is defined as the ratio of the volume change under isobaric conditions during the swelling with the initial volume of the polymer sample at ambient temperatures, was found to be 0.8654 at 353 K and 10 MPa and the highest value of the swelling ratio 1.1910 was achieved at 363 K and 12 MPa. Such discrepancies between the MD and the experiment are the result of differences in the sample molecular weight and size: in reference [
26] the molecular weight of PMMA was M
W = 4098 kDa, in reference [
24] the average molecular weight was 500 kDa, while in the MD simulations it was a few orders of magnitude lower than in the experiments, M
W = 10 kDa. Based on the analysis of the data presented in
Table 5, it can be concluded that temperature has a positive effect on the PMMA swelling rate, but has a negative effect on the maximum swelling degree of the polymer, which is probably more highly influenced by the density of the solvent rather than by the temperature or pressure. Based on experimental study of swelling and impregnation process of PMMA in supercritical CO
2, the authors of reference [
67] have concluded that volume expansion of PMMA increases with increase in pressure and decreases with increases in temperature. Moreover, the effects of pressure and temperature on the extent of volume increase were directly related to the increase in solvent density.
The addition of a PMMA sample to sc-CO
2 decreases the diffusion of the CO
2 molecules compared to the pure fluid, which indicates that carbon dioxide actively interacts with the PMMA functional groups (
Table 6). These data clearly show that the diffusion coefficients of the CO
2 molecules which are located inside the PMMA sample near the ester groups are 1.5–2 times lower than the system averaged diffusion coefficients of the CO
2 molecules, and even up to 8 times lower than in bulk supercritical carbon dioxide. Among other things, the latter fact demonstrates the polymer thickening ability in relation to the solvent. One can see that while in the pure supercritical carbon dioxide, the CO
2 diffusion coefficients are strongly dependent on the pressure (or, in other words, on the solvent density) and vary from ≈23 × 10
−5 cm
2/s to ≈111 × 10
−5 cm
2/s, in the mixture with the polymer, the diffusion coefficients values of the solvent molecules vary around one order (10–14) × 10
−5 cm
2/s. CO
2 diffusion inside PMMA does not almost depend on temperature and pressure and D
CO2 values vary from ≈6 × 10
−5 cm
2/s to ≈7 × 10
−5 cm
2/s. The latter may indicate that internal structure of PMMA samples (for example, size of cavities where CO
2 molecules are located) is similar. Through analysis of the movement of optical boundaries and the kinetics of swelling, the diffusion coefficients of CO
2 in the PMMA were calculated by Gallyamov M. O. and colleagues [
26]. For instance, they found that at 311 K and 15 MPa, the diffusion coefficients of CO
2 obtained with using optical technique and from volume swelling kinetics are equal at (0.20 ± 0.03) × 10
−5 cm
2/s and (0.07 ± 0.03) × 10
−5 cm
2/s, respectively. Taking into account the differences in the temperature and the sample size in the experiment and our simulations, we can conclude that the diffusion coefficients from MD simulations are consistent with the experimental data. Gallyamov M. O. and colleagues [
26] also noted that as the temperature increased from 311 K to 338 K, the diffusion coefficient in PMMA increased by 20%–40%. In our case when the temperature increased from 333 K to 353 K, the diffusion coefficient in PMMA-CO
2 system also increased by 20%–27% depending on the pressure.
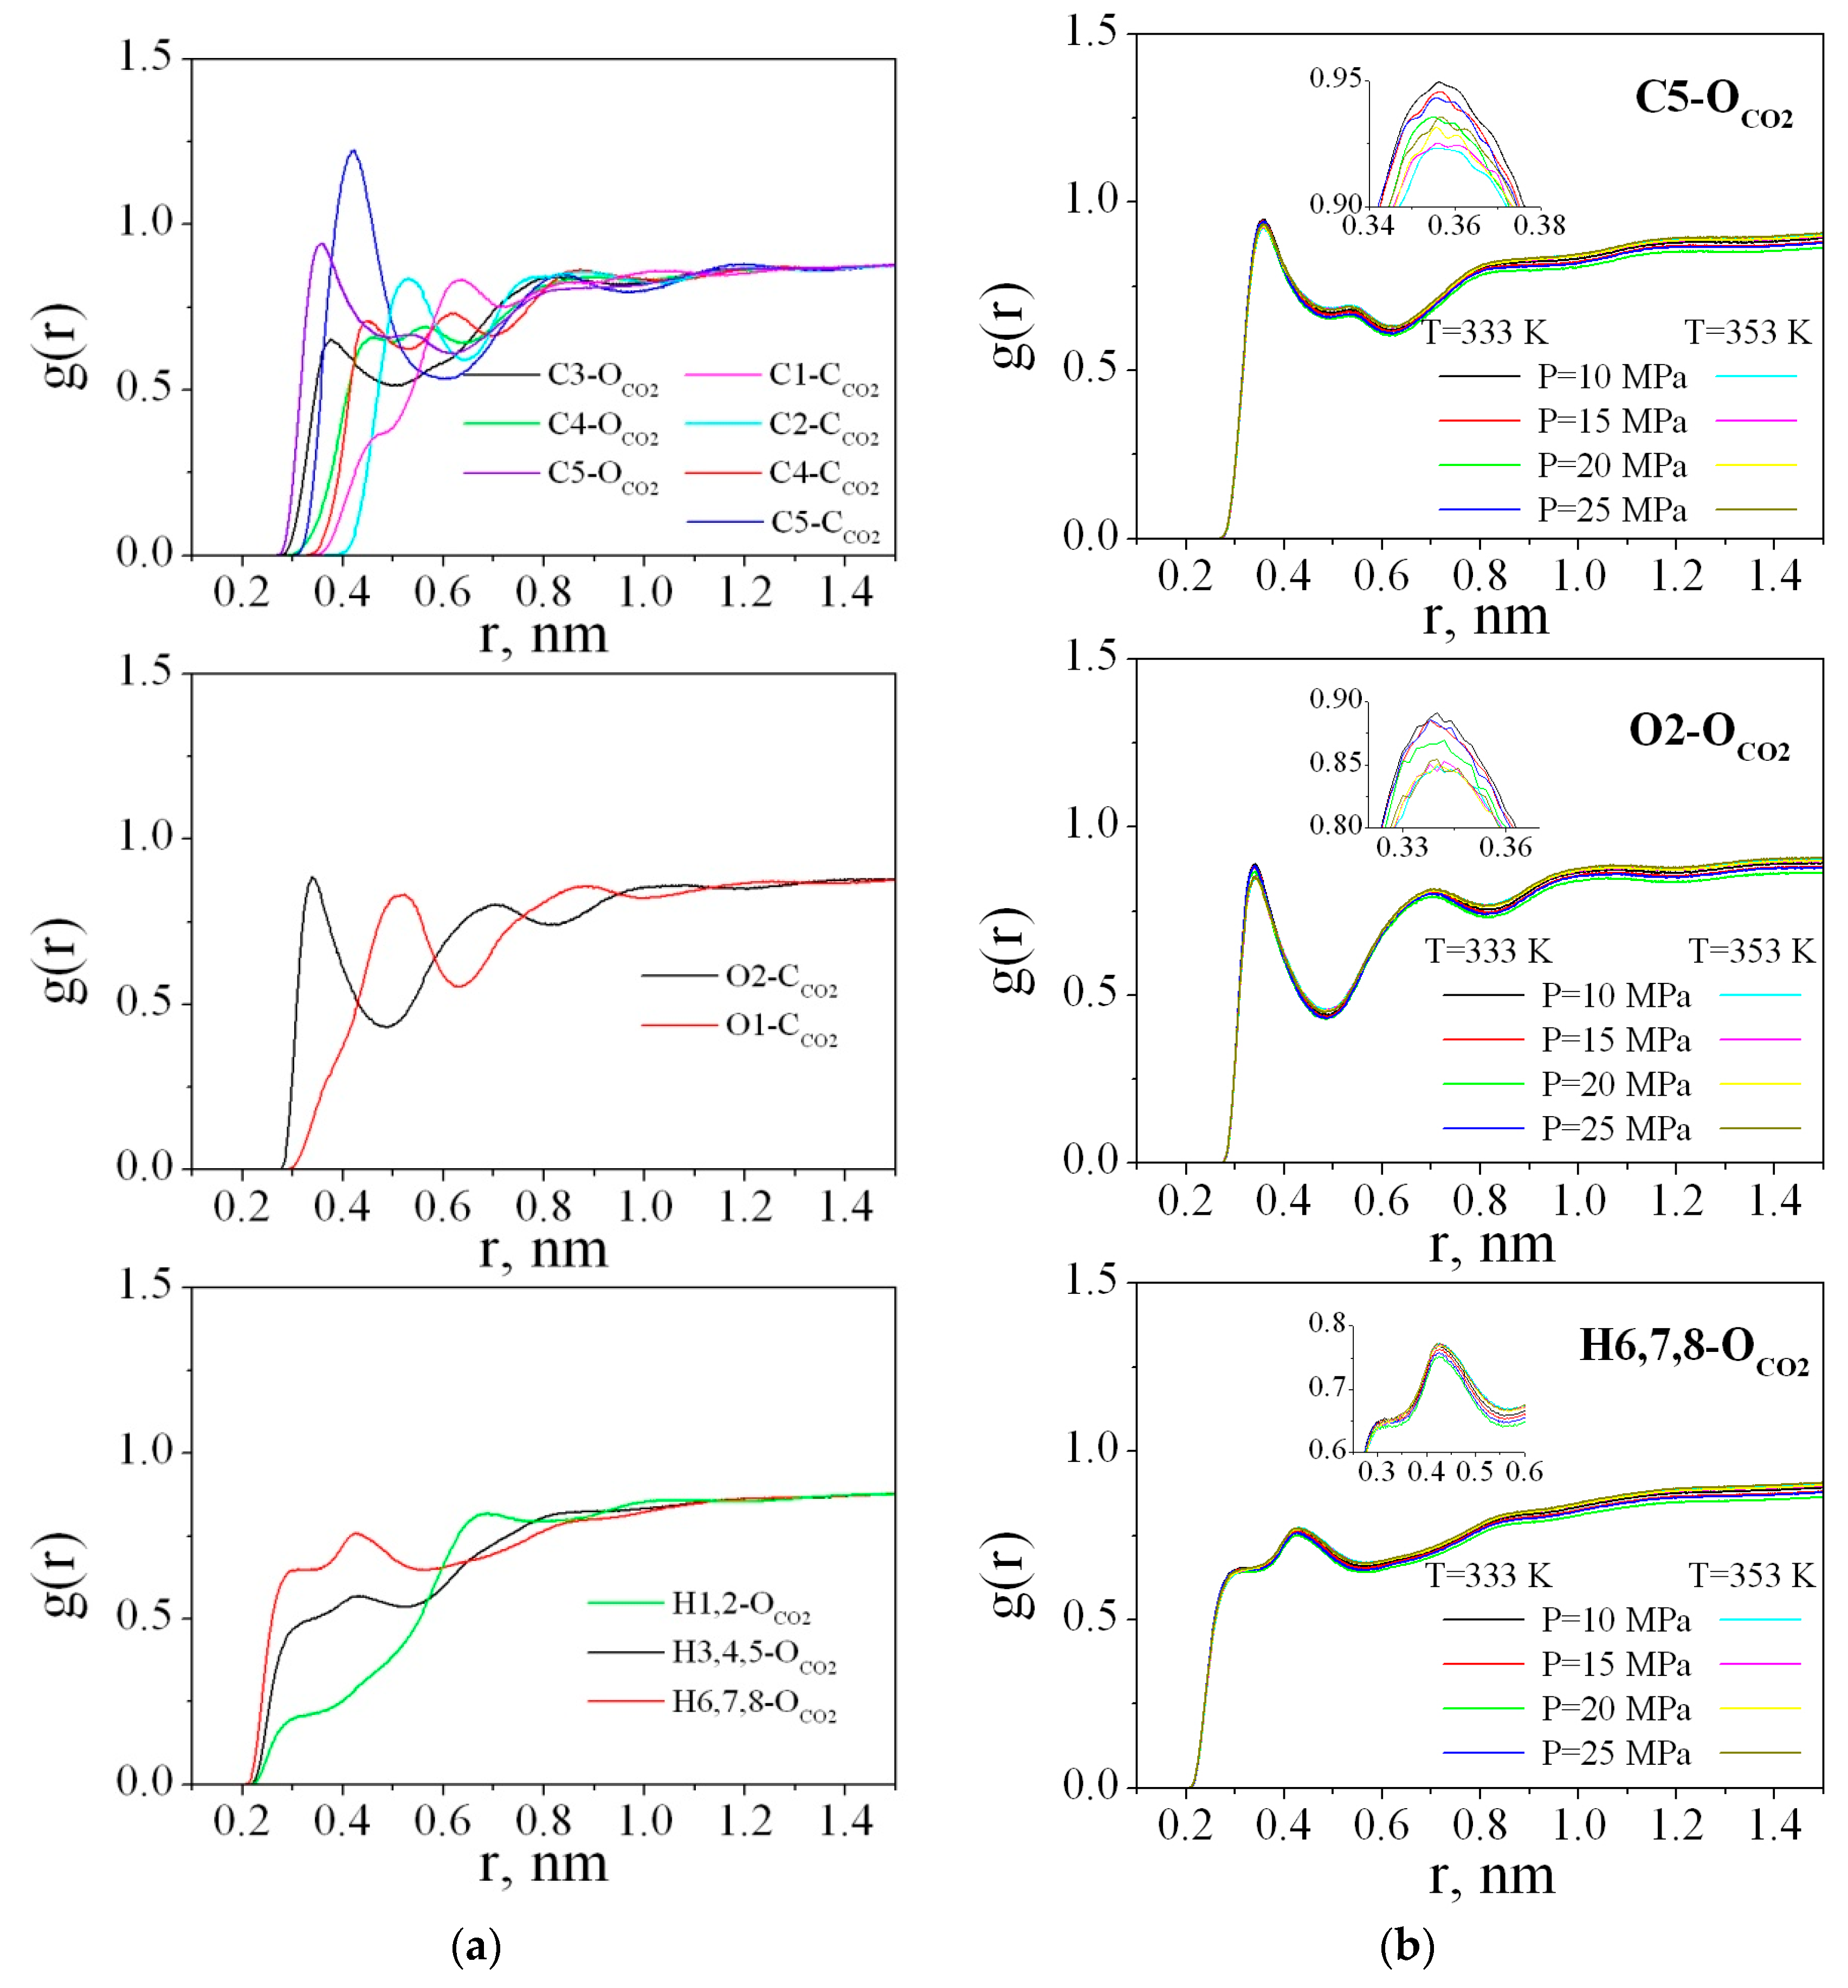
The radial distribution functions (RDFs) between the PMMA and CO
2 atoms were obtained by averaging over the last 2 ns of the trajectory.
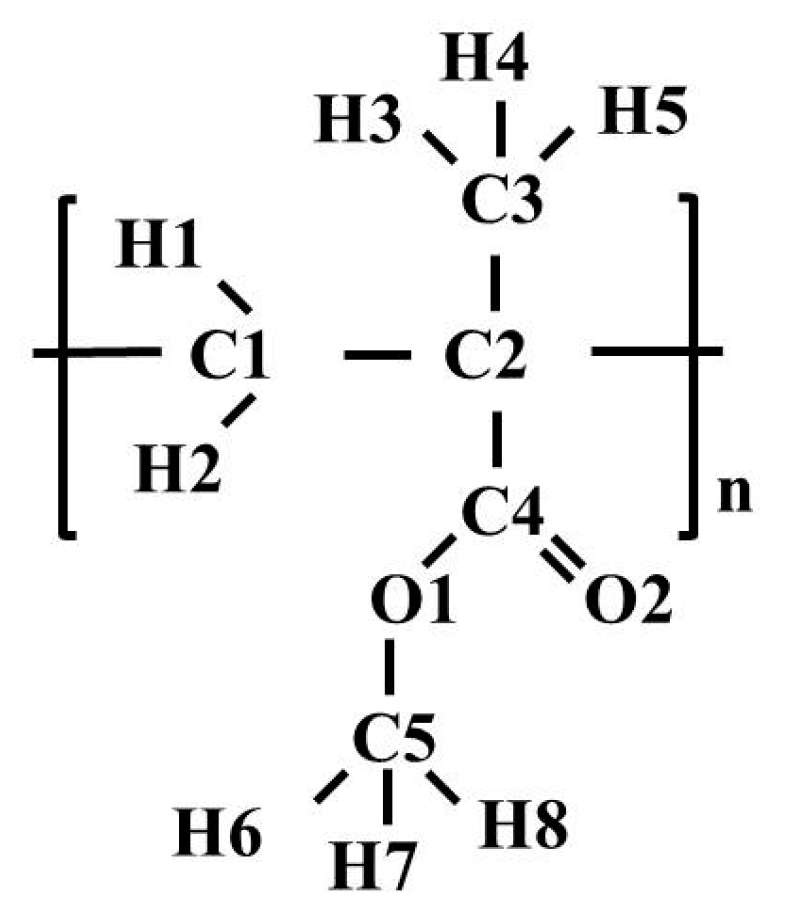
Figure 9a illustrates the RDFs g (r) (C1-C
CO2, C2-C
CO2, C3-O
CO2, C4-C
CO2, C4-O
CO2, C5-C
CO2, C5-O
CO2, O1-C
CO2, O2-C
CO2, H1,2- O
CO2, H3,4,5- O
CO2, and H6,7,8- O
CO2) for the polymer in sc-CO
2 at 333 K and 25 MPa. The RDFs for the other states behave in the same way and
Figure 9b presents only the most pronounced RDFs, namely, C5-O
CO2, O2-C
CO2, and H6,7,8- O
CO2 for all the thermodynamic points.
As clearly shown at
Figure 9a, in the range of r < 0.5 nm, peaks on the RDFs carbon(PMMA)-oxygen(CO
2)/carbon(CO
2) are well distinguished. These peaks determine the arrangement of solvent molecules around the polymer. The most pronounced and highest peaks on the RDFs C5-C
CO2, C5-O
CO2, O2-C
CO2, and H6,7,8-O
CO2 compared to each other allow us to conclude that the ester groups of the polymer are more solvated by carbon dioxide than the methyl groups (including C3, H3, H4, H5 atoms), as well as the carbon and hydrogen atoms of the chain (C1, C2, H1, H2). In the literature [
68], it has been found that there are specific interactions between CO
2 and PMMA which are most probably of a Lewis acid-base nature. However, the strength of such a specific interaction is very weak. Actually the first peak on the O2-C
CO2 RDF from 0.3 to 0.5 nm could be attributed to electron donor-acceptor (EDA) interactions because the maximum is located around 0.35 nm and is within the geometric criterion (0.26 ≤ R
C--O ≤ 0.43 nm) for EDA interactions used by Xu W. et al. and Saharay M. et al. [
69,
70]. For the O1-C
CO2 RDF, the first peak is wider and shifted to 0.5 nm and the small shoulder located in the range 0.3–0.43 nm indicates low probability of O1 atom participation in the EDA interactions with the CO
2 molecules.
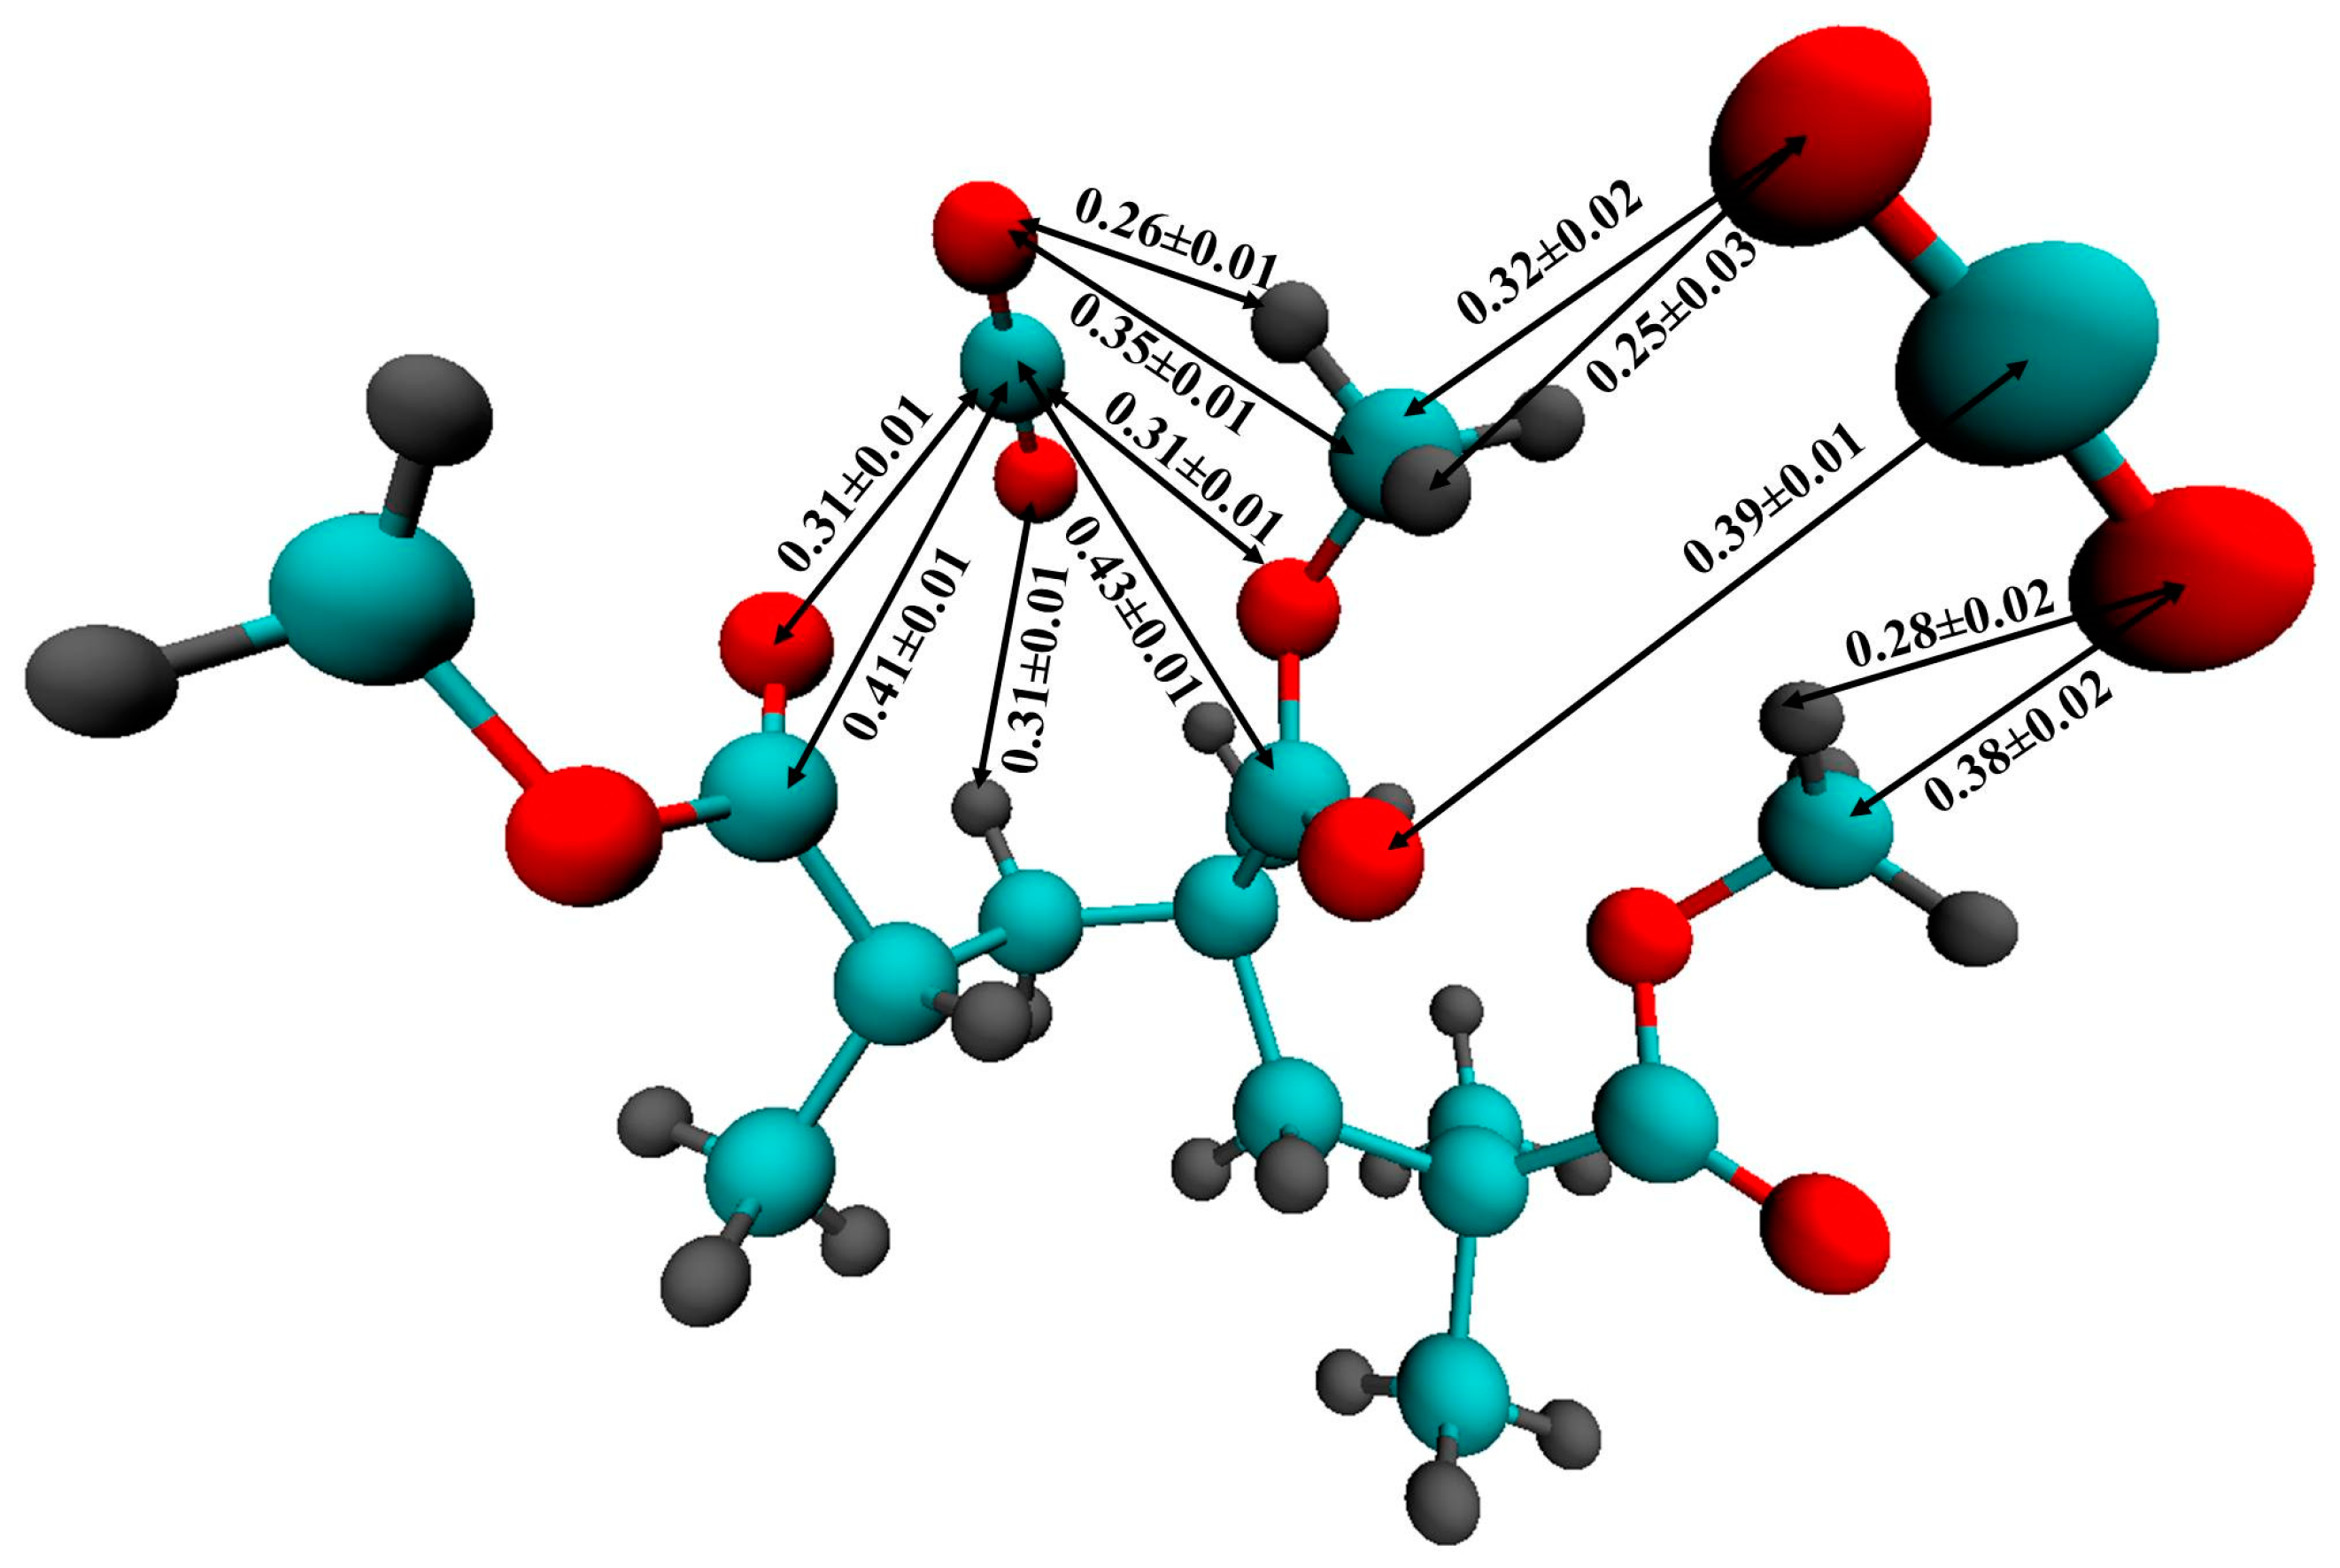
For a more accurate description of the intermolecular interaction between CO
2 and PMMA, we carried out an ab initio Car-Parrinello molecular dynamics simulation of a PMMA fragment consisting of 3 monomer units surrounded by 58 CO
2 molecules.
Figure 10 illustrates the mutual arrangement of two CO
2 molecules interacting with the polymer fragment at the end of the simulation. Visual inspection of the CPMD trajectory shows that such a triple complex existed for ≈120 fs. It is interesting to note that the main distances between the atoms of PMMA and CO
2 are in agreement with the positions of the peaks on the respective RDFs obtained by classical MD. In
Figure 10, one can see that the carbon dioxide molecules are oriented in such a way that they can interact with the hydrogen atoms of the PMMA methyl groups. Previously, P. Raveendran and S. L. Wallen [
71] investigated the role of cooperative C-H⋯O hydrogen bonds (HBs) as a stabilization factor in addition to the EDA interactions between CO
2 and carbonyl group by using ab initio calculations at the second-order Møller-Plesset (MP2) [
72,
73] level. Despite the fact that the C-H⋯O hydrogen bonds (HBs) are very weak, they may have an important stabilizing effect. Assuming that the interaction between the PMMA O atoms and the CO
2C atoms is the only EDA type, it can be expected that two C=O bond lengths of CO
2 should be identical. However, the asymmetry of the C = O bonds in the CO
2 molecules (1.15 Å and 1.19 Å, 1.17 Å and 1.20 Å for two CO
2 molecules, respectively) and, in addition, the shortening of the C-H bonds participating in the HBs (1.09 Å) compared with “free” C-H (1.14-1.16Å) allow us to suppose that there is interaction like an HB. Moreover, the distance between C of the methyl groups and O of CO
2 is less than the upper limit (0.4 nm) for C-H⋯O hydrogen bonding [
74]. On the classical RDFs C5-O
CO2, and H6,7,8-O
CO2, the peaks are located at 0.35 and 0.28 nm, respectively, which is also within the geometric criterion of weak C-H⋯O HB.
For PMMA, the research of J. R. Fried and W. Li [
75] indicated that there are weak dipole-dipole interactions between the ester moieties in PMMA. Also, they demonstrated that carbon dioxide is capable of overcoming the internal interactions of the carbonyl groups. Our findings concerning specific interactions between CO
2 and PMMA confirm that they are responsible for the observed plasticization of the polymer.


