Magnetic Nanoparticles of Zinc/Calcium Ferrite Decorated with Silver for Photodegradation of Dyes

 ,
,  and
and
Abstract
:1. Introduction
2. Materials and Methods
2.1. Nanoparticles Preparation
2.1.1. Zinc/Calcium Ferrite Nanoparticles
2.1.2. Zinc/Calcium Ferrites Decorated with Silver Clusters
2.2. Structural Characterization
2.2.1. Transmission Electron Microscopy (TEM)
2.2.2. X-Ray Diffraction (XRD)
2.2.3. Magnetic Measurements
2.3. Photodegradation Assays
3. Results and Discussion
3.1. Nanoparticles Characterization
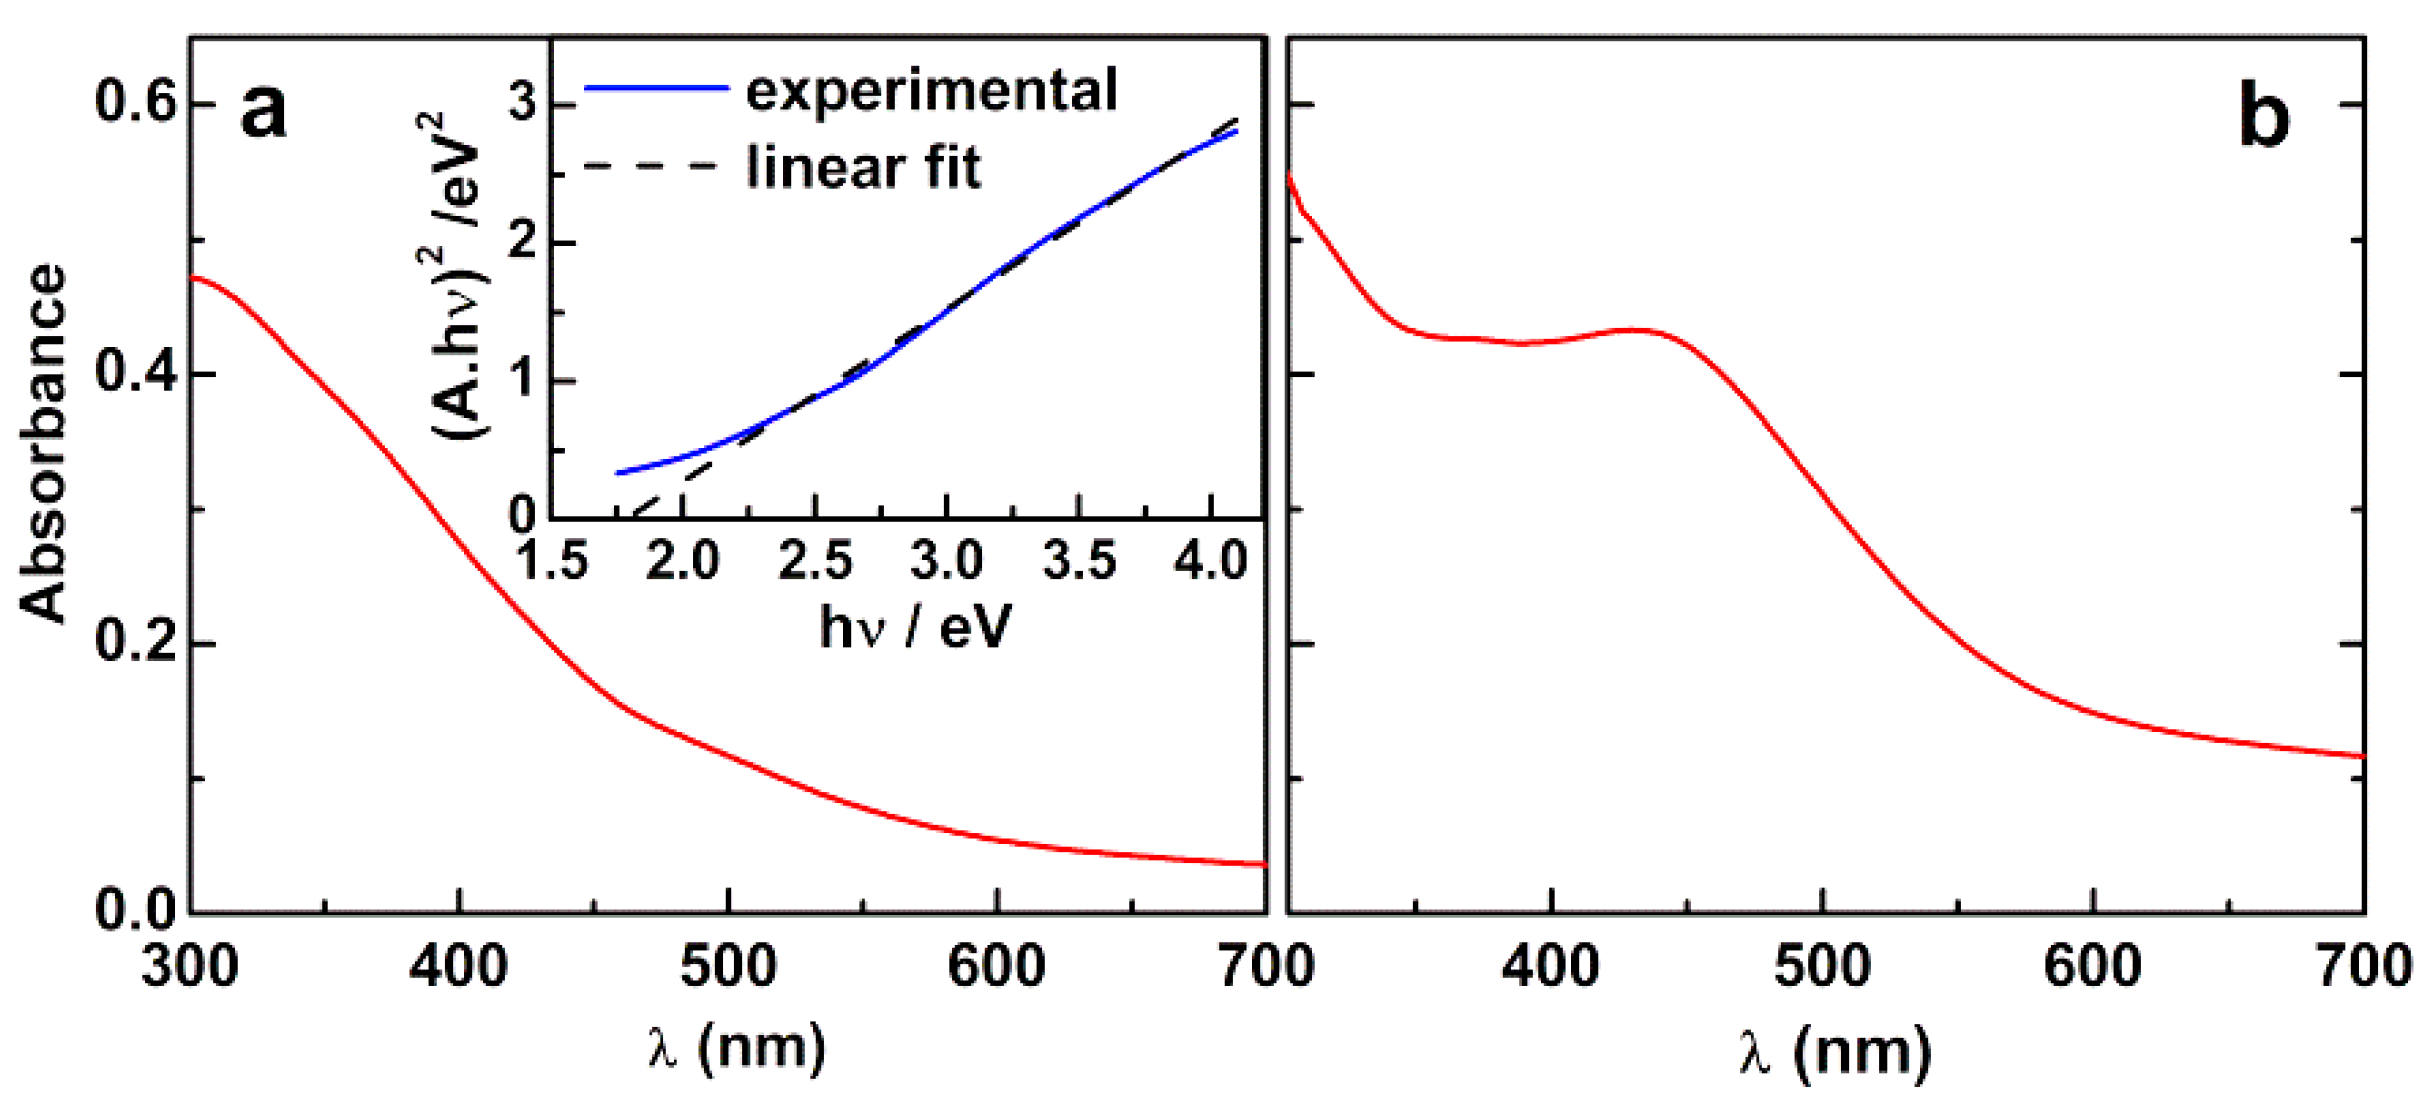
3.1.1. Absorption Spectra
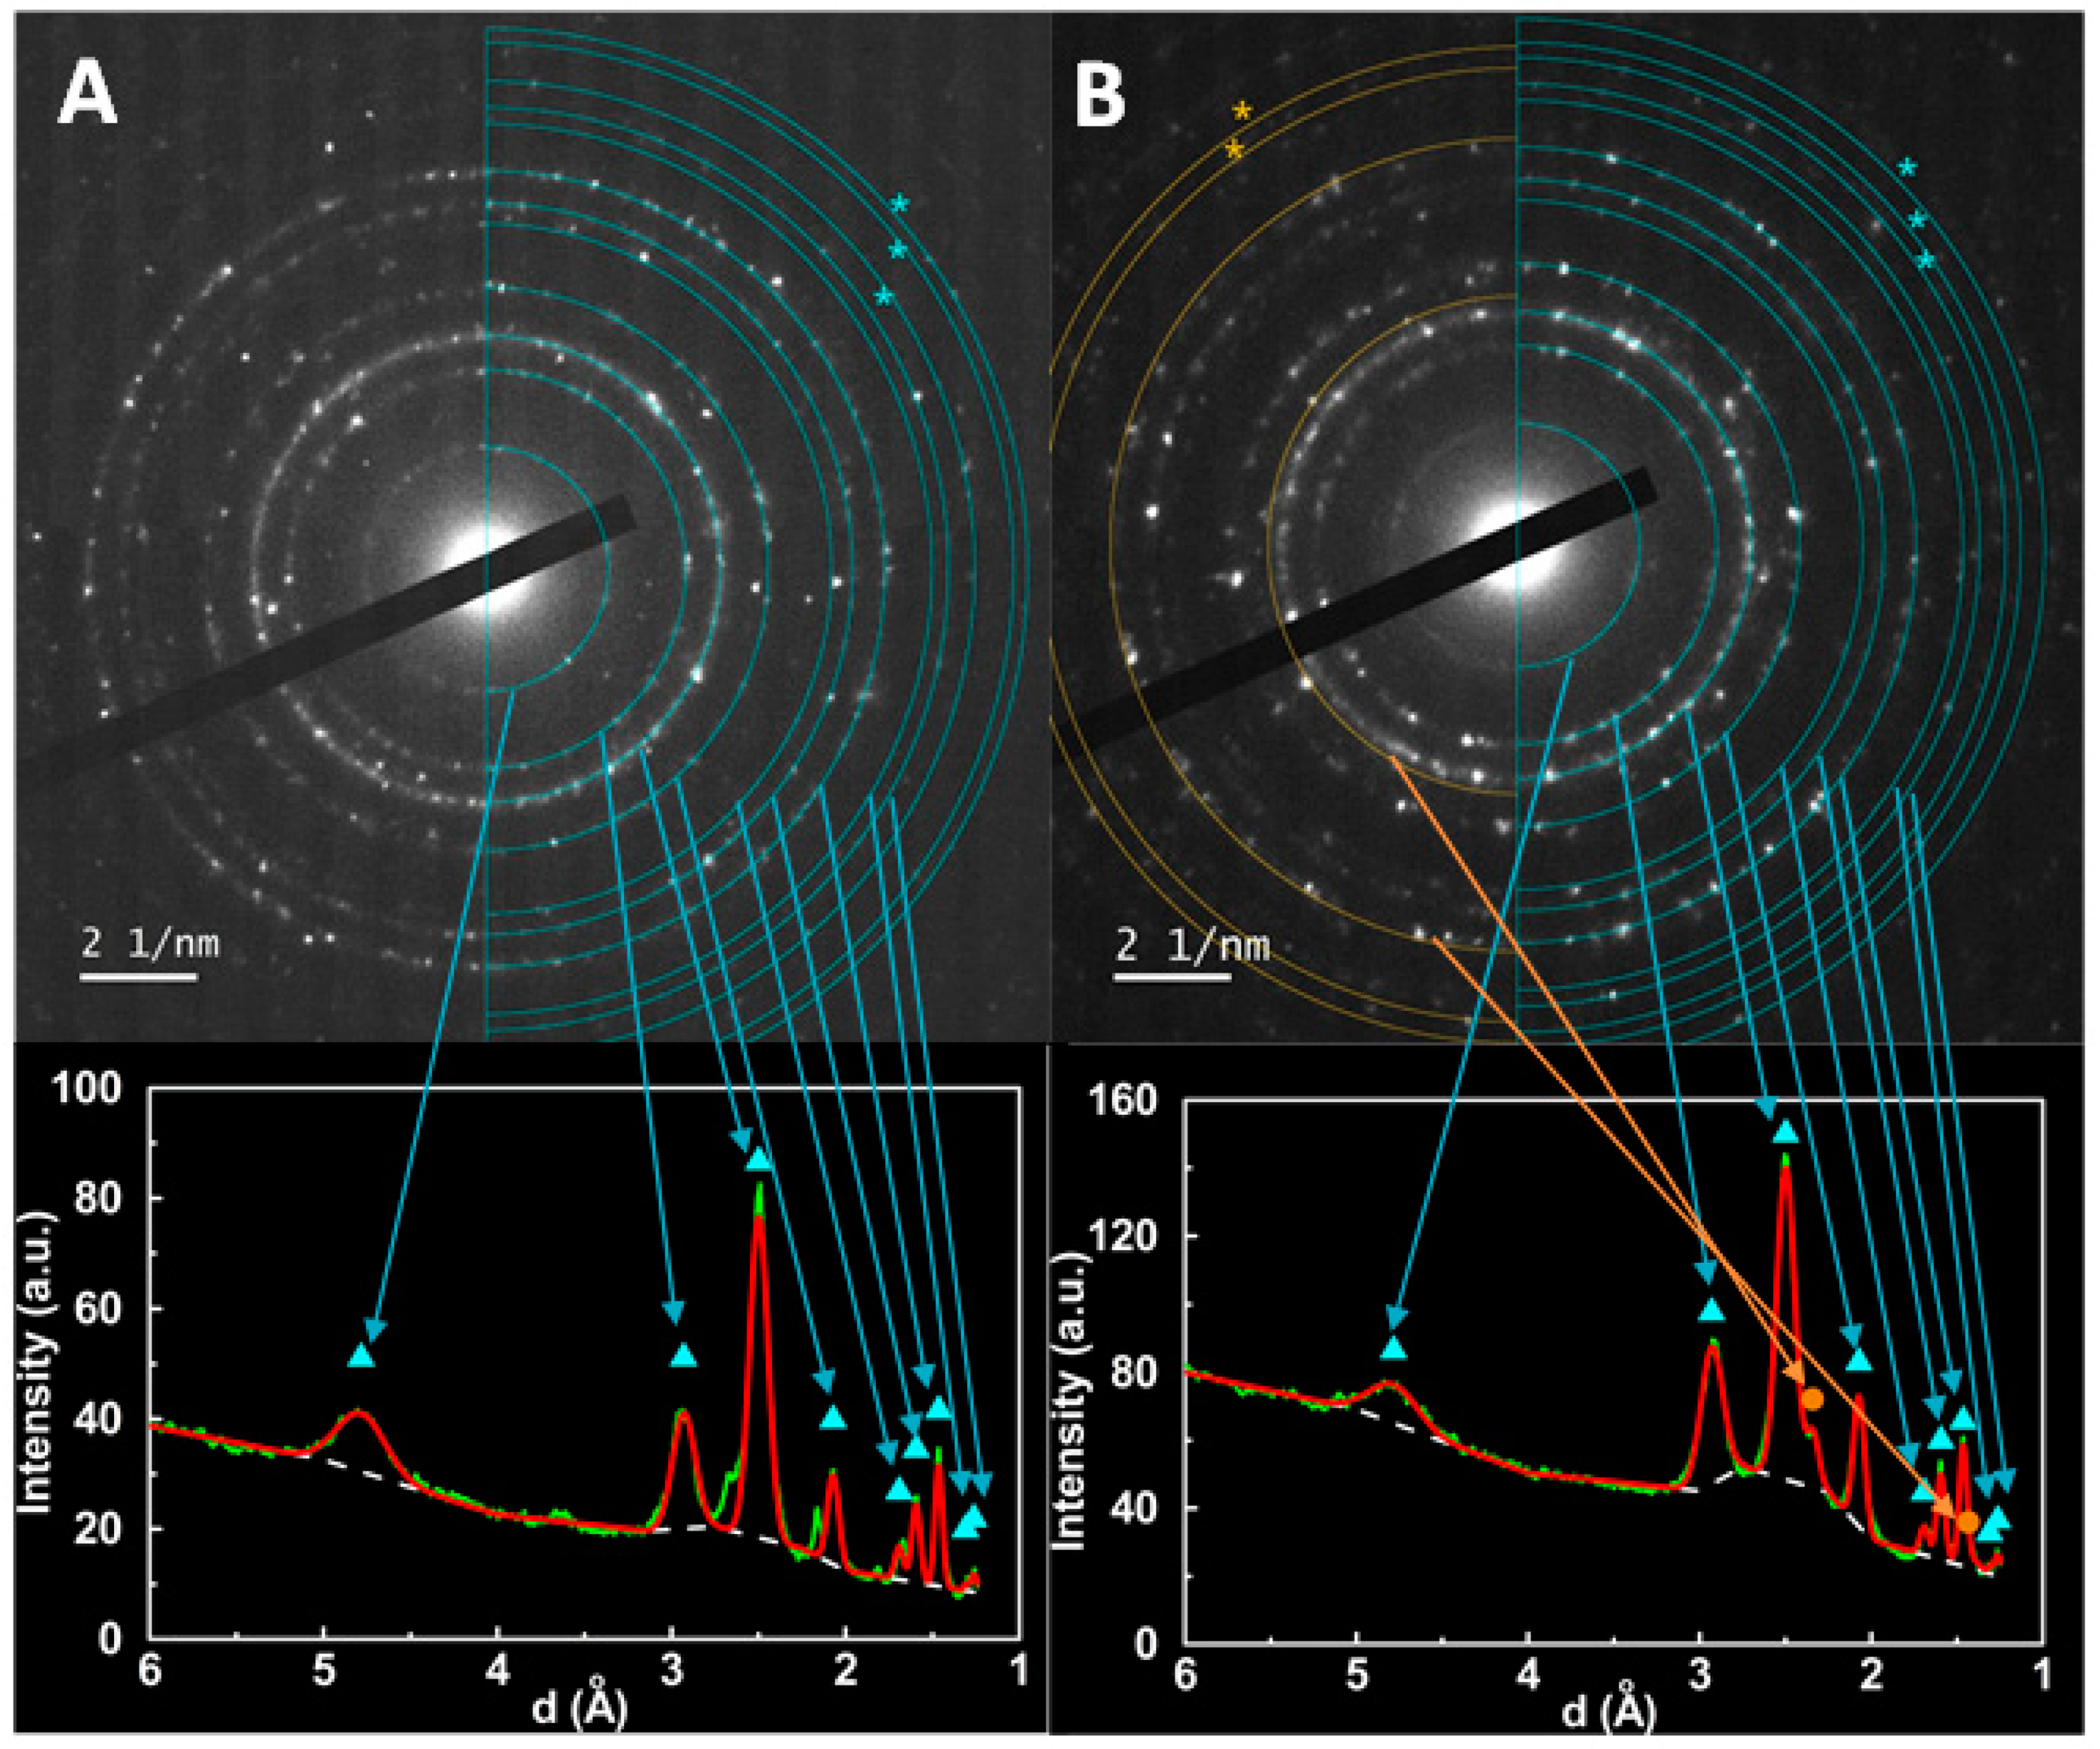
3.1.2. X-Ray Diffraction (XRD) Measurements
3.1.3. Transmission Electron Microscopy (TEM)
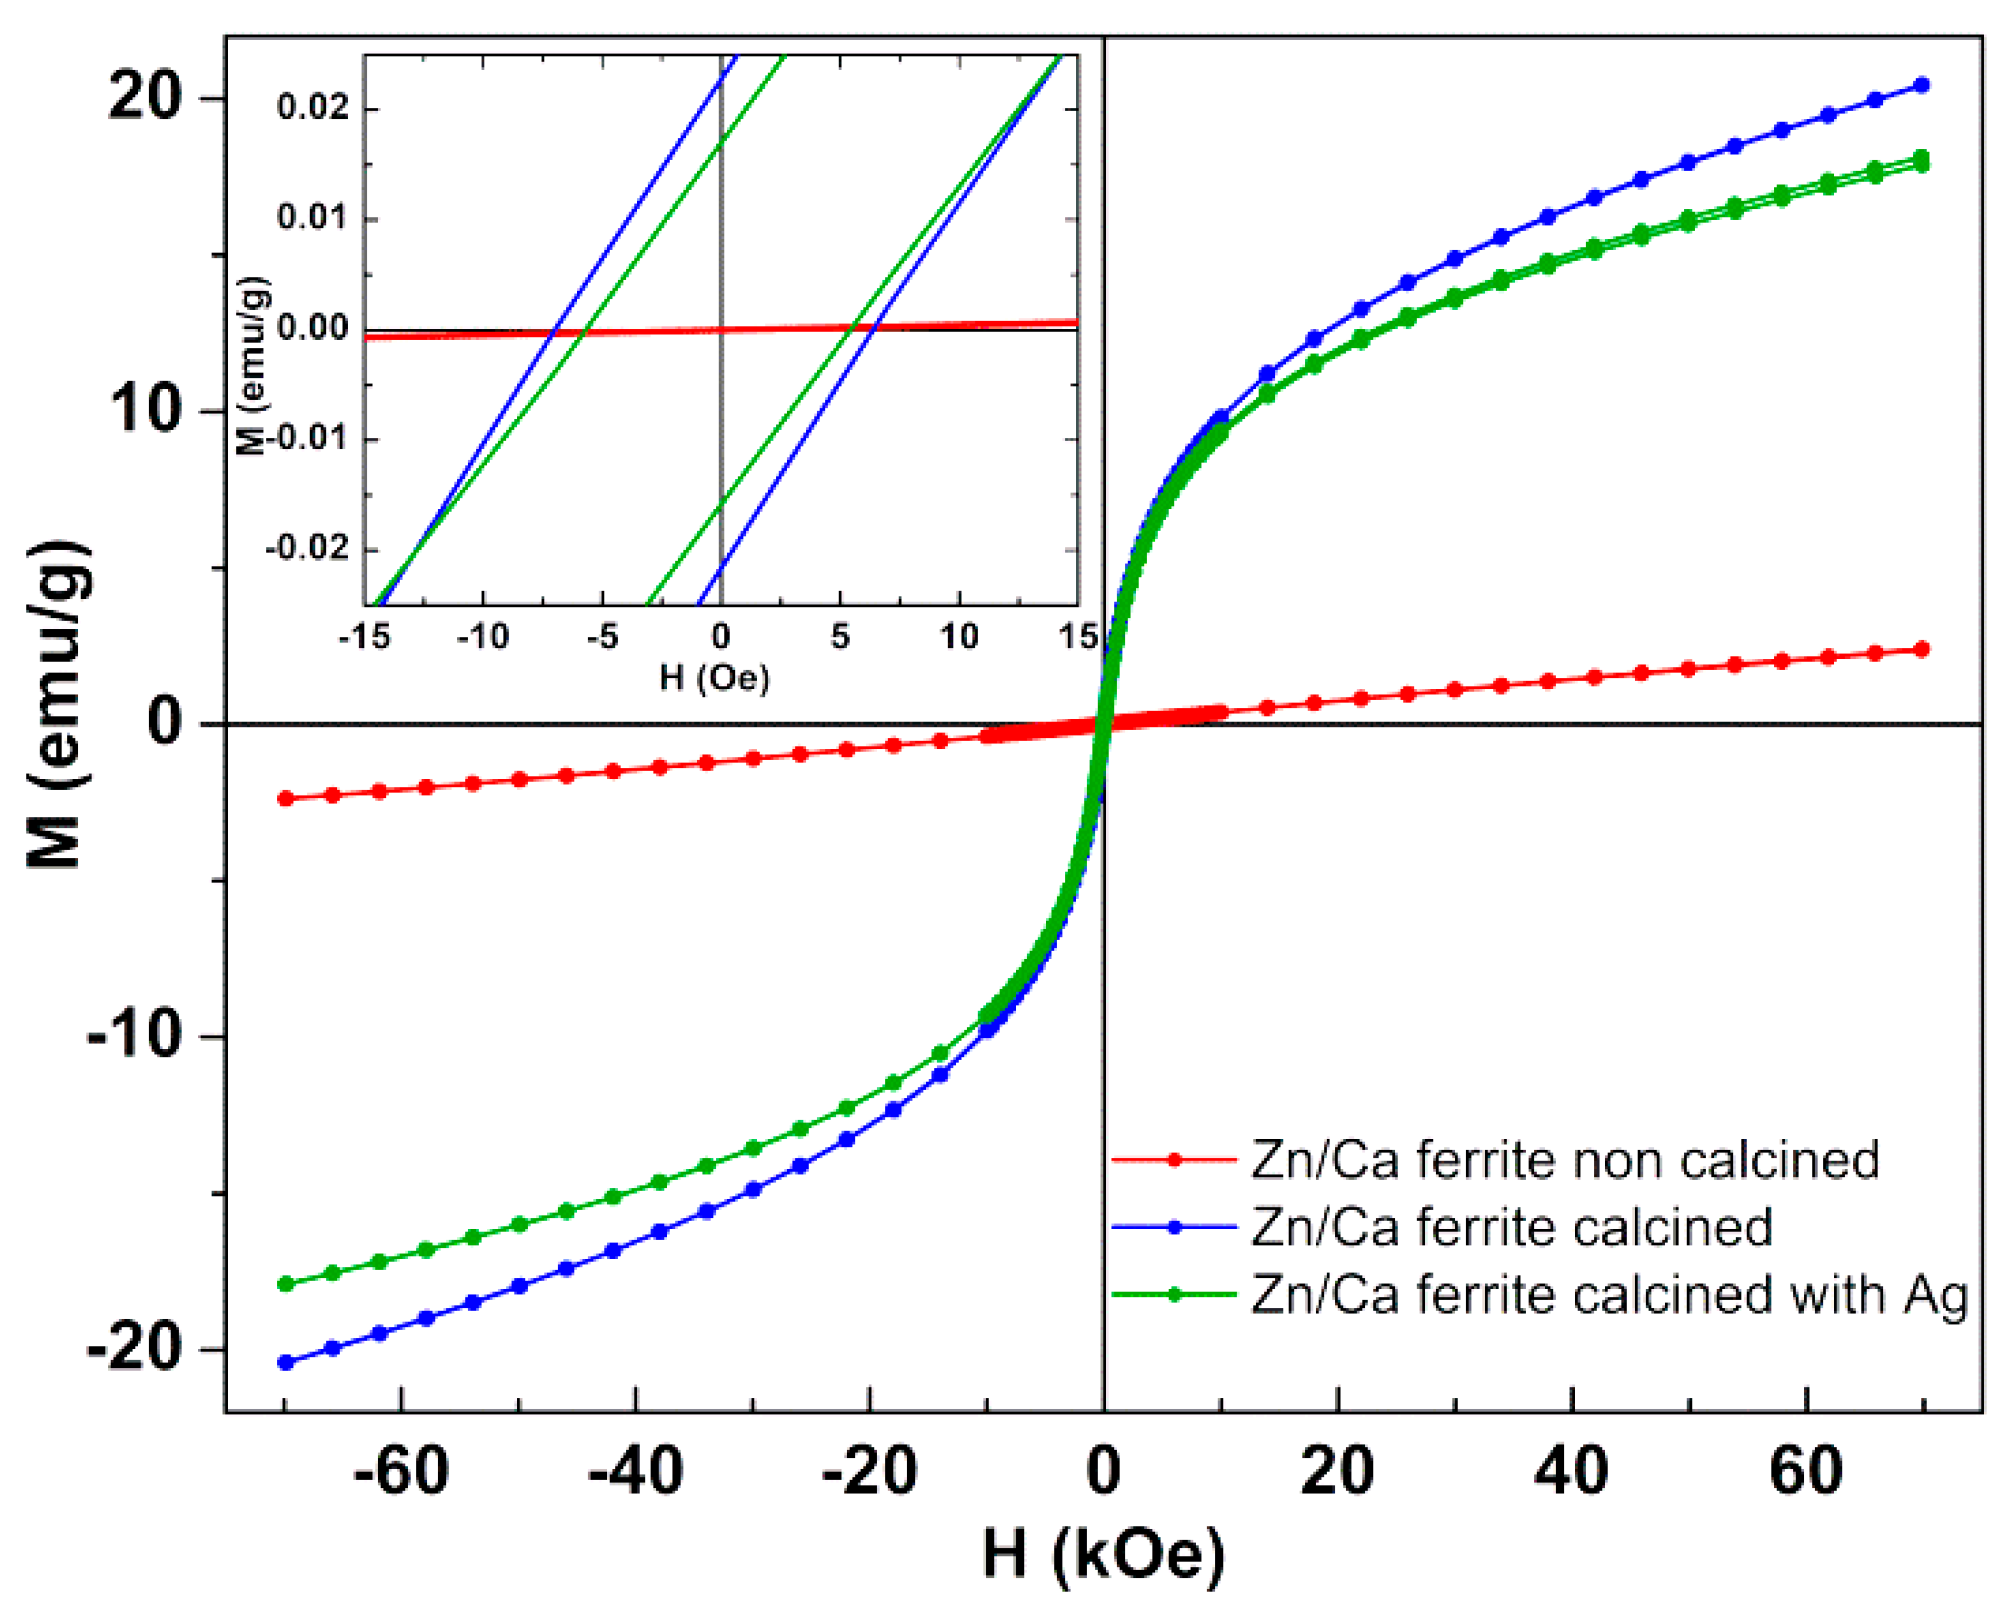
3.2. Magnetic Properties
3.3. Photodegradation Assays
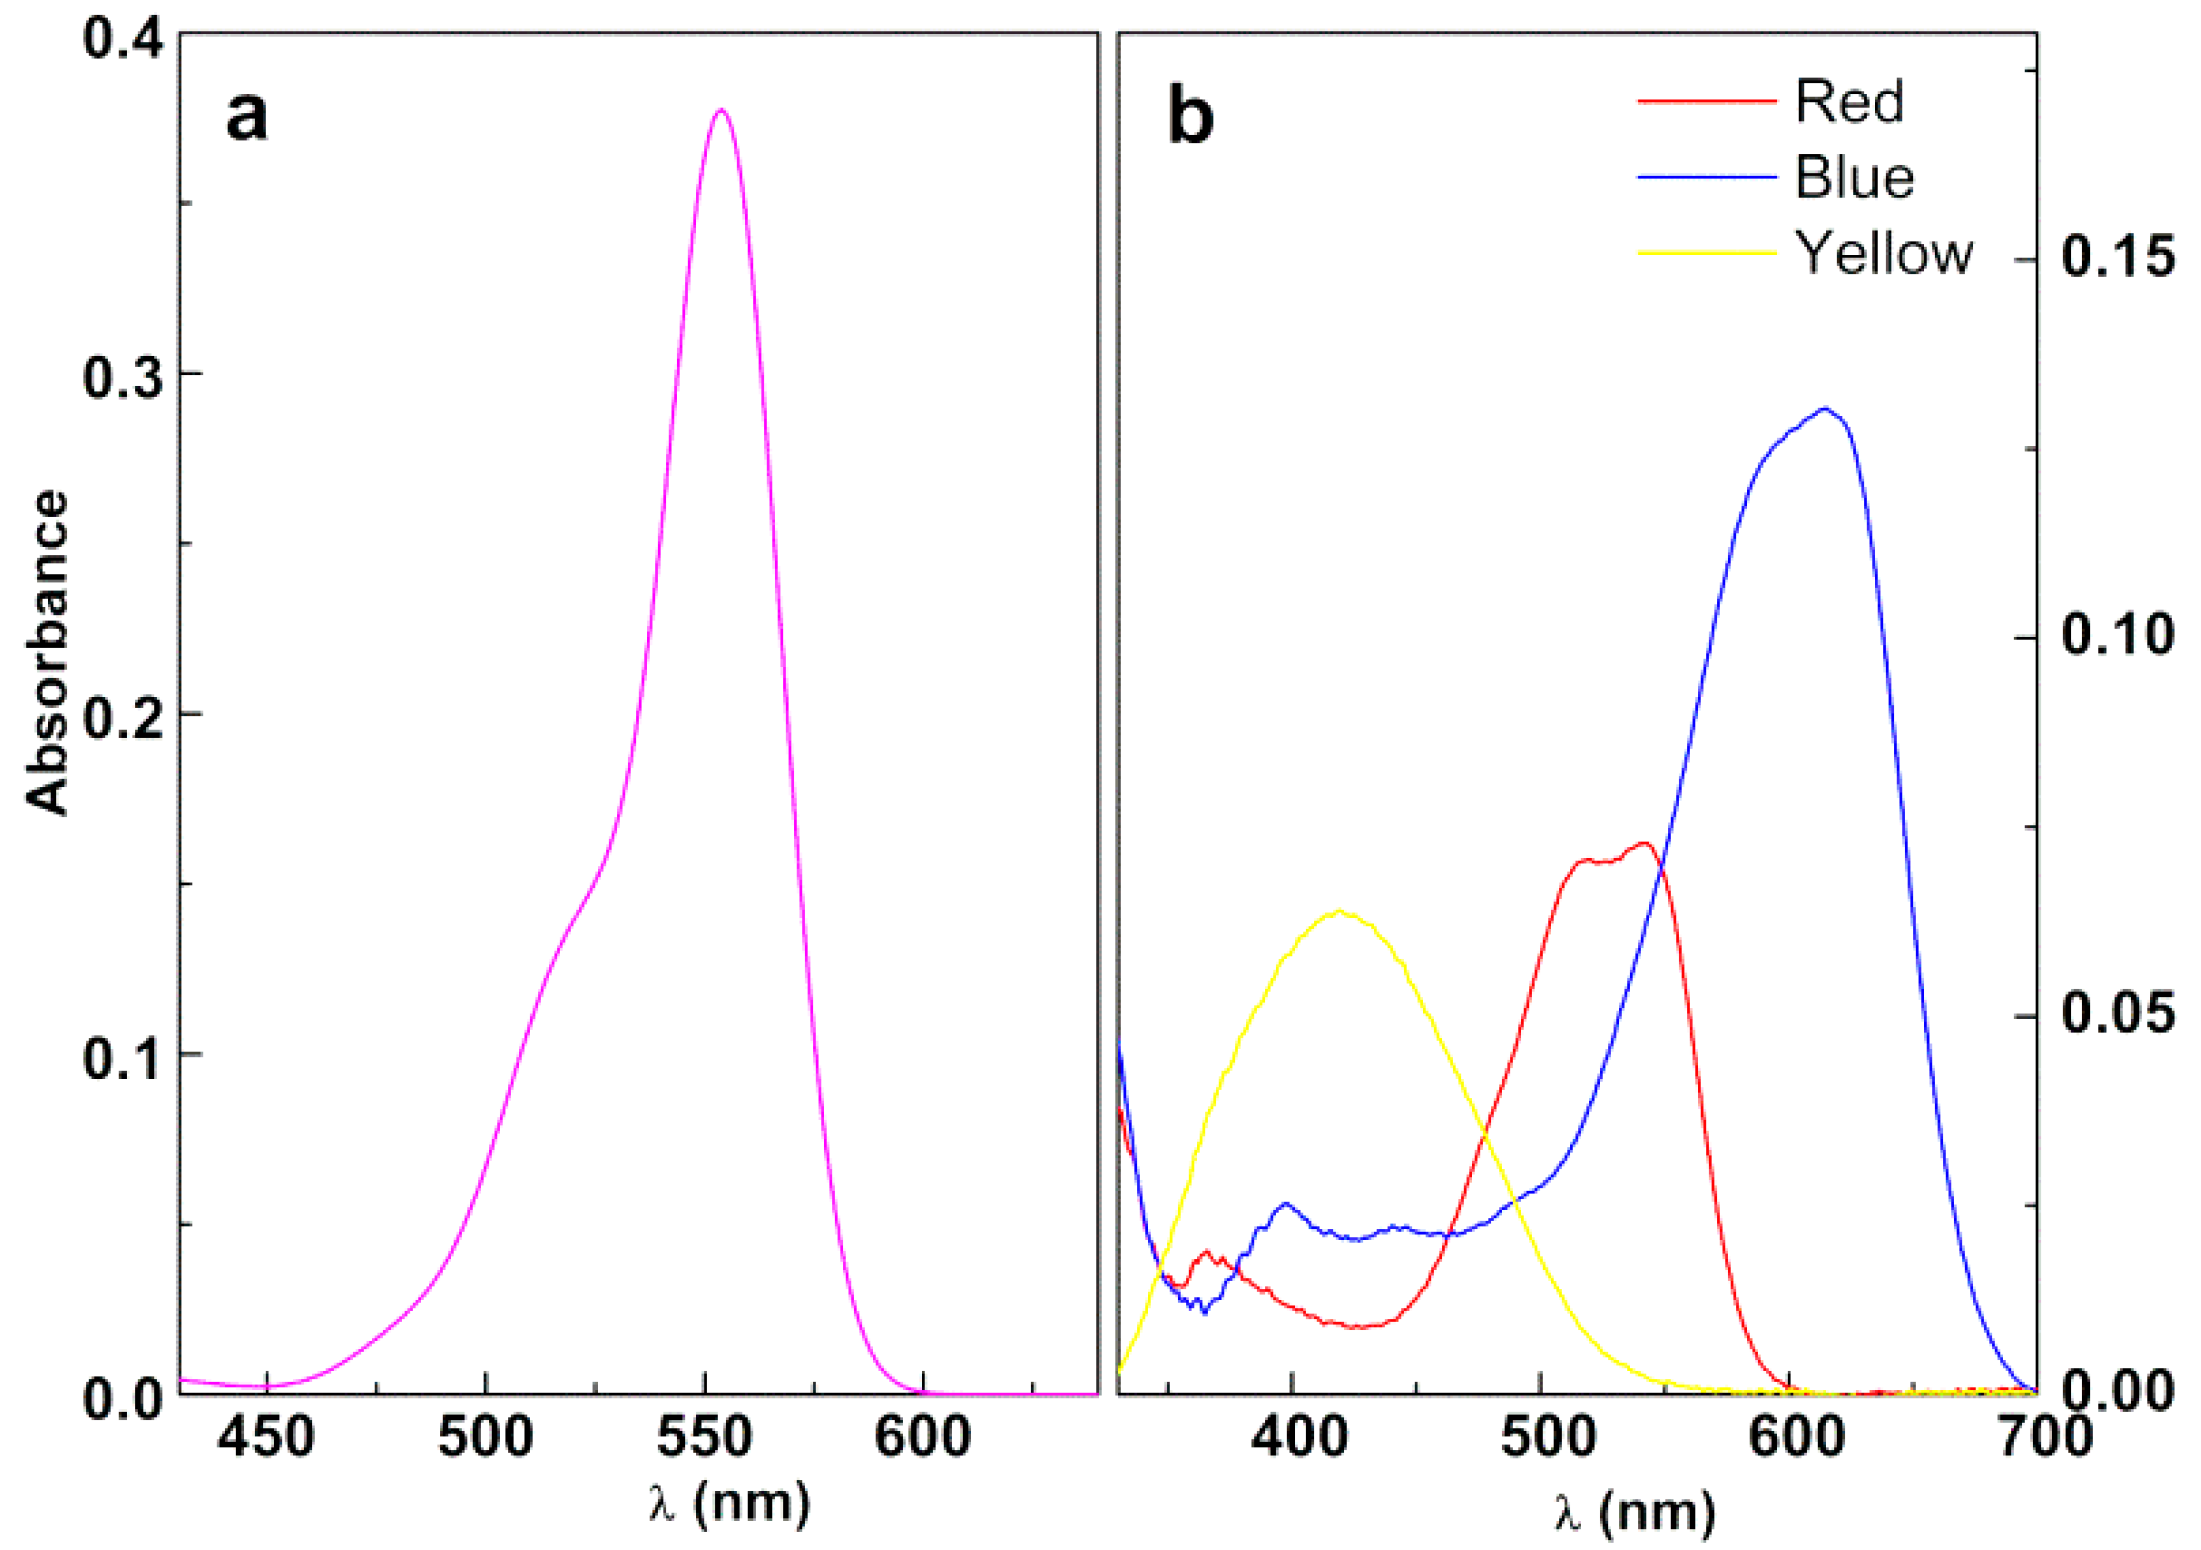
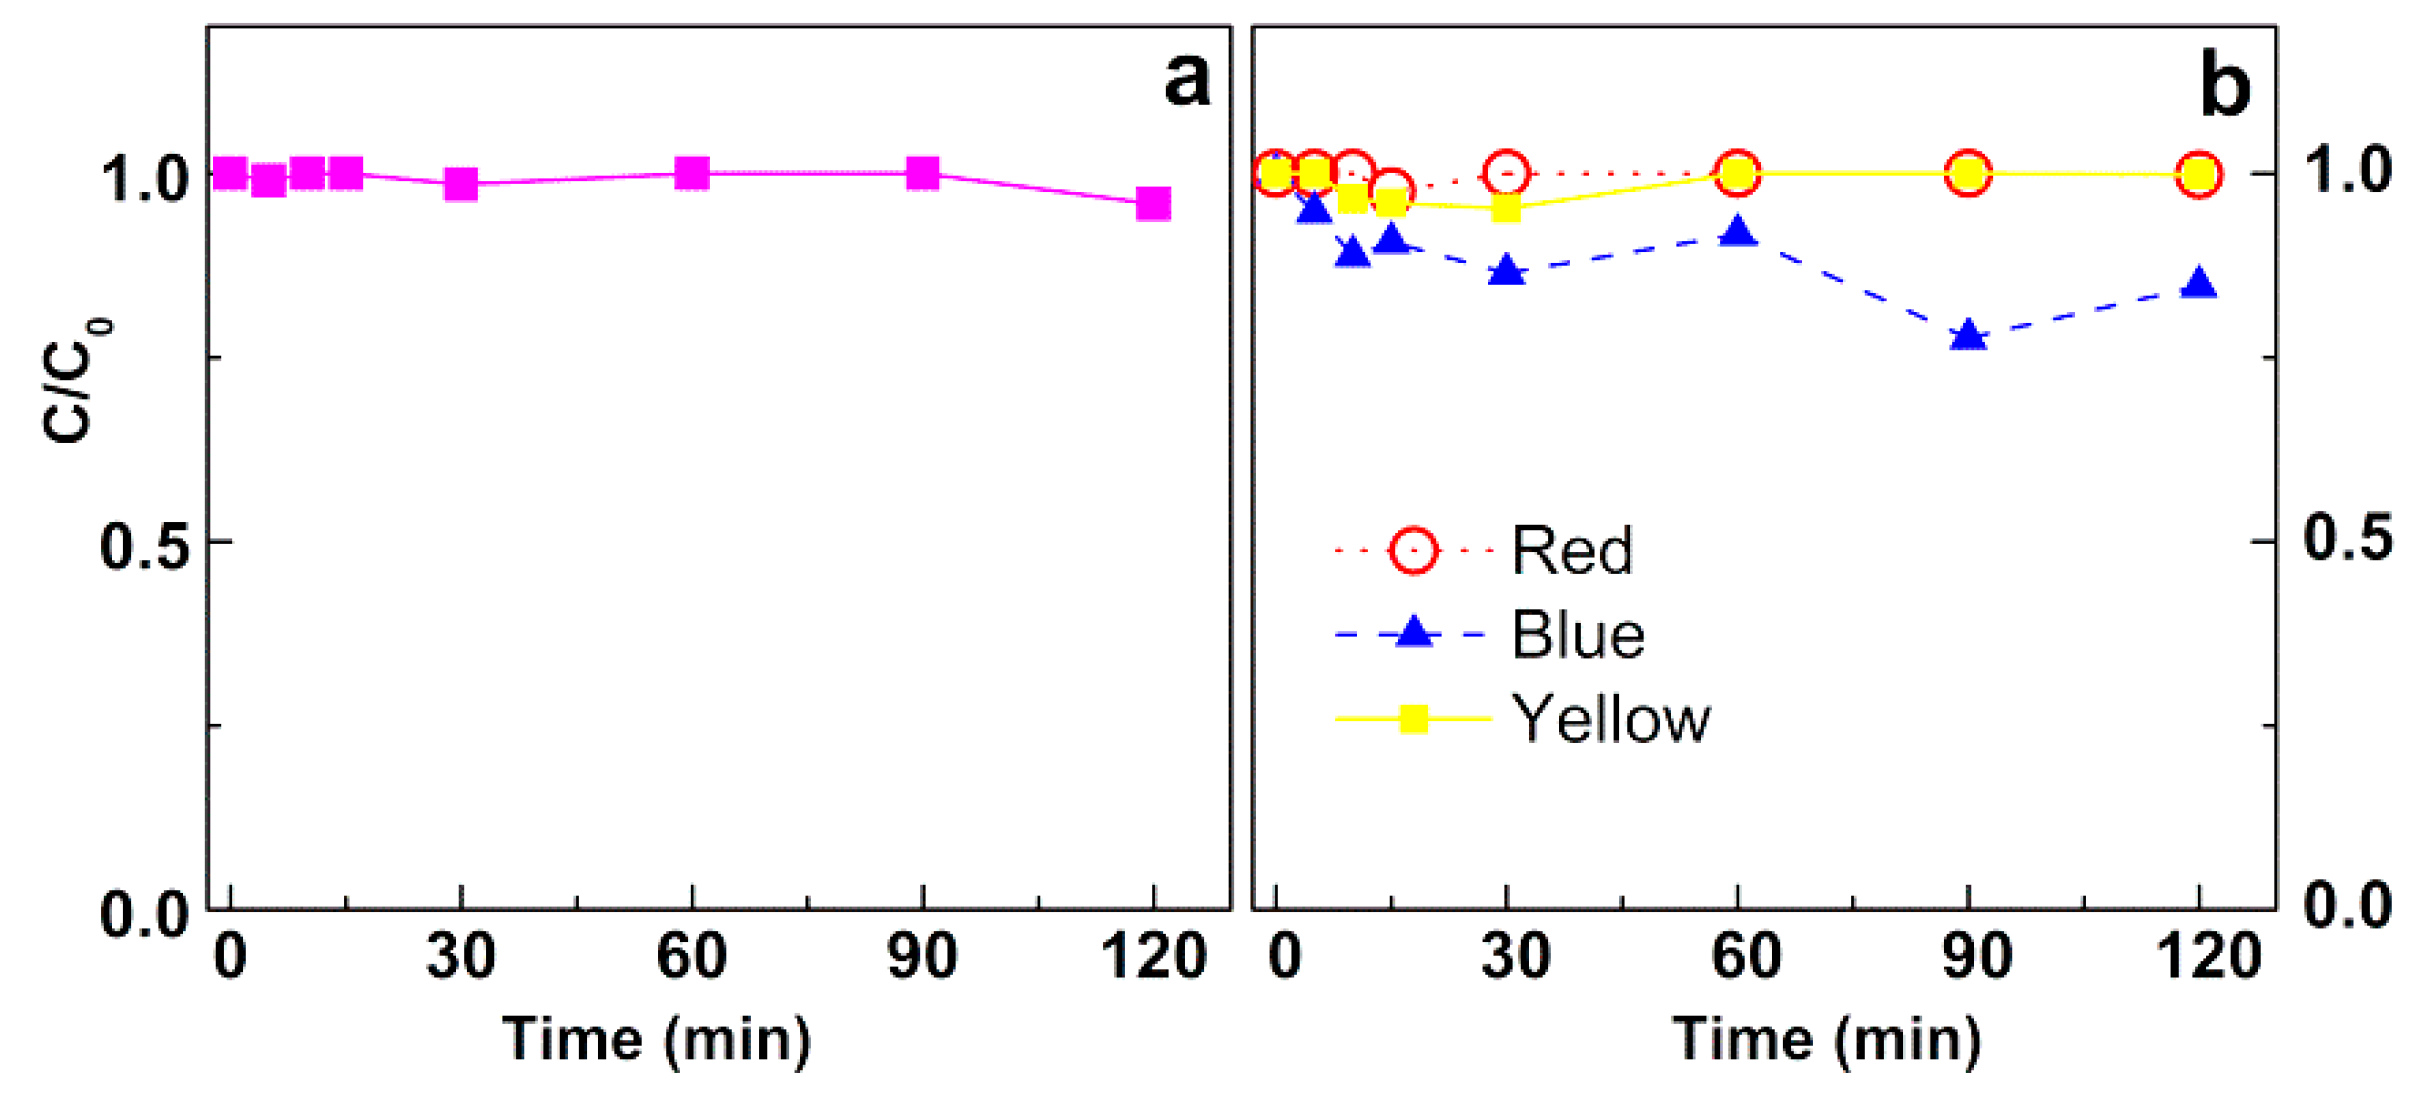
3.3.1. Assays in Neat Dye Solutions
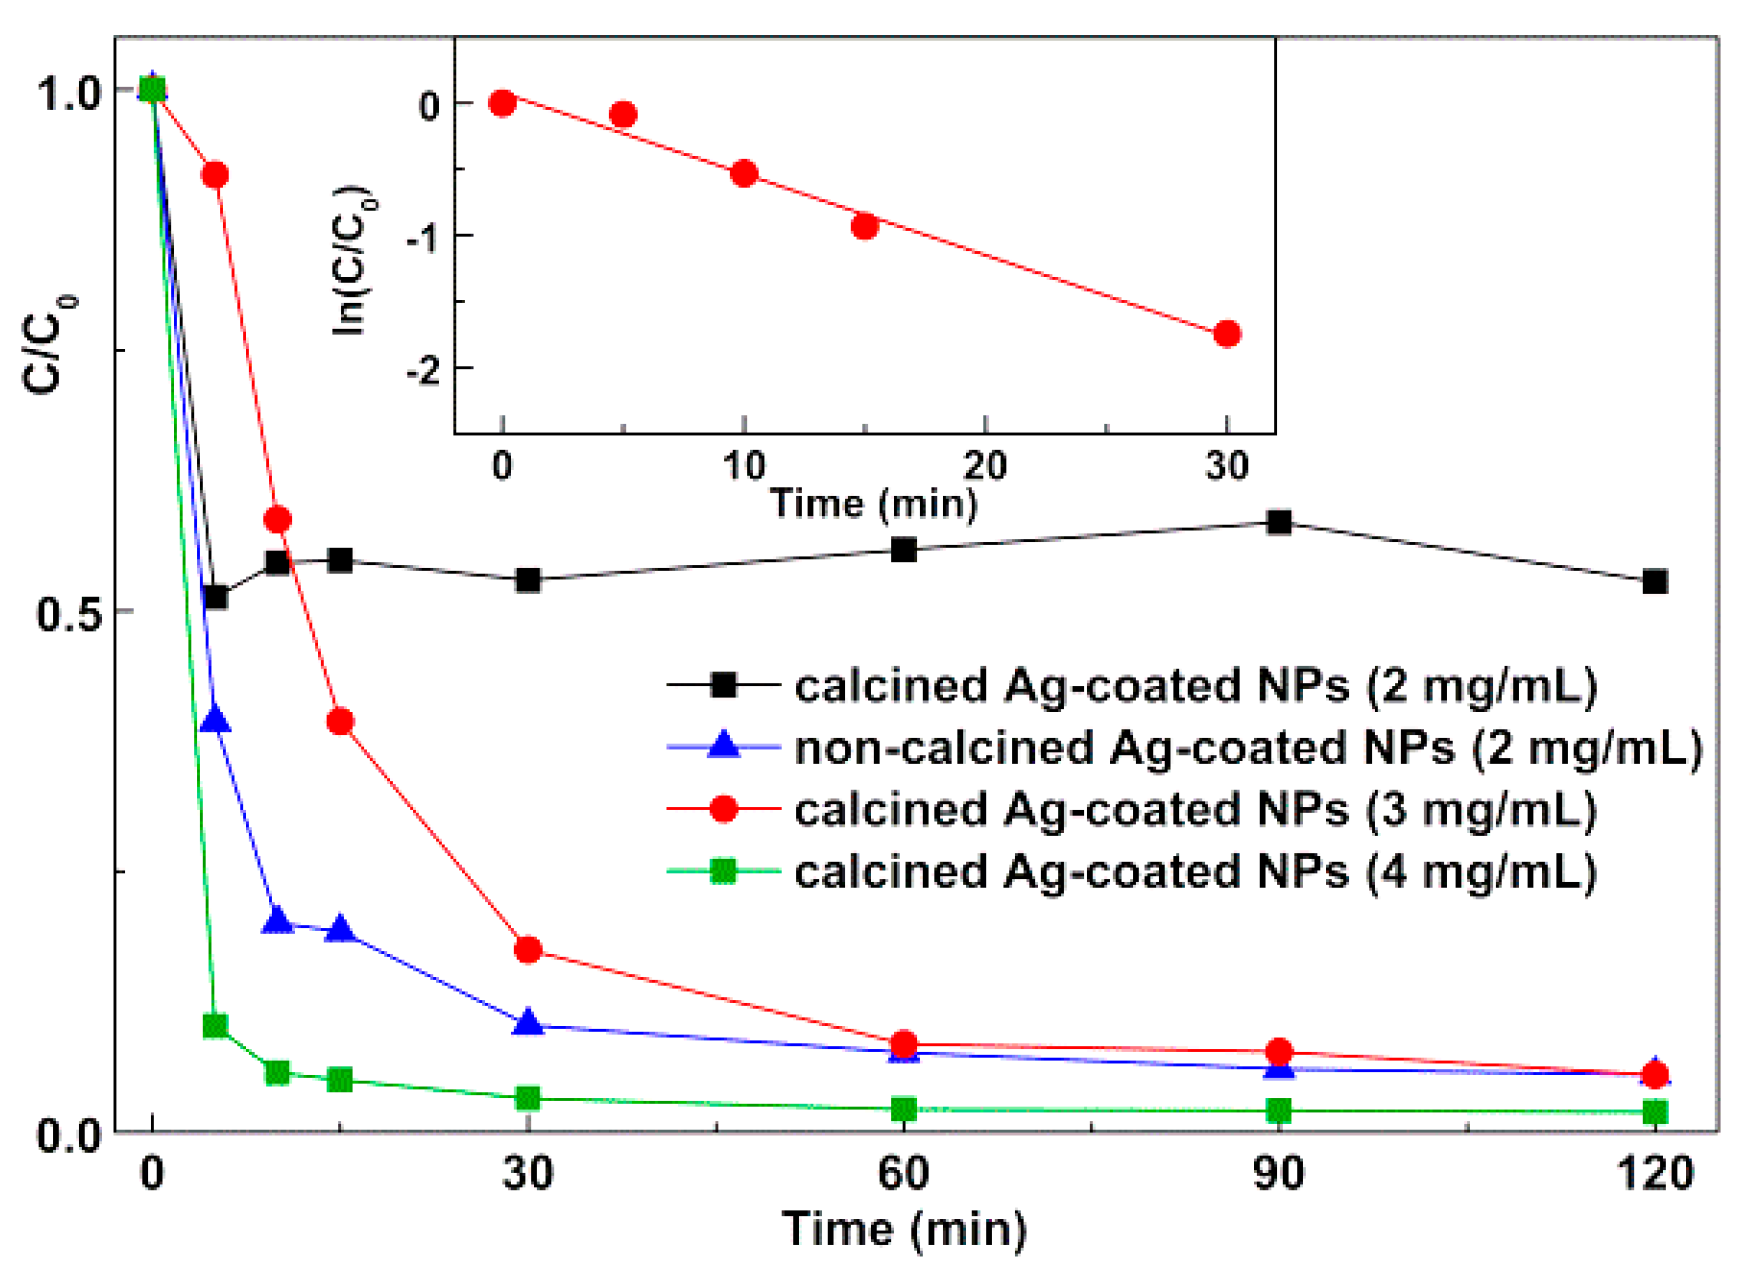
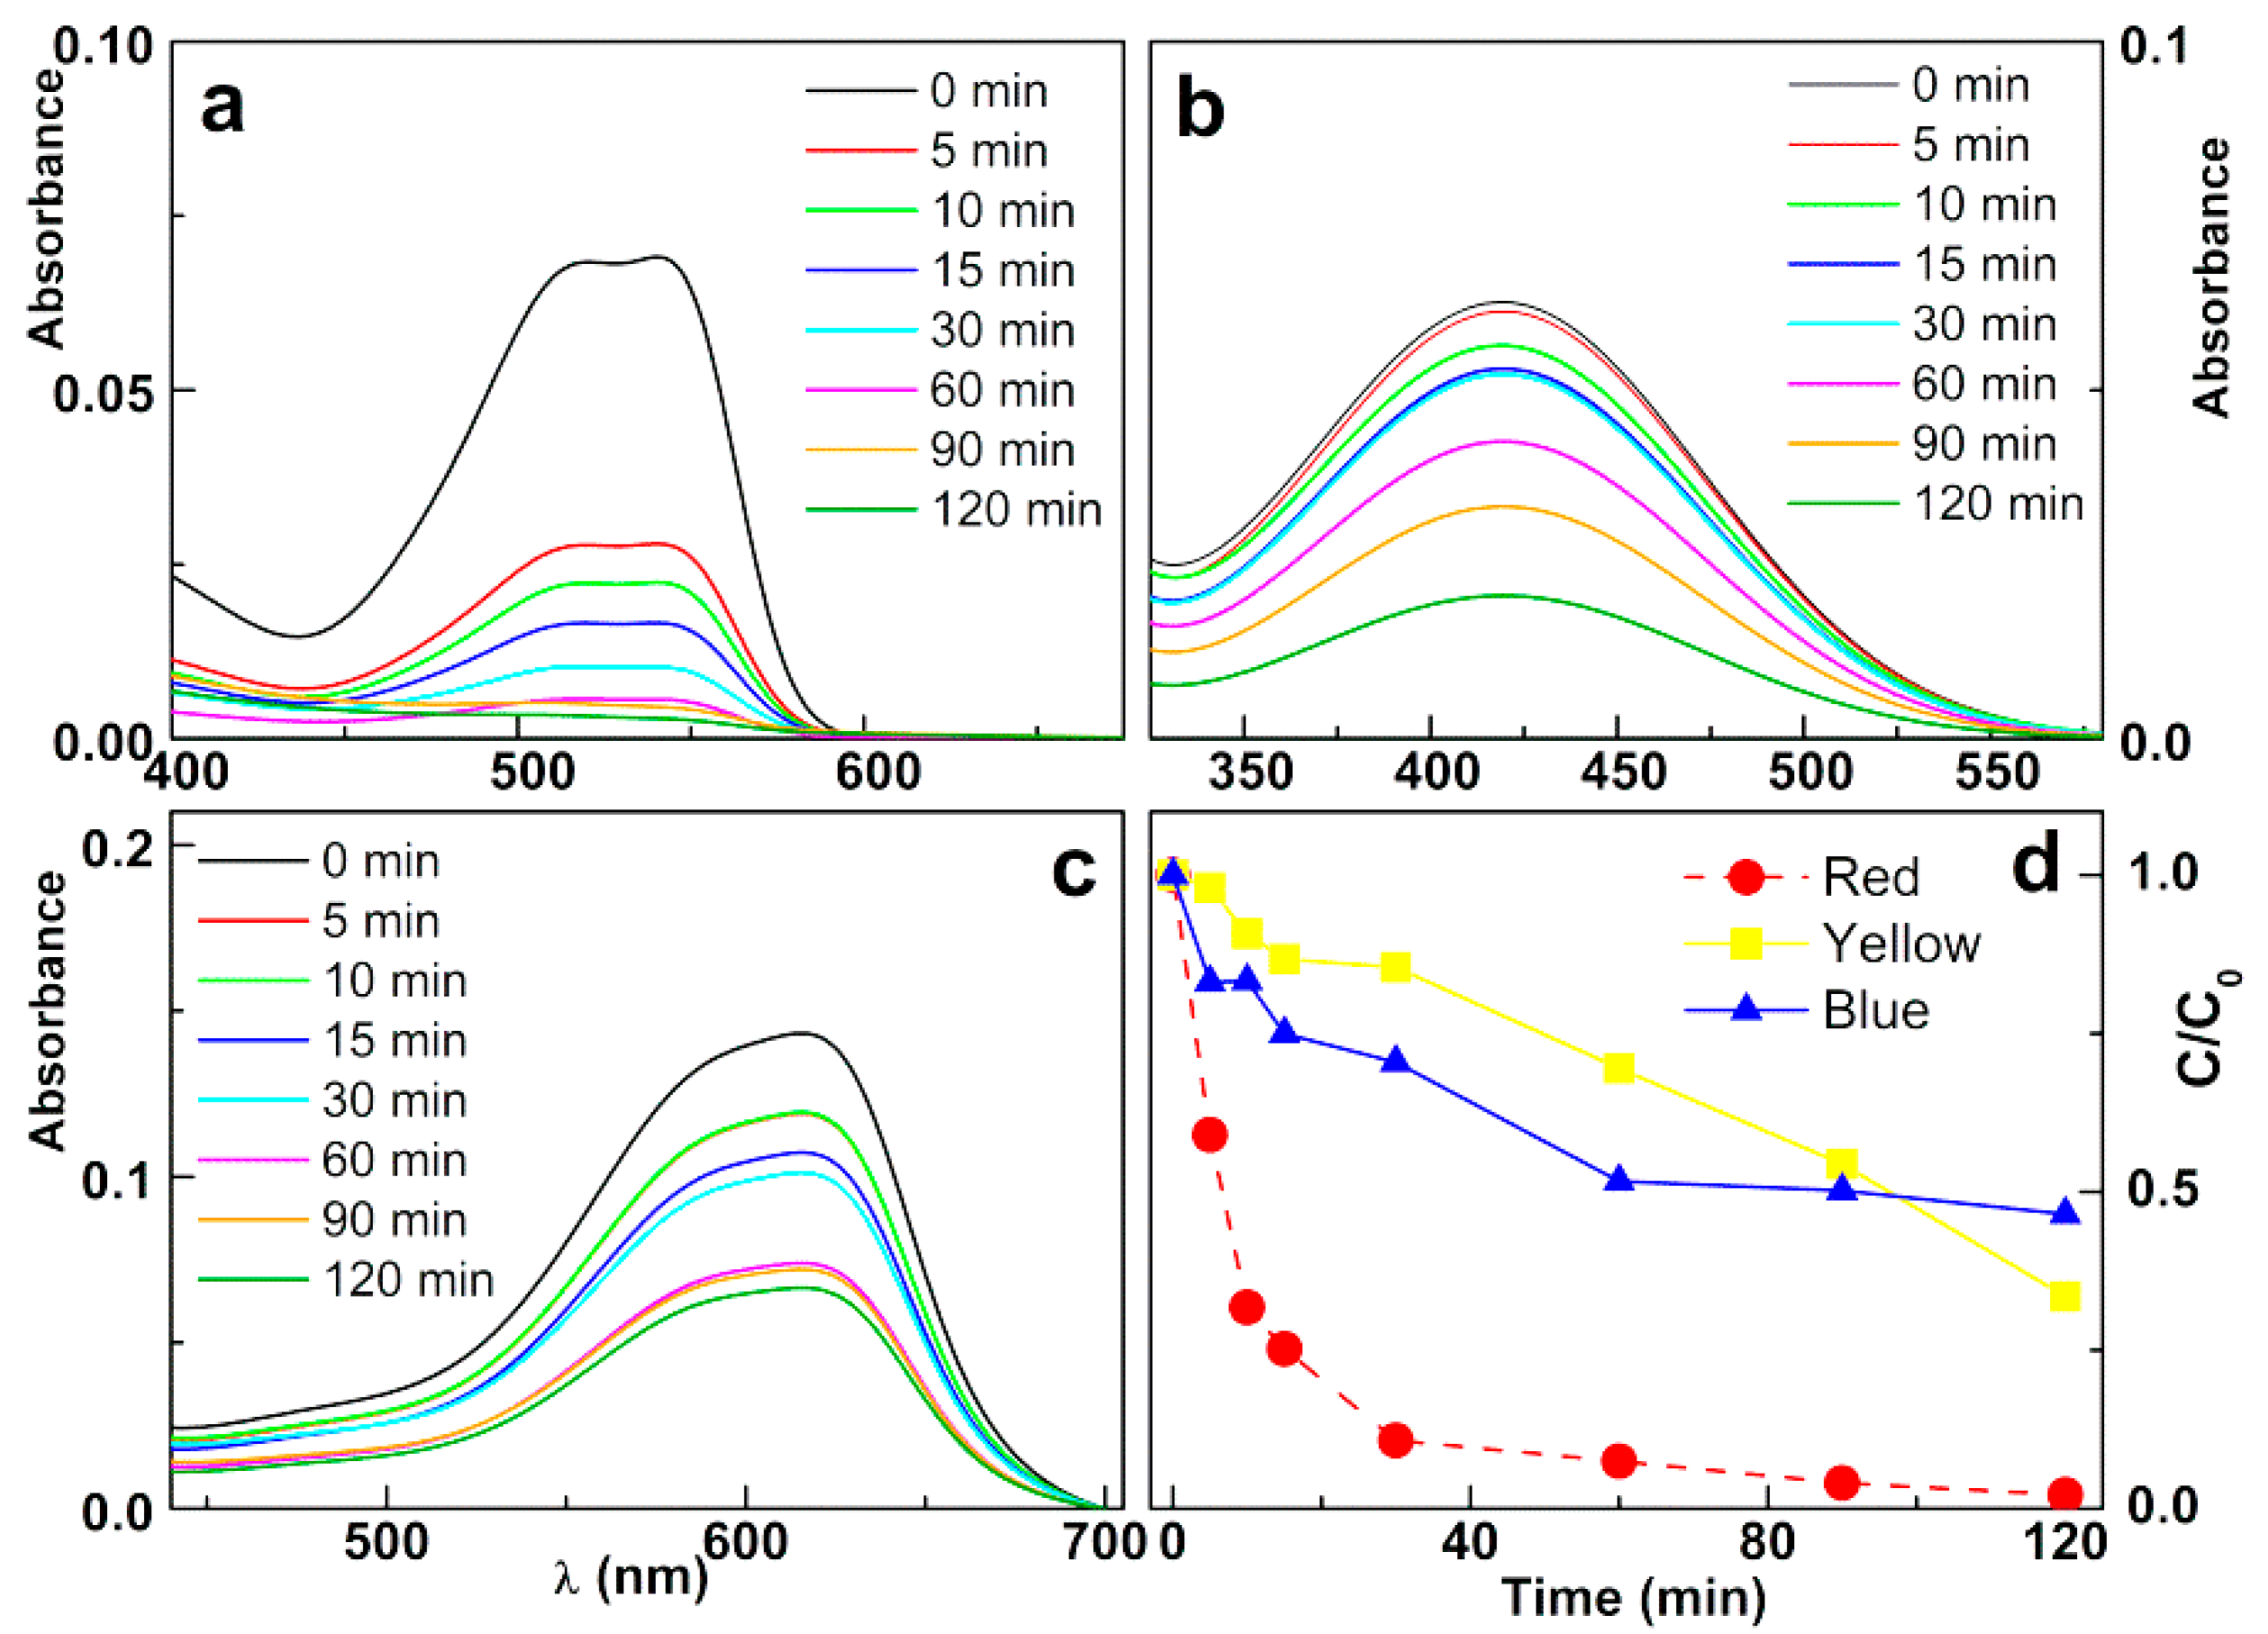
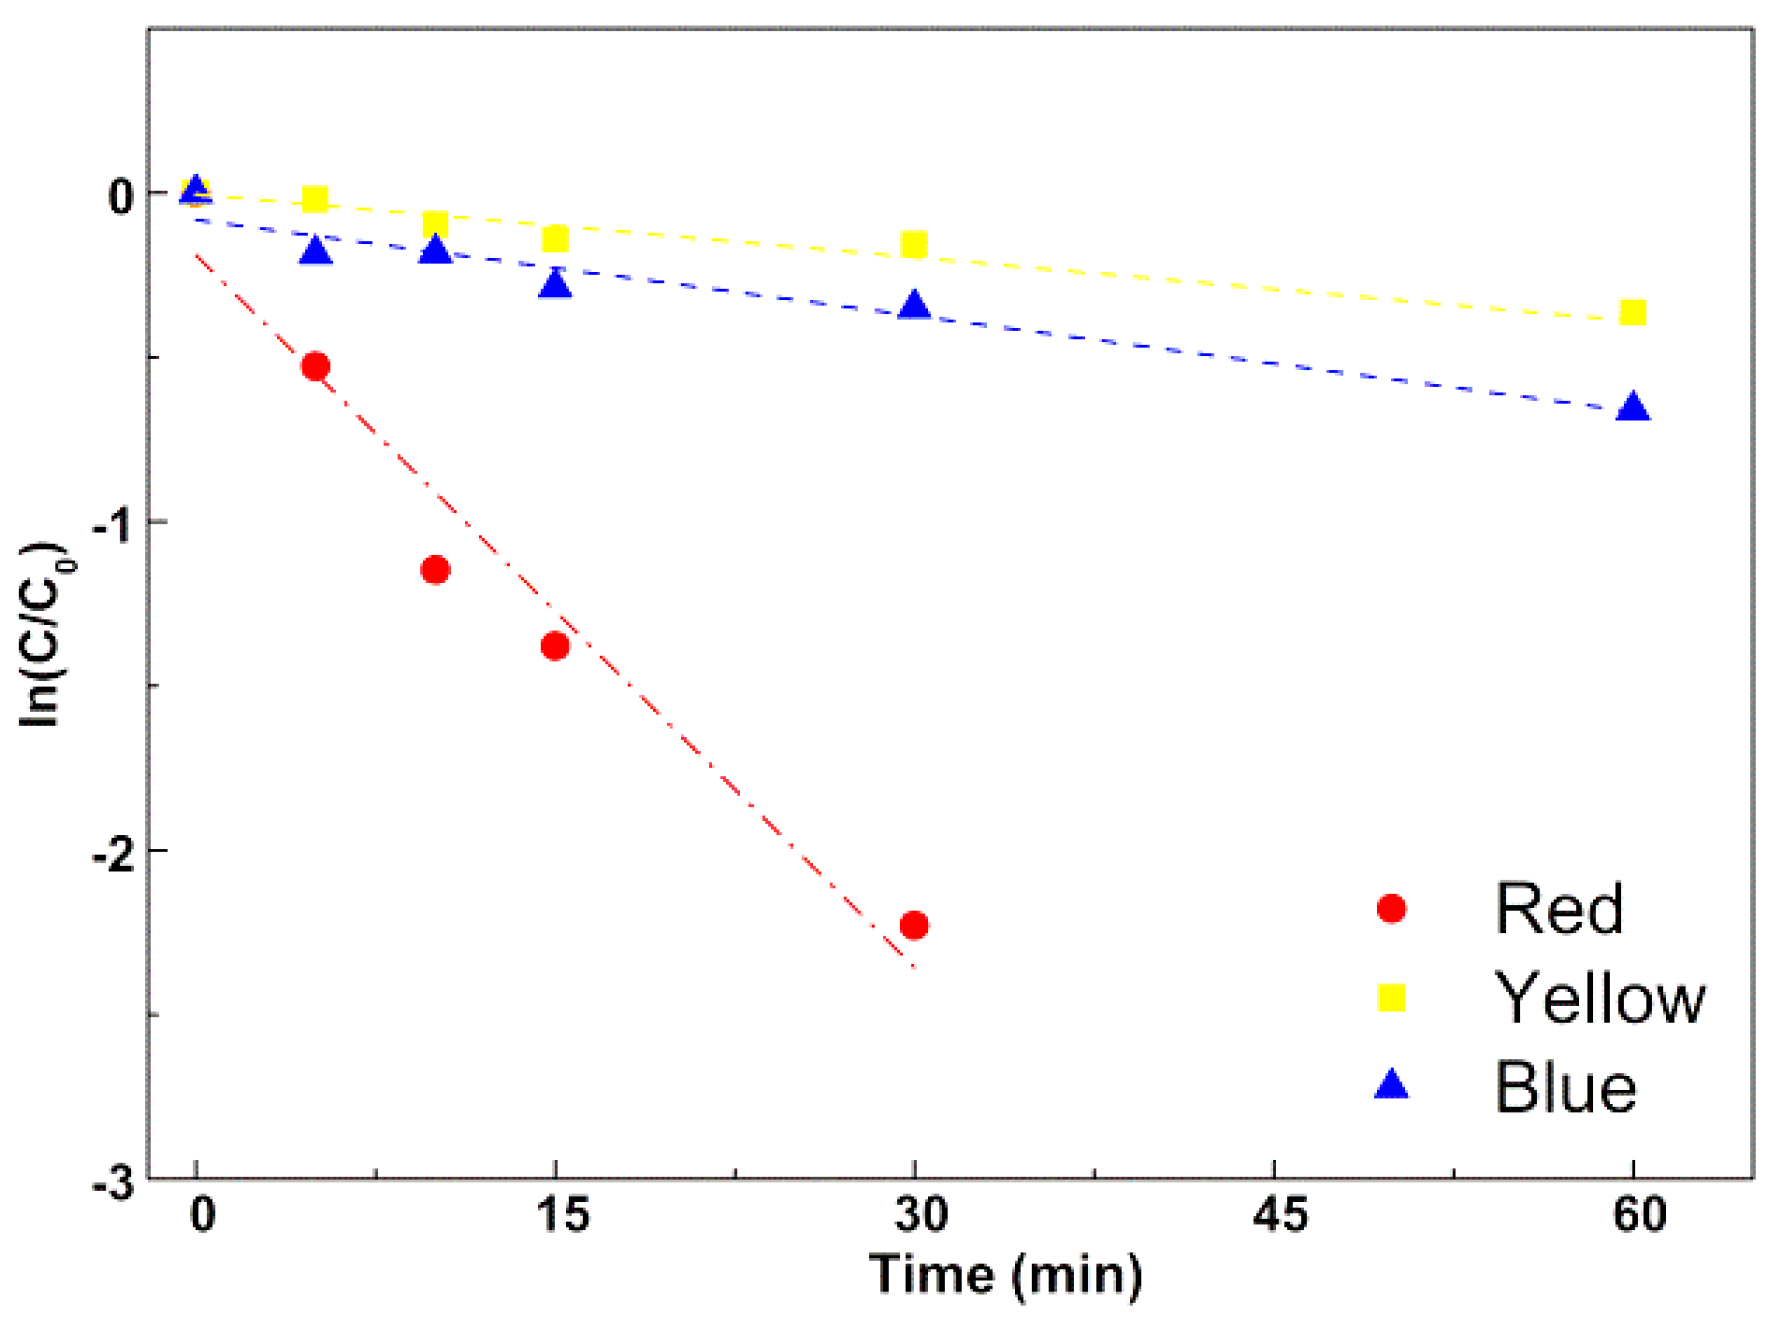
3.3.2. Photodegradation of the Model Dye Using Nanoparticles
4. Conclusions
Author Contributions
Funding
Conflicts of Interest
References
- Konstantinou, I.K.; Albanis, T.A. TiO2-assisted photocatalytic degradation of azo dyes in aqueous solution: Kinetic and mechanistic investigations: A review. Appl. Catal. B Environ. 2004, 49, 1–14. [Google Scholar] [CrossRef]
- Khatri, A.; Peerzada, M.H.; Mohsin, M.; White, M. A review on developments in dyeing cotton fabrics with reactive dyes for reducing effluent pollution. J. Clean. Prod. 2015, 87, 50–57. [Google Scholar] [CrossRef]
- Mills, A.; Le Hunte, S. An overview of semiconductor photocatalysis. J. Photochem. Photobiol. A Chem. 1997, 108, 1–35. [Google Scholar] [CrossRef]
- Cao, X.; Gu, L.; Lan, X.; Zhao, C.; Yao, D.; Sheng, W. Spinel ZnFe2O4 nanoplates embedded with Ag clusters: Preparation, characterization, and photocatalytic application. Mater. Chem. Phys. 2007, 106, 175–180. [Google Scholar] [CrossRef]
- Sulaiman, N.H.; Ghazali, M.J.; Majlis, B.Y.; Yunas, J.; Razali, M. Superparamagnetic calcium ferrite nanoparticles synthesized using a simple sol-gel method for targeted drug delivery. Biomed. Mater. Eng. 2015, 26, S103–S110. [Google Scholar] [CrossRef] [PubMed] [Green Version]
- Sulaiman, N.H.; Ghazali, M.J.; Yunas, J.; Rajabi, A.; Majlis, B.Y.; Razali, M. Synthesis and characterization of CaFe2O4 nanoparticles via co-precipitation and auto-combustion methods. Ceram. Int. 2018, 44, 46–50. [Google Scholar] [CrossRef]
- Pradeep, T.; Anshup. Noble metal nanoparticles for water purification: A critical review. Thin Solid Films 2009, 517, 6441–6478. [Google Scholar] [CrossRef]
- He, C.; Yu, Y.; Hu, X.; Larbot, A. Influence of silver doping on the photocatalytic activity of titania films. Appl. Surf. Sci. 2002, 200, 239–247. [Google Scholar] [CrossRef]
- Faouzi, M.; Cañizares, P.; Gadri, A.; Lobato, J.; Nasr, B.; Paz, R.; Rodrigo, M.A.; Saez, C. Advanced oxidation processes for the treatment of wastes polluted with azoic dyes. Electrochim. Acta 2006, 52, 325–331. [Google Scholar] [CrossRef]
- Hamadanian, M.; Reisi-Vanani, A.; Majedi, A. Synthesis, characterization and effect of calcination temperature on phase transformation and photocatalytic activity of Cu, S-codoped TiO2 nanoparticles. Appl. Surf. Sci. 2010, 256, 1837–1844. [Google Scholar] [CrossRef]
- Guo, J.F.; Ma, B.; Yin, A.; Fan, K.; Dai, W.L. Photodegradation of rhodamine B and 4-chlorophenol using plasmonic photocatalyst of Ag-AgI/Fe3O4@SiO2 magnetic nanoparticle under visible light irradiation. Appl. Catal. B Environ. 2011, 101, 580–586. [Google Scholar] [CrossRef]
- Snare, M.J.; Treloar, F.E.; Ghiggino, K.P.; Thistlethwaite, P.J. The photophysics of Rhodamine B. J. Photochem. 1982, 18, 335–346. [Google Scholar] [CrossRef]
- Wilhelm, P.; Stephan, D. Photodegradation of rhodamine B in aqueous solution via SiO2@TiO2 nano-spheres. J. Photochem. Photobiol. A Chem. 2007, 185, 19–25. [Google Scholar] [CrossRef]
- Yan, S.C.; Li, Z.S.; Zou, Z.G. Photodegradation of Rhodamine B and methyl orange over boron-doped g-C3N4 under visible light irradiation. Langmuir 2010, 26, 3894–3901. [Google Scholar] [CrossRef] [PubMed]
- Nagaraja, R.; Kottam, N.; Girija, C.R.; Nagabhushana, B.M. Photocatalytic degradation of Rhodamine B dye under UV/solar light using ZnO nanopowder synthesized by solution combustion route. Powder Technol. 2012, 215–216, 91–97. [Google Scholar] [CrossRef]
- Khanna, L.; Verma, N.K. Synthesis, characterization and in vitro cytotoxicity study of calcium ferrite nanoparticles. Mater. Sci. Semicond. Process. 2013, 16, 1842–1848. [Google Scholar] [CrossRef]
- Liu, Z.; Zhao, Z.-G.; Miyauchi, M. Efficient Visible Light Active CaFe2O4/WO3 based composite photocatalysts: Effect of interfacial modification. J. Phys. Chem. C 2009, 113, 17132–17137. [Google Scholar] [CrossRef]
- Kim, H.G.; Borse, P.H.; Jang, J.S.; Jeong, E.D.; Jung, O.S.; Suh, Y.J.; Lee, J.S. Fabrication of CaFe2O4/MgFe2O4 bulk heterojunction for enhanced visible light photocatalysis. Chem. Commun. 2009, 39, 5889–5891. [Google Scholar] [CrossRef]
- Amendola, V.; Bakr, O.M.; Stellacci, F. A Study of the Surface Plasmon Resonance of Silver Nanoparticles by the Discrete Dipole Approximation Method: Effect of Shape, Size, Structure, and Assembly. Plasmonics 2010, 5, 85–97. [Google Scholar] [CrossRef]
- Pang, Y.X.; Bao, X. Influence of temperature, ripening time and calcination on the morphology and crystallinity of hydroxyapatite nanoparticles. J. Eur. Ceram. Soc. 2003, 23, 1697–1704. [Google Scholar] [CrossRef] [Green Version]
- Hamadanian, M.; Reisi-Vanani, A.; Majedi, A. Preparation and characterization of S-doped TiO2 nanoparticles, effect of calcination temperature and evaluation of photocatalytic activity. Mater. Chem. Phys. 2009, 116, 376–382. [Google Scholar] [CrossRef]
- Rodríguez-Carvajal, J. Recent advances in magnetic structure determination by neutron powder diffraction. Phys. B Condens. Matter 1993, 192, 55–69. [Google Scholar] [CrossRef]
- Shahraki, R.R.; Ebrahimi, M.; Seyyed Ebrahimi, S.A.; Masoudpanah, S.M. Structural characterization and magnetic properties of superparamagnetic zinc ferrite nanoparticles synthesized by the coprecipitation method. J. Magn. Magn. Mater. 2012, 324, 3762–3765. [Google Scholar] [CrossRef]
- Jasso-Terán, R.A.; Cortés-Hernández, D.A.; Sánchez-Fuentes, H.J.; Reyes-Rodríguez, P.A.; de-León-Prado, L.E.; Escobedo-Bocardo, J.C.; Almanza-Robles, J.M. Synthesis, characterization and hemolysis studies of Zn(1−x)CaxFe2O4 ferrites synthesized by sol-gel for hyperthermia treatment applications. J. Magn. Magn. Mater. 2017, 427, 241–244. [Google Scholar] [CrossRef]
- Yao, C.; Zeng, Q.; Goya, G.F.; Torres, T.; Liu, J.; Wu, H.; Ge, M.; Zeng, Y.; Wang, Y.; Jiang, J.Z. ZnFe2O4 Nanocrystals: Synthesis and Magnetic Properties. J. Phys. Chem. C 2007, 111, 12274–12278. [Google Scholar] [CrossRef]
- Solano, E.; Frontera, C.; Puig, T.; Obradors, X.; Ricart, S.; Ros, J. Neutron and X-ray diffraction study of ferrite nanocrystals obtained by microwave-assisted growth. A structural comparison with the thermal synthetic route. J. Appl. Crystallogr. 2014, 47, 414–420. [Google Scholar] [CrossRef]
- Pereira, D.S.M.; Cardoso, B.D.; Rodrigues, A.R.O.; Amorim, C.O.; Amaral, V.S.; Almeida, B.G.; Queiroz, M.-J.R.P.; Martinho, O.; Baltazar, F.; Calhelha, R.C.; et al. Magnetoliposomes containing calcium ferrite nanoparticles for applications in breast cancer therapy. Pharmaceutics 2019, 11, 477. [Google Scholar] [CrossRef]
- Hirazawa, H.; Kusamoto, S.; Aono, H.; Naohara, T.; Mori, K.; Hattori, Y.; Maehara, T.; Watanabe, Y. Preparation of fine Mg1−xCaxFe2O4 powder using reverse coprecipitation method for thermal coagulation therapy in an AC magnetic field. J. Alloys Compd. 2008, 461, 467–473. [Google Scholar] [CrossRef]
- Agnihotri, S.; Mukherji, S.; Mukherji, S. Size-controlled silver nanoparticles synthesized over the range 5–100 nm using the same protocol and their antibacterial efficacy. RSC Adv. 2014, 4, 3974–3983. [Google Scholar] [CrossRef]
- Sultan, M.; Singh, R. Structural and optical properties of RF-sputtered ZnFe2O4 thin films. J. Phys. D Appl. Phys. 2009, 42, 115306. [Google Scholar] [CrossRef]
- Mathew, D.S.; Juang, R.-S. An overview of the structure and magnetism of spinel ferrite nanoparticles and their synthesis in microemulsions. Chem. Eng. J. 2007, 129, 51–65. [Google Scholar] [CrossRef]
- Smit, J. Magnetic Properties of Materials; McGraw Hill: New York, NY, USA, 1971; p. 89, ISBN-13: 978-0070584457. [Google Scholar]
- Manikandan, A.; Vijaya, J.J.; Sundararajan, M.; Meganathan, C.; Kennedy, L.J.; Bououdina, M. Optical and magnetic properties of Mg-doped ZnFe2O4 nanoparticles prepared by rapid microwave combustion method. Superlattice Microstruct. 2013, 64, 118–131. [Google Scholar] [CrossRef]
- Chidambaram, S.; Pari, B.; Kasi, N.; Muthusamy, S. ZnO/Ag heterostructures embedded in Fe3O4 nanoparticles for magnetically recoverable photocatalysis. J. Alloys Comp. 2016, 665, 404–410. [Google Scholar] [CrossRef]
- Wang, J.; Yang, J.; Li, X.; Wei, B.; Wang, D.; Song, H.; Zhai, H.; Li, X. Synthesis of Fe3O4@SiO2@ZnO–Ag core-shell microspheres for the repeated photocatalytic degradation of rhodamine B under UV irradiation. J. Mol. Catal. A Chem. 2015, 406, 97–105. [Google Scholar] [CrossRef]
- Lee, H.J.; Kim, J.H.; Park, S.S.; Hong, S.S.; Lee, G.D. Degradation kinetics for photocatalytic reaction of methyl orange over Al-doped ZnO nanoparticles. J. Ind. Eng. Chem. 2015, 25, 199–206. [Google Scholar] [CrossRef]
- Kumar, P.; Kumar, A.S.K. Visible-light-induced degradation of rhodamine B by nanosized Ag2S–ZnS loaded on cellulose. Photochem. Photobiol. Sci. 2019, 18, 148–154. [Google Scholar] [CrossRef]
- Guillard, C.; Lachheb, H.; Houas, A.; Ksibi, M.; Elaloui, E.; Herrmann, J.-M. Influence of chemical structure of dyes, of pH and of inorganic salts on their photocatalytic degradation by TiO2: Comparison of the efficiency of powder and supported TiO2. J. Photochem. Photobiol. A Chem. 2003, 158, 27–36. [Google Scholar] [CrossRef]
- Chen, X.; Wu, Z.; Liu, D.; Gao, Z. Preparation of ZnO photocatalyst for the efficient and rapid photocatalytic degradation of azo dyes. Nanoscale Res. Lett. 2017, 12, 143. [Google Scholar] [CrossRef]
- Cisneros, R.L.; Espinoza, A.G.; Litter, M.I. Photodegradation of an azo dye of the textile industry. Chemosphere 2002, 48, 393–399. [Google Scholar] [CrossRef]
- Dilek Gümüş, D.; Akbal, F. Photocatalytic degradation of textile dye and wastewater. Water Air Soil Pollut. 2011, 216, 117–124. [Google Scholar] [CrossRef]
- Sahel, K.; Perol, N.; Chermette, H.; Bordes, C.; Derriche, Z.; Guillard, C. Photocatalytic decolorization of Remazol Black 5 (RB5) and Procion Red MX-5B—Isotherm of adsorption, kinetic of decolorization and mineralization. Appl. Catal. B Environ. 2007, 77, 100–109. [Google Scholar] [CrossRef]


| Commercial Name | Molecular Formula | Molecular Weight (g/moL) | Molecular Structure |
|---|---|---|---|
| C.I. Reactive Blue 250 (Reactive Blue RGB) | C27H23N5Na4O20S6 | 1021.84 |  |
| C.I. Reactive Yellow 145 (Reactive Yellow 3RS) | C28H20ClN9Na4O16S5 | 1026.25 | 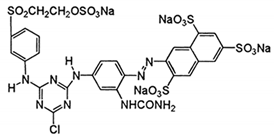 |
| C.I. Reactive Red 195 (Reactive Red 3BS) | C31H19ClN7Na5O19S6 | 1136.32 |  |
| Rhodamine B | C28H31ClN2O3 | 479.02 | 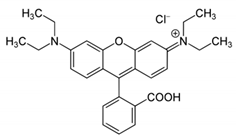 |
| Sample | Ox,y,z (*) | i (*) | Phase Size (nm) Lattice Constant (nm) Zn/Ca Ferrite|Ag | Rf Zn/Ca Ferrite|Ag | X2 |
|---|---|---|---|---|---|
| Zn/Ca ferrite non-calcined | 0.2405 | 1 (+) | 1.12 | ---- 0.8425 (+) | ---- | 3.18 | ---- | 1.11 |
| Zn/Ca ferrite calcined | 0.2464 | 1 (+) | 3.97 | ---- 0.8425 | ---- | 4.35 | ---- | 1.26 |
| Zn/Ca ferrite non-calcined with silver | 0.2405 (+) | 1 (+) | 1.12 (+) | 3.41 0.8425 (+) | 0.4069 | 3.42 | 0.95 | 1.32 |
| Zn/Ca ferrite calcined with silver | 0.2464 (+) | 1 (+) | 3.97 (+) | 9.90 0.8425 (+) | 0.4078 | 9.81 | 2.91 | 1.13 |
| Nanoparticles | Zn0.5Ca0.5Fe2O4 (%) | Ag (%) |
|---|---|---|
| Zn0.5Ca0.5Fe2O4 non-calcined | 100 | - |
| Zn0.5Ca0.5Fe2O4 calcined | 100 | - |
| Ag@Zn0.5Ca0.5Fe2O4 non-calcined | 57.8 | 42.2 |
| Ag@Zn0.5Ca0.5Fe2O4 calcined | 66.4 | 33.6 |
| - | Hc (Oe) | Ms (emu/g) | Mr (emu/g) | Mr/Ms |
|---|---|---|---|---|
| Zn0.5Ca0.5Fe2O4 non-calcined | 1.8 | 2.41 | 8 × 10⁻⁵ | 3 × 10⁻⁵ |
| Zn0.5Ca0.5Fe2O4 calcined | 7.5 | 20.45 | 0.022 | 1 × 10⁻³ |
| Silver coated Zn0.5Ca0.5Fe2O4 calcined | 5.3 | 18.14 | 0.016 | 9 × 10⁻⁴ |
© 2019 by the authors. Licensee MDPI, Basel, Switzerland. This article is an open access article distributed under the terms and conditions of the Creative Commons Attribution (CC BY) license (http://creativecommons.org/licenses/by/4.0/).
Share and Cite
Fernandes, R.J.C.; Magalhães, C.A.B.; Amorim, C.O.; Amaral, V.S.; Almeida, B.G.; Castanheira, E.M.S.; Coutinho, P.J.G. Magnetic Nanoparticles of Zinc/Calcium Ferrite Decorated with Silver for Photodegradation of Dyes. Materials 2019, 12, 3582. https://doi.org/10.3390/ma12213582
Fernandes RJC, Magalhães CAB, Amorim CO, Amaral VS, Almeida BG, Castanheira EMS, Coutinho PJG. Magnetic Nanoparticles of Zinc/Calcium Ferrite Decorated with Silver for Photodegradation of Dyes. Materials. 2019; 12(21):3582. https://doi.org/10.3390/ma12213582
Chicago/Turabian StyleFernandes, Ricardo J. C., Carlos A. B. Magalhães, Carlos O. Amorim, Vítor S. Amaral, Bernardo G. Almeida, Elisabete M. S. Castanheira, and Paulo J. G. Coutinho. 2019. "Magnetic Nanoparticles of Zinc/Calcium Ferrite Decorated with Silver for Photodegradation of Dyes" Materials 12, no. 21: 3582. https://doi.org/10.3390/ma12213582