4.2. Water Absorption in Capillary Pores and Air Voids
Once a dry mortar sample was placed in water at a 5 mm depth, the sample began to absorb water through its capillary pores (pores with a diameter of less than nm) due to capillary pressure. Fagerlund [
17] explains the mechanism of capillary water absorption in mortar. In the absorption process, relatively small capillary pores are filled with water quickly, whereas air is trapped in relatively large capillary pores or air voids. The air is compressed by the surface tension of the water surrounding the air. The smaller the radius of the air bubble in the pore as determined based on the pore radius, the greater the compression and the smaller the air volume. For example, if the pore radius is 1000 nm, the trapped air volume will be 32% of the original volume, 68% of the original volume will be occupied by water, and the pressure in the air bubble will increase to 3.1 times the initial pressure. Compressed air can dissolve into pore water through the increased solubility of the air dissolved into the surrounding water, and this happens when the pressure of the air increases. Therefore, assuming that the dissolved air in the water does not escape out of the sample, capillary water absorption can be predicted based on pore size distribution.
The MIP test method has limitations when it comes to obtaining precise information on pore structure [
25]. For example, sample drying is associated with pore structure damage under mercury pressure. Another limitation is the presence of a pore with a large diameter in a sample, wherein the pore is interpreted as the diameter of the small inlet if the inlet to enter is small. Therefore, modification is necessary when pore size distribution as determined using the MIP test is to be used to understand the water absorption phenomenon in mortar samples. To this end, it is assumed that there are small pores which can connect to all the other pores which have a certain diameter. Such a diameter is referred to as the threshold diameter [
25]. The threshold diameter is the diameter at which the rate of mercury intrusion according to the diameter is the highest. Hence, the increment at the threshold diameter is regarded as the volume of mercury that can enter the large pores through the small pores with the threshold diameter. The air bubbles in the large pores do not undergo much compression, so water occupies almost no space in the pore, and thus the increment is neglected. In the MIP results, the threshold diameter of Ref. was found to be 674 nm and that of SAP_0.1, SAP_0.2, and SAP_0.3 827–829 nm.
Suppose there is an uncompressed air bubble in a pore. Let
R be the radius of the air bubble. The radius when the air bubble is compressed by the surface tension of the water is called
RA. The length is expressed in millimeters, the pressure in the uncompressed air bubble is set to 0.1 MPa, the surface tension between the water and the air is set to 7.4 × 10
−5 N/mm, and the contact angle of the water in the combination of air, water, and mortar is set to zero. The cubic equation for
RA can then be obtained as
The derivation of Equation (1) can be referred to in [
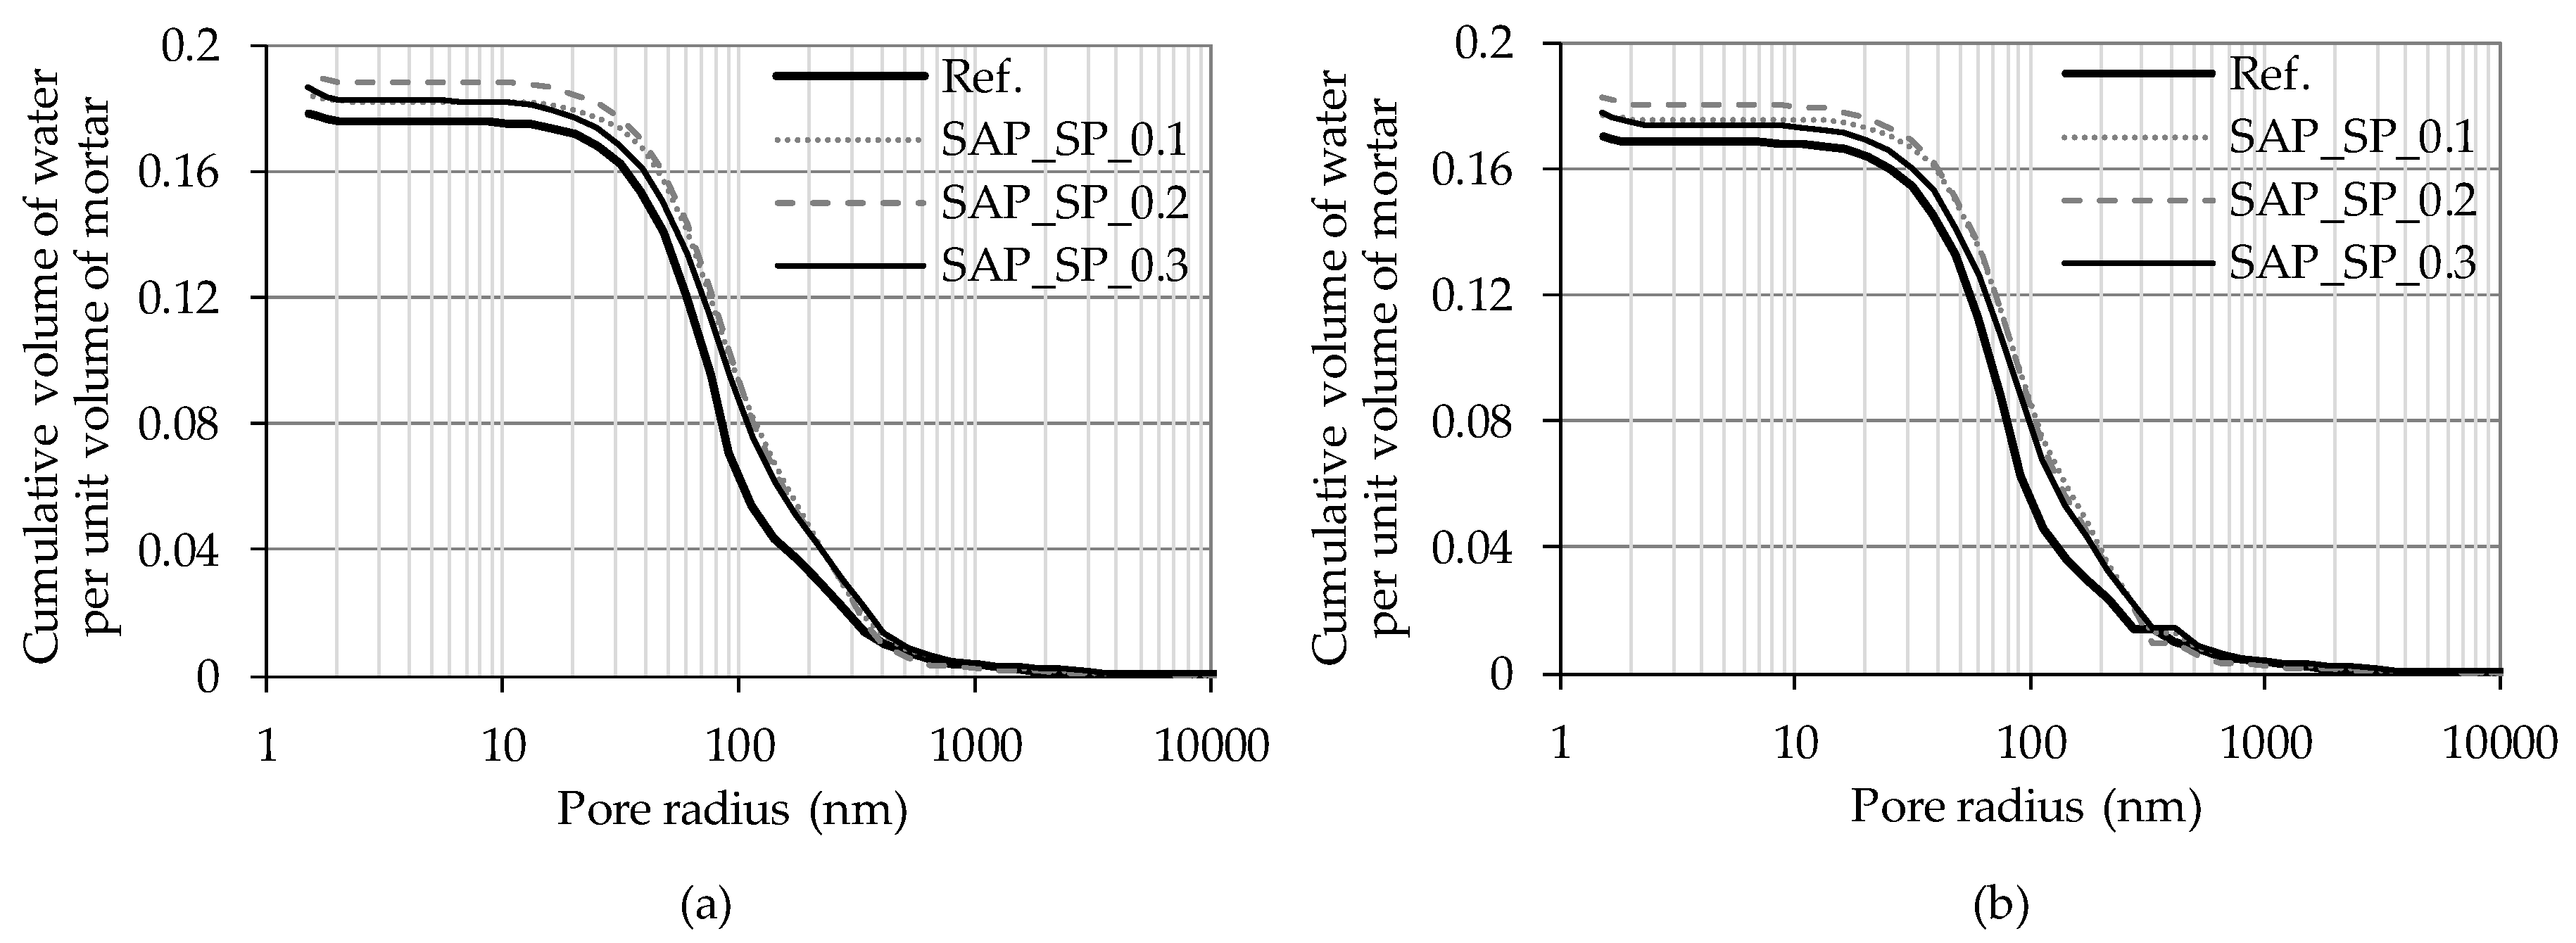
17]. Since the radius of the uncompressed air bubble is determined by the radius of the pore containing the bubble, the volume of water absorbed by a unit volume of the pore along the pore radius can be estimated. The cumulative volume of water absorbed by a unit volume of mortar according to the pore radius is shown in
Figure 9. The results based on the raw MIP data are shown in
Figure 9a and the results based on the MIP data after modification are shown in
Figure 9b. Data presented in
Figure 9b well predicts the absorption amount of capillary water considering the limitation of the MIP experiment. Therefore, data in
Figure 9b was used for the calculation of water volume in mortar in
Table 6.
The influence of the SAP_SPs on water absorption in mortar can be analyzed by comparing the predicted amount of water absorption with the capillary suction test results. In
Table 6, the value of (1) is the volume ratio of capillary pores in mortar, which was calculated from the MIP data. The values of (2) and (3) are the total cumulative volume of water absorbed by a unit volume of mortar in
Figure 9a,b respectively. The value of (4), which is the amount of water absorption per unit volume of the mortar on the seventh day, was obtained by dividing the measured amount of absorbed water by the bulk density of the mortar in
Table 3. For Ref., the value of (4) is larger than the value of (3) by 0.009 because trapped air was dissolved in the water and escaped out of the sample, and the sample further absorbed water. If the amount of water that the sample additionally absorbed as the air escaped the sample is the same for all the samples, the additional water absorption due to the SAP_SPs can be estimated by the formula “value of (4) − value of (3) − 0.009”. The phenomenon in which the dissolved air in water escapes out of the sample is difficult to predict due to the interaction of air with pores of different sizes and the movement of air dissolved in pore water.
Assuming that the SAP_SPs absorbed the increased water uptake, the absorbency of the SAP_SPs can be estimated by dividing “value of (4) − value of (3) − 0.009” by the mass of dry SAP_SPs in a unit volume of mortar in
Table 5. The absorbency was estimated to be 23 g/g–44 g/g. This value is much higher than the SAP_SP absorbency of 3.1 g/g in fresh mortar. Because water is almost incompressible, it can be inferred that the water-absorbing SAP_SP will not stay in the space of the air void formed by the SAP_SP but will expand to the relatively large capillary pores or air voids surrounding it. On the other hand, a simple comparison of measured water uptake and capillary porosity shows that Ref. absorbed a smaller volume of water than the capillary porosity but that the samples containing SAPs absorbed a greater volume of water.
4.3. Internal Damage
When mortar has absorbed water and the temperature drops below the freezing point, the water in the relatively large capillary pores starts to freeze; as the temperature further decreases, the water in smaller capillary pores freezes [
26]. When water transforms to ice, the volume increases by 9%, causing the pressure in the unfrozen water to increase, damaging the mortar [
27]. When air remains in the relatively large capillary pores or when air voids are present, water will move there and the water pressure will decrease.
Table 2 shows that Ref. had the highest value of air content, at 2.2%. However, this value is also lower than that of the reported samples with excellent freeze–thaw resistance (generally more than 4%). Hence, air voids in Ref. do not effectively reduce water pressure during freezing.
In the case of mixtures incorporating SAP_SP, higher amounts of SAP_SP make the cementitious matrix weaker due to the higher w/c(effective). Thus, the degree of internal damage caused by freeze–thaw cycles was found to increase with higher SAP_SP content in our designed samples.
Furthermore, the SAP_SP in the mortar sample seemed to absorb water and expand into relatively large capillary pores or air voids. This phenomenon causes capillary pores to become filled with water, increasing the amount of water that must be transferred to an air void during freezing. Water-filled air voids do not act as water reservoirs. This phenomenon results in an overall increase in hydraulic pressure. However, the swelling of SAP_SP was lowered in the freeze–thaw resistance test in comparison to the capillary absorption test because NaCl solution was used instead of water.
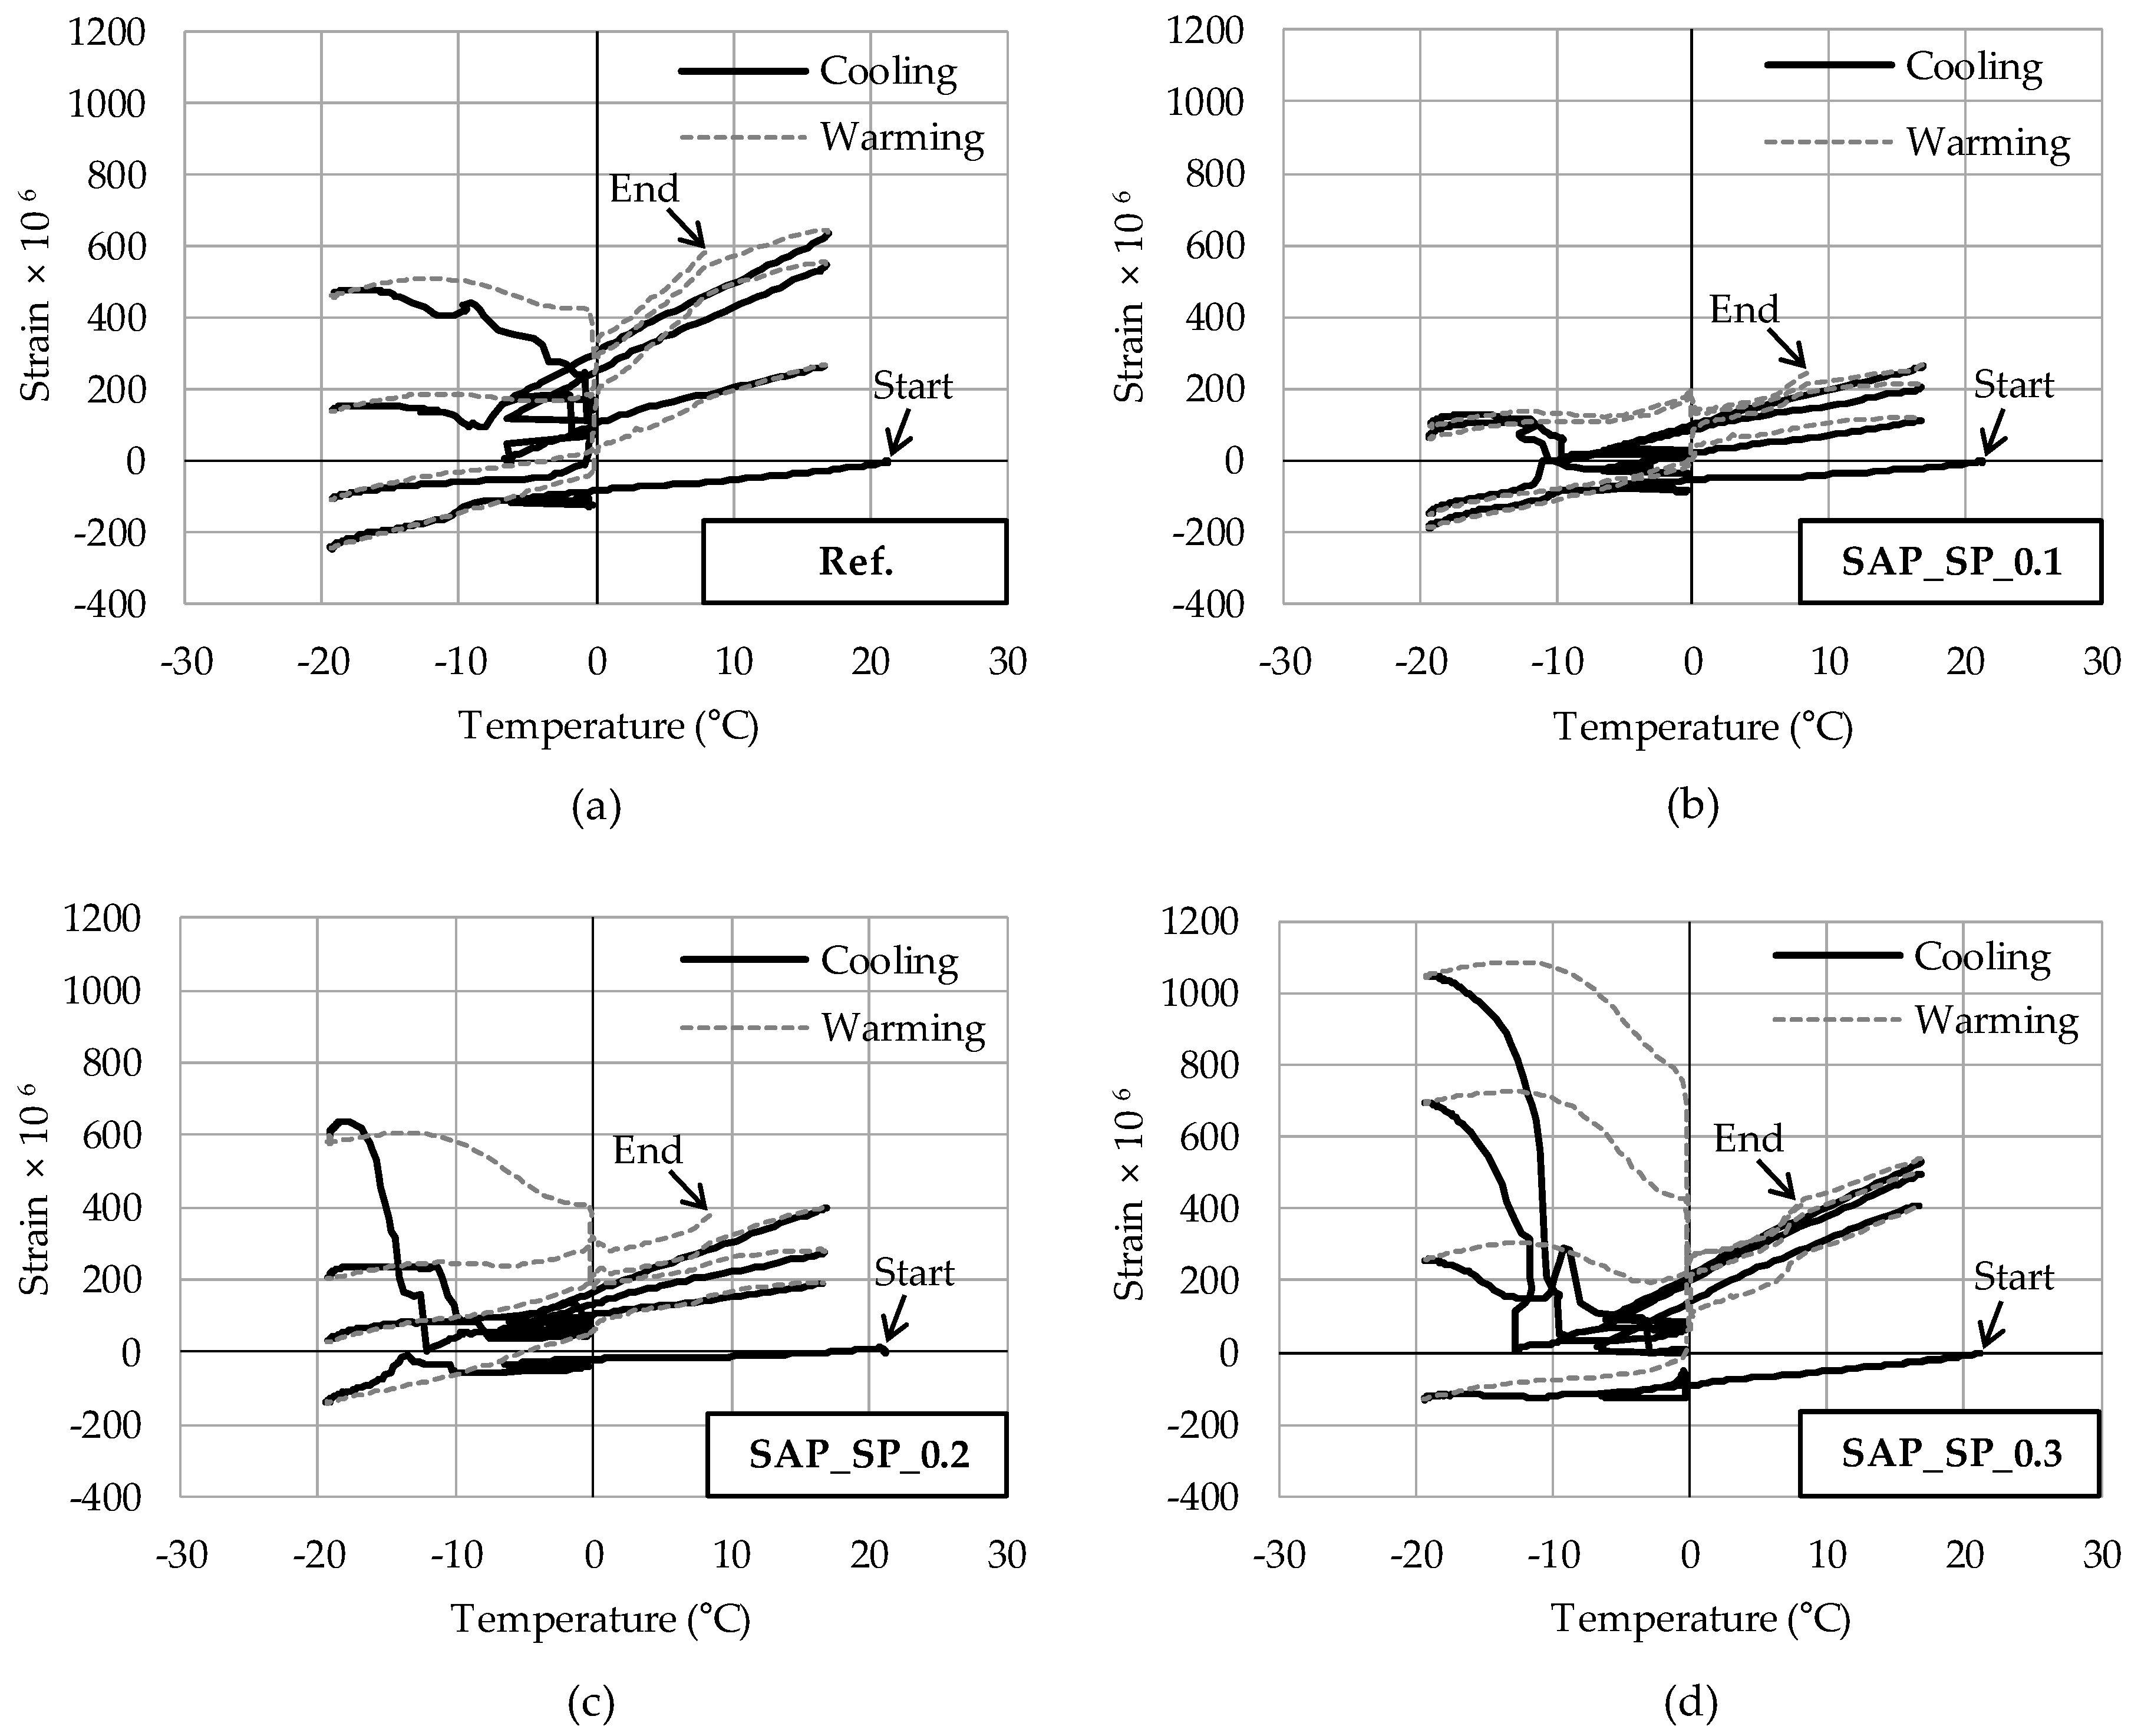
In the strain measurement test during the freeze–thaw cycles, the mortar samples were exposed to more severe conditions than the samples in the CEN/TS 12390-9 freeze–thaw resistance test due to their small size. Air movement in mortar occurs mainly between differently sized pores, but the shorter the distance between the air and the sample surface, the faster the air escapes from the sample [
17]. Hence, the smaller the sample size, the quicker the air escapes and the faster the water is absorbed. In
Figure 6, the peak point of the strain during the freezing phase of all samples can be seen to increase as the cycle is repeated. One reason for this is that the mortar samples continuously absorbed water during the cycle. The peak point of the strain of Ref. during the freezing phase of the fourth cycle is larger than that of SAP_SP_0.1, but the strain does not increase with a steep slope. SAP_SP_0.3, which has the highest value of w/c
(effective), shows the largest strain, followed by SAP_SP_0.2, during the freezing phase. The strain in both samples can be observed to increase with a steep slope during the freezing phase (of the third cycle in SAP_SP_0.3 and of the fourth cycle in SAP_SP_0.2).
Similar trends are seen in the results for the relative dynamic modulus in the freeze–thaw resistance test. The higher the value of w/c(effective), the faster the relative dynamic modulus decreases as the cycle repeats. This finding indicates that the higher the value of w/c(effective), the more internal damage occurs in the sample as the cycle repeats.
4.4. Salt Scaling Damage
When concrete is exposed to both deicing salt and water, freezing and thawing cause damage to the surface of the concrete. The theory of the “glue-spall” model [
28] seems to account for the salt scaling phenomenon observed by researchers. Surface damage is in fact related to the deformation of concrete. The thermal expansion coefficients of ice and concrete greatly differ. The coefficient of ice is ~50 × 10
−6 K
−1, whereas that of concrete is ~10 × 10
−6 K
−1 [
28]. The ice layer, which is mechanically attached to the surface of the concrete, is subjected to tensile stress as the temperature decreases. When the tensile stress exceeds a certain level, the ice cracks and the concrete is damaged. When the temperature drops below the freezing point, NaCl solution freezes and forms unfrozen pockets of brine. These pockets make the ice easier to crack. Medium NaCl (2–5 mass %) solution forms a layer of ice with moderate strength to damage the concrete [
28].
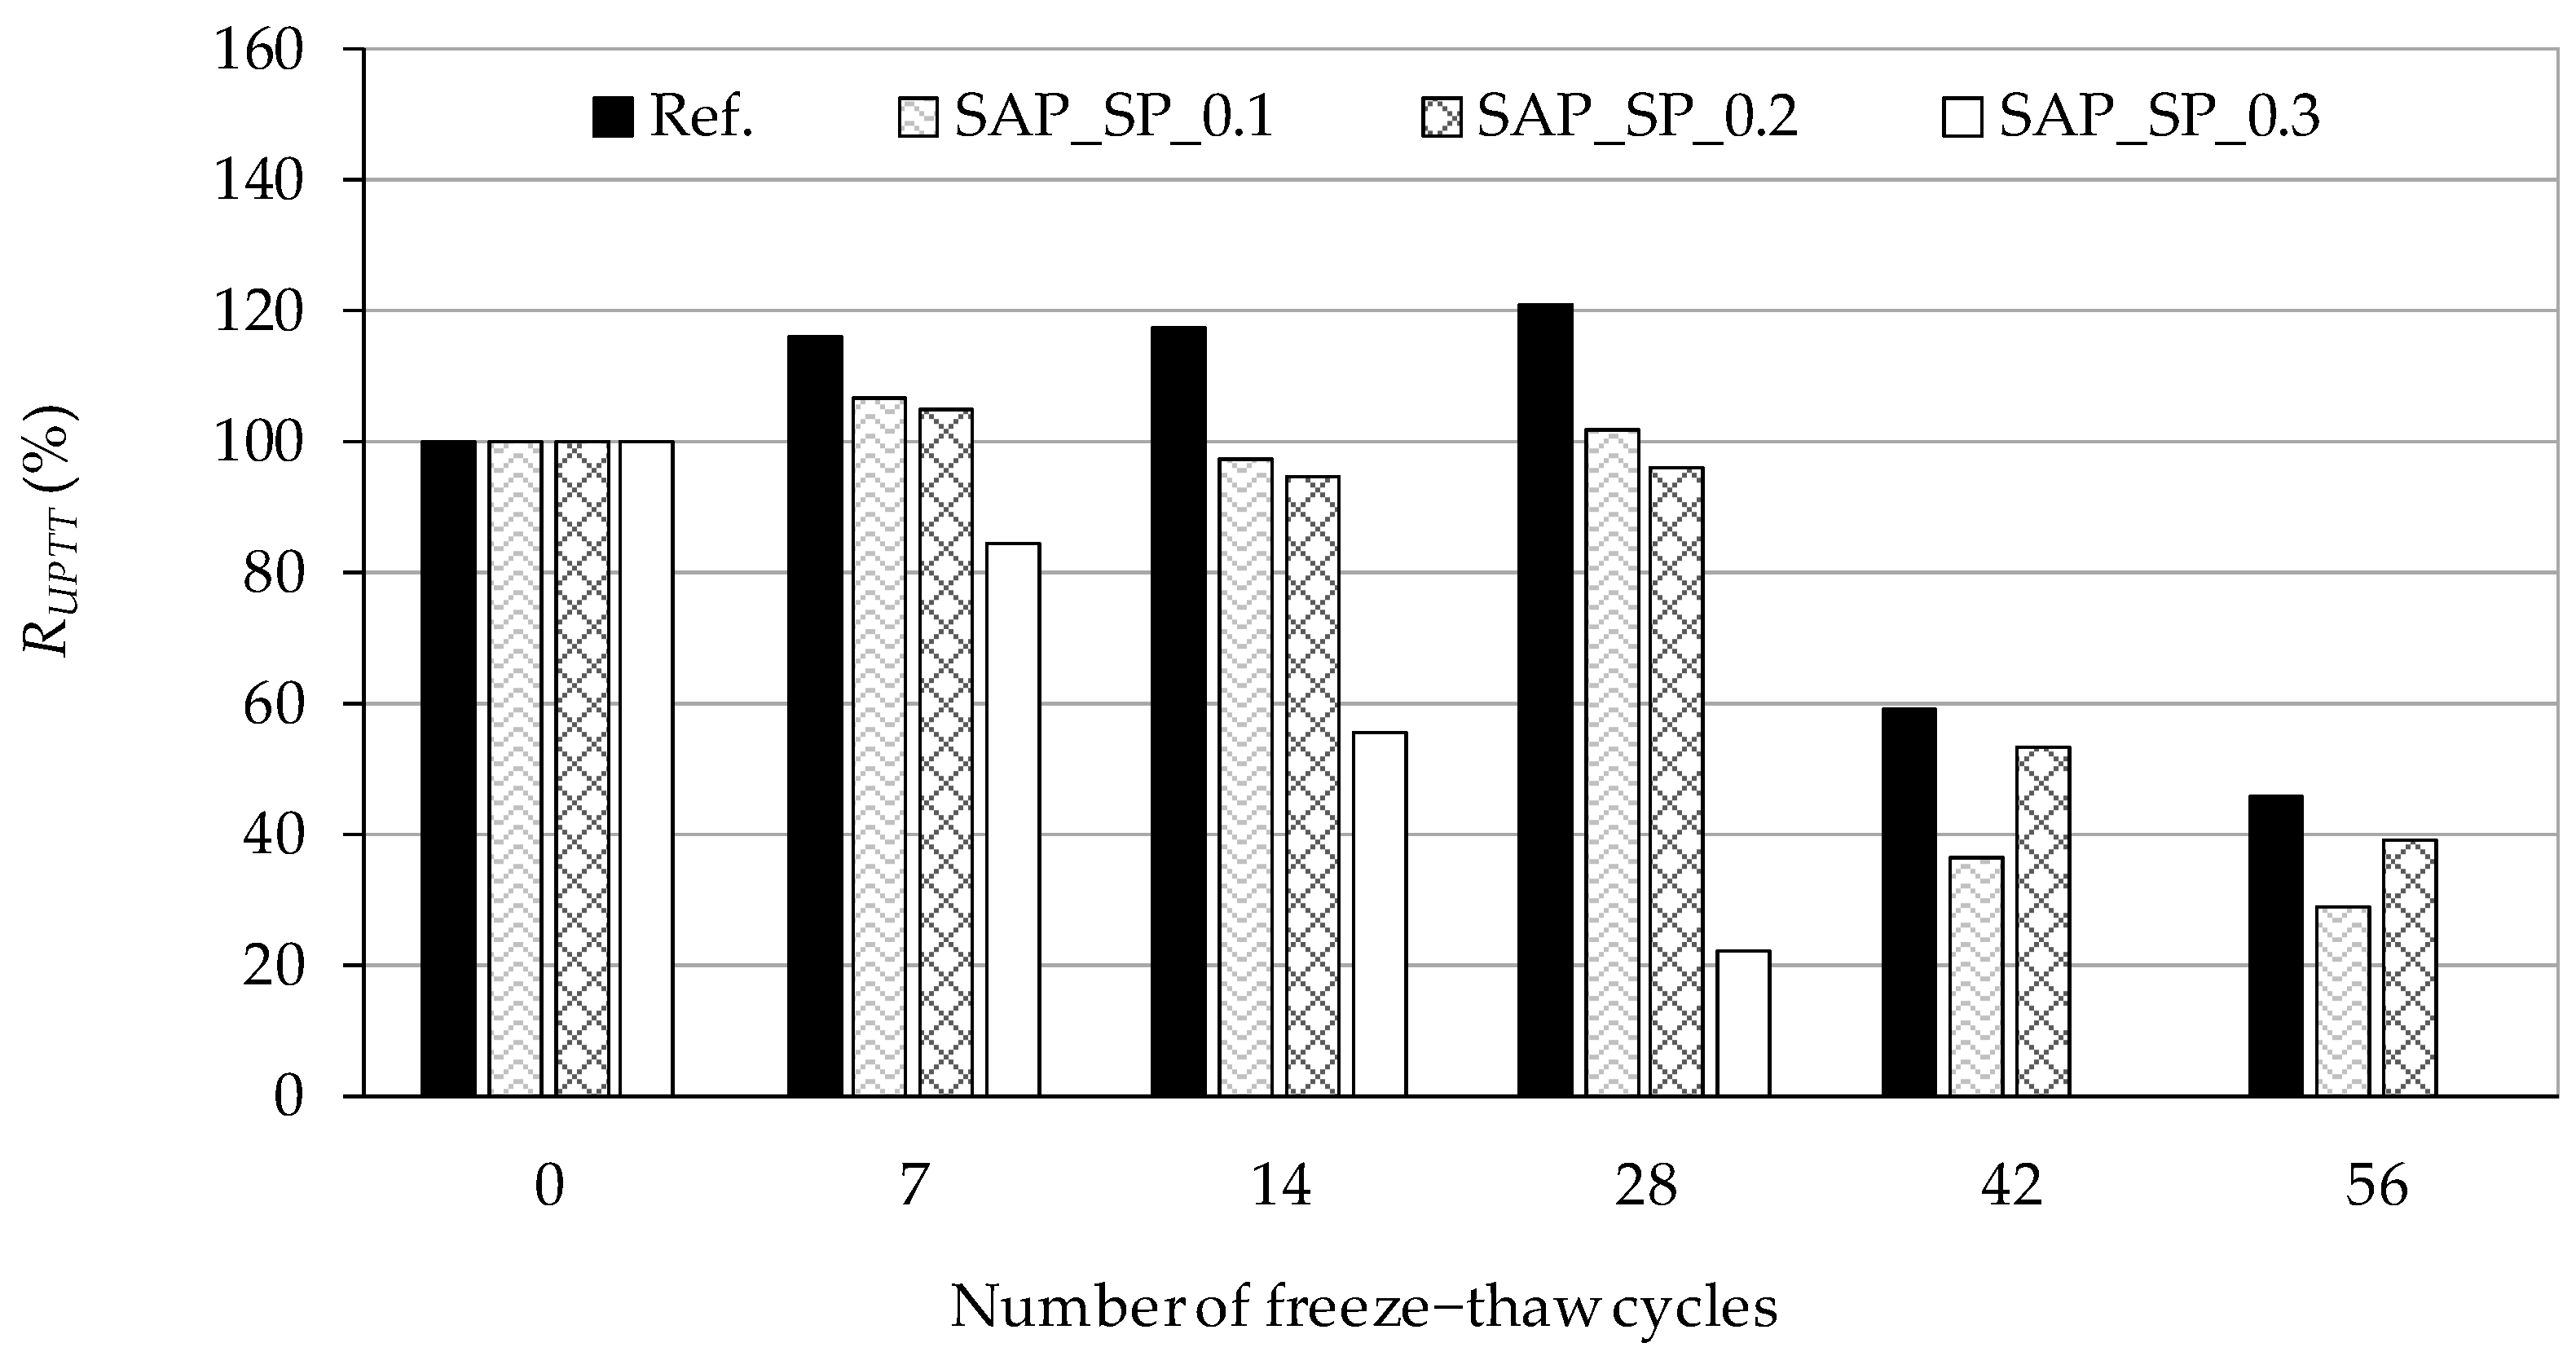
When concrete shrinks as the temperature decreases below the freezing point, critical tensile stress will not be applied to the ice layer. When the concrete considerably expands, critical tensile stress will be applied to the ice layer and the concrete will also be damaged. Referring to the strain on the mortar sample shown in
Figure 6, it can be expected that the higher the SAP_SP content (i.e., the higher the w/c
(effective) in our system) the more damage there will be on the concrete surface due to a weaker matrix. This prediction is consistent with the salt scaling results of the freeze–thaw resistance test as shown in
Figure 8.


