Stochastic Multi-Molecular Modeling Method of Organic-Modified Ceramics in Two-Photon Induced Photopolymerization


Abstract
:1. Introduction
2. Materials and Theory
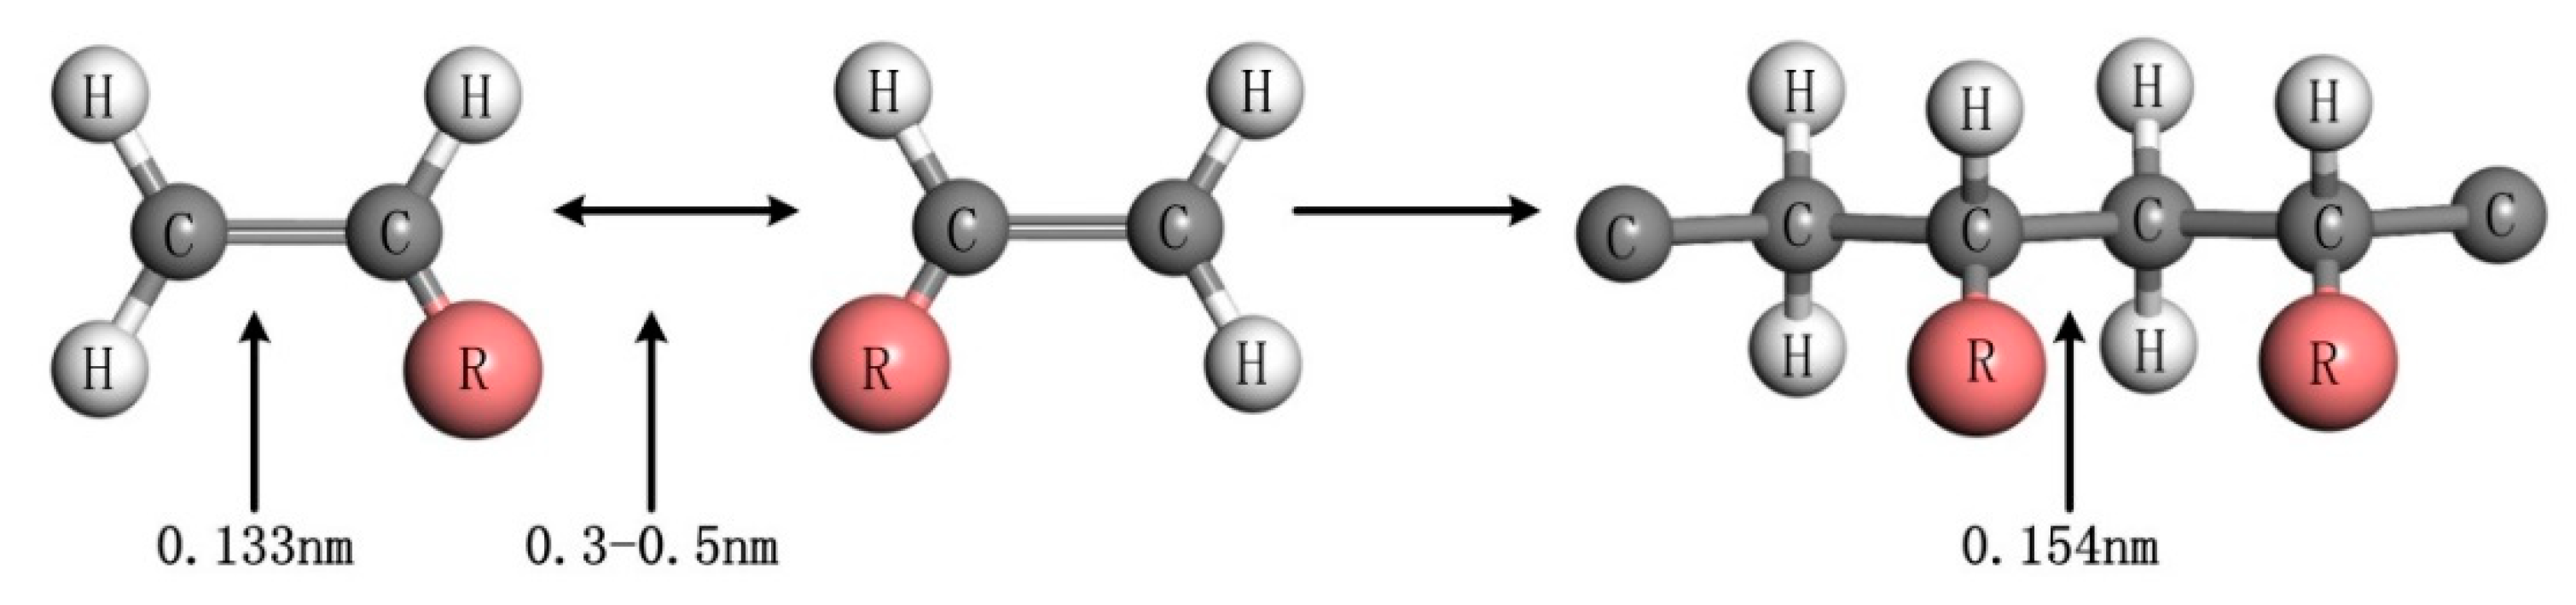
2.1. Synthesis of Photoresist and Reaction Principle of Cross-Linking Polymerization
2.2. Theory of Mechanics
3. Molecular Dynamics Simulation and Discussion
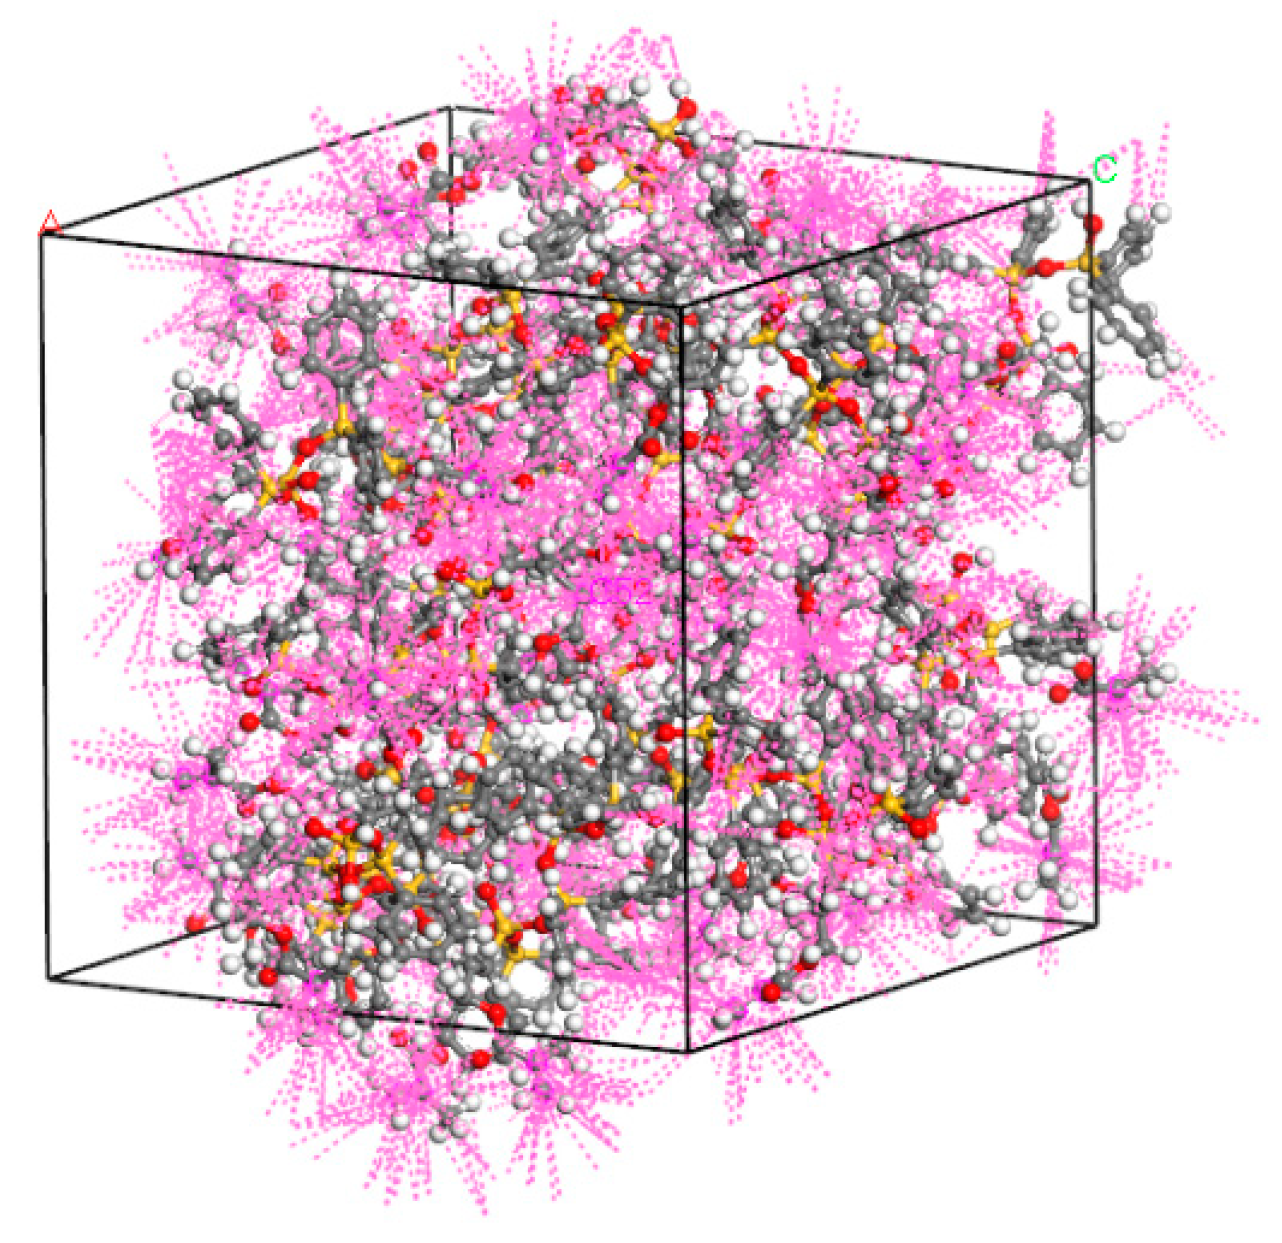
3.1. Establishment of Ormocer Photoresist Model
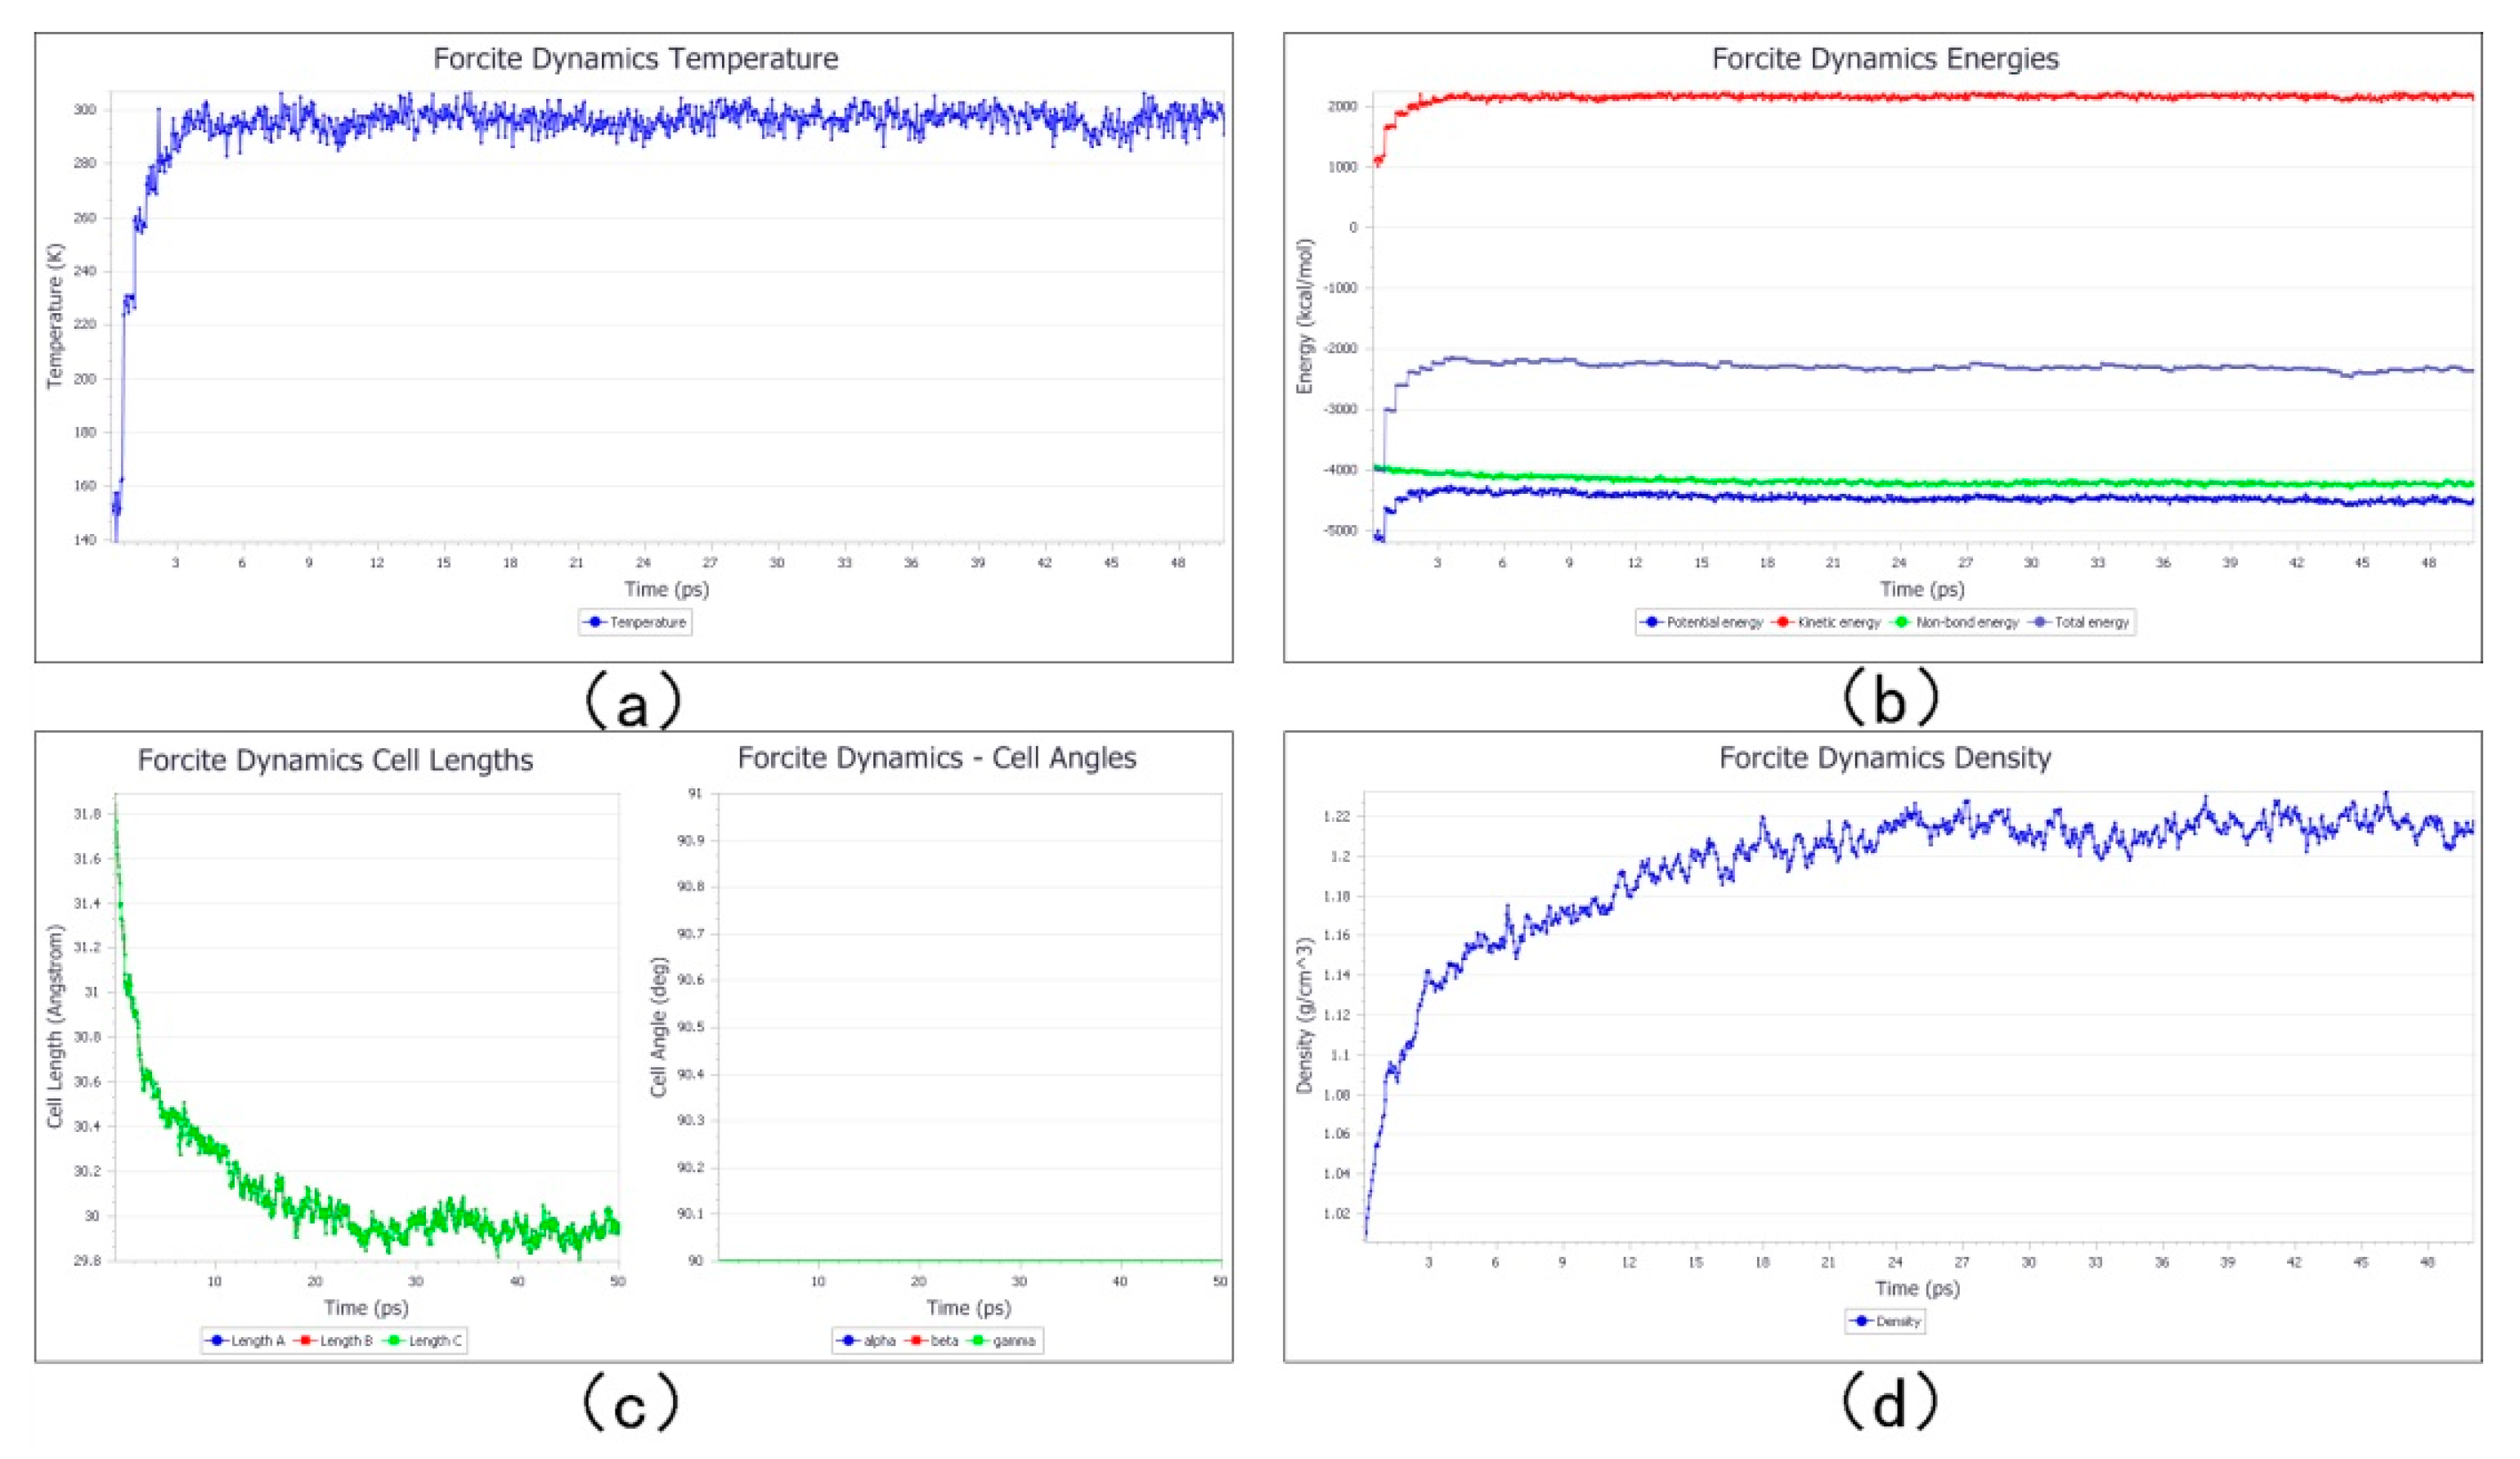
3.2. Dynamic Simulation before Cross-Linking
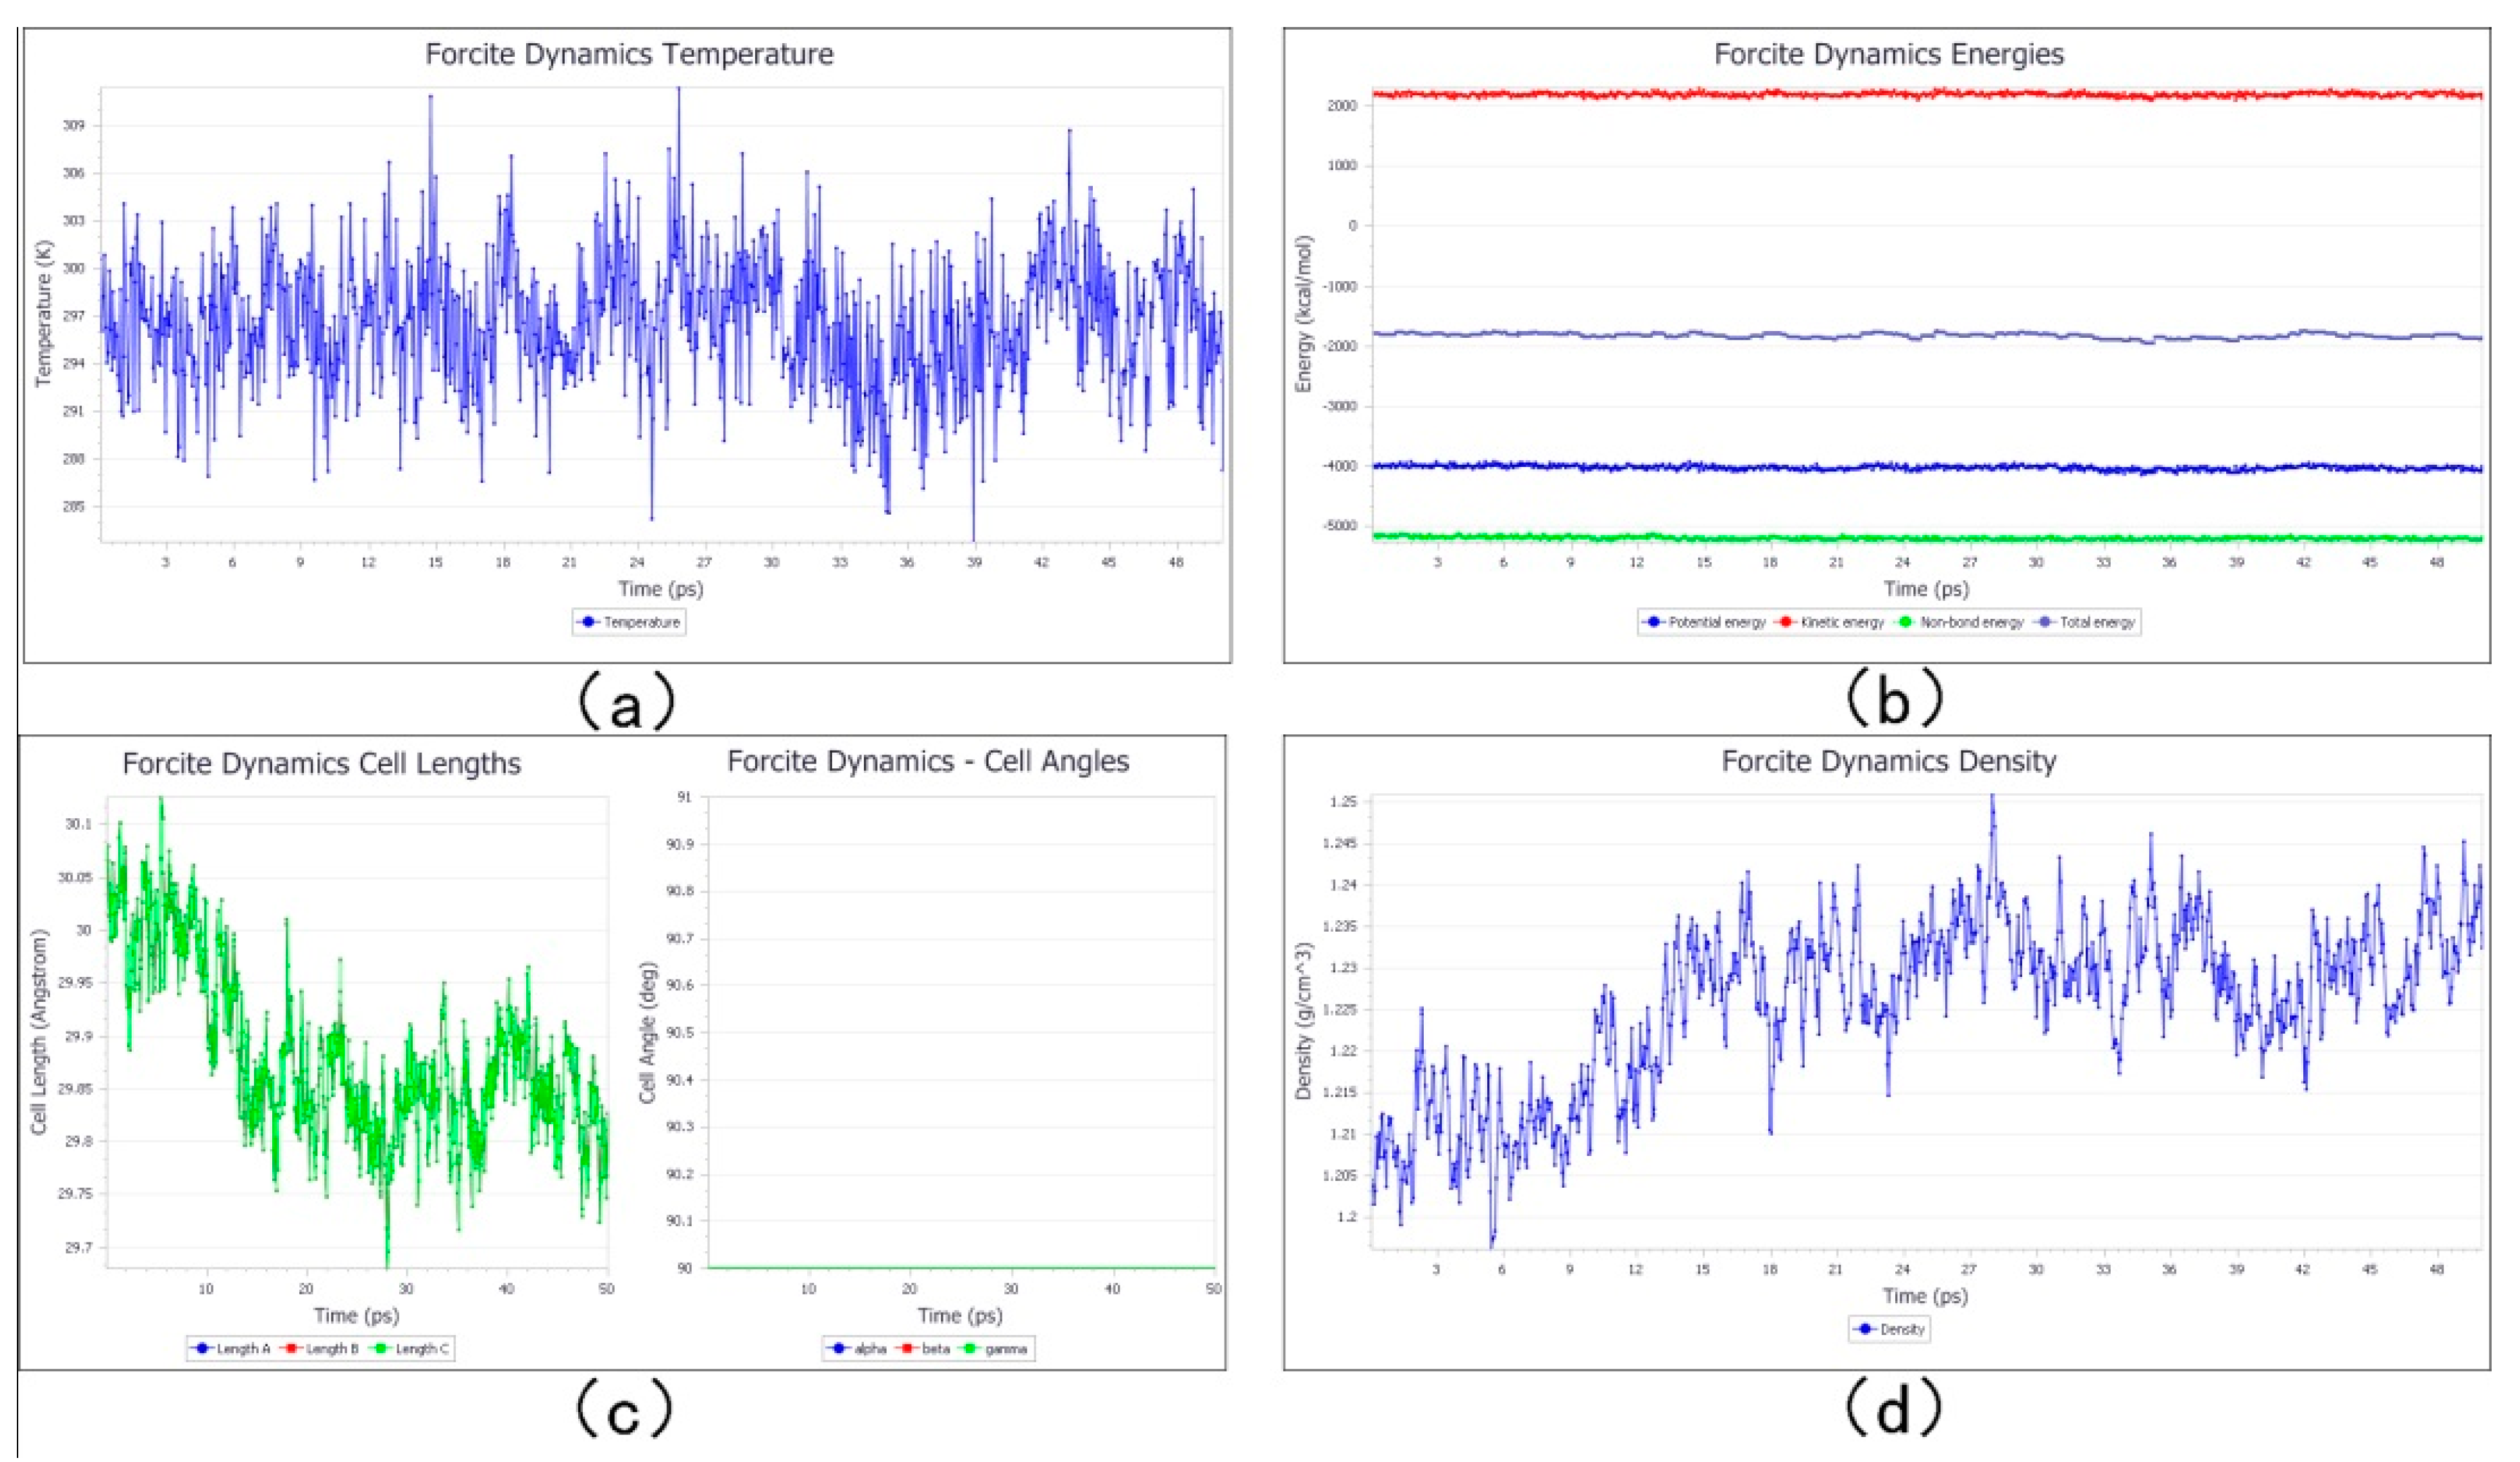
3.3. Cross-Linking Simulation of Photoresist
3.4. Contractility Analysis before and after Polymerization
4. Conclusions
Supplementary Materials
Author Contributions
Funding
Conflicts of Interest
References
- Houbertz, R.; Fröhlich, L.; Schulz, J.; Popall, M. Inorganic-organic hybrid materials (ormocer®s) for multilayer technology–passivation and dielectric behavior. MRS Online Proc. Libr. Arch. 2001, 665, 321–326. [Google Scholar] [CrossRef]
- Schmidt, H. Inorganic-organic composites by sol-gel techniques. MRS Proc. 1989, 171, 217–231. [Google Scholar] [CrossRef]
- Kickelbick, G. Hybrid Materials: Synthesis, Characterization, And Applications; Wiley-VCH Verlag & GmbH Co. KGaA: Weinheim, Germany, 2007. [Google Scholar]
- Xing, J.F.; Zheng, M.L.; Duan, X.M. Two-photon polymerization microfabrication of hydrogels an advanced 3D printing technology for tissue engineering and drug delivery. Chem. Soc. Rev. 2015, 44, 5031–5039. [Google Scholar] [CrossRef]
- Danilevičius, P.; Žukauskas, A.; Bičkauskaitė, G.; Purlys, V.; Rutkauskas, M.; Gertus, T.; Paipulas, D.; Matukaitė, J.; Baltriukienė, D.; Malinauskas, M. Laser-micro/nanofabricated 3D polymers for tissue engineering applications. Latv. J. Phys. Tech. Sci. 2011, 48, 32–43. [Google Scholar] [CrossRef]
- Mariana, M.S.; Schwarz, L.; Meyer, A.K.; Franziska, H.; Oliver, G.S. Cellular cargo delivery toward assisted fertilization by sperm-carrying micromotors. Nano Lett. 2015, 16, 555–561. [Google Scholar]
- Ushiba, S.; Shoji, S.; Kuray, P.; Masui, K.; Kono, J.; Kawata, S. Two photon polymerization lithography for 3D microfabrication of single wall carbon nanotube/polymer composites. In Proceedings of the SPIE MOEMS-MEMS, San Francisco, CA, USA, 2–7 February 2013; pp. 1–6. [Google Scholar]
- Žukauskas, A.; Matulaitienė, I.; Paipulas, D.; Niaura, G.; Malinauskas, M.; Gadonas, R. Tuning the refractive index in 3D direct laser writing lithography: Towards GRIN microoptics. Laser Photonics Rev. 2015, 9, 706–712. [Google Scholar] [CrossRef]
- Lin, J.Q.; Kan, Y.D.; Jing, X.; Lu, M.M. Design and fabrication of a three-dimensional artificial compound eye using two-photon polymerization. Micromachines 2018, 9, 336. [Google Scholar] [CrossRef]
- Wu, D.; Chen, Q.D.; Niu, L.G.; Wang, J.N.; Wang, J.; Wang, R.; Xia, H.; Sun, H.B. Femtosecond laser rapid prototyping of nanoshells and suspending components towards microfluidic devices. Lab Chip 2009, 9, 2391–2394. [Google Scholar] [CrossRef]
- Galanopoulos, S.; Chatzidai, N.; Melissinaki, V.; Selimis, A.; Schizas, C.; Farsari, M. Design, Fabrication and computational characterization of a 3D micro-valve built by multi-photon polymerization. Micromachines 2014, 5, 505–514. [Google Scholar] [CrossRef]
- Bauer, J.; Schroer, A.; Schwaiger, R.; Kraft, O. Approaching theoretical strength in glassy carbon nanolattices. Nat. Mater. 2016, 15, 438–443. [Google Scholar] [CrossRef]
- Meza, L.R.; Das, S.; Greer, J.R. Strong, lightweight, and recoverable three-dimensional ceramic nanolattices. Science 2014, 345, 1322–1326. [Google Scholar] [CrossRef] [PubMed]
- Kawata, S.; Sun, H.B.; Tanaka, T.; Takada, K.J. Finer features for functional microdevices. Nature 2001, 412, 697–698. [Google Scholar] [CrossRef] [PubMed]
- Jing, X.; Wang, K.X.; Lin, J.Q.; Liu, P.; Kan, Y.D.; Zheng, X.; Sun, J.; Lin, Y.C. Adaptive slicing method for three-dimensional microstructures with free-form surfaces in two photon polymerization micro-fabrication. Nano 2019, 14, 1950006. [Google Scholar] [CrossRef]
- Serbin, J.; Ovsianikov, A.; Chichkov, B. Fabrication of woodpile structures by two-photon polymerization and investigation of their optical properties. Opt. Express 2004, 12, 5221–5228. [Google Scholar] [CrossRef] [PubMed]
- Asche, T.S.; Behrens, P.; Schneider, A.M. Validation of the COMPASS force field for complex inorganic–organic hybrid polymers. J. Sol-Gel Sci. Technol. 2016, 81, 1–10. [Google Scholar] [CrossRef]
- Bo, Z.; Li, C.W.; Yang, H.C.; Ostrikov, K.; Yan, J.H.; Cen, K. Design of supercapacitor electrodes using molecular dynamics simulations. Nano-Micro Lett. 2018, 10, 33. [Google Scholar] [CrossRef]
- Fessel, S.; Schneider, A.M.; Steenhusen, S.; Houbertz, R.; Behrens, p. Towards an atomistic model for ORMOCER®-I: Application of forcefield methods. J. Sol-Gel Sci. Technol. 2012, 63, 356–365. [Google Scholar] [CrossRef]
- Kisin, S.; Vukić, J.B.; van der Varst, P.G.T.; de With, G.; Koning, C.E. Estimating the polymer-metal work of adhesion from molecular dynamics simulations. Chem. Mater. 2007, 19, 903–907. [Google Scholar] [CrossRef]
- Deetz, J.D.; Faller, R. Reactive molecular dynamics simulations of siliceous solids polycondensed from tetra- and trihydroxysilane. J. Non-Cryst. Solids 2015, 429, 183–189. [Google Scholar] [CrossRef]
- Asche, T.S.; Duderstaedt, M.; Behrens, P.; Schneider, A.M. Atomistic Simulation of sol–gel-Derived Hybrid Materials; Leibniz Universität Hannover: Hannover, Germany, 2016. [Google Scholar]
- Crivello, J.V. Applications of photoinitiated cationic polymerization to the development of new photoresists. ACS Symp. Ser. 1984, 242, 3–10. [Google Scholar]
- Dammel, R.R.; Ficner, S.A.; Oberlander, J.E.; Klauck-Jacobs, A.; Padmanaban, M.; Khanna, D.N.; Durham, D.L. Lithographic performance of a dry-etch stable methacrylate resist at 193 nm. Adv. Resist. Technol. Process. XV 1998, 3333, 144–151, (International Society for Optics and Photonics). [Google Scholar]
- Lin, J.Q.; Jing, X.; Lu, M.M.; Gu, Y.; Yu, B.J.; Tang, J.T.; Zheng, X. Two photon polymerization micro/nanofabrication of suspended nanorods in organically modified ceramics. Nano 2016, 12, 1750033. [Google Scholar] [CrossRef]
- Haas, K.H.; Wolter, H. Synthesis, properties and applications of inorganic-organic copolymers (ORMOCER® s). Curr. Opin. Solid State Mater. Sci. 1999, 4, 571–580. [Google Scholar] [CrossRef]
- Yoo, K.H.; Kim, I.W.; Cho, J.H.; Kwark, Y.-J. Silsesquiazane/organic polymer blends as organic-inorganic hybrid materials. Fibers Polym. 2012, 13, 1113–1119. [Google Scholar] [CrossRef]
- Ding, Y.F.; Zhang, Y.; Zhang, F.W.; Zhang, D.H.; Li, Z.P. Molecular dynamics study of the structure in vitreous silica with compass force field at elevated temperatures. Mater. Sci. Forum. 2007, 546, 2189–2193. [Google Scholar] [CrossRef]
- Leach, A.R. Molecular Modeling: Principles and Applications; Addison Wesley Longman Limited: Essex, UK, 1996. [Google Scholar]
- Dinur, A.K.; Hagler, A.R. Reviews in Computational Chemistry; VCH Publishers: New York, NY, USA, 1991. [Google Scholar]
- Hill, T.L. Steric effects: I. van der Waals potential energy curves. J. Chem. Phys. 1948, 16, 399–404. [Google Scholar] [CrossRef]


| System | Precursor | Contents |
|---|---|---|
| Ormocer-I |  | 100% |
| Ormocer-II | 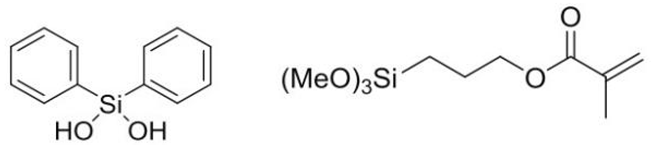 | 50%; 50% |
| Ormocer-III | 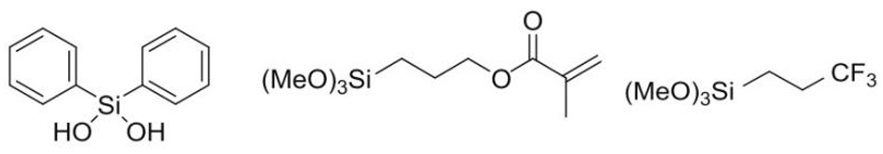 | 50%; 25%; 25% |
| Trajectory | Data before Polymerization | Data after Polymerization | ||||
|---|---|---|---|---|---|---|
| ρbp | Lbp | Vbp | ρap | Lap | Vap | |
| 1 | 1.2090 | 29.9946 | 26,985.49 | 1.2364 | 29.7955 | 26,451.49 |
| 2 | 1.2022 | 30.0515 | 27,139.27 | 1.2365 | 29.7952 | 26,450.74 |
| 3 | 1.2028 | 30.0458 | 27,123.75 | 1.2257 | 29.8822 | 26,683.29 |
| 4 | 1.2163 | 29.9344 | 26,823.33 | 1.2346 | 29.8102 | 26,490.76 |
| 5 | 1.2164 | 29.9339 | 26,821.88 | 1.2331 | 29.8221 | 26,522.63 |
| 6 | 1.2159 | 29.9382 | 26,833.42 | 1.2323 | 29.8292 | 26,541.50 |
| 7 | 1.2165 | 29.9327 | 26,818.74 | 1.2315 | 29.8350 | 26,556.88 |
| 8 | 1.2156 | 29.9399 | 26,838.02 | 1.2482 | 29.7020 | 26,203.34 |
| 9 | 1.2197 | 29.9064 | 26,747.93 | 1.2288 | 29.8569 | 26,615.47 |
| 10 | 1.2132 | 29.9601 | 26,892.42 | 1.2278 | 29.8652 | 26,637.75 |
| 11 | 1.2173 | 29.9265 | 26,801.94 | 1.2431 | 29.7402 | 26,309.50 |
| 12 | 1.2079 | 30.0038 | 27,010.17 | 1.2358 | 29.8009 | 26,466.04 |
| 13 | 1.2017 | 30.0555 | 27,150.21 | 1.2332 | 29.8216 | 26,521.23 |
| 14 | 1.2069 | 30.0117 | 27,031.63 | 1.2217 | 29.9145 | 26,769.87 |
| 15 | 1.2137 | 29.9557 | 26,880.69 | 1.2391 | 29.7741 | 26,394.71 |
| 16 | 1.2079 | 30.0038 | 27,010.26 | 1.2254 | 29.8849 | 26,690.51 |
| 17 | 1.2134 | 29.9587 | 26,888.52 | 1.2344 | 29.8123 | 26,496.32 |
| 18 | 1.2194 | 29.9094 | 26,756.11 | 1.2248 | 29.8897 | 26,703.23 |
| 19 | 1.2189 | 29.9130 | 26,765.80 | 1.2233 | 29.9015 | 26,734.89 |
| 20 | 1.2127 | 29.9638 | 26,902.40 | 1.2257 | 29.8826 | 26,684.24 |
| 21 | 1.2234 | 29.8763 | 26,667.37 | 1.2234 | 29.9008 | 26,733.05 |
| 22 | 1.2253 | 29.8608 | 26,626.03 | 1.2179 | 29.9456 | 26,853.44 |
| 23 | 1.2083 | 30.0003 | 27,000.73 | 1.2337 | 29.8177 | 26,510.65 |
| 24 | 1.2226 | 29.8831 | 26,685.55 | 1.2295 | 29.8514 | 26,600.63 |
| 25 | 1.2155 | 29.9412 | 26,841.64 | 1.2312 | 29.8374 | 26,563.39 |
| 26 | 1.2310 | 29.8152 | 26,504.15 | 1.2257 | 29.8822 | 26,683.05 |
| 27 | 1.2221 | 29.8870 | 26,696.09 | 1.2317 | 29.8334 | 26,552.70 |
| 28 | 1.2193 | 29.9099 | 26,757.51 | 1.2399 | 29.7677 | 26,377.64 |
| 29 | 1.2048 | 30.0294 | 27,079.43 | 1.2307 | 29.8414 | 26,574.07 |
| 30 | 1.2178 | 29.9219 | 26,789.78 | 1.2344 | 29.8122 | 26,496.14 |
| Average | 1.2146 | 29.9488 | 26,862.34 | 1.2313 | 29.8369 | 26,562.31 |
© 2019 by the authors. Licensee MDPI, Basel, Switzerland. This article is an open access article distributed under the terms and conditions of the Creative Commons Attribution (CC BY) license (http://creativecommons.org/licenses/by/4.0/).
Share and Cite
Lin, J.; Liu, P.; Jing, X.; Lu, M.; Wang, K.; Sun, J. Stochastic Multi-Molecular Modeling Method of Organic-Modified Ceramics in Two-Photon Induced Photopolymerization. Materials 2019, 12, 3876. https://doi.org/10.3390/ma12233876
Lin J, Liu P, Jing X, Lu M, Wang K, Sun J. Stochastic Multi-Molecular Modeling Method of Organic-Modified Ceramics in Two-Photon Induced Photopolymerization. Materials. 2019; 12(23):3876. https://doi.org/10.3390/ma12233876
Chicago/Turabian StyleLin, Jieqiong, Peng Liu, Xian Jing, Mingming Lu, Kaixuan Wang, and Jie Sun. 2019. "Stochastic Multi-Molecular Modeling Method of Organic-Modified Ceramics in Two-Photon Induced Photopolymerization" Materials 12, no. 23: 3876. https://doi.org/10.3390/ma12233876