Article

Shrinkage Properties of Self-Compacting Rubber Lightweight Aggregate Concrete: Experimental and Analytical Studies

School of Civil Engineering, Chang’an University, Xi’an 710061, China
*
Author to whom correspondence should be addressed.
Materials 2019, 12(24), 4059; https://doi.org/10.3390/ma12244059
Submission received: 5 October 2019 / Revised: 19 November 2019 / Accepted: 19 November 2019 / Published: 5 December 2019

Abstract

:
The shrinkage properties of self-compacting rubber lightweight aggregate concrete (SCRLC) were investigated by experimental and analytical studies in this paper. Rubber particles were used to substitute the sand in SCRLC by volume and rubber particles substitution percentages were 10%, 20%, 30%, 40% and 50%. The experimental results showed that the shrinkage strains of SCRLC increased with an increase of rubber particles substitution percentage. On the basis of China Academy of Building Research model and experimental data, a predictive model for describing the shrinkage strains of SCRLC was established. After analytical study, it was revealed that rubber particles substitution percentage of 80% in SCRLC might be the upper limit of substitution percentage; if the rubber particles substitution percentage was larger than 80%, the shrinkage strains of SCRLC would exceed the limiting value stipulated in JGJ51-2002 and the durability of SCRLC would drop to a worse status.

1. Introduction

Shrinkage property, one of durability of concrete, significantly affects the application of concrete, especially in mass concrete structures, high performance concrete structures and thin shells. So far, plenty of investigations have been conducted on the different types of shrinkage properties of concrete, such as plastic shrinkage [1], drying shrinkage [2], chemical shrinkage [3], and carbonation shrinkage [4]. Indeed, in most cases, the above different types of shrinkage strains occurred simultaneously and the shrinkage deformation of concrete was the result of a combination of different types of shrinkage strain [5,6]. Thus, in order to achieve a good understanding of the macroscopic shrinkage behavior of concrete, a total shrinkage deformation including drying shrinkage, chemical shrinkage, and carbonation shrinkage was investigated in some literature [7,8,9].
Self-compacting rubber lightweight aggregate concrete (SCRLC) is a new type of lightweight aggregate concrete (LC) with a number of virtues [10,11], typically in recycling waste tires, increasing the toughness of concrete, reducing self-weight of concrete, etc. Nevertheless, previous studies indicate that utilizing rubber particles to substitute sand in normal concrete (NC) will also cause some harmful influences, such as reducing the strength of concrete [12,13], decreasing workability of concrete [14], increasing toughness of concrete [15], increasing shrinkage of concrete [16], etc. It can be deduced that effect of rubber particles on the properties of LC and NC might be similar. Up to now, the effects of rubber particles on the mechanical properties of LC have been verified which are similar to the NC [10,17], whereas few studies are focus on the shrinkage properties of SCRLC. Therefore, it is necessary to conduct the shrinkage test to understand the shrinkage behavior of SCRLC.
As a vital index in consideration of concrete durability, the shrinkage properties of NC have been investigated frequently in recent years [18,19,20]. Based on experimental data, plenty of models are proposed to describe the shrinkage strain of concrete [21,22,23,24,25,26,27,28,29,30]. Although different models consider disparate factors on the effect of shrinkage strains, most of the factors affecting shrinkage strains obviously are considered in existing models. Incorporation of rubber particles and the introduction of self-compacting technology in LC leads to great differences between LC and SCRLC, not only in mechanical properties, but also durability properties. Despite the fact that shrinkage strain of LC can be described by existing models [31,32], using existing models to predict shrinkage strain of SCRLC may be unsuitable. As a new green structural material, it is necessary to have a good understanding on the shrinkage properties of SCRLC for its popularization and application. However, few existing research focuses on the shrinkage properties of SCRLC; the most relevant research report may be the shrinkage properties of rubberized concrete, which is still quite different from SCRLC [13,14,16].
Based on the above background, this paper was undertaken to detect the effect of rubber particles on the shrinkage properties of SCRLC. The rubber particles are utilized to substitute sand by volume, with substitution percentages of 10%, 20%, 30%, 40% and 50%. The contact method is used to evaluate the shrinkage strains of SCRLC. Here, the shrinkage strain is total shrinkage, and the testing ages are 1d, 3d, 7d, 28d, 60d, 90d, 120d, 150d, 180d and 360d. After analyzing the experimental data, combining with contrastive analysis of existing shrinkage predictive models, the shrinkage prediction model of SCRLC is proposed. Then, the shrinkage strains of SCRLC with rubber particles substitution percentages ranged from 60% to 100% are predicted by established model. The limiting rubber particles substitution percentages in SCRLC is also given on account of limiting values of shrinkage strain.

2. Experimental Program

2.1. Material Properties and Mix Proportions

SCRLC composed of ordinary Portland cement, fly ash, shale ceramsite, sand, rubber particles, thickener, water reducer and water was prepared in this research. In order to investigate the effects of rubber particles on the shrinkage properties of SCRLC, rubber particles were used to substitute sand by volume and set as a unique variable in design of mix proportion. The detail of each mix proportion was exhibited in Table 1. The volume substitution percentages were 10%, 20%, 30%, 40% and 50%.
The chemical compositions and physical properties of binding material including ordinary Portland cement and fly ash are presented in Table 2. The shale ceramsite was crushed shale ceramsite, which was used as coarse aggregate. The properties of shale ceramsite were crushing strength 8.82 MPa, bulk density 842 kg/m3 and particle size distribution between 4.75 mm and 19 mm. The sand was nature river sand with properties of modulus of fineness 2.8, density 2650 kg/m3 and bulk density 1425 kg/m3. The rubber particles were manufactured by mechanical shredding of waste tires. In order to make sure the rubber particles had a similar particle size distribution with sand, the rubber particles used in this research were prepared by artificial formulation. The properties of rubber particles were modulus of fineness 2.7, density 1190 kg/m3 and bulk density 365 kg/m3. Figure 1 presents the particle size distribution of nature sand, rubber particles and crushed shale ceramsite. The thickener was hydroxypropyl methylcellulose with dosage of 0.04% (in mass of binding material). The water reducer was polycarboxylate superplasticizer with dosage of 1% (in mass of binding material). The water was tap water.

2.2. Specimens and Test Methods

According to GB/T 50082-2009 [33], the prism specimens with dimensions 100 mm × 100 mm × 515 mm were prepared for determining the shrinkage values of SCRLC at various rubber particles substitution percentages. Due to good flow of fresh SCRLC, the specimens were manufactured without vibration. After pouring the SCRLC, the specimens were covered with plastic film for 1 day and then demoulded. All specimens were moisture-cured at 20 ± 2 °C and relative humidity > 95% until testing.
The contact method was utilized to measure the shrinkage value of SCRLC in accordance with GB/T 50082-2009 [33] (as shown in Figure 2). The shrinkage testing apparatus, equipped with a dial gauge at one end, was used to measure the shrinkage strain. Before each test, the gauge was calibrated by the standard bar. After demoulding, the length of specimen was monitored immediately and the value was deemed to initial length of specimen. The testing ages were set as 1 d, 3 d, 7 d, 28 d, 60 d, 90 d, 120 d, 150 d, 180 d and 360 d. During testing, the laboratory environment was 20 ± 2 °C and relative humidity was 60% ± 5%. In order to reduce the test error, the side and direction of specimens were kept the same for each test. The representative shrinkage value for each batch was determined from the mean value of three experimental values at each age. The shrinkage stain was calculated as follows:
ε st = L 0 L t L b
where εst was shrinkage strain at age of t, L0 was initial length of specimen (mm), Lt was the length of specimens at testing time t (mm), Lb was gauge length (540 mm).

3. Results and Discussion

3.1. Experimental Shrinkage Strain

The mean and standard deviation of shrinkage strains of SCRLC at different rubber particles substitution percentage are shown in Table 3. Smaller standard deviation for each batch of SCRLC indicated that three testing values were approximate and the mean value could be used to represent the shrinkage strain of SCRLC. With prolongation of age, the shrinkage strains of SCRLC increased. Most increment of shrinkage strain occurred when the age was less than 120 days, whereafter, the shrinkage strain of SCRLC increased slightly.
Figure 3 illustrates the variation of shrinkage strains of SCRLC at different rubber particles substitution percentages. As the rubber particles substitution percentage increased, the shrinkage strains of SCRLC augmented at each age. The greater the age, the larger the increment of shrinkage strains of SCRLC with an increase of rubber particle substitution percentage would be. When the rubber particles substitution percentage was lower than 10%, the shrinkage strains of SCRLC were similar for each other at different ages. At an age of 360 d, compared with SCLC, the shrinkage strain increased from 624 × 10−6 to 754 × 10−6 as rubber particles substitution percentage increased from 0% to 50%. This meant that incorporation of rubber particles in SCLC led to a reduction of volume stability of SCLC. This was mainly due to the lower stiffness of rubber particles. When shrinkage deformation occurred during hardening process of cement, rubber particles had lesser resistance deformation ability than sand. It resulted in an increase of shrinkage deformation of SCRLC as rubber particles substitution percentage augmented.

3.2. Predictive Models of Shrinkage Strain

3.2.1. Existing Models

Based on the consideration factors of effects of shrinkage deformation of concrete, lots of predictive models have been proposed to evaluate the shrinkage deformation of concrete in previous studies, such as ACI 209 model [25], fib Model Code-2010 [26], B3 model [27], GL2000 model [28], Dilger model [29], China Academy of Building Research model [30].
(1) ACI 209 model
ACI 209 model was proposed by American Concrete Institute (ACI) and can be expressed as the following:
ε s h ( t , t s h , 0 ) = t t s h , 0 35 + ( t t s h , 0 ) ε s h ,   ( moist   cured )
ε s h ( t , t s h , 0 ) = t t s h , 0 55 + ( t t s h , 0 ) ε s h ,   ( steam   cured )
where εsh(t, tsh,0) is shrinkage strain, t is age (d), tsh,0 is curing age at the beginning of drying (d), and εsh,∞ is final shrinkage strain.
(2) fib Model Code-2010
fib Model Code-2010, mentioned in International Federation for Structural Concrete, was used to predict the total shrinkage or swelling strains of concrete. In this model, the shrinkage strains could be calculated by the formulas as follows:
ε cs ( t , t s ) = ε cbs ( t ) + ε cds ( t , t s )
ε cbs ( t ) = ε cbs 0 ( f c m ) β b s ( t )
ε cds ( t , t s ) = ε cds 0 ( f c m ) β R H ( R H ) β d s ( t t s )
ε cbs 0 ( f c m ) = α b s ( 0.1 f c m 6 + 0.1 f c m ) 2.5 10 6
β b s ( t ) = 1 exp ( 0.2 t )
ε cds 0 ( f c m ) = [ ( 220 + 110 α d s 1 ) exp ( α d s 2 f c m ) ] 10 6
β RH = { 1.55 ( 1 ( R H 100 ) 3 )      f o r      40 % R H < 99 % β s 1 0.25                        f o r      R H 99 %   β s 1
β d s ( t t s ) = [ ( t t s ) 0.035 h 2 + ( t t s ) ] 0.5
β s 1 = ( 35 f c m ) 0.1 1.0
ε lcs ( t , t s ) = η ε cs ( t , t s )
where εcs (t, ts) is total shrinkage or swelling strains of NC, εcbs (t) is basic shrinkage of NC, εcds (t, ts) is drying shrinkage of NC, t is the concrete age in days, ts is the concrete age at the beginning of drying in days, (tts) is the duration of drying in days, εcbs0 (fcm) is the basic notional shrinkage coefficient, βbc (t) is the time function, fcm is mean compressive strength of concrete at 28 days (MPa), RH is relative humidity (%), αbs, αds1 and αds2 are coefficients dependent on the type of cement, respectively, h is effective height of section (mm), and εlcs (t, ts) is shrinkage of LC, η = 1.2 for LC20 and higher.
(3) B3 model
Bazant developed a shrinkage predictive model on account of existing shrinkage and creep data named B3 model. The formulas were shown as
ε sh ( t , t s ) = ε sh K h S ( t )
ε sh = α 1 α 2 [ 26 ( ω ) 2.1 ( f c ) 0.28 + 270 ]
K h = 1 h 3
S ( t ) = tanh t t 0 τ s h
where εsh (t, ts) is shrinkage strain at time t (in/in), εsh∞ is ultimate shrinkage strain (in/in), Kh is cross-section shape factor, S(t) is time function for shrinkage, α1 and α2 are parameters related to the type of cement and curing condition, w is water content (lb/ft3), f’c is mean cylinder compressive strength at 28 day, h is relative humidity (%), t is age of concrete (days), t0 is age of concrete at beginning of shrinkage, and τsh is shrinkage halftime in days.
(4) GL2000 model
Based on the ACI 209 model, GL2000 model was proposed by Gardner and Lockman to describe the shrinkage properties of concrete in 2000. The Equations were given as follows:
ε s h = ε s h u β R H β s ( t , t s )
ε s h u = 1000 β s c ( 30 f c 28 ) 1 2 10 6
β R H = 1 1.18 R H 4
β s ( t , t s ) = [ t t s t t s + 0.15 ( V / S ) 2 ] 0.5
(5) Dilger model
Dilger model divided the total shrinkage into basic shrinkage and drying shrinkage and calculated the total shrinkage by the following formulae:
ε c s ( t , t s ) = ε b s ( t ) + ε d s ( t , t s )
ε b s ( t ) = ε b s 0 β b s ( t ) × 10 6
ε b s 0 = { 700 × exp ( 3.5 × w c ) + 120                    Concrete   with   silica   fume 700 × exp ( 3.5 × w c )                             Concrete   without   silica   fume
β bs ( t ) = t 0.7 γ b s + α b s t 0.7
γ b s = 16.7 × ( 1 α b s )
α b s = 1.04 1 3 w c
ε ds ( t , t s ) = ε d s 0 β R H β ds ( t , t s ) × 10 6
ε d s 0 = ( 100 × w c ) 2 f c 28 0.23 + 200
β R H = 1.22 1.75 × ( R H 100 ) 3
β d s ( t , t s ) = ( t t s ) 0.6 0.0016 × ( V / S ) 2 γ ds + ( t t s ) 0.6
γ d s = 6.42 + 1.5 ln ( t s )
(6) China Academy of Building Research model
The China Academy of Building Research model was regressed from numeral experimental data by researchers in concrete research institute, China Academy of Building Research. The predictive formula could be expressed as the following:
ε ( t ) = ε ( t ) 0 β 1 β 2 β 3 β 5 β 6
where ε(t)0 is the basic equation of shrinkage, β1 is the influence coefficient of relative humidity, β2 is the influence coefficient of sectional dimension, β3 is the influence coefficient of curing method, β4 is the influence coefficient of fly ash instead of cement, and β5 is influence coefficient of strength grade of concrete.
The basic equation of shrinkage can be expressed as follows:
ε ( t ) 0 = t a + b t × 10 3
where a and b are the coefficient regressing from experimental data.

3.2.2. Comparison Analysis

After analyzing the above shrinkage predictive models, it could be detected that the shrinkage prediction value calculated by ACI 209 model, GL 2000 model, fib Model Code-2010, B3 model and China Academy of Building Research model were all total shrinkage which included drying shrinkage and autogenous shrinkage. Compared to the above models, it could be seen that China Academy of Building Research model was much simpler than the other models, and the factors considered in this model was much more close to the experimental design. In addition, the China Academy of Building Research model was also utilized to predict the shrinkage strain of LC in JGJ51-2002 [34]. Therefore, the China Academy of Building Research model was tentatively selected to describe the shrinkage properties of SCRLC in this research. According to JGJ51-2002 [34], for LC, a = 78.69 and b = 1.20 at age of 3 days; meanwhile, a = 120.23 and b = 2.26 at age of 28 days. It meant that prediction of shrinkage strain of concrete at different ages would utilize different parameters a and b.
Figure 4 shows the comparison of shrinkage strains of SCLC between experiment and prediction. It can be seen that the experimental results were more than twice as large as predictive results. It indicated that using China Academy of Building Research model to predict the shrinkage strain of SCLC directly was unsuitable. Furthermore, incorporation of rubber particles in SCLC might lead to a much greater difference between SCLC and SCRLC. The gap between the shrinkage strain of SCRLC predicted by China Academy of Building Research model and experimental test values would be much larger. Thus, the China Academy of Building Research model would be also unsuitable to predict the higher shrinkage strains of SCRLC. Proposing a simple predictive model for shrinkage strain of SCRLC was necessary.

3.2.3. Modified Model

Based on the above cases, in order to build a model to describe the experimental results of shrinkage strains of SCRLC, the China Academy of Building Research model was selected as a basic equation to fit the experimental results. On the basis of China Academy of Building Research model, the influence coefficient of rubber particles substitution percentage β6 was introduced and the predictive formula was exhibited as the following:
ε ( t ) = ε ( t ) 0 β 1 β 2 β 3 β 4 β 5 β 6 = ε ( t ) 1 β 6
Through fitting analysis of experimental shrinkage strains of SCLC by MATLAB software (seen in Figure 5), the parameters a and b in basic equation of shrinkage of SCRLC were 47.8 and 1.47, respectively. The basic equation of shrinkage of SCRLC ε(t)1 could be expressed as follows:
ε ( t ) 1 = t 0.0478 + 0.00147 t × 10 3
After comparative analysis, it could be seen that change law of fitting curve was in accordance with the experimental results. The correlation coefficient between the fitting curve and experimental data was 0.9968 which was at a high level. This indicated that Equation (36) would be used as basic equation for shrinkage strain of SCLC.
Considering the effects of rubber particles substitution percentage on the shrinkage strain of SCLC, through statistical regression of experimental data, the influence coefficients of rubber particles substitution percentage β6 are summarized in Table 4. Then, the predication model for shrinkage strain of SCRLC would be described as the following:
ε ( t ) = t 47.8 + 1.47 t × 10 3 × β 6
Figure 6 shows the comparison of shrinkage strains of SCRLC obtained from experiment and fitting. It can be clearly seen that the fitting values were in good accordance with experimental results for each batch. This indicated that as selection of appropriate influence coefficients of rubber particles substitution percentage β6, the proposed model could be used to describe the shrinkage strains of SCRLC.
The relationship between β6 and rubber particles substitution percentage r was established as shown in Figure 7. It could be observed that the relationship between β6 and r was approximately linear with correlation coefficient of 0.9535, and the regression equation could be expressed as follows:
β 6 = 0.0044 r + 0.9733

3.2.4. Shrinkage Strain Prediction

Based on the relationship between β6 and r described by Equation (38), the mean shrinkage strains of SCRLC with rubber particles substitution percentage estimates varied from 60% to 100%; these are presented in Figure 8. When the rubber particles substitution percentage increased from 60% to 100%, the shrinkage strains of SCRLC increased for each batch at a different age. According to GB/T 50082-2009 [33], the shrinkage strain of concrete at age of 360 days was deemed as final shrinkage. For SCRLC, with rubber particles substitution percentage increased from 0% to 100%, the final shrinkage strain increased from 624 × 10−6 to 894 × 10−6 with an increment of 48.4%. Nevertheless, the limiting value of shrinkage strain for LC was 820 × 10−6, which was stipulated in JGJ51-2002. When the rubber particles substitution percentage was 80%, the shrinkage strain of SCRLC was 834 × 10−6, which exceeded the limiting value. This meant that more than 80% of rubber particles substitution percentage in SCRLC would seriously affect the durability of SCRLC and should be given more attention in application of actual engineering.

3.3. Discussion

The shrinkage properties of concrete were closely related to the characteristics of aggregate and the water to cement ratio [35]; the higher the water to cement ratio, the larger shrinkage strain would be, while the higher stiffness of aggregate, the smaller shrinkage strain would be. In this investigation, the rubber particles were utilized to substitute the sand in SCLC. Compared with sand, the stiffness of rubber particles was much lower. Shrinkage occurred during the setting and hardening process of cement and the deformation of rubber particles was much larger than sand. Therefore, keeping material composition of SCRLC the same, except the ratio of rubber particles to sand, the shrinkage of SCRLC increased as rubber particles substitution percentage raised. In order to obtain smaller shrinkage strain of SCRLC and maintain excellent durability of SCRLC, a reduction of the water to cement ratio in SCRLC should be accompanied with an increase of the rubber particles substitution percentage. Moreover, incorporation of expansive agent in SCRLC was also a way to reduce the shrinkage deformation. By comprehensive consideration, the mix proportion of SCRLC should be confirmed by actual demand and the rubber particles substitution percentages should be controlled at reasonable range. Therefore, the SCRLC would be applied in practical engineering and a huge environmental benefits would be achieved in the future.

4. Conclusions

Based on the experimental results of shrinkage properties of SCRLC and contrastive analysis of the existing prediction models of shrinkage strains of concrete, the shrinkage properties of SCRLC were studied and the prediction model of shrinkage strain of SCRLC was proposed in this investigation; the conclusions could be drawn as follows:
(1)
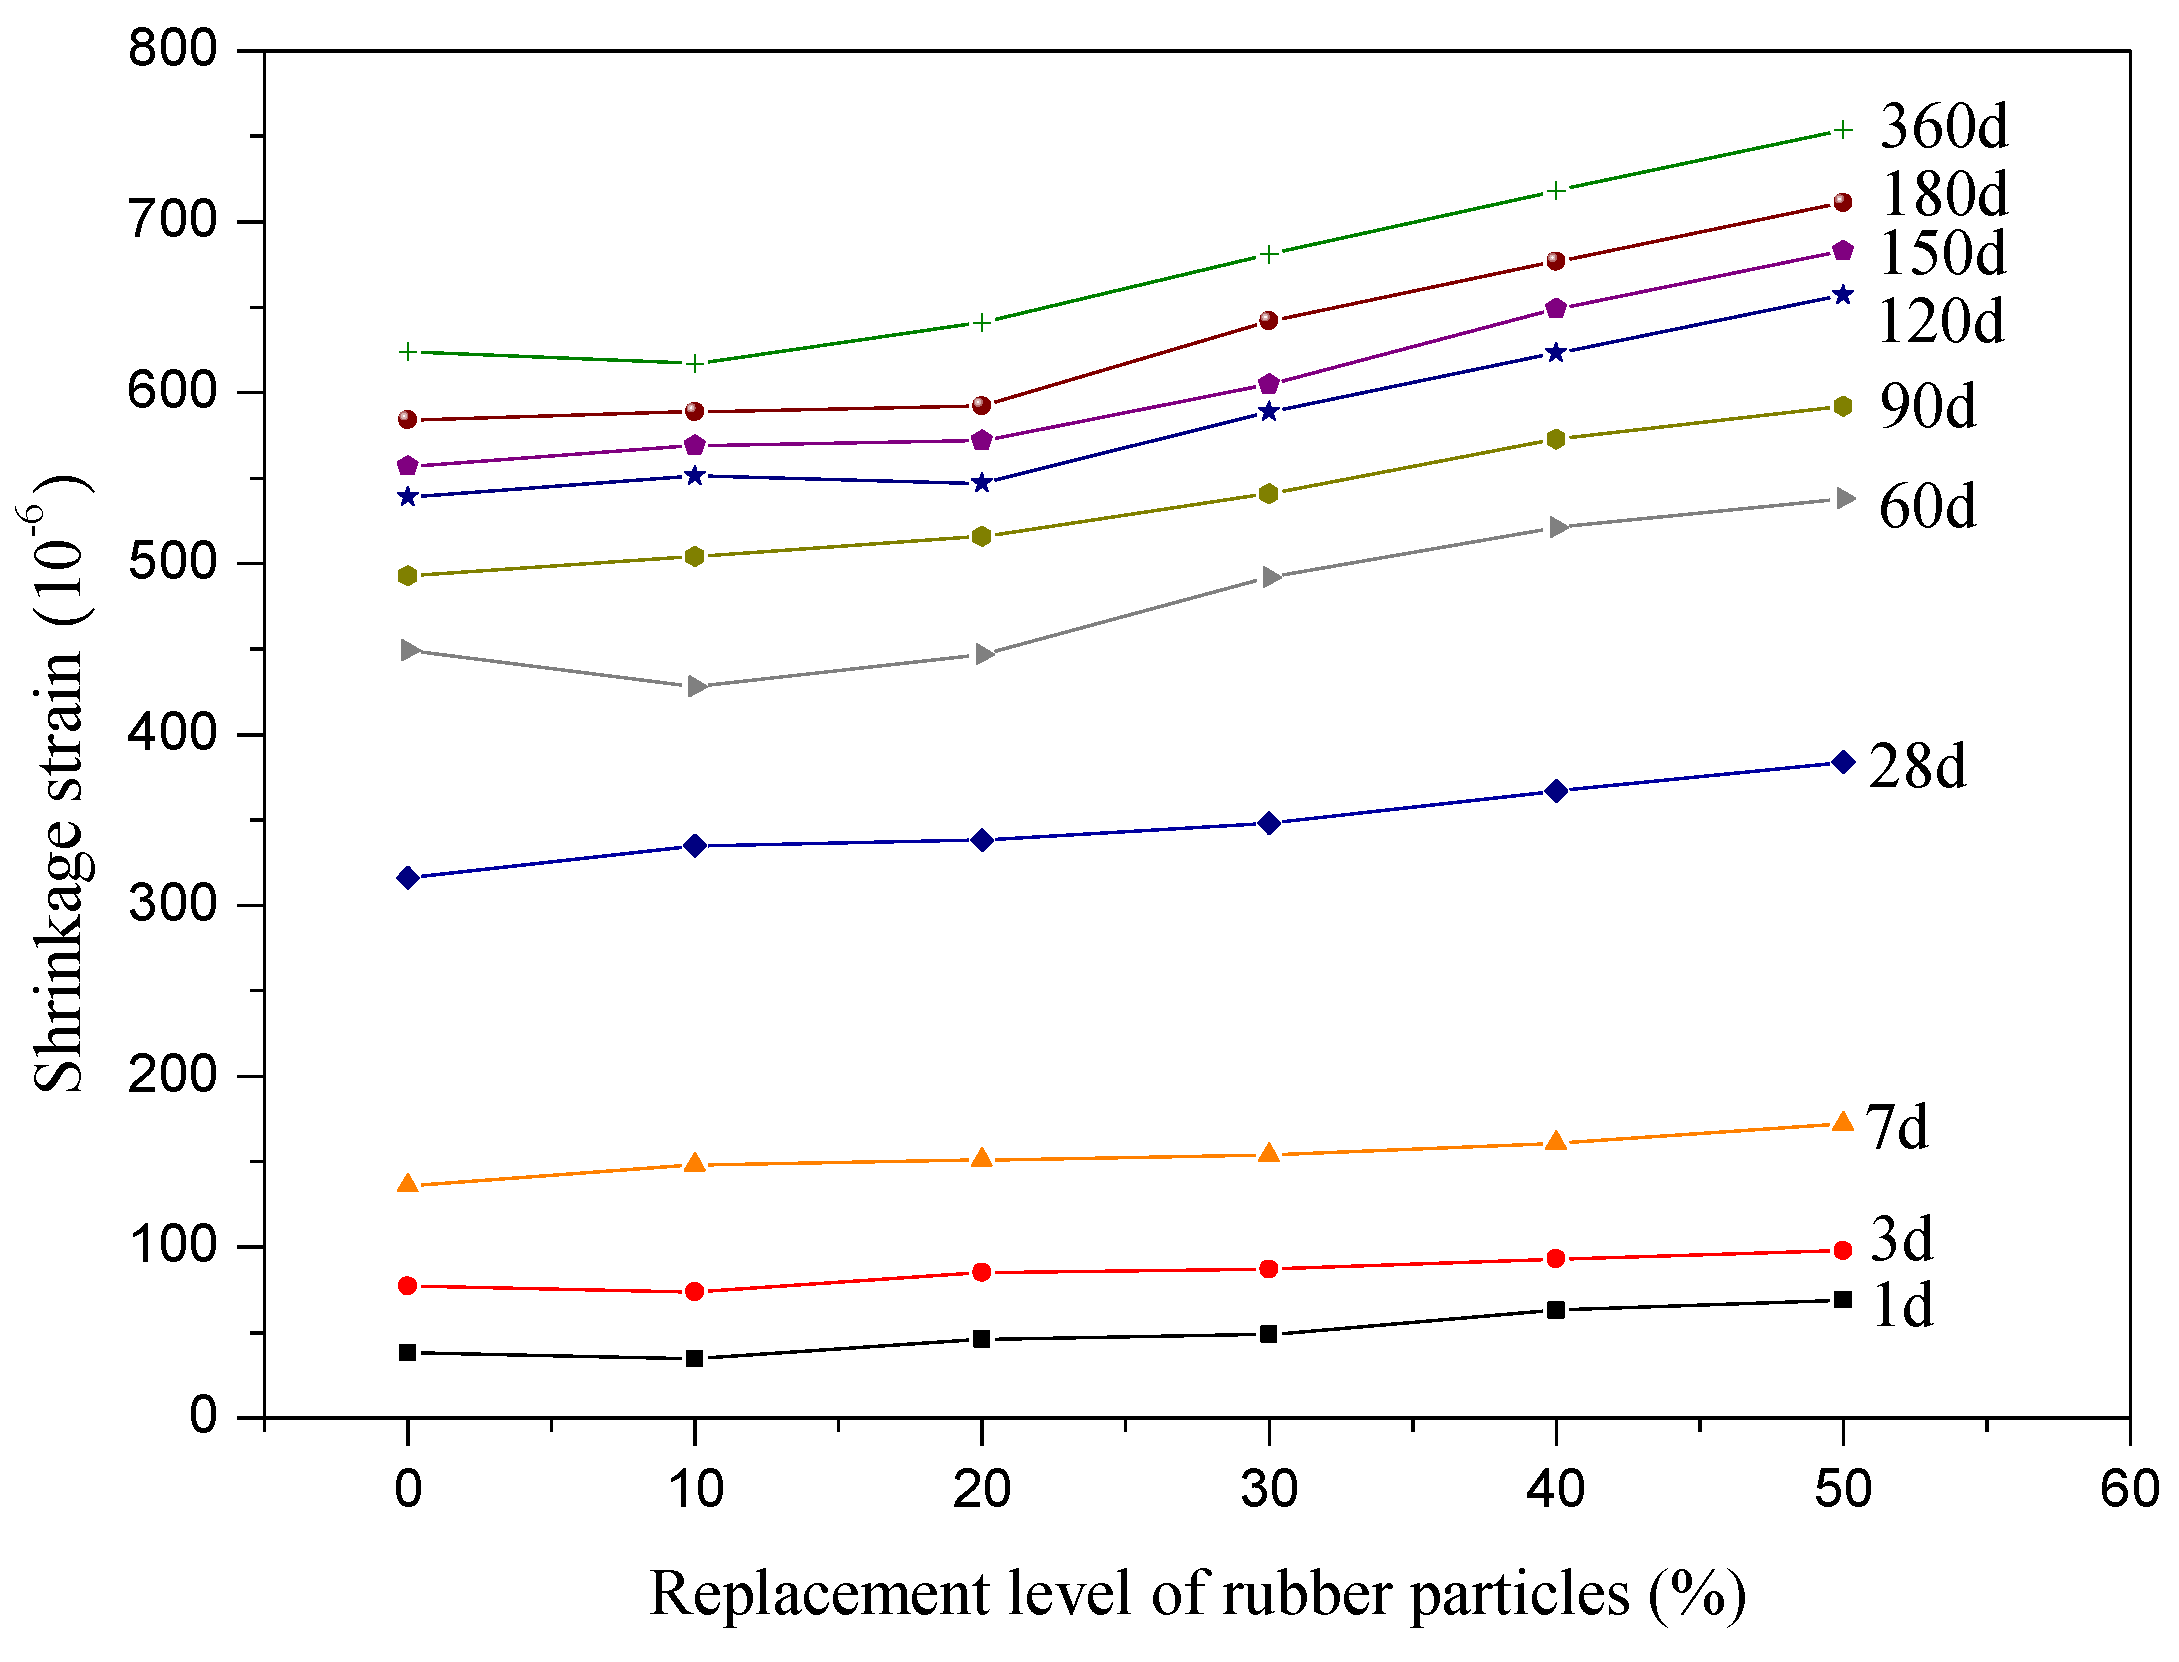
The shrinkage strains of SCRLC increased with an increase of rubber particles substitution percentages. Most increment of shrinkage strain of SCRLC occurred during the age of 3–120 days. Compared with the plain sample, the shrinkage strain of SCRLC increased from 624 × 10−6 to 754 × 10−6 as rubber particles substitution percentage increased from 0% to 50% at an age of 360 days.
(2)
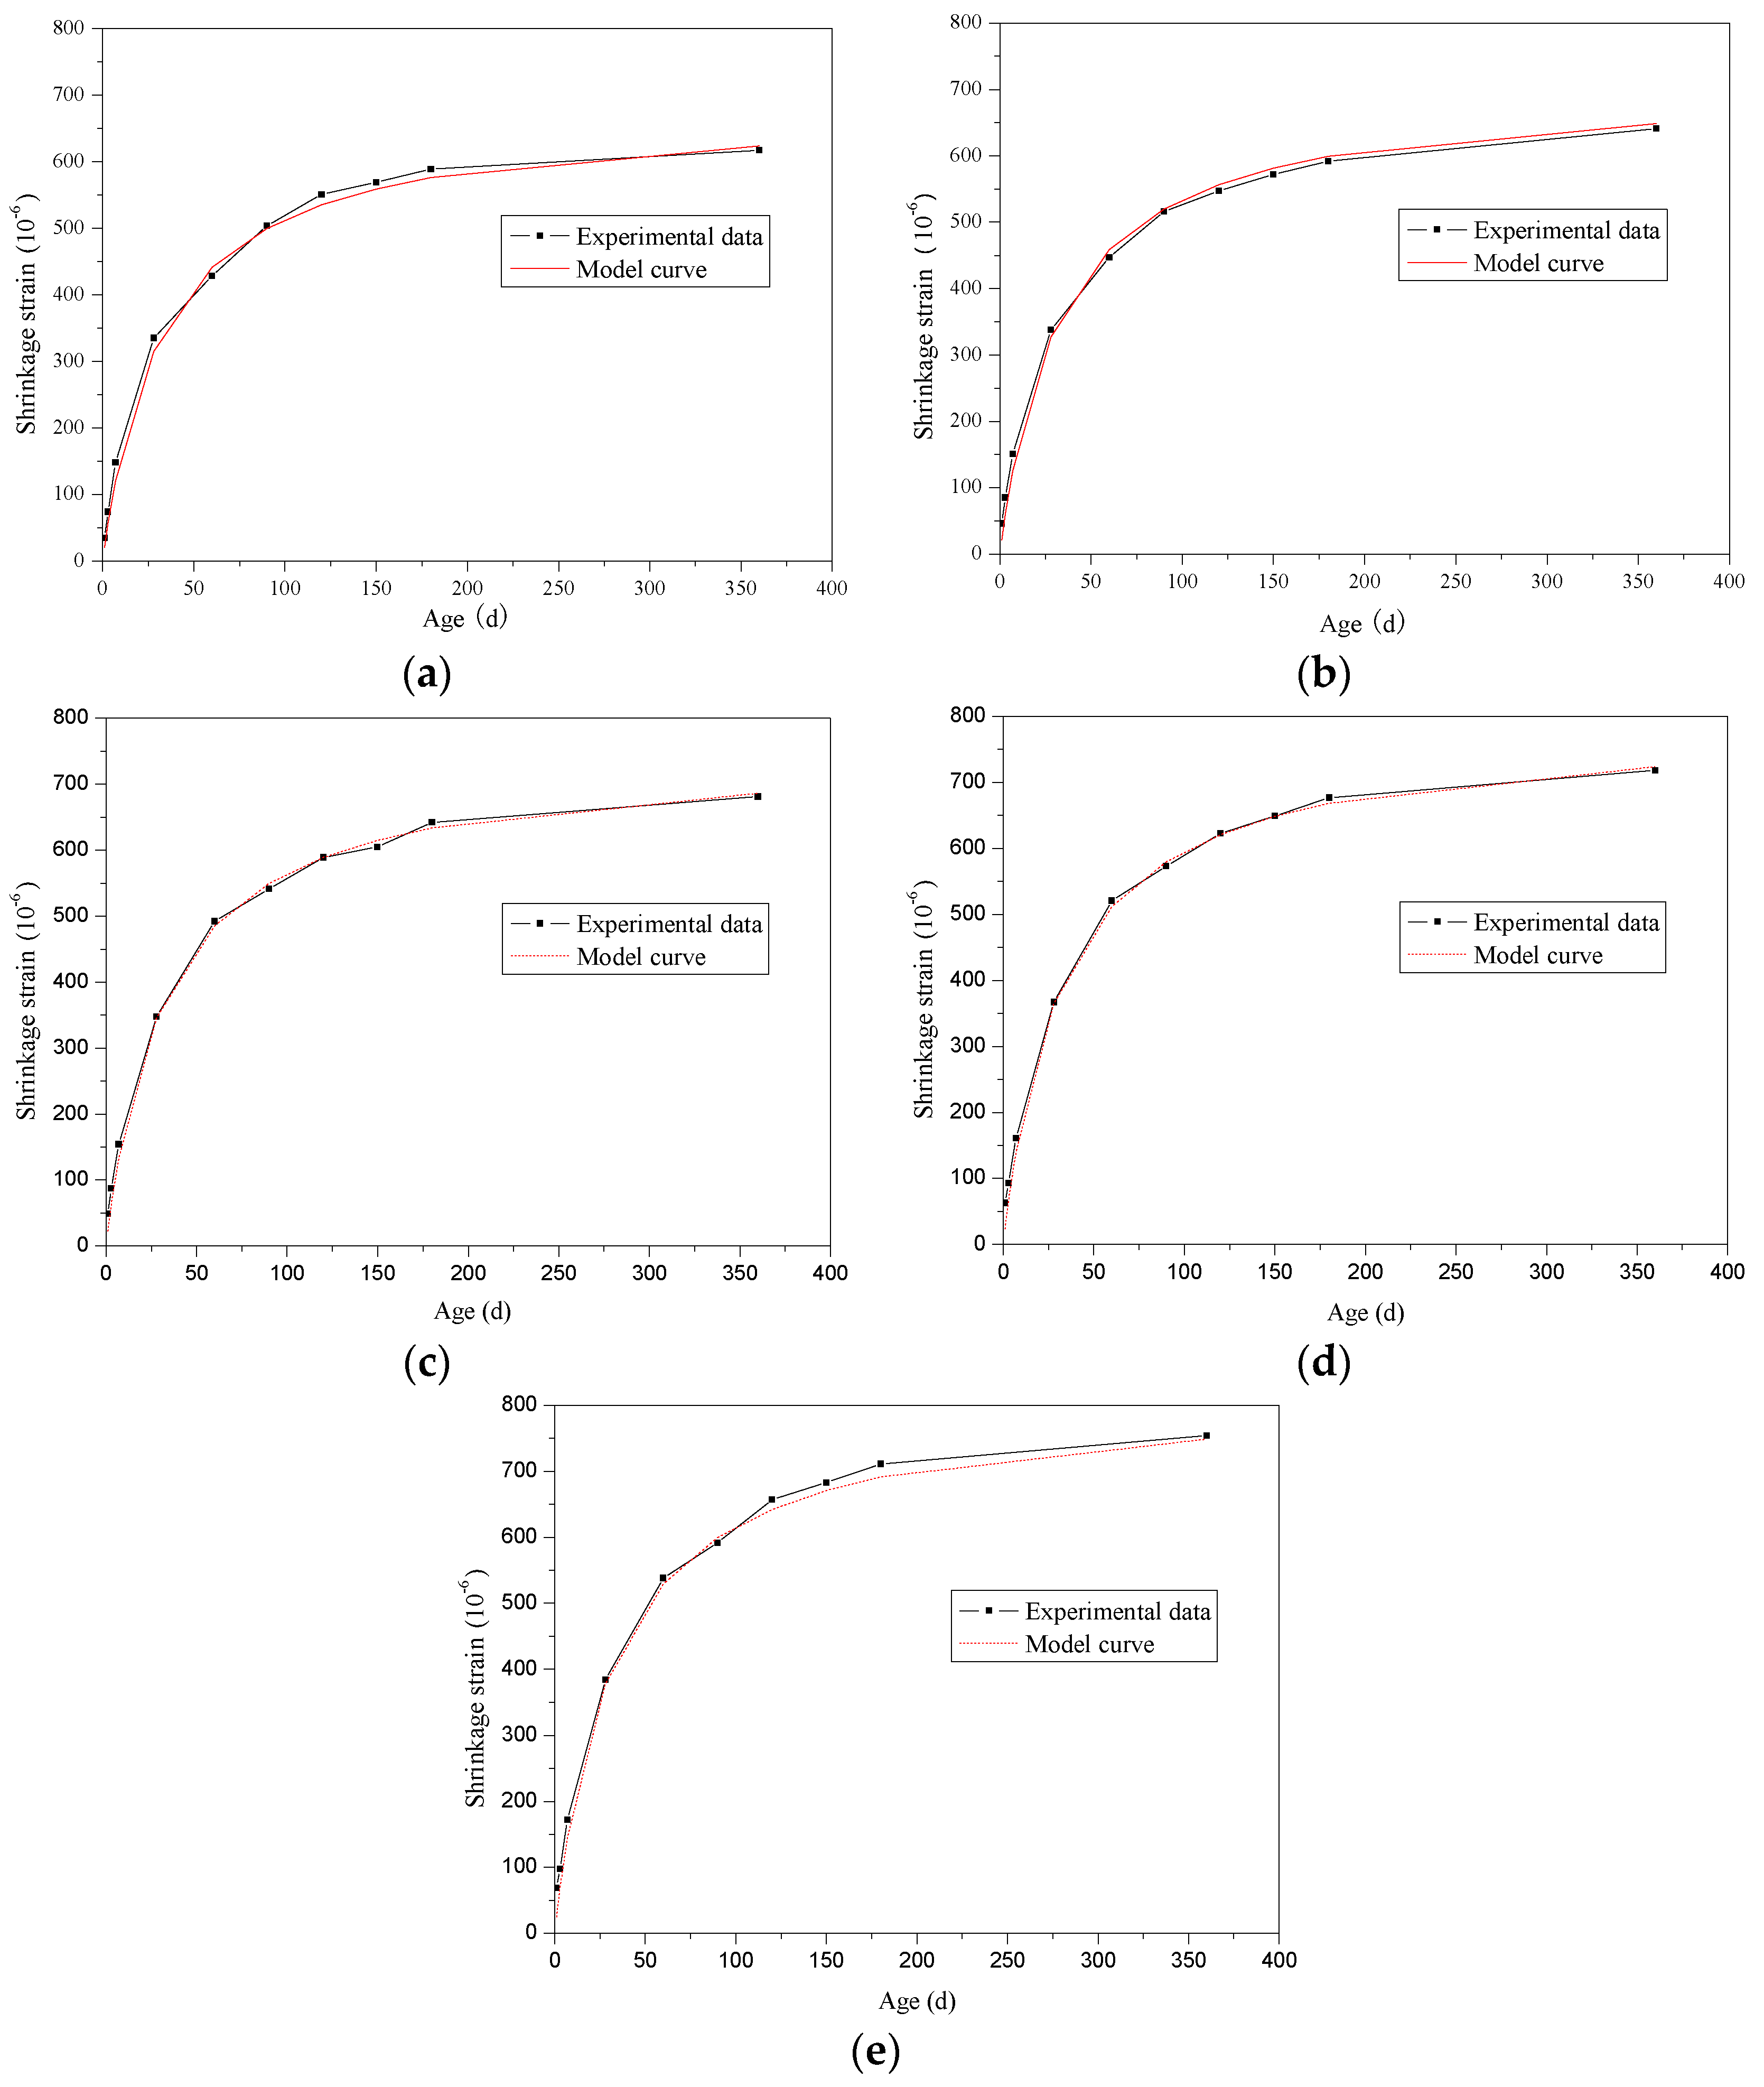
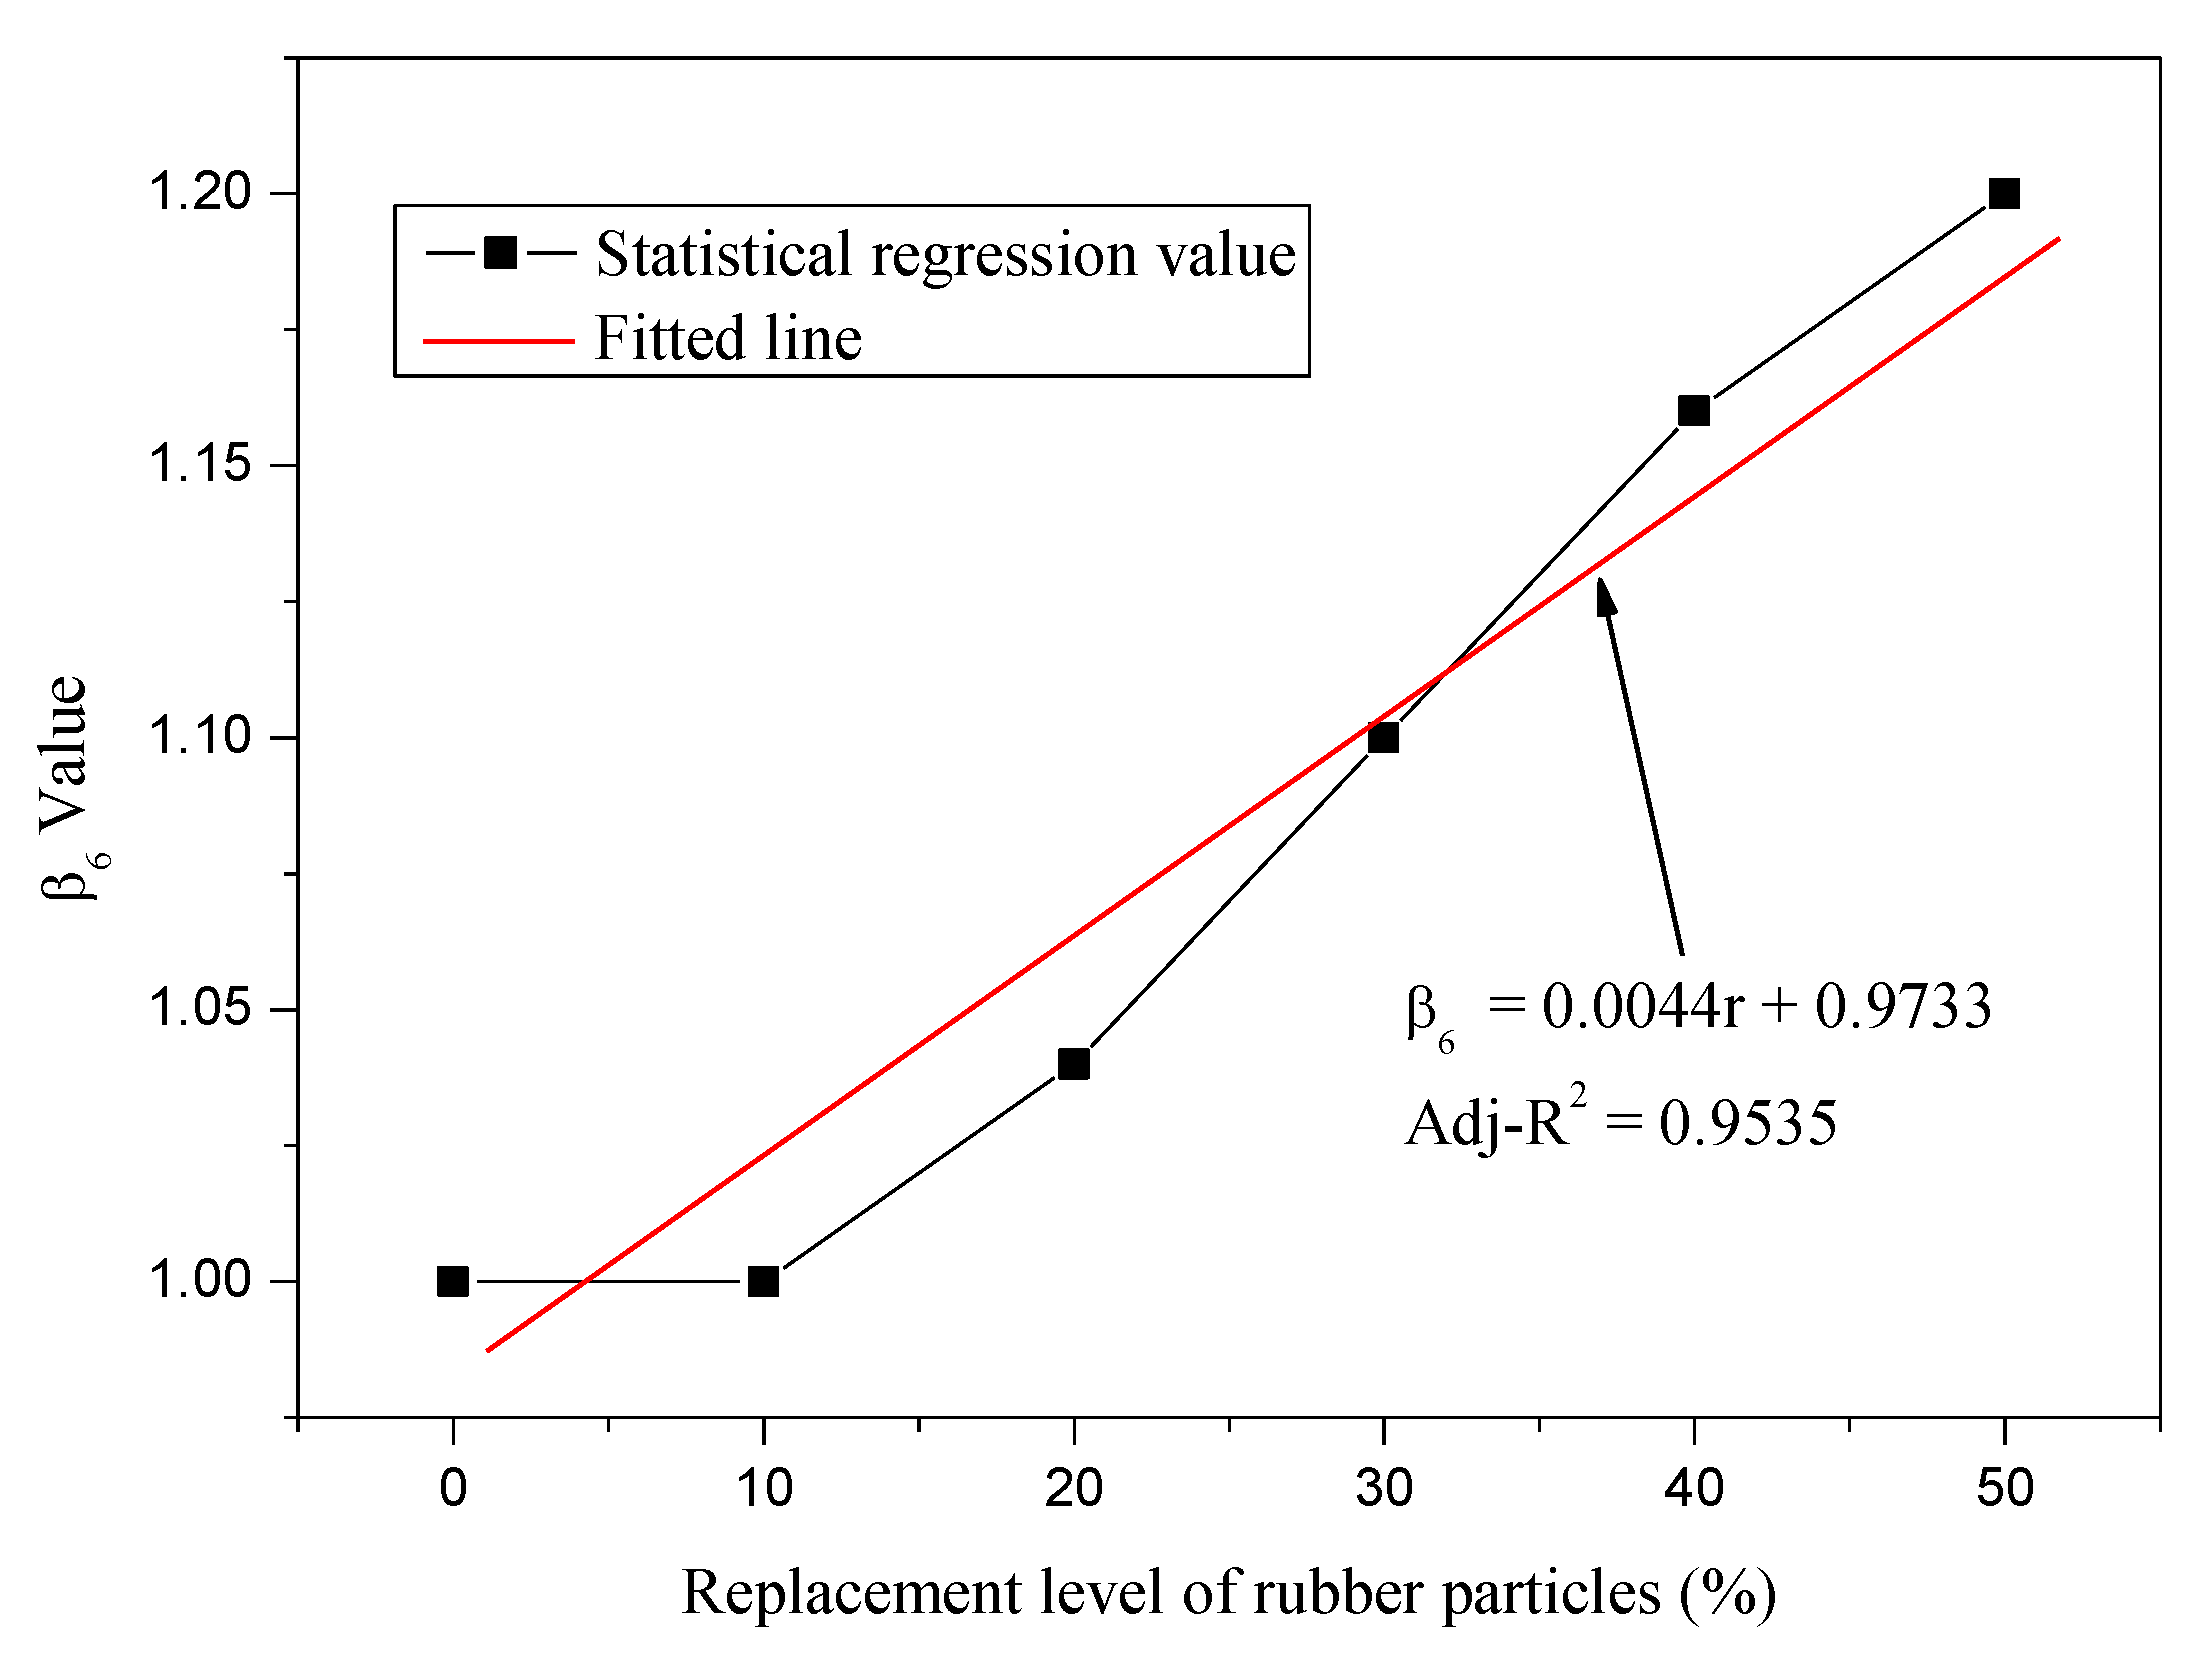
Based on the China Academy of Building Research model, the influence coefficients of rubber particles substitution percentage β6 were introduced and a model was established to depict the shrinkage properties of SCRLC. After statistical regression, the influence coefficients of rubber particles substitution percentage β6 were calculated.
(3)
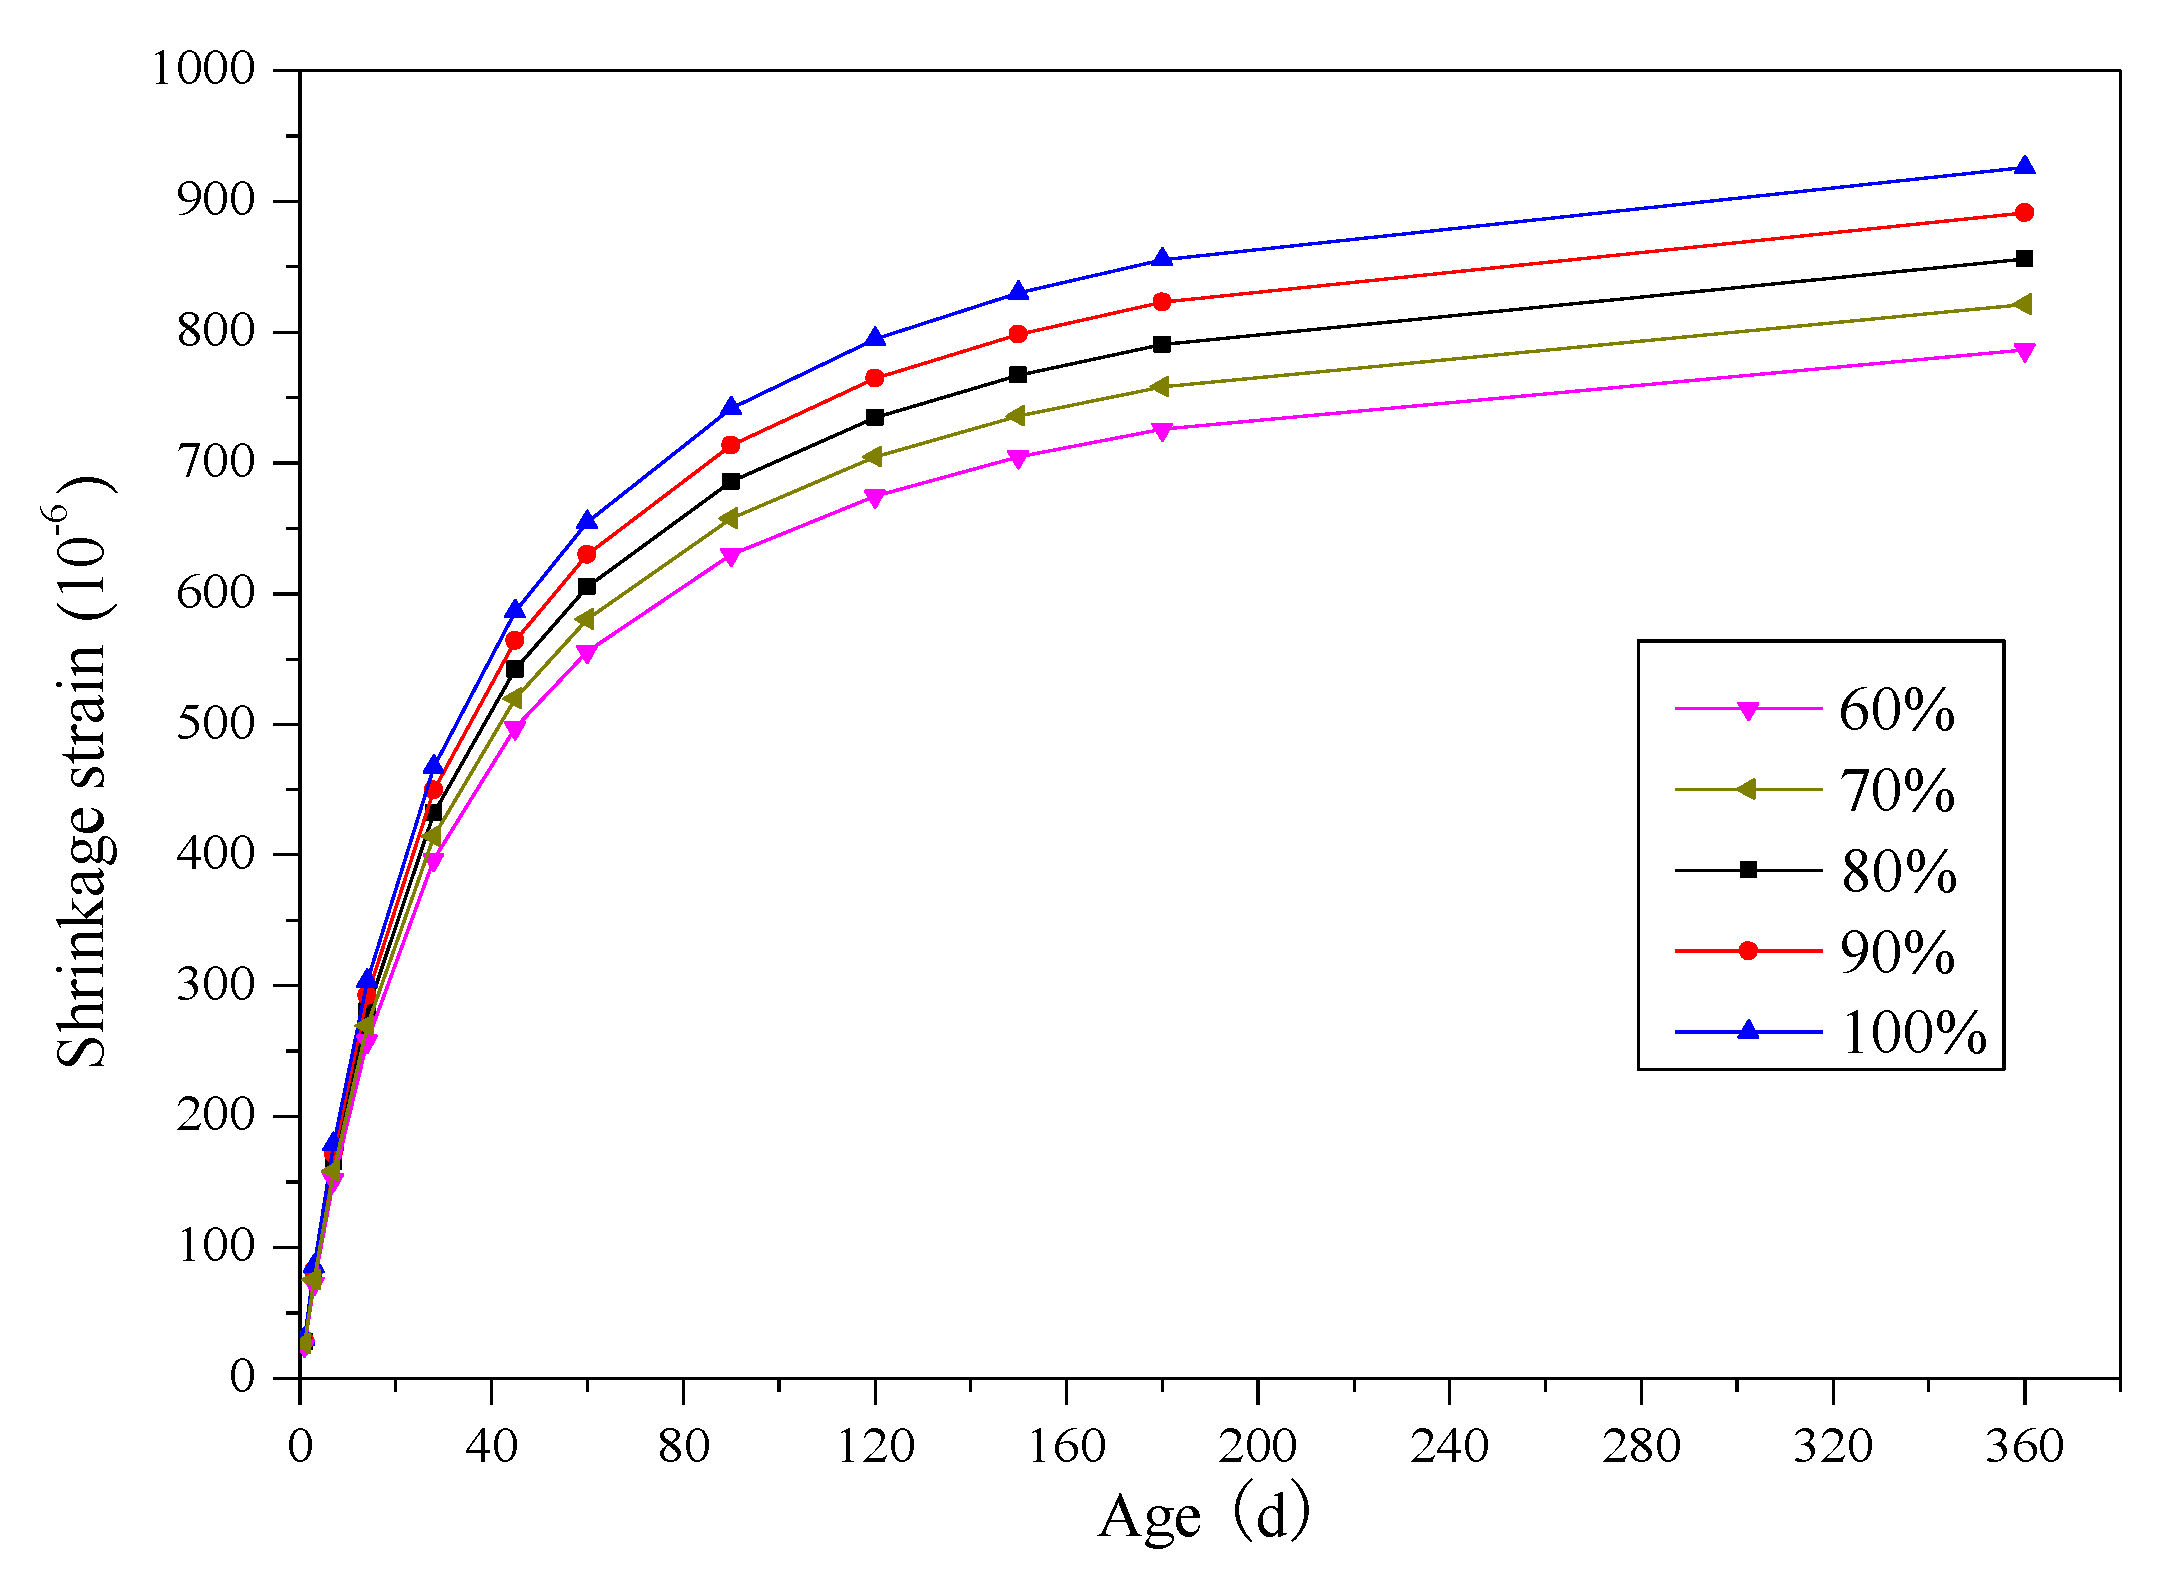
According to the relationship between coefficients of rubber particles substitution percentage and rubber particles substitution percentage, shrinkage strains of SCRLC with rubber particles substitution percentages ranged from 60% to 100% and were predicted by the proposed model. When the rubber particles substitution percentage was larger than 80%, the shrinkage strain of SCRLC at age of 360 days was bigger than 820 × 10−6, which exceeded the limiting value stipulated in JGJ51-2002.

Author Contributions

Investigation, J.L. and T.Z.; Conceptualization, J.L. and T.Z.; Methodology and Formal Analysis, K.L.; Data Curation, K.S.; Writing—Original Draft Preparation, J.L.; Writing—Review and Editing, J.L.

Funding

This research was funded by National Natural Science Foundation of China (Grant No. 51908046), Key Research and Development Program of Shaanxi Province (Grant No. 2019GY-206), China Postdoctoral Science Foundation (Grant No. 2019M653517) and Fundamental Research Funds for the Central Universities (Grant No. 310823172001).

Acknowledgments

The authors would like to acknowledge Zhang Zhongyao for his assistance in experiments and data collection.

Conflicts of Interest

The authors declare no conflict of interest.

References

  1. Ghourchian, S.; Wyrzykowski, M.; Plamondon, M.; Lura, P. On the mechanism of plastic shrinkage cracking in fresh cementitious materials. Cem. Concr. Res. 2019, 155, 251–263. [Google Scholar] [CrossRef]
  2. Abdalhmid, J.M.; Sheehan, A.F.A.T. Long-term drying shrinkage of self-compacting concrete: Experimental and analytical investigations. Constr. Build. Mater. 2019, 202, 825–837. [Google Scholar] [CrossRef] [Green Version]
  3. Merzouki, T.; Bouasker, M.; Khalifa, N.E.H.; Mounanga, P. Contribution to the modeling of hydration and chemical shrinkage of slag-blended cement at early age. Constr. Build. Mater. 2013, 44, 368–380. [Google Scholar] [CrossRef]
  4. Matsushita, F.; Aono, Y.; Shibata, S. Calcium silicate structure and carbonation shrinkage of a tobermorite-based material. Cem. Concr. Res. 2004, 34, 1251–1257. [Google Scholar] [CrossRef]
  5. Gastaldini, A.L.G.; Silva, M.P.; Zamberlan, F.B.; Neto, C.Z.M. Total shrinkage, chloride penetration, and compressive strength of concretes that contain clear-colored rice husk ash. Constr. Build. Mater. 2014, 54, 369–377. [Google Scholar] [CrossRef]
  6. Griza, S.; Ueki, M.M.; Souza, D.H.G.; Cervier, A.; Strohaecker, T.R. Thermally induced strains and total shrinkage of the polymethyl-methacrylate cement in simplified models of total hip arthroplasty. J. Mech. Behav. Biomed. Mater. 2013, 18, 29–36. [Google Scholar] [CrossRef]
  7. Zhan, P.M.; He, Z.H. Application of shrinkage reducing admixture in concrete: A review. Constr. Build. Mater. 2019, 201, 676–690. [Google Scholar] [CrossRef]
  8. Xie, T.; Fang, C.; Ali, M.S.M.; Visintin, P. Characterizations of autogenous and drying shrinkage of ultra-high performance concrete (UHPC): An experimental study. Cem. Concr. Compos. 2018, 91, 156–173. [Google Scholar] [CrossRef]
  9. Samouh, H.; Rozière, E.; Wisniewski, V.; Loukili, A. Consequences of longer sealed curing on drying shrinkage, cracking and carbonation of concrete. Cem. Concr. Res. 2017, 95, 117–131. [Google Scholar] [CrossRef]
  10. Lv, J.; Du, Q.; Zhou, T.H.; He, Z.Q.; Li, K.L. Fresh and Mechanical Properties of self-compacting rubber lightweight aggregate concrete and corresponding mortar. Adv. Mater. Sci. Eng. 2019, 2019, 8372547. [Google Scholar] [CrossRef] [Green Version]
  11. Lv, J.; Zhou, T.H.; Du, Q.; Li, K.L. Experimental and analytical study on uniaxial compressive fatigue behavior of self-compacting rubber lightweight aggregate concrete. Constr. Build. Mater. 2020, 237, 1–13. [Google Scholar] [CrossRef]
  12. Raffoul, S.; Garcia, R.; Pilakoutas, K.; Guadagnini, M.; Medina, N.F. Optimisation of rubberised concrete with high rubber content: An experimental investigation. Constr. Build. Mater. 2016, 124, 391–404. [Google Scholar] [CrossRef]
  13. Thomas, B.S.; Gupta, R.C. A comprehensive review on the applications of waste tire rubber in cement concrete. Renew. Sustain. Energy Rev. 2016, 54, 1323–1333. [Google Scholar] [CrossRef]
  14. Si, R.Z.; Wang, J.Q.; Guo, S.C.; Dai, Q.L.; Han, S. Evaluation of laboratory performance of self-consolidating concrete with recycled tire rubber. J. Clean. Prod. 2018, 180, 823–831. [Google Scholar] [CrossRef]
  15. Medina, N.F.; Medina, D.F.; Hernández-Olivares, F.; Navacerrada, M.A. Mechanical and thermal properties of concrete incorporating rubber and fibres from tyre recycling. Constr. Build. Mater. 2017, 144, 563–573. [Google Scholar] [CrossRef]
  16. Chylík, R.; Fládr, J.; Bílý, P.; Trtík, T.; Vráblík, L. An analysis of the applicability of existing shrinkage prediction models to concretes containing steel fibres or crumb rubber. J. Build. Eng. 2016, 24, 1–12. [Google Scholar] [CrossRef]
  17. Lv, J.; Zhou, T.H.; Du, Q.; Wu, H.H. Effects of rubber particles on mechanical properties of lightweight aggregate concrete. Constr. Build. Mater. 2015, 91, 145–149. [Google Scholar] [CrossRef]
  18. Qin, R.Y.; Hao, H.L.; Rousakis, T.; Lau, D. Effect of shrinkage reducing admixture on new-to-old concrete interface. Compos. Part B Eng. 2019, 165, 346–355. [Google Scholar] [CrossRef]
  19. Hawreen, A.; Bogas, J.A. Creep, shrinkage and mechanical properties of concrete reinforced with different types of carbon nanotubes. Constr. Build. Mater. 2019, 198, 70–81. [Google Scholar] [CrossRef]
  20. Zhang, J.; Wang, J.H.; Ding, X.P. Calculation of shrinkage stress in concrete structures with impact of internal curing. Eng. Fract. Mech. 2018, 192, 54–76. [Google Scholar] [CrossRef]
  21. AI-Saleh, S.A. Comparison of theoretical and experimental shrinkage in concrete. Constr. Build. Mater. 2014, 72, 326–332. [Google Scholar] [CrossRef]
  22. Silva, R.V.; Brito, J.D.; Dhir, R.K. Prediction of the shrinkage behavior of recycled aggregate concrete: A review. Constr. Build. Mater. 2015, 77, 327–339. [Google Scholar] [CrossRef]
  23. Rezvani, M.; Proske, T.; Graubner, C.A. Modelling the drying shrinkage of concrete made with limestone-rich cements. Cem. Concr. Res. 2019, 115, 160–175. [Google Scholar] [CrossRef]
  24. Kiani, B.; Sajedi, S.; Gandomi, A.H.; Huang, Q.D.; Liang, R.Y. Optimal adjustment of ACI formula for shrinkage of concrete containing pozzolans. Constr. Build. Mater. 2017, 131, 485–495. [Google Scholar] [CrossRef]
  25. ACI Committee 209. Prediction of Creep, Shrinkage and Temperature Effects in Concrete Structures; American Concrete Institute: Farmington Hills, MI, USA, 1992. [Google Scholar]
  26. FIB. Model Code for Concrete Structures 2010; International Federation for Structural Concrete (fib): Lausanne, Switzerland, 2013; pp. 92–94. [Google Scholar]
  27. Bazant, Z.P.; Baweja, S. Justification and refinement of model B3 for concrete creep and shrinkage. Mater. Struct. 1995, 28, 488–495. [Google Scholar] [CrossRef]
  28. Gardner, N.J.; Lockman, M.J. Design provisions for drying shrinkage and creep of normal-strength concrete. ACI Mater. J. 2001, 98, 159–167. [Google Scholar]
  29. Yoo, D.Y.; Min, K.H.; Lee, J.H.; Yoon, Y.S. Autogenous shrinkage of concrete with design strength 60–120 N/mm2. Mag. Concr. Res. 2011, 63, 751–761. [Google Scholar] [CrossRef]
  30. Zhang, K.; Cao, G.H.; Hu, J.X. Experimental study on influence of reinforcement on long-term shrinkage strain of concrete. J. Highway Transp. Res. Dev. 2014, 31, 78–81, 147. (in Chinese). [Google Scholar]
  31. Lee, K.H.; Yang, K.H.; Yoon, H.S. Shrinkage strains of lightweight aggregate concrete using expanded bottom ash and dredged soil granules. Constr. Build. Mater. 2018, 188, 934–945. [Google Scholar] [CrossRef]
  32. Wang, X.F.; Fang, C.; Kuang, W.Q.; Li, D.W.; Han, N.X.; Xing, F. Experimental investigation on the compressive strength and shrinkage of concrete with pre-wetted lightweight aggregates. Constr. Build. Mater. 2017, 155, 867–879. [Google Scholar] [CrossRef]
  33. GB/T 50082-2009. Standard for Test Methods of Long-Term Performance and Durability of Ordinary Concrete; China National Standard: Beijing, China, 2009. [Google Scholar]
  34. JGJ51-2002. Technical Specification for Lightweight Aggregate Concrete; China Professional Standard: Beijing, China, 2002. [Google Scholar]
  35. Demir, İ.; Sevim, Ö.; Tekin, E. The effects of shrinkage-reducing admixtures used in self-compacting concrete on its strength and durability. Constr. Build. Mater. 2018, 172, 153–165. [Google Scholar] [CrossRef]
Figure 1. Grading curves of sand, rubber particles and crushed shale ceramsite.
Materials 12 04059 g001
Figure 2. Shrinkage test.
Materials 12 04059 g002
Figure 3. The shrinkage strains of SCRLC versus rubber particles substitution percentages.
Materials 12 04059 g003
Figure 4. Comparison of shrinkage strain of SCLC between experiment and prediction.
Materials 12 04059 g004
Figure 5. Comparison of fitting curve and experimental curve for basic equation of shrinkage of SCLC.
Materials 12 04059 g005
Figure 6. Comparison of shrinkage strains of SCRLC obtained from experiment and fitting: (a) SCRLC10; (b) SCRLC20; (c) SCRLC30; (d) SCRLC40; (e) SCRLC50.
Materials 12 04059 g006
Figure 7. Relationship between β6 and r.
Materials 12 04059 g007
Figure 8. Mean shrinkage strain of SCRLC obtained from predictive model.
Materials 12 04059 g008
Table 1. Mix proportions for concrete.
Type of ConcreteReplacement (by Volume)Weight per Cubic Meter (kg/m3)
CementFly AshRubber ParticlesSandShale CeramsiteThickenerWater ReducerWater
SCLC04258507006100.2045.1179
SCRLC1010%42585316306100.2045.1179
SCRLC2020%42585625606100.2045.1179
SCRLC3030%42585934906100.2045.1179
SCRLC4040%425851244206100.2045.1179
SCRLC5050%425851553506100.2045.1179
Table 2. Chemical compositions and physical properties of ordinary Portland cement and fly ash.
Chemical Analysis (%)Ordinary Portland CementFly Ash
CaO62.455.31
SiO220.1848.92
Al2O34.9126.27
Fe2O33.885.86
MgO2.670.84
SO32.141.21
K2O0.470.79
Na2O0.290.22
Loss on ignition2.053.60
Specific gravity3.162.21
Fineness (m2/kg)331275
Table 3. Mean and standard deviation of shrinkage strains of SCRLC.
Type of ConcreteParameterAges (d)
137286090120150180360
SCLCMean value (10−6)3877136316449493539557584624
Standard deviation3.67.94.47.27.512.220.021.913.99.2
SCRLC10Mean value (10−6)3574148335428504551569589617
Standard deviation5.77.016.19.620.721.016.711.111.518.5
SCRLC20Mean value (10−6)4685151338447516547572592641
Standard deviation7.05.612.116.513.118.54.618.416.512.1
SCRLC30Mean value (10−6)4987154348492541589605642681
Standard deviation5.67.27.215.913.59.64.617.18.215.7
SCRLC40Mean value (10−6)6393161367521573623649677718
Standard deviation4.44.511.514.514.07.913.28.714.515.1
SCRLC50Mean value (10−6)6998172384538592657683711754
Standard deviation5.64.07.813.18.78.217.717.123.524.1
Table 4. Influence coefficient of rubber particles substitution percentage.
Influence FactorRubber Particles Substitution Percentage (%)SymbolInfluence Coefficients
Rubber Particles Substituted Sand0β61.00
101.00
201.04
301.10
401.16
501.20

