Article

Linear Tuning of Phase-Matching Temperature in LiNbO3:Zr Crystals by MgO Co-Doping

1
School of Sciences, Henan University of Technology, Zhengzhou 450001, China
2
MOE Key Laboratory of Weak-Light Nonlinear Photonics, School of Physics and TEDA Institute of Applied Physics, Nankai University, Tianjin 300071, China
*
Authors to whom correspondence should be addressed.
Materials 2019, 12(24), 4155; https://doi.org/10.3390/ma12244155
Submission received: 6 November 2019 / Revised: 5 December 2019 / Accepted: 9 December 2019 / Published: 11 December 2019
(This article belongs to the Special Issue Photonic Materials and Devices)

Abstract

:
We grew a series of co-doped LiNbO3 crystals with fixed 1.5 mol % ZrO2 and various MgO concentrations (1.0, 3.0, 4.0, 6.0 mol %), and investigated their optical properties and defect structures. By 3.0 mol % MgO co-doping, the optical damage resistance at 532 nm reached 6.5 × 10⁶ W/cm2, while the phase-matching temperature for doubling 1064 nm was only 29.3 °C—close to room temperature—which was conducive to realizing the 90° phase matching at room temperature by slightly modulating the incident angle of the fundamental beam. Notably, we found that the phase-matching temperature increased linearly with the increase of MgO doping, and this linear dependence helped us to grow the high-quality crystal for room temperature 90° phase matching. Moreover, the defect analysis indicated that the linear tuning of phase-matching temperature might be attributed to Mg Li + + Zr Nb neutral pairs in crystals.

1. Introduction

Lithium niobate (LiNbO3, LN) is a well-known nonlinear optical material for frequency conversion applications, due to its large nonlinearity and capacity for noncritical phase matching in a variety of interactions in the visible and near-infrared [1,2]. However, the practical use of LN (e.g., as a harmonic generator) is severely limited by optical damage at high light intensities [3]. Recently, some studies have shown that LN co-doping with some impurities, such as Mg2+, Zn2+, In3+, and Zr4+, can substantially reduce the optical damage in the visible region above a certain threshold value [4,5,6,7,8]. Among these optical-damage-resistant additives, Mg2+ is the most commonly used dopant in LN at this time, and MgO-doped LN (MgLN) heavily promotes the practical applications in high-power frequency conversion [9,10,11]. However, MgLN must be heated to a temperature of ~110 °C to achieve efficient phase matching with the help of a temperature-controlled oven, unavoidably increasing the additional energy losses and the components’ instability [12,13].
Recently, we reported that the 1.7 mol % ZrO2 and 5.0 mol % MgO co-doped LN crystal not only realizes efficient room temperature 90° phase matching for doubling 1064 nm, but also exhibits high optical damage resistance at 532 nm [14]. Here, there are two reasons why we select Zr4+ and Mg2+ ions as double-doping candidates in LN. First, Mg2+ is widely used as a primary additive co-doping with other dopants in LN to precisely regulate optical properties and defect structures, such as LN:Mg,Bi [15] and LN:Mg,Zn [16]. These reports provided us with ideas to lower the phase-matching temperature while maintaining the optical damage resistance in LN. Second, Zr4+ ions in LN have a low doping threshold level and a distribution coefficient close to one; meanwhile, ZrO2-doped LN has excellent optical damage resistance properties, from ultraviolet to visible range [17,18]. However, it must be pointed out that the total doping concentration of ZrO2 and MgO in the melt for our double-doped LN is so high that it is bad for the growth of the high-quality crystal. Moreover, the specific roles of Zr4+ and Mg2+ in this co-doped crystal are still not clear. Therefore, exploring the more preferable doping concentration of ZrO2 and MgO in LN, to achieve the room temperature 90° phase matching for doubling 1064 nm, is worthy of further investigation. Furthermore, it is highly necessary to clearly understand the substitution process of Zr4+ and Mg2+ ions in LN for purposefully regulating the crystal properties.
In this work, we grew a series of LiNbO3 crystals by the conventional Czochralski method, co-doped with a fixed 1.5 mol % ZrO2 and various MgO concentrations, and investigated their optical damage resistance and phase-matching temperatures. At the same time, the UV-visible absorption spectra and the OH absorption spectra were employed to explore the defective structures of crystals.

2. Materials and Methods

All of the investigated crystals were pulled from a congruent melt to which ZrO2 and MgO were added by the conventional Czochralski method. The congruent composition Li/Nb was selected as 48.38/51.62. The concentration of ZrO2 was fixed as 1.5 mol % while the MgO concentrations were 1.0, 3.0, 4.0, and 6.0 mol %, respectively, labeled as LN:Zr,Mg1.0, LN:Zr,Mg3.0, LN:Zr,Mg4.0, and LN:Zr,Mg6.0. The as-grown crystals in the furnace at 1200 °C were annealed for 10 h and polarized under the density of 5 mA/cm2 for 1 h. After annealing treatment and polarization, crystal sheets that were 1.0 and 3.0 mm thick along the Y faces were prepared for the characterization of absorption spectra and optical damage resistance, respectively. The uniform and transparent crystals were also cut into cubes of 10 × 10 × 10 mm3, perpendicular to the crystal Y-axis for 90° phase matching. The direction of the C-axis was determined by the pyroelectric effect. For comparison, normally congruent pure and 2.0 mol % ZrO2-doped LiNbO3 crystals were grown under the same conditions, labeled as CLN and LN:Zr2.0, respectively. All samples were polished to optical grade. Here, no inclusions in the polished sheets were visible to the naked eye, and yet the slight growth stripes still existed as examined by a vertically polarized 671 nm laser.
The laser beam distortion experiment was employed to test the optical damage resistance. An e-polarized 532 nm laser irradiated the 3.0 mm thick Y-plates for 5 min. The laser beam was polarized parallel to the C-axis of the plates. Optical damage was induced by a transmitted light beam becoming smeared and elongated along the C-axis and by a decrease of the intensity of its central part. Then we also used the two-wave coupling method to measure the change of refractive index of the 3.0 mm crystal sheets, to quantitatively characterize the optical damage resistance. Two e-polarized coherent beams at 532 nm with equal intensities 400 mW/cm2 were intersected in the samples, with a crossing angle of cry, 30° in the air. The grating vector was aligned along the C-axis of the samples to utilize the largest electro-optic coefficient r33. The diffraction efficiency η of the phase grating was given by the equation η = s i n 2 ( π d Δ n / λ c o s θ c r y ) [19], where η is the diffraction efficiency, λ is the laser wavelength, d is the thickness of the crystal, and θ c r y is the intersecting half-angle of the two coherent beams outside the crystal. The change of the refractive index Δn could be calculated from the aforementioned equation by experimentally measuring the diffraction efficiency.
The temperature for 90° phase-matched second-harmonic generation (SHG) was measured by using a 1064 nm Q-switched Nd:YAG pulse laser (Guangan laser, Hefei, China) with 1 Hz repetition rate and 8 ns pulse width. The laser facula diameter was 5.0 mm, and the pulse energy was 320 mJ. The fundamental frequency light was aligned with the crystal’s Y-axis, while its polarization direction was perpendicular to the crystal’s C-axis. The second-harmonic energy was detected by the pulse laser energy meter. The bulk sample was mounted in an oven thermally controlled to within ±0.2 °C. The distance between the entrance window and the exit window of the oven was at least 5.0 cm to minimize the possible temperature gradients along the crystal Y-axis. The temperature was measured with a Pt-100 thermistor placed in direct contact with the crystal. The equation for the SHG efficiency was η = E2/E1, with E1 and E2 as the fundamental energy and the second-harmonic energy, respectively.
In addition, to explore the micro-mechanism between the defective structures and the optical properties of the crystals, the UV-visible absorption spectra and OH absorption spectra were measured using a U-4100 spectrophotometer (Hitachi, Tokyo, Japan) and a Magna-560 Fourier transform infrared spectrophotometer (Nicolet, MMAS) respectively, with incident light transmitting 1.0 mm thick plates along the Y-axis at room temperature. The step-length of the UV-visible spectrometer was 1.0 nm, and the resolution of the infrared spectrophotometer was 4.0 cm−1.

3. Results and Discussion

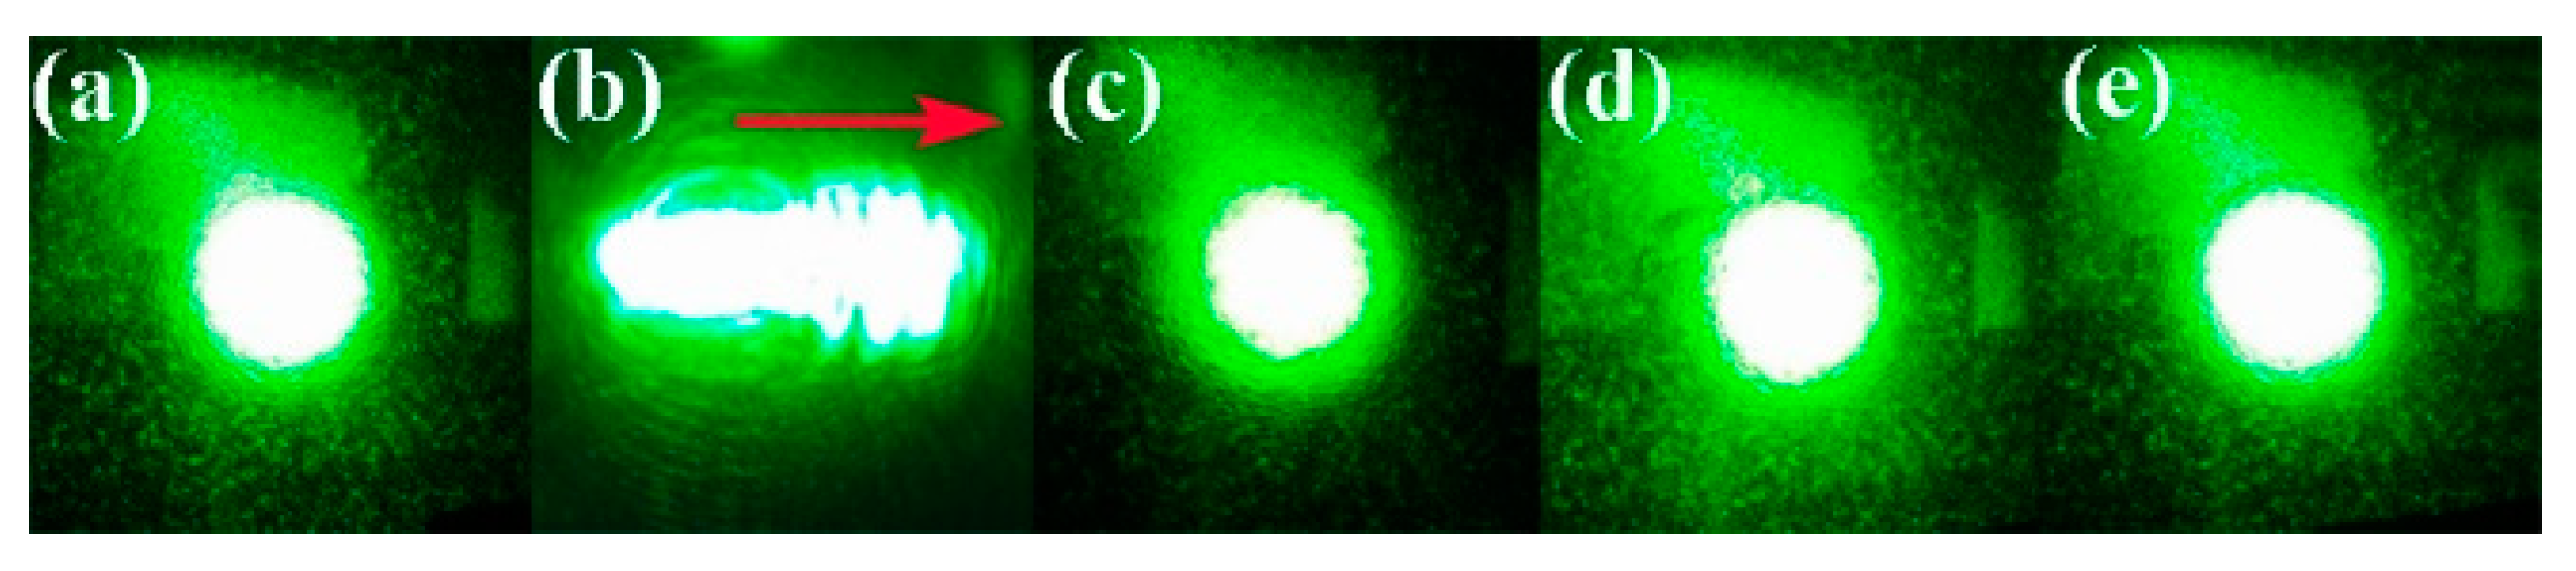
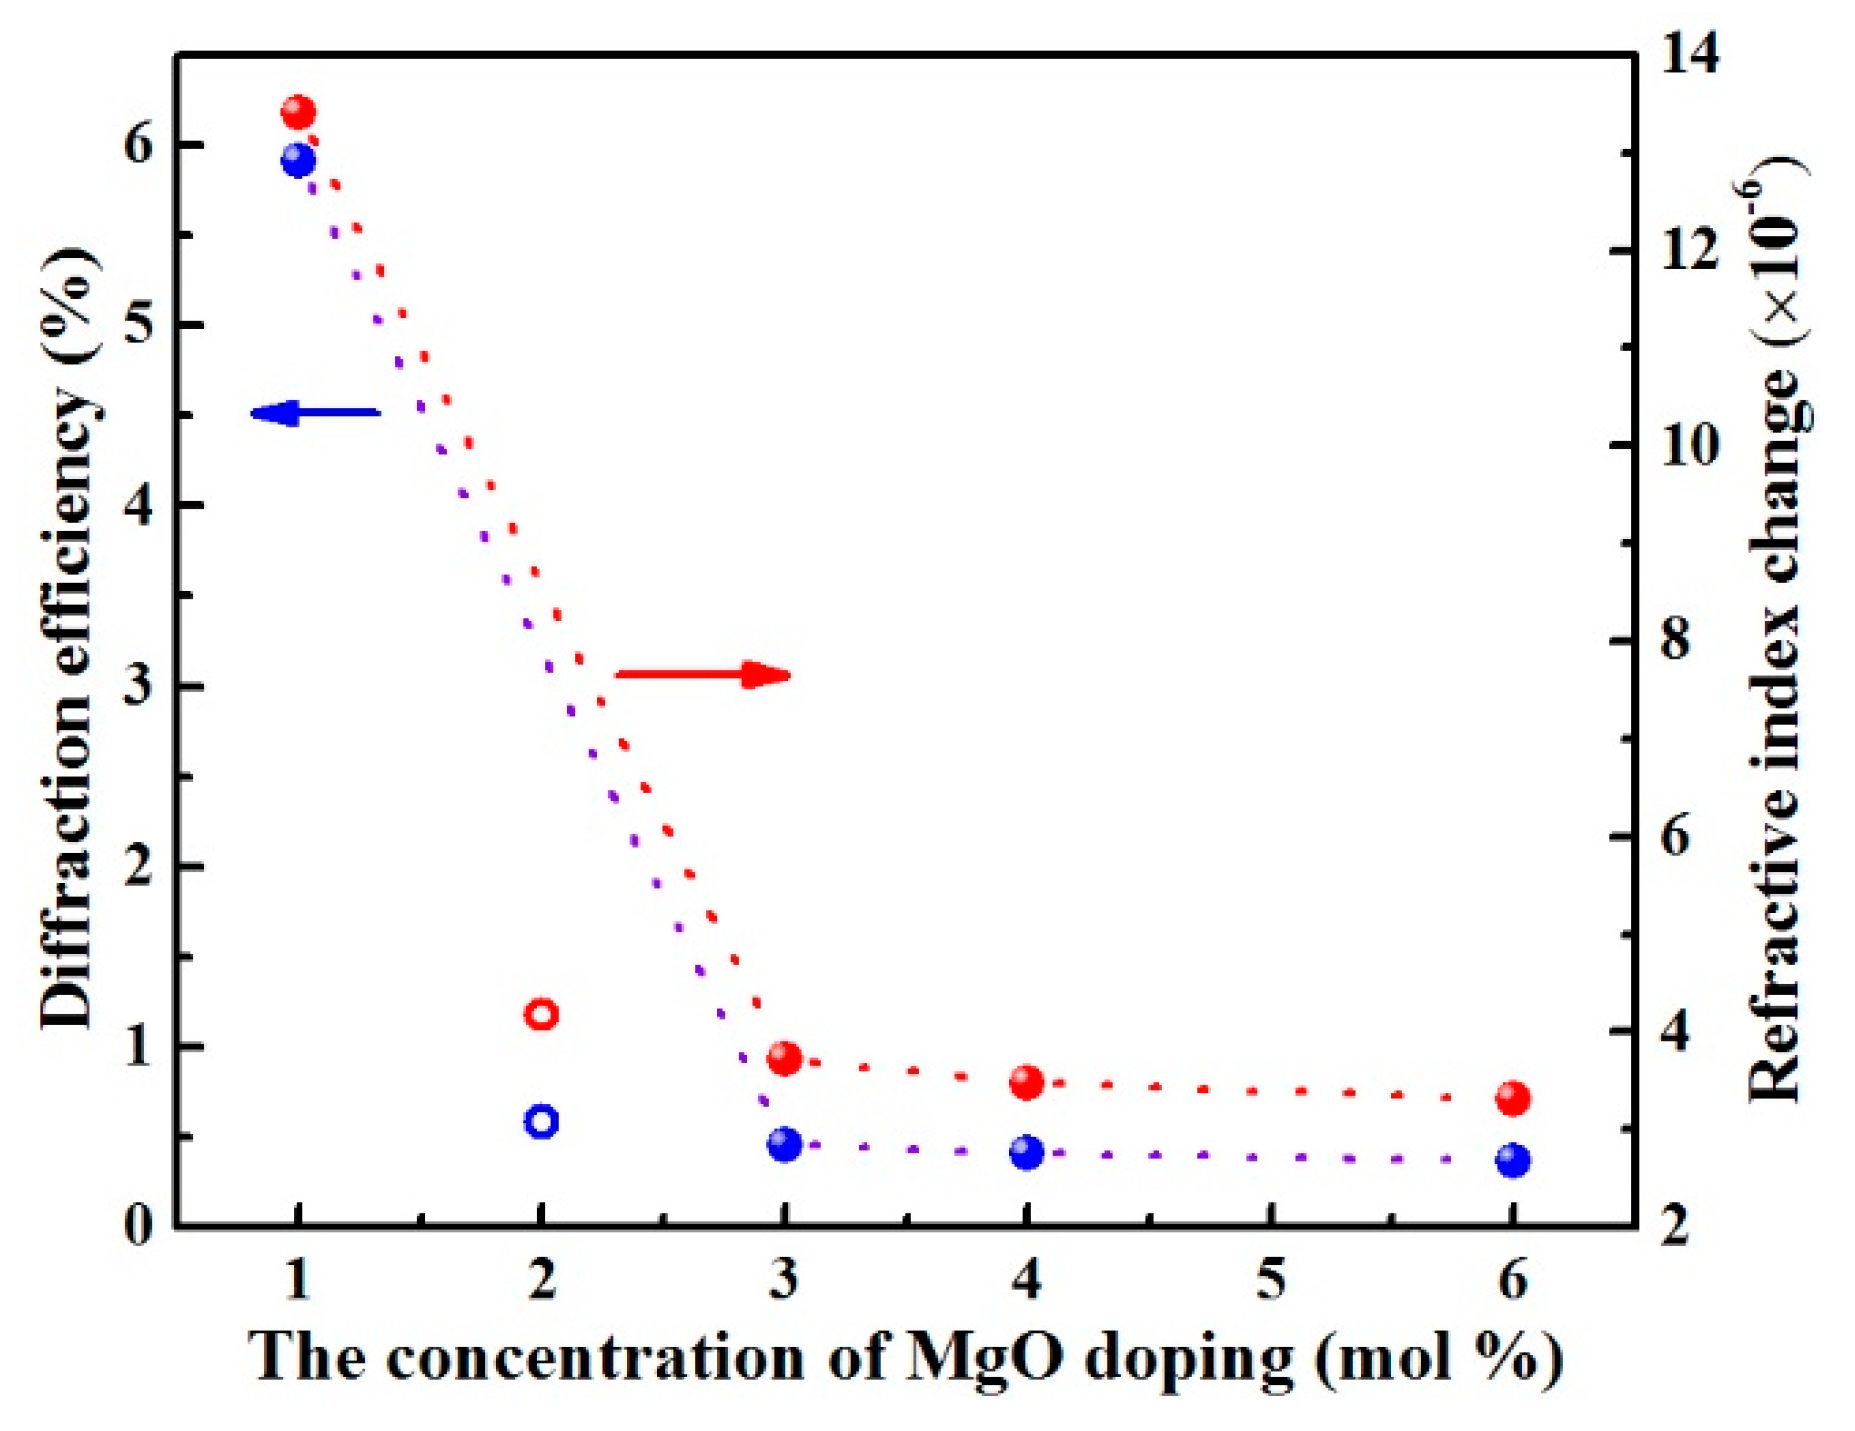
3.1. Optical Damage Resistance

Figure 1 shows the transmitted beam spots for the different samples after 5 min irradiation. For LN:Zr,Mg1.0 (Figure 1b), the transmitted light spot obviously diffuses along the C-axis of the crystal under an intensity of 5.9 × 10³ W/cm2. As the MgO doping concentration increases to 6.0 mol %, the beam distortions of LN:Zr,Mg3.0 (Figure 1c), LN:Zr,Mg4.0 (Figure 1d), and LN:Zr,Mg6.0 (Figure 1e) decrease significantly, and these crystals can withstand the highest intensity of 6.5 × 10⁶ W/cm2 in our lab without noticeable beam smearing. Moreover, the conventional high optical damage resistant LN:Zr2.0 (Figure 1a) under the same conditions can also withstand a light intensity of 6.5 × 10⁶ W/cm2 without spot distortion.
The dependence of saturated diffraction efficiency η on the MgO doping concentration in LN:Zr,Mg is depicted in Figure 2. We can see that the saturated diffraction efficiency decreases with increased MgO doping concentration. LN:Zr,Mg1.0 has a saturated diffraction efficiency of 5.91%, and it abruptly decreases to 0.22% in LN:Zr,Mg6.0. Figure 2 clearly shows the relationship between the refractive index change Δn and the MgO doping concentration. For comparison, under the same conditions the calculated saturated refractive index change Δn of LN:Zr2.0 is 4.17 × 10⁻⁶. It can be seen from the figure that the refractive index Δn of LN:Zr,Mg3.0, LN:Zr,Mg4.0, and LN:Zr,Mg6.0 are distinctly less than that of LN:Zr2.0, implying that the optical damage resistance of the former is even higher. We can derive from these data that MgO doping further reduces the refractive index change of crystals, while its effect is similar to that of the single optical damage resistant dopant. In addition, note that the 3.0 mol % MgO and 1.5 mol % ZrO2 co-doped LiNbO3 has almost the same optical damage resistance as the previously reported 5.0 mol % MgO and 1.7 mol % ZrO2 co-doped LiNbO3 [14].

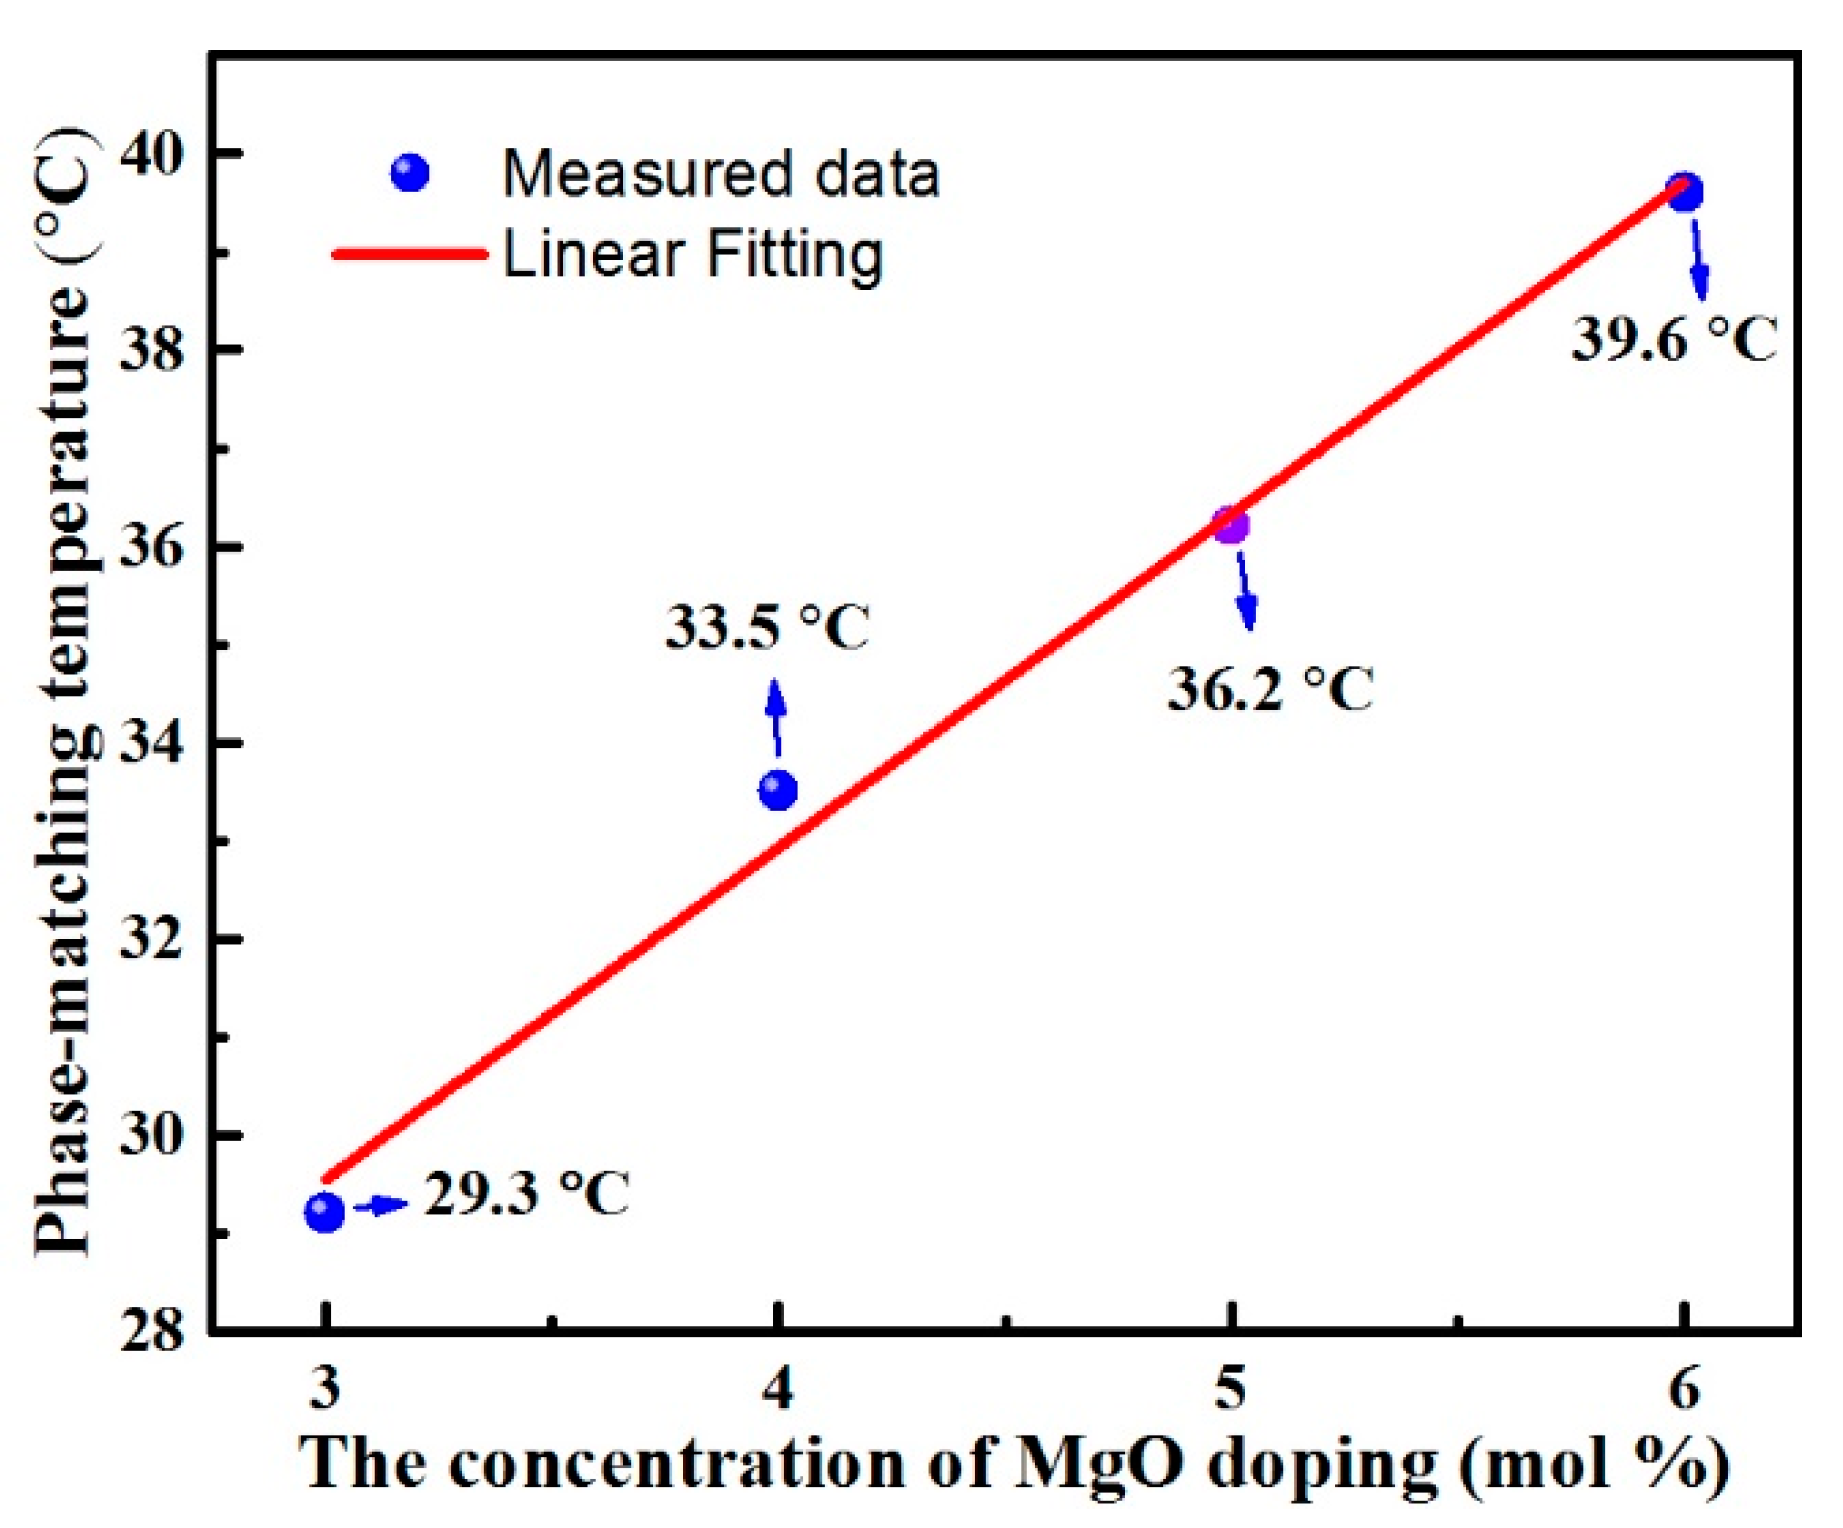
3.2. The Temperature for 90° Phase Matching
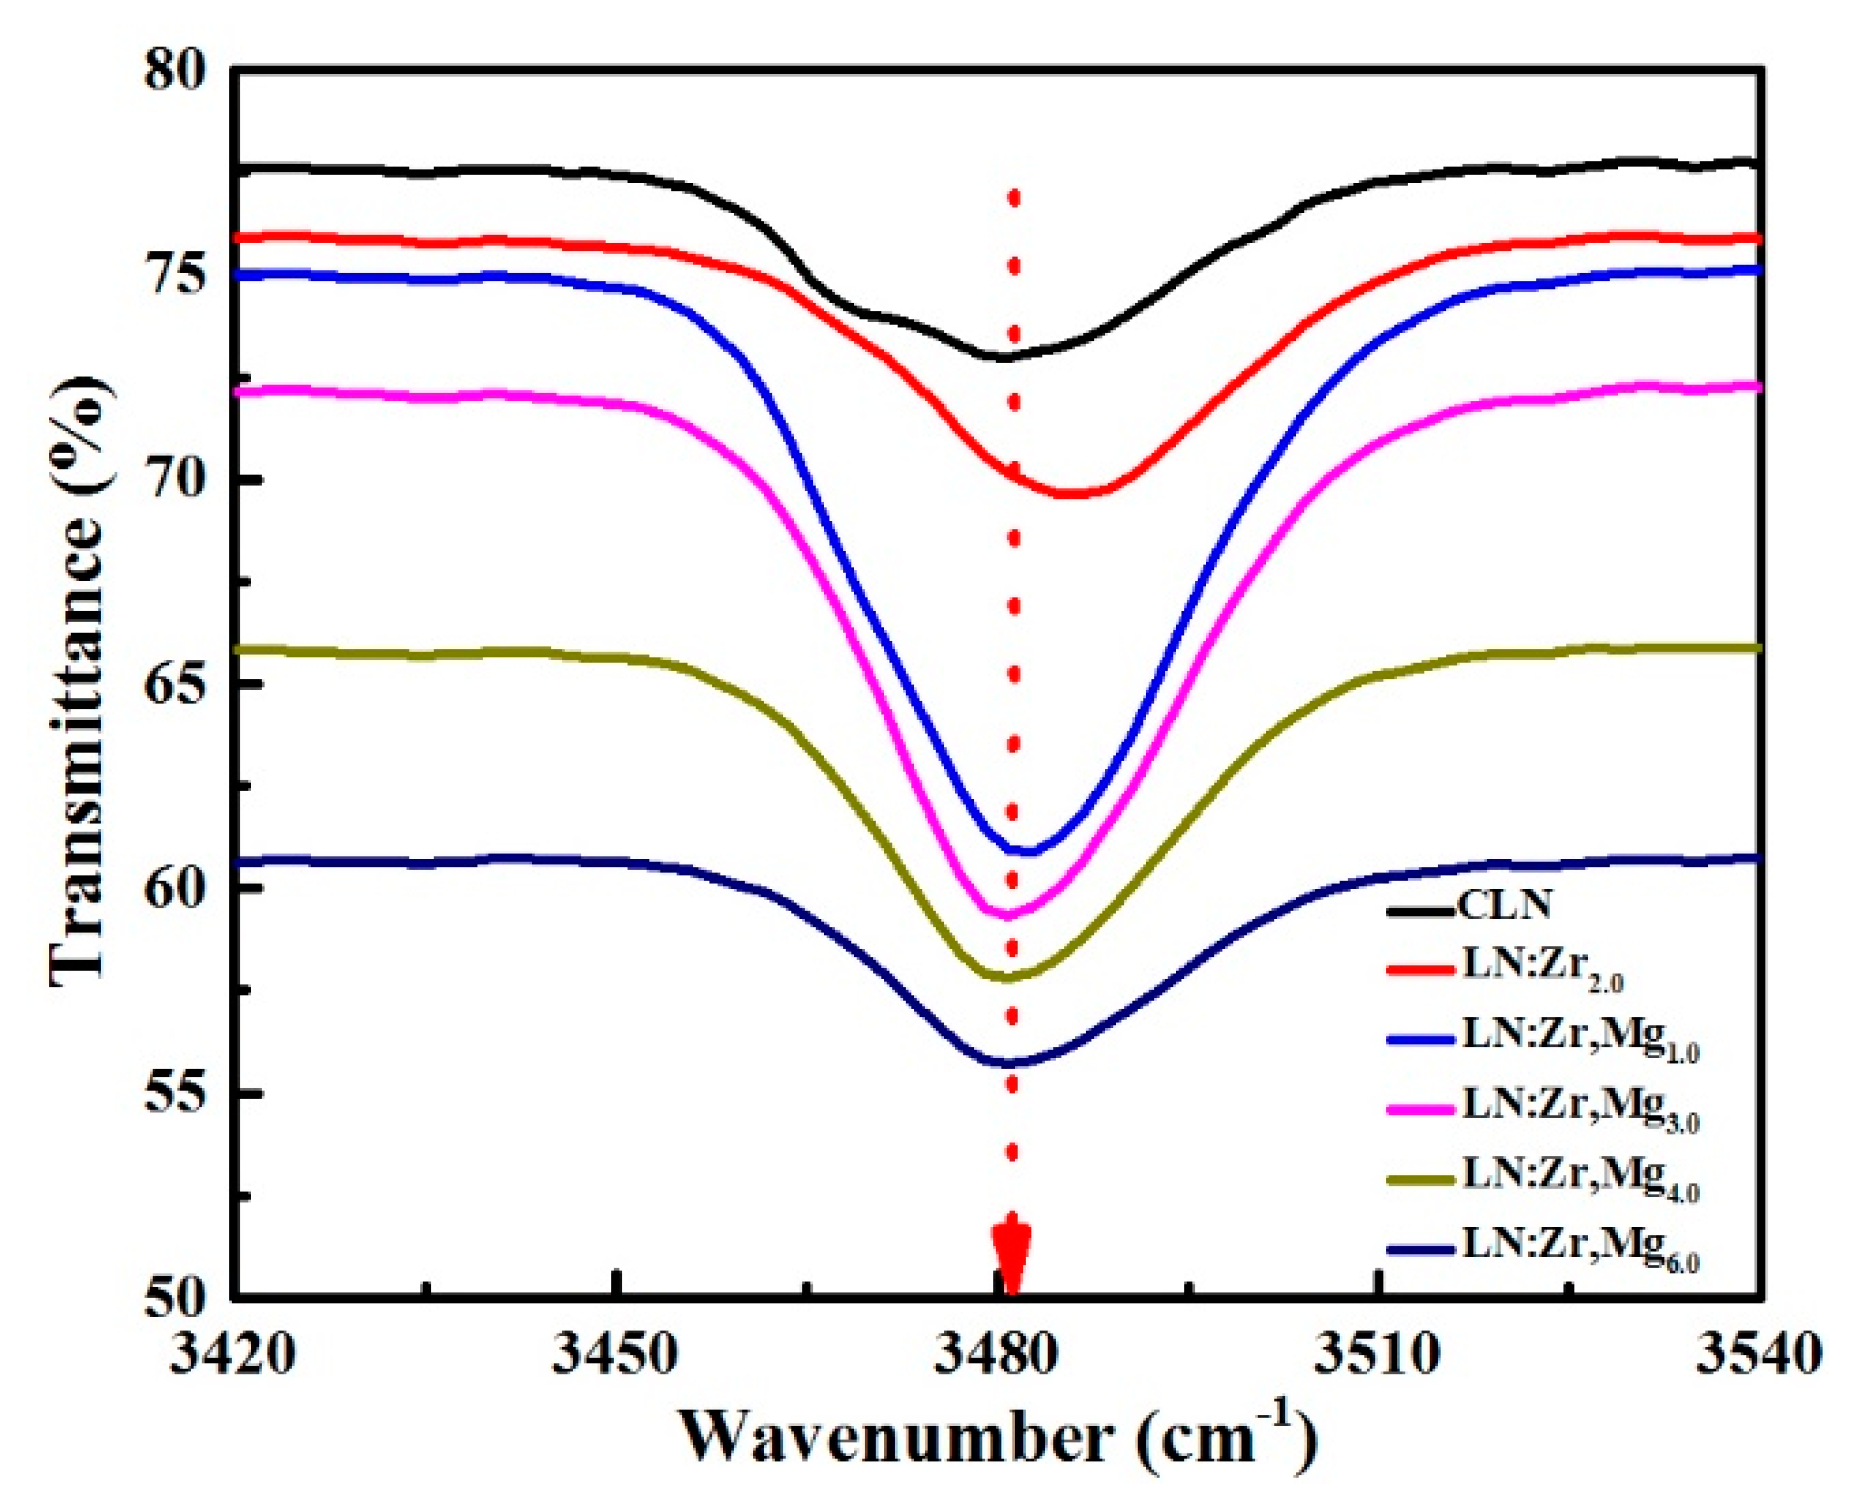
Temperature-tuned 90° phase matching for LN:Zr,Mg3.0, LN:Zr,Mg4.0, and LN:Zr,Mg6.0 was achieved by using a 1064 nm Q-switched Nd:YAG laser. Figure 3 illustrates the relationship between second-harmonic generation efficiency and the temperature, while the full width at half maximum (FWHM) of the temperature-tuning curve is also shown. From the figure, we know that the investigated crystals can achieve an efficient second-harmonic generation (SHG), and the SHG efficiency is maximized at the temperature for phase matching. Figure 4 describes the phase-matching temperature of LN:Zr,Mg as a function of the mole fraction of MgO doping in the melt. Moreover, to clearly elucidate the dependence between the phase-matching temperature and the MgO doping concentration, we also added the measured phase-matching temperature for the 1.5 mol % ZrO2 and 5.0 mol % MgO co-doped LiNbO3 crystal (labeled as LN:Zr,Mg5.0), as reported in our published paper [14]. As shown in the figure, the phase-matching temperature increases with increased MgO doping concentration, and the phase-matching temperature follows a linear function of the mole fraction of MgO doping in the melt. Therefore, based on this linear dependence we can adjust the phase-matching temperature of LN:Zr,Mg over a considerable range of temperature by the selection of the MgO doping concentration.
As we know, lower phase-matching temperature and higher optical damage resistance are essential conditions for developing simple, compact, and convenient visible lasers. Please note that the phase-matching temperature for LN:Zr,Mg3.0 is as low as 29.3 °C, close to room temperature (~25 °C), while the FWHM of the temperature-tuning curve is 1.9 °C. Here, it should be pointed out that the FWHM difference between the three test crystals may be caused by the quality of crystals. Moreover, the measured maximum SHG efficiency of LN:Zr,Mg3.0 is only 26.2%, and its low efficiency for doubling 1064 nm may be caused by the lack of anti-reflection coatings for the crystals’ Y-surfaces. These characteristics help to reduce the requirement of temperature control, which makes the phase matching at room temperature noncritical by slightly modulating the incident angle of the fundamental beam. In addition, we need to emphasize that the photochromic damage, called dark trace damage [20], is not observed when the crystals are exposed to 320 mJ energy of the Nd:YAG pulse laser for two hours. According to the aforementioned points, we can conclude that the LN:Zr,Mg3.0 crystal can be an excellent candidate for frequency conversion.

3.3. OH Absorption Spectra

Figure 5 shows the OH absorption spectra of CLN, LN:Zr2.0 and LN:Zr,Mg crystals. It can be seen in the figure that the positions of the OH absorption bands of all samples are situated around 3484 cm−1. Due to the lack of a noticeable shift in the absorption bands, a three-peak fitting model [21] was adopted to precisely analyze the absorption spectra. The fitting results are listed in Table 1.
As shown in the table, the three peaks of CLN are situated at 3468 cm−1, 3481 cm−1, and 3490 cm−1, respectively, consistent with the previous literature [21]. In particular, the vibration 3468 cm−1 peak of LN:Zr,Mg1.0 moves to 3470 cm−1, and others move to 3473 cm−1, 3474 cm−1, and 3475 cm−1 for LN:Zr,Mg3.0, LN:Zr,Mg4.0, and LN:Zr,Mg6.0, respectively. The fitting peak of LN:Zr2.0 shifts from the position at 3468 cm−1 of CLN to 3475 cm−1. Generally, the absorption peak moving to 3473 cm−1 and the higher wavenumbers for ZrO2-doped LN can be considered as a signal of the doping threshold level, which is related to the formation of Zr Nb − OH complexes [22,23]. Thus, we infer that Zr4+ ions enter Nb sites to form Zr Nb defects in the LN:Zr,Mg3.0, LN:Zr,Mg4.0, and LN:Zr,Mg6.0. It is known that for MgO-doped LN the absorption peak at 3535 cm-1 is attributed to the vibration of Mg Nb 3 − OH complexes [24]. According to the measured absorption spectra, however, no 3535 cm−1 is observed in the investigated MgO and ZrO2 co-doped LiNbO3, which reflects the observation that Mg2+ ions only occupy Li sites in crystals. In addition, it is widely accepted that in doped LN a new absorption band related to the stretching vibration of M Nb n + − OH complexes appears when the doping concentration exceeds the threshold value, where M Nb n + is a di-, tri- or tetravalent optical-damage-resistant ion occupying an Nb site in the lattice [23,25]. Taken together, we can draw the conclusion that the total concentration of 1.5 mol % ZrO2 and 3.0 mol % MgO in LN has reached the doping threshold value. Meanwhile, by this analysis, we can also deduce that Mg Li + + Zr Nb defect pairs without charge compensation by OH exist in crystals with the increase of MgO doping concentration from 3.0 mol % to 6.0 mol %, which is the reason that no absorption band obviously shifts.

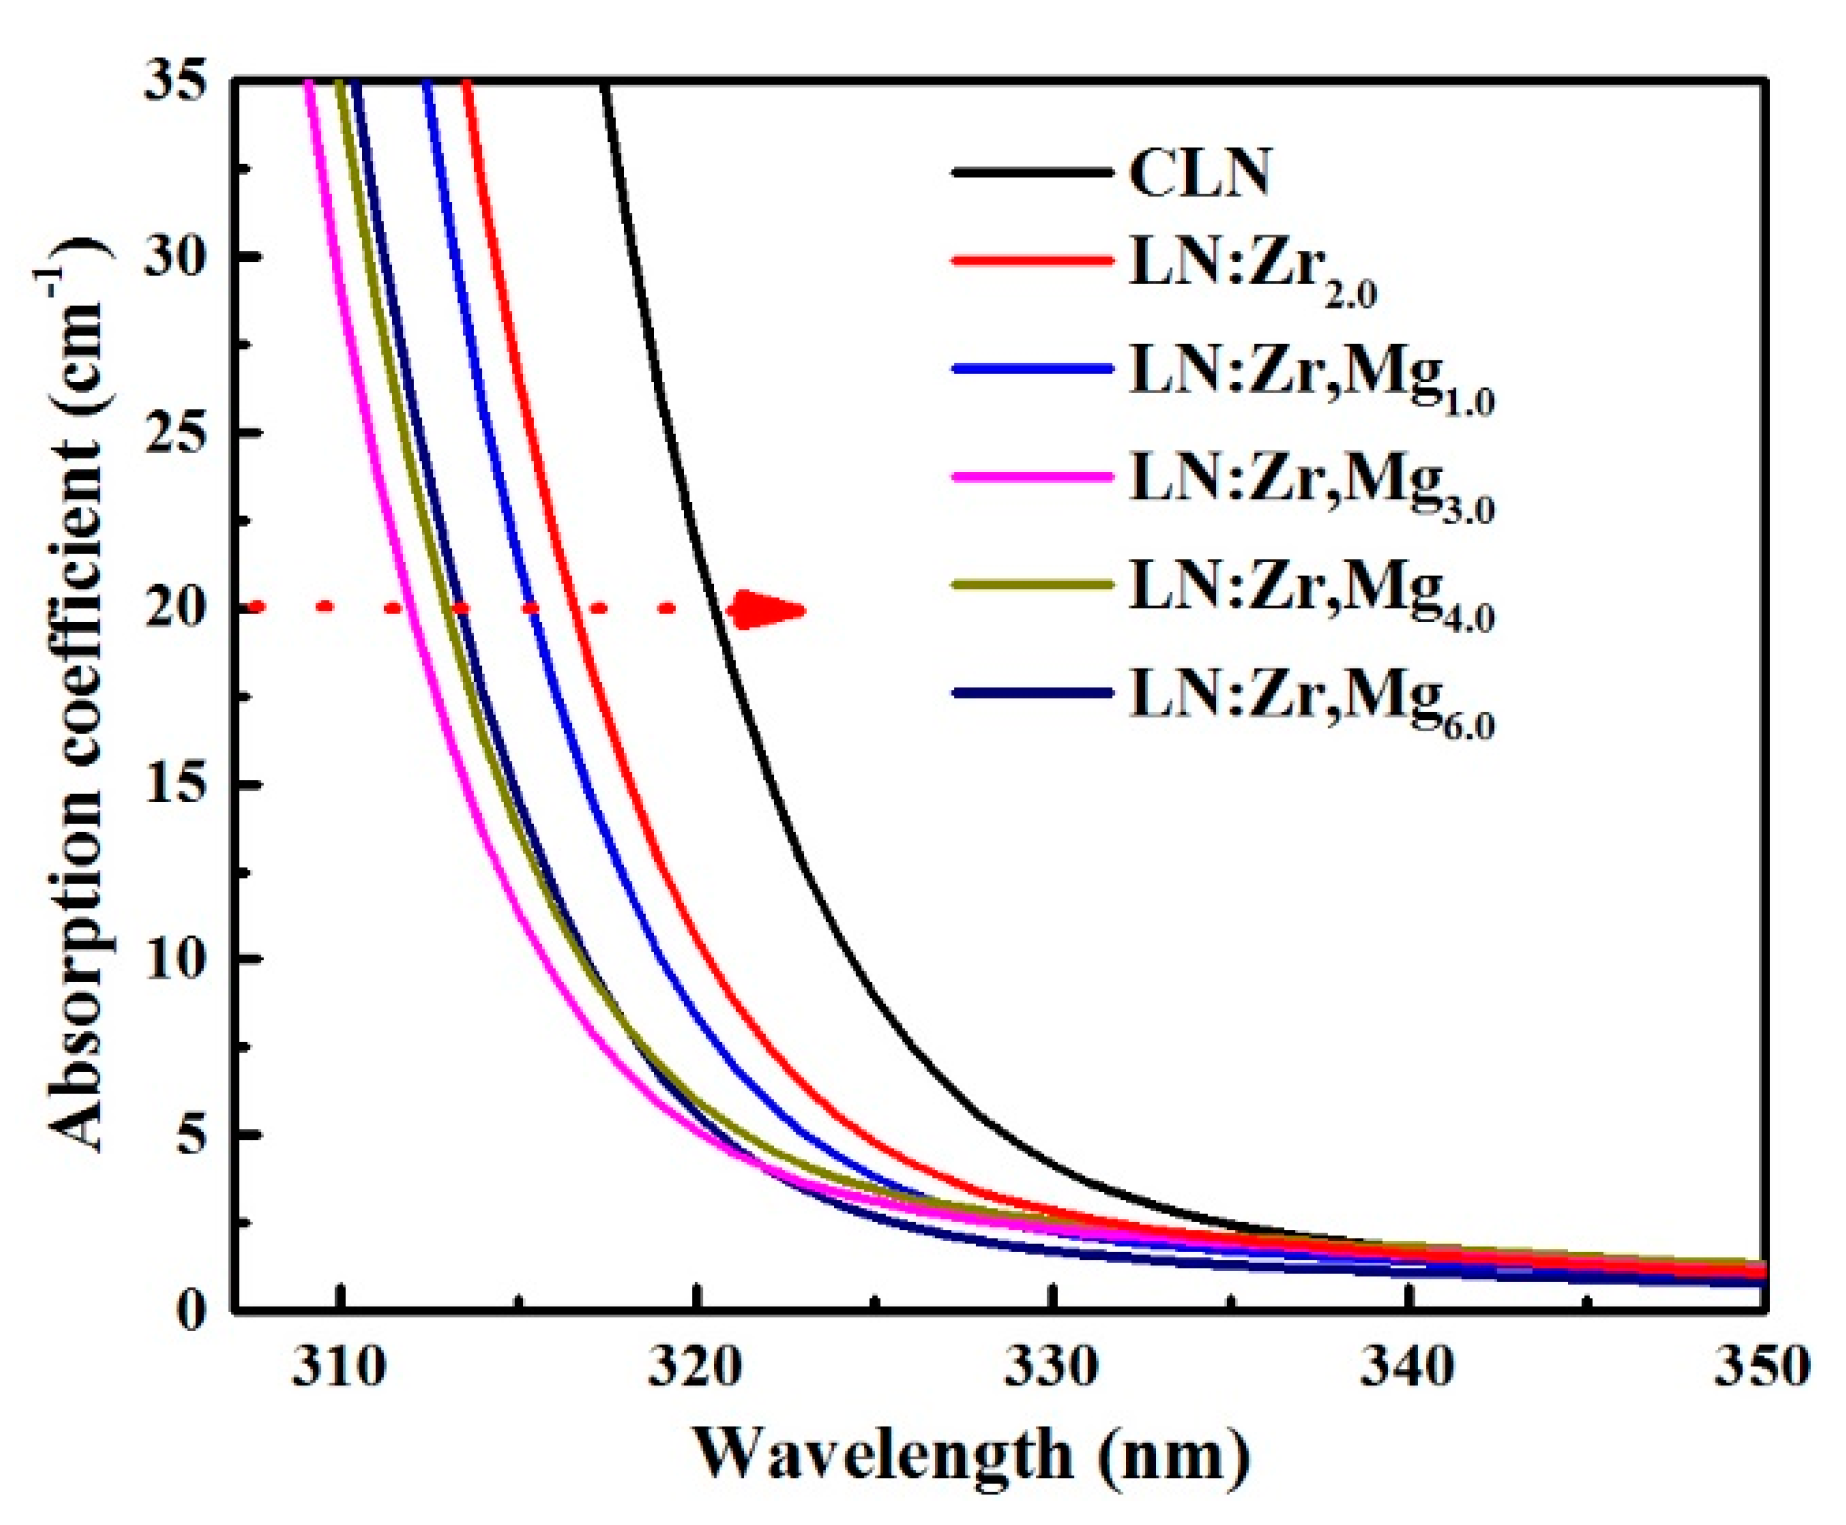
3.4. UV-Visible Absorption Spectra

The absorption edge of LN is determined by the transition energy of the electron transition from O2− 2p-state to Nb5+ 4d-state [26]. Figure 6 depicts the shift of the absorption edge for LN:Zr,Mg crystals as a function of MgO doping concentration. Here, the absorption edge is defined as the wavelength where the absorption coefficient is equal to 20 cm−1 [27]. Notably, the absorption edge has a violet-shift below the threshold but a red-shift above the threshold with increasing doping [28]. We can see the aforementioned characteristics at the threshold from this figure; in other words, the total doping concentration of 1.5 mol % ZrO2 and 3.0 mol % MgO in LiNbO3 has reached the threshold level, which agrees with the results of the OH absorption spectra. In addition to this, the absorption edge of LN:Zr,Mg3.0 is far from that of LN:Zr2.0, implying that MgO co-doping may induce greater lattice distortion in crystals.
The ion-polarization model can be used to explain the shift of the absorption edge of doped LN [29,30]. In this model, the polarization ability of doped ions is reflected by (Z*)2/r, where Z* is the valid nuclear charge number, and r is the ionic radius. The intensity of the Nb-O band—that is, the change of the distribution of the O2− ions electron cloud—directly affects the position of the absorption edge. When the doped ions make the polarization of O2– increase, the energy of the electron transition from O2− 2p-state to Nb5+ 4d-state decreases, causing the indirect transition absorption edge to move towards the infrared. Conversely, when the doped ions make the polarization of O2− decrease, the energy of the electron transition from O2− 2p-state to Nb5+ 4d-state increases, causing the indirect transition absorption edge to move towards the ultraviolet. The calculated values of the polarization ability of Li+, Nb5+, Mg2+ and Zr4+ are 7.6, 260.0, 78.1, and 196.7, respectively. Special mention should be made that Zr4+ and Mg2+ have the same ionic radius (0.72 Å), and the electronegativity of Zr4+ (1.3) and Mg2+ (1.2) is less than that of Nb5+ ions (1.6). Based on the Li-vacancy model [31], the doped ions in LN are assumed preferably to replace Nb Li 4 + defects until all Nb Li 4 + are substituted, and above the doping threshold value, the doped ions occupy the normal Nb and Li sites. Moreover, it is reported that for LN:Mg with other impurities, co-doping Mg2+ ions are assumed to affect the site occupancy by removing Nb Li 4 + and the impurity ions occupying Li sites [32]. Thus, the doping mechanism for the investigated LN:Zr,Mg is that Zr4+ ions replace Nb Li 4 + ahead of Mg2+; when Nb Li 4 + defects are totally substituted by Zr4+ and Mg2+, the surplus Mg2+ ions replace Zr Li 3 + and the normal Li sites with increased MgO doping concentration; and Mg2+ ions begin to occupy Nb sites after all Zr Li 3 + are pushed to Nb sites. According to the analyzed mechanism, we hold that Mg2+ and Zr4+ ions replacing Nb Li 4 + enable the absorption edge to move towards the infrared, while Mg2+ ions substituting the normal Li sites make the absorption edge move towards the ultraviolet as the MgO doping concentration increases from 3.0 mol % to 6.0 mol %.
In addition, it can be derived from the above analysis that the appearance of Mg Li + + Zr Nb defect pairs is reasonable in the investigated LN:Zr,Mg except LN:Zr,Mg1.0, which is definitely in line with the results of OH absorption spectra. It has been reported that Zr4+ ions occupying Nb sites in LN can significantly affect the defect structures and optical properties of LN, which is completely different from other optical-damage-resistant ions occupying Nb sites [7,17]. Therefore, we think that the Mg Li + + Zr Nb neutral complexes play a specific role in the linear tuning of the phase-matching temperature for LN:Zr,Mg; however, more research is needed to find out the specific role of Mg2+ and Zr4+ ions.

4. Conclusions

In summary, we grew a series of LiNbO3 crystals co-doping with fixed ZrO2 concentration and various MgO concentrations, and investigated their optical properties and defect structures. For LN:Zr,Mg3.0, its optical damage resistance at 532 nm was as high as 6.5 × 10⁶ W/cm2, while the phase-matching temperature for doubling 1064 nm was as low as 29.3 °C, close to room temperature, which is helpful in achieving an efficient SHG at room temperature by slightly modulating the incident angle of the fundamental beam. In particular, a linear dependence between the phase-matching temperature and the MgO doping concentration was found. According to the linear relationship, we can adjust the phase-matching temperature within a considerable temperature range by the selection of the MgO doping concentration, and it is useful to grow high-quality crystals for room temperature 90° phase matching. Moreover, the spectra analysis elucidates that Mg Li + + Zr Nb neutral pairs may play a specific role in the linear tuning of phase-matching temperature for LN:Zr,Mg. However, further investigation is needed.

Author Contributions

Conceptualization, H.L. and Y.K.; Data curation, L.X., W.W., S.S., and D.Z.; Investigation, T.K., S.L., S.C., and L.Z.; Supervision, J.X.; Writing—original draft, T.K.; Writing—review and editing, H.L.

Funding

This work was supported by the Science Foundation of Henan University of Technology (31401170), the National Natural Science Foundation of China (11674179 and 61705116), and the Program for Changjiang Scholars and Innovative Research Team in University (IRT_13R29).

Conflicts of Interest

The authors declare no conflict of interest.

References

  1. Kong, Y.; Bo, F.; Wang, W.; Zheng, D.; Liu, H.; Zhang, G.; Rupp, R.; Xu, J. Recent progress in lithium niobate: Optical damage, defect simulation, and on-chip devices. Adv. Mater. 2019. [Google Scholar] [CrossRef] [PubMed]
  2. Rota-Rodrigo, S.; Gouhier, B.; Dixneuf, C.; Antoni-Micollier, L.; Guiraud, G.; Leandro, D.; Lopez-Amo, M.; Traynor, N.; Santarelli, G. Watt-level green random laser at 532 nm by SHG of a Yb-doped fiber laser. Opt. Lett. 2018, 43, 4284–4287. [Google Scholar] [CrossRef] [PubMed]
  3. Fay, H. Dependence of second-harmonic phase-matching temperature in LiNbO3 crystals on melt composition. Appl. Phys. Lett. 1968, 12, 89. [Google Scholar] [CrossRef]
  4. Grabmaier, B.C.; Otto, F. Growth and investigation of MgO-doped LiNbO3. J. Cryst. Growth 1986, 79, 682–688. [Google Scholar] [CrossRef]
  5. Volk, T.R.; Pryalkin, V.I.; Rubinina, N.M. Optical-damage-resistant LiNbO3: Zn crystal. Opt. Lett. 1990, 15, 996–998. [Google Scholar] [CrossRef] [PubMed]
  6. Kong, Y.; Wen, J.; Wang, H. New doped lithium niobate crystal with high resistance to photorefraction-LiNbO3:In. Appl. Phys. Lett. 1995, 66, 280–281. [Google Scholar] [CrossRef]
  7. Kong, Y.; Liu, S.; Zhao, Y.; Liu, H.; Chen, S.; Xu, J. Highly optical damage resistant crystal: Zirconium-oxide-doped lithium niobate. Appl. Phys. Lett. 2007, 91, 081908. [Google Scholar] [CrossRef]
  8. Kong, Y.F.; Liu, S.G.; Xu, J.J. Recent Advances in the photorefraction of doped Lithium Niobate Crystals. Materials 2012, 5, 1954–1971. [Google Scholar] [CrossRef] [Green Version]
  9. Ortega, T.A.; Pask, H.M.; Spence, D.J.; Lee, A.J. THz polariton laser using an intracavity Mg:LiNbO3 crystal with protective teflon coating. Opt. Express 2017, 25, 3991–3999. [Google Scholar] [CrossRef]
  10. Shukla, M.K.; Das, R. High-power single-frequency source in the mid-infrared using a singly resonant optical parametric oscillator pumped by Yb-fiber laser. IEEE J. Sel. Top. Quantum Electron. 2018, 24, 17255125. [Google Scholar] [CrossRef]
  11. Zhao, J.; Jia, F.; Feng, Y.; Nilsson, J. Continuous-Wave 3.1–3.6 μm difference-frequency generation of dual wavelength-tunable fiber sources in PPMgLN-based rapid-tuning design. IEEE J. Sel. Top. Quantum Electron. 2018, 24, 17088616. [Google Scholar] [CrossRef]
  12. Fan, T.Y.; Cordova-Plaza, A.; Digonnet, M.J.F.; Byer, R.L.; Shaw, H.J. Nd:MgO:LiNbO3 spectroscopy and laser devices. J. Opt. Soc. Am. B 1986, 3, 140–148. [Google Scholar] [CrossRef]
  13. Volk, T.; Rubinina, N.; Wöhlecke, M. Optical-damage-resistant impurities in lithium niobate. J. Opt. Soc. Am. B 1994, 11, 1681–1687. [Google Scholar] [CrossRef]
  14. Kong, T.; Liu, H.; Ge, X.; Qu, D.; Liu, S.; Chen, S.; Zhang, L.; Kong, Y.; Rupp, R.; Xu, J. Room temperature 90° phase-matching in zirconium and magnesium co-doped lithium niobate crystals. Sci. Rep. 2018, 8, 3865. [Google Scholar] [CrossRef]
  15. Zheng, D.; Wang, W.; Wang, S.; Qu, D.; Liu, H.; Kong, Y.; Liu, S.; Chen, S.; Rupp, R.; Xu, J. Real-time dynamic holographic display realized by bismuth and magnesium co-doped lithium niobate. Appl. Phys. Lett. 2019, 114, 241903. [Google Scholar] [CrossRef]
  16. Li, M.H.; Xu, Y.H.; Xu, W.S.; Liu, C.X.; Zhang, W.L.; Shao, Z.S. Nonlinear optical effect of co-doped Mg, Zn: LiNbO3. Ferroelectrics 2001, 264, 273–278. [Google Scholar] [CrossRef]
  17. Liu, F.C.; Kong, Y.F.; Li, W.; Liu, H.D.; Liu, S.G.; Chen, S.L.; Zhang, X.Z.; Rupp, R.; Xu, J.J. High resistance against ultraviolet photorefraction in zirconium-doped lithium niobate crystals. Opt. Lett. 2010, 35, 10–12. [Google Scholar] [CrossRef]
  18. Liu, H.D.; Liang, Q.R.; Zhu, M.L.; Li, W.; Liu, S.G.; Zhang, L.; Chen, S.L.; Kong, Y.F.; Xu, J.J. An excellent crystal for high resistance against optical damage in visible-UV range: Near-stoichiometric zirconium-doped lithium niobate. Opt. Express 2011, 19, 1743–1748. [Google Scholar] [CrossRef]
  19. Kogelnik, H. Coupled Wave Theory for Thick Hologram Gratings. Bell System Tech. J. 1969, 48, 2909–2947. [Google Scholar] [CrossRef]
  20. Deng, J.; Zhang, W.; Wen, J.; Zhang, G.; Wang, H. Pulsed-laser-induced dark traces in LiNbO3:Zn and LiNbO3:Mg. Opt. Lett. 1994, 19, 933–935. [Google Scholar] [CrossRef]
  21. Kong, Y.; Deng, J.; Zhang, W.; Wen, J.; Zhang, G.; Wang, H. OH absorption spectra in doped lithium niobate crystals. Phys. Lett. A 1994, 196, 128–132. [Google Scholar] [CrossRef]
  22. Xu, C.; Lei, Z.; Zhu, C.; Yang, C.; Zhang, C.; Sun, T.; Wang, R.; Xu, Y. Investigation on the OH absorption and blue photorefractive properties in Zr:Ru:Fe:LiNbO3 crystals as a function of Li composition. J. Opt. Soc. Am. B 2012, 29, 2814–2818. [Google Scholar] [CrossRef]
  23. Kovács, L.; Szaller, Z.; Lengyel, K.; Péter, A.; Hajdara, I.; Mandula, G.; Pálfalvi, L.; Hebling, J. Photorefractive damage resistance threshold in stoichiometric LiNbO3:Zr crystals. Opt. Lett. 2013, 38, 2861–2864. [Google Scholar] [CrossRef] [PubMed] [Green Version]
  24. Feng, X.Q.; Tang, T. B, Mg-doping threshold effect and H-containing defects in LiNbO3. J. Phys. Condens. Matter 1993, 5, 2423–2430. [Google Scholar] [CrossRef]
  25. Volk, T.; Wöhlecke, M. Lithium Niobate. In Springer Series in Material Science; Springer: Berlin, Germany, 2008; Volume 115. [Google Scholar]
  26. Földvári, I.; Polgár, K.; Voszka, R.; Balasanyan, R.N. A simple method to determine the real composition of LiNbO3 crystals. Cryst. Res. Technol. 1984, 19, 1659–1661. [Google Scholar] [CrossRef]
  27. Redfield, D. Optical absorption edge of LiNbO3. J. Appl. Phys. 1974, 45, 4566. [Google Scholar] [CrossRef]
  28. Wang, L.; Liu, S.; Kong, Y.; Chen, S.; Huang, Z.; Wu, L.; Rupp, R.; Xu, J. Increased optical damage resistance in tin-doped lithium niobate. Opt. Lett. 2010, 35, 883–885. [Google Scholar] [CrossRef]
  29. Yang, X.; Xu, G.; Li, H.; Zhu, J.; Wang, X. Optical absorption edge of Mg+Zn: LiNbO3. Cryst. Res. Technol. 1996, 31, 521–527. [Google Scholar] [CrossRef]
  30. Xu, C.; Xu, Z.; Leng, X.; Yang, C.; Xu, Y. Investigation on the defect structure and light-induced scattering of LiNbO3:Fe:Mg:Zr crystals with various Li/Nb ratios. Mater. Chem. Phys. 2011, 130, 1203–1207. [Google Scholar] [CrossRef]
  31. Bhatt, R.; Bhaumik, I.; Ganesamoorthy, S.; Bright, R.; Soharab, M.; Karnal, A.; Gupta, P. Control of intrinsic defects in lithium niobate single crystal for optoelectronic applications. Crystals 2017, 7, 23. [Google Scholar] [CrossRef] [Green Version]
  32. Kovács, L.; Rebouta, L.; Soares, J.C.; Silva, M.F.D.; Hage-Ali, M.; Stoquert, J.P.; Siffert, P.; Sanz-García, J.A.; Corradi, G.; Szaller, Z.; et al. On the lattice site of trivalent dopants and the structure of Mg2+-OH-M3+ defects in LiNbO3:Mg crystals. J. Phys. Condens. Matter 1993, 5, 781. [Google Scholar] [CrossRef]
Figure 1. Distortion of transmitted laser beam spots after 5 min irradiation. The red arrow represents the C-axis of the crystal. (a) LN:Zr2.0; (b) LN:Zr,Mg1.0; (c) LN:Zr,Mg3.0; (d) LN:Zr,Mg4.0; (e) LN:Zr,Mg6.0. The light intensities are (a,ce) 6.5 × 10⁶ W/cm2 and (b) 5.9 × 10³ W/cm2.
Materials 12 04155 g001
Figure 2. Dependence of the diffraction efficiency η and refractive index change Δn of LN:Zr,Mg on the MgO doping concentration. For comparison, the open symbols represent the data of LN:Zr2.0. The dash lines are intended to guide the eyes.
Materials 12 04155 g002
Figure 3. The second-harmonic generation (SHG) efficiency vs. the temperature for (a) LN:Zr,Mg3.0, (b) LN:Zr,Mg4.0, (c) LN:Zr,Mg6.0. The full width at half maximum (FWHM) of the temperature-tuning curve is also marked.
Materials 12 04155 g003
Figure 4. The phase-matching temperature as a function of MgO doping concentration for LN:Zr,Mg. The red line represents the linear fitting. The phase-matching temperatures of LN:Zr,Mg3.0, LN:Zr,Mg4.0, and LN:Zr,Mg6.0 are marked, respectively. The phase-matching temperature of LN:Zr,Mg5.0 [14] is also shown.
Materials 12 04155 g004
Figure 5. The OH absorption spectra of CLN, LN:Zr2.0, LN:Zr,Mg1.0, LN:Zr,Mg3.0, LN:Zr,Mg4.0 and LN:Zr,Mg6.0.
Materials 12 04155 g005
Figure 6. The absorption edges of LN:Zr,Mg1.0, LN:Zr,Mg3.0, LN:Zr,Mg4.0, and LN:Zr,Mg6.0; those of CLN and LN:Zr2.0 are also shown for comparison.
Materials 12 04155 g006
Table 1. Position of component peaks in the OH absorption spectra of CLN, LN:Zr2.0, and LN:Zr,Mg.
SamplesPosition of Peaks (cm−1)
CLN346834813490
LN:Zr2.0347534853495
LN:Zr,Mg1.0347034803490
LN:Zr,Mg3.0347334813491
LN:Zr,Mg4.0347434823493
LN:Zr,Mg6.0347534833495

