3.1. Pre-Corrosion Characterization
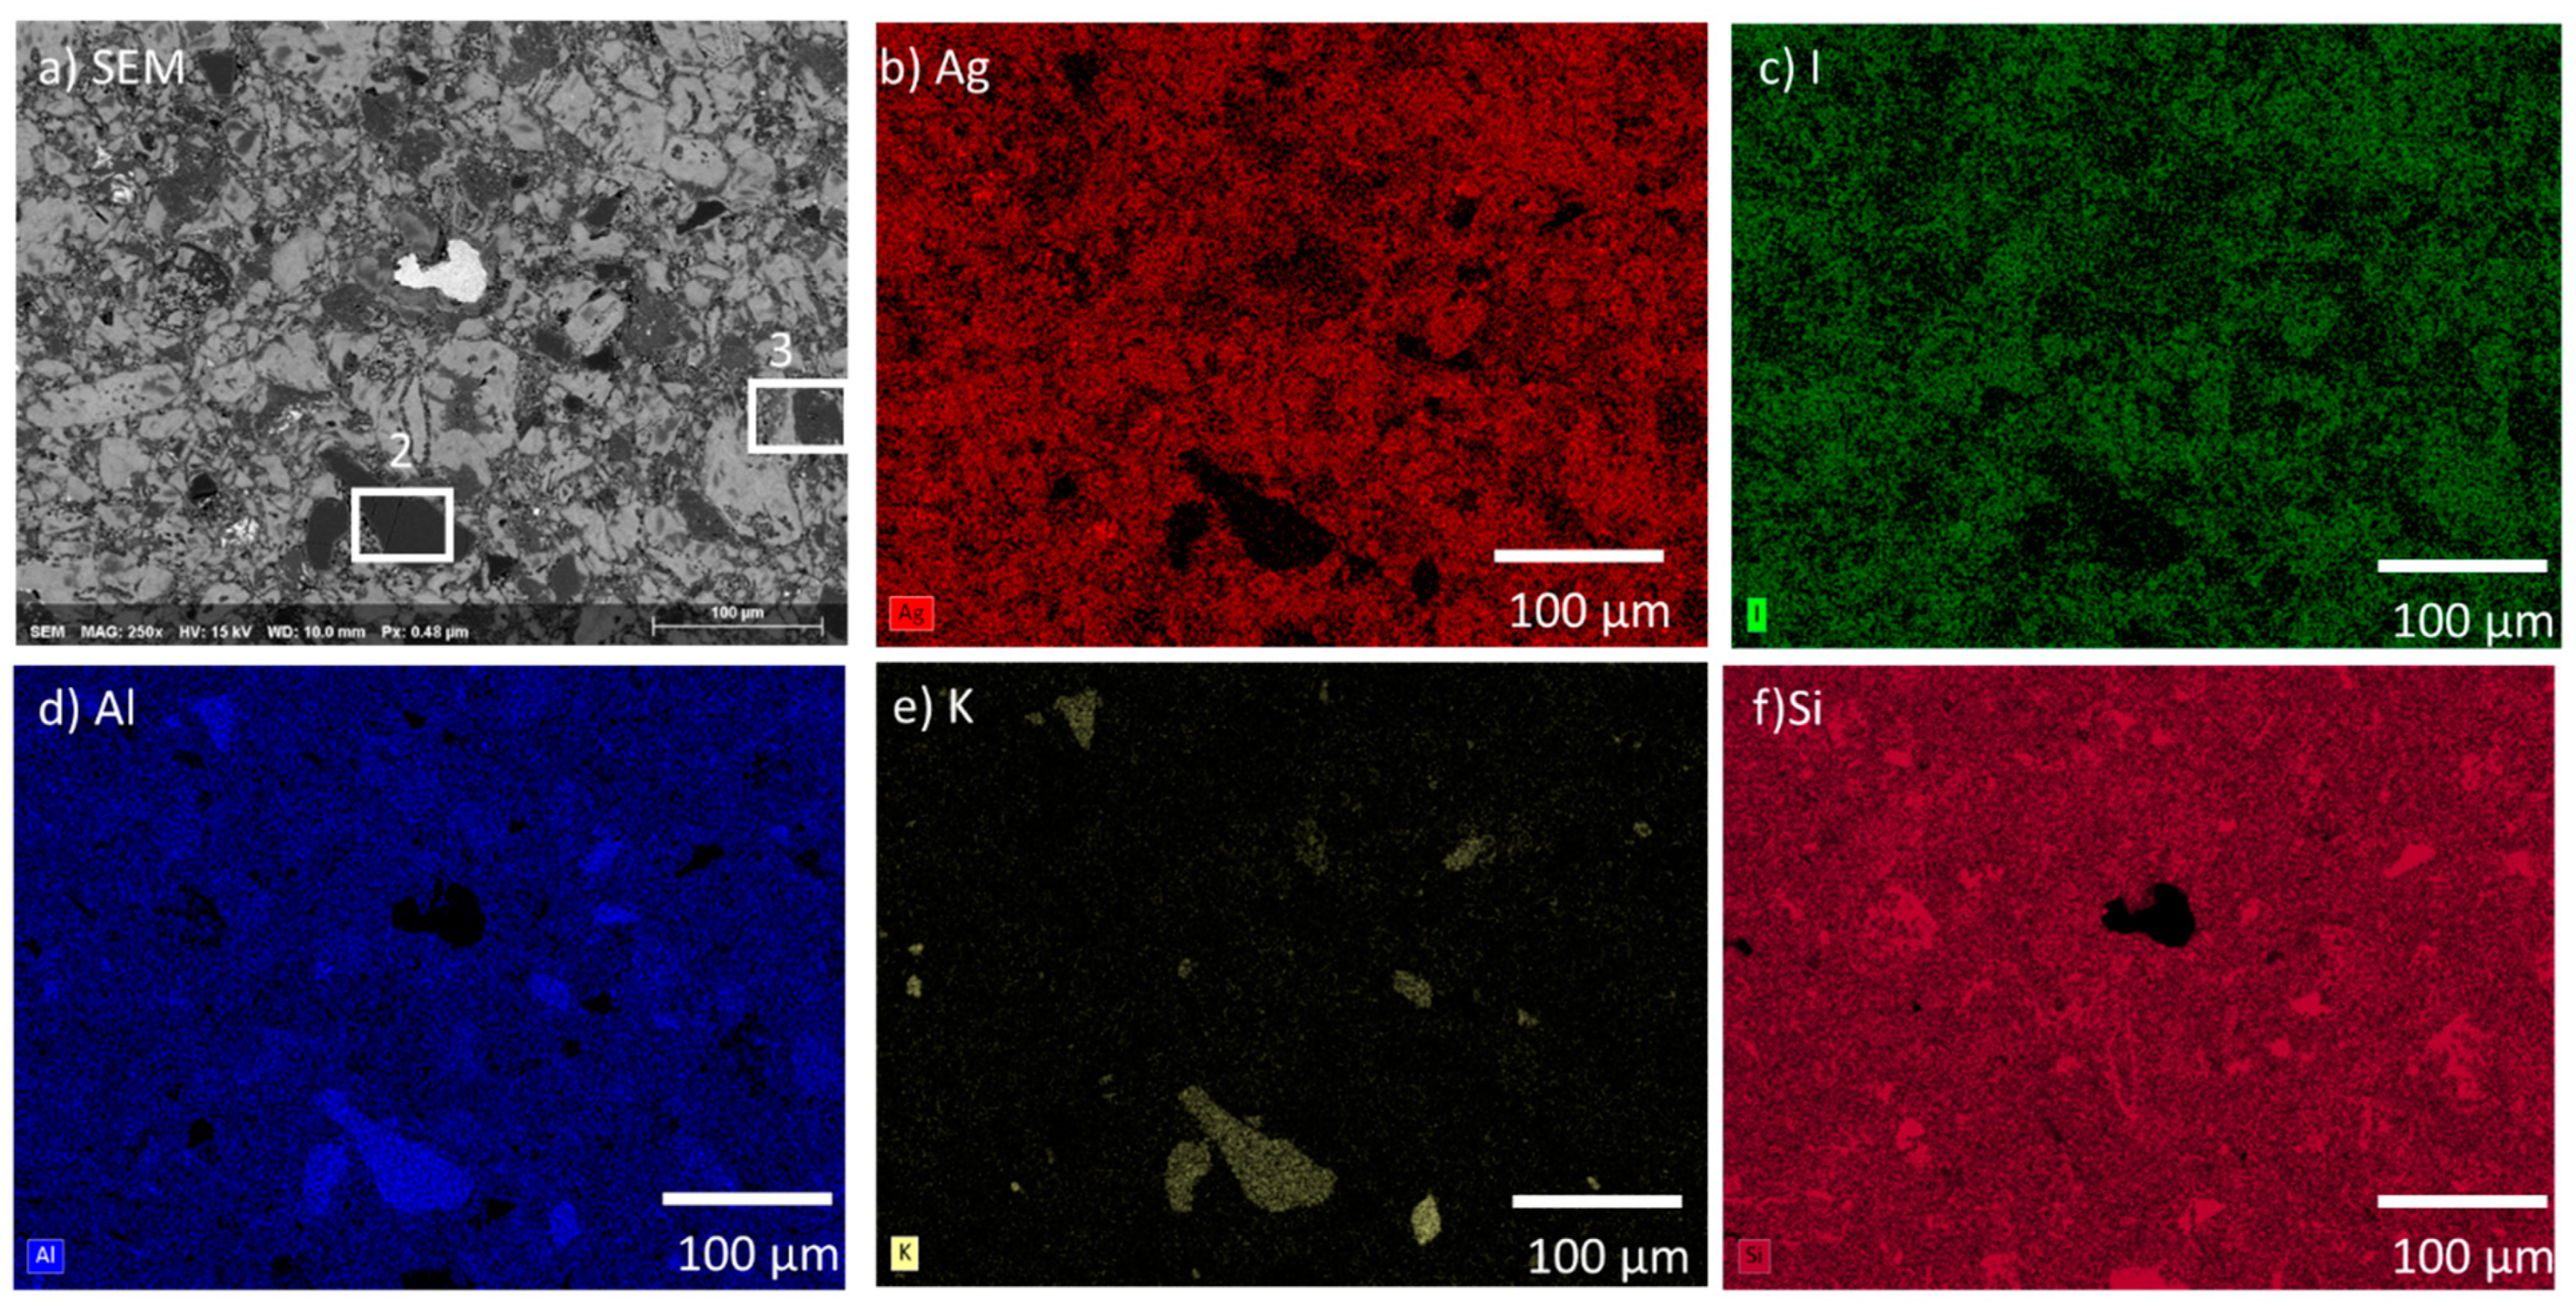
The initial microstructures of the AgZ samples prior to corrosion were observed with SEM and EDS. The multiphase structure of AgZ 1-3 is shown in the SEM micrograph in
Figure 2a. The microstructure contained a continuous matrix and large isolated secondary phases (the lighter grey regions in the SEM image) within the matrix. The Ag particles (
Figure 2b) were present in both the matrix and in the secondary phases. No iodine was present in AgZ 1-3 (
Figure 2c). The secondary phases present within the matrix contained high amounts of Al and K (i.e.,
Figure 2d,e, respectively). Si comprised the matrix phase (
Figure 2f). The larger white inclusion in the center of
Figure 2a was composed primarily of Zr and S, the origin of which is unknown. An example of a commonly observed secondary phase is highlighted with a white box in
Figure 2a. EDS analysis of this location, shown in
Table 3, revealed higher amounts of K (1.5 wt %) than the matrix as a whole. This phase also contained Ag inclusions.
The AgZ 1-7 sample is shown in
Figure 3a. AgZ 1-7 had similar features to AgZ 1-3. The two main differences between AgZ 1-3 and AgZ 1-7 were the presence of I (
Figure 3c), and more even distribution of Ag in the AgZ 1-7 sample. The I and Ag distribution in the AgZ 1-7 sample were observed to be even with one another and with few discrete Ag particles, such as those observed in the AgZ 1-3 sample. These changes were possibly due to the higher temperature used in the HIP process of the AgZ 1-3 sample. Similar secondary phases of Al and K (
Figure 3d,e, respectively) were observed within the widespread Si matrix (
Figure 3f). A different type of inclusion was observed in this image being comprised of Fe and Mn, the origin of these species is not known. (EDS not shown). Two common microstructural features are highlighted in the SEM micrograph (
Figure 3a). Area #2 was measured to be comprised of higher levels of Na (3.4 wt %), Al (10.9 wt %), and K (5.1 wt %) with lower Ag (1.8 wt %) and I (0.2 wt %) compared to the bulk composition (see
Table 3). Area #3 contained higher amounts of Ca (3.4 wt %) and Al (8 wt %) than the bulk.
Figure 4 displays the microstructure of the AgZ 1-8 sample. The elemental distributions across the microstructure were similar to AgZ 1-3 including small isolations of Ag that were associated with I in the AgZ 1-8. Such a distribution can be expected as the AgZ 1-3 and 1-8 sample had identical processing parameters.
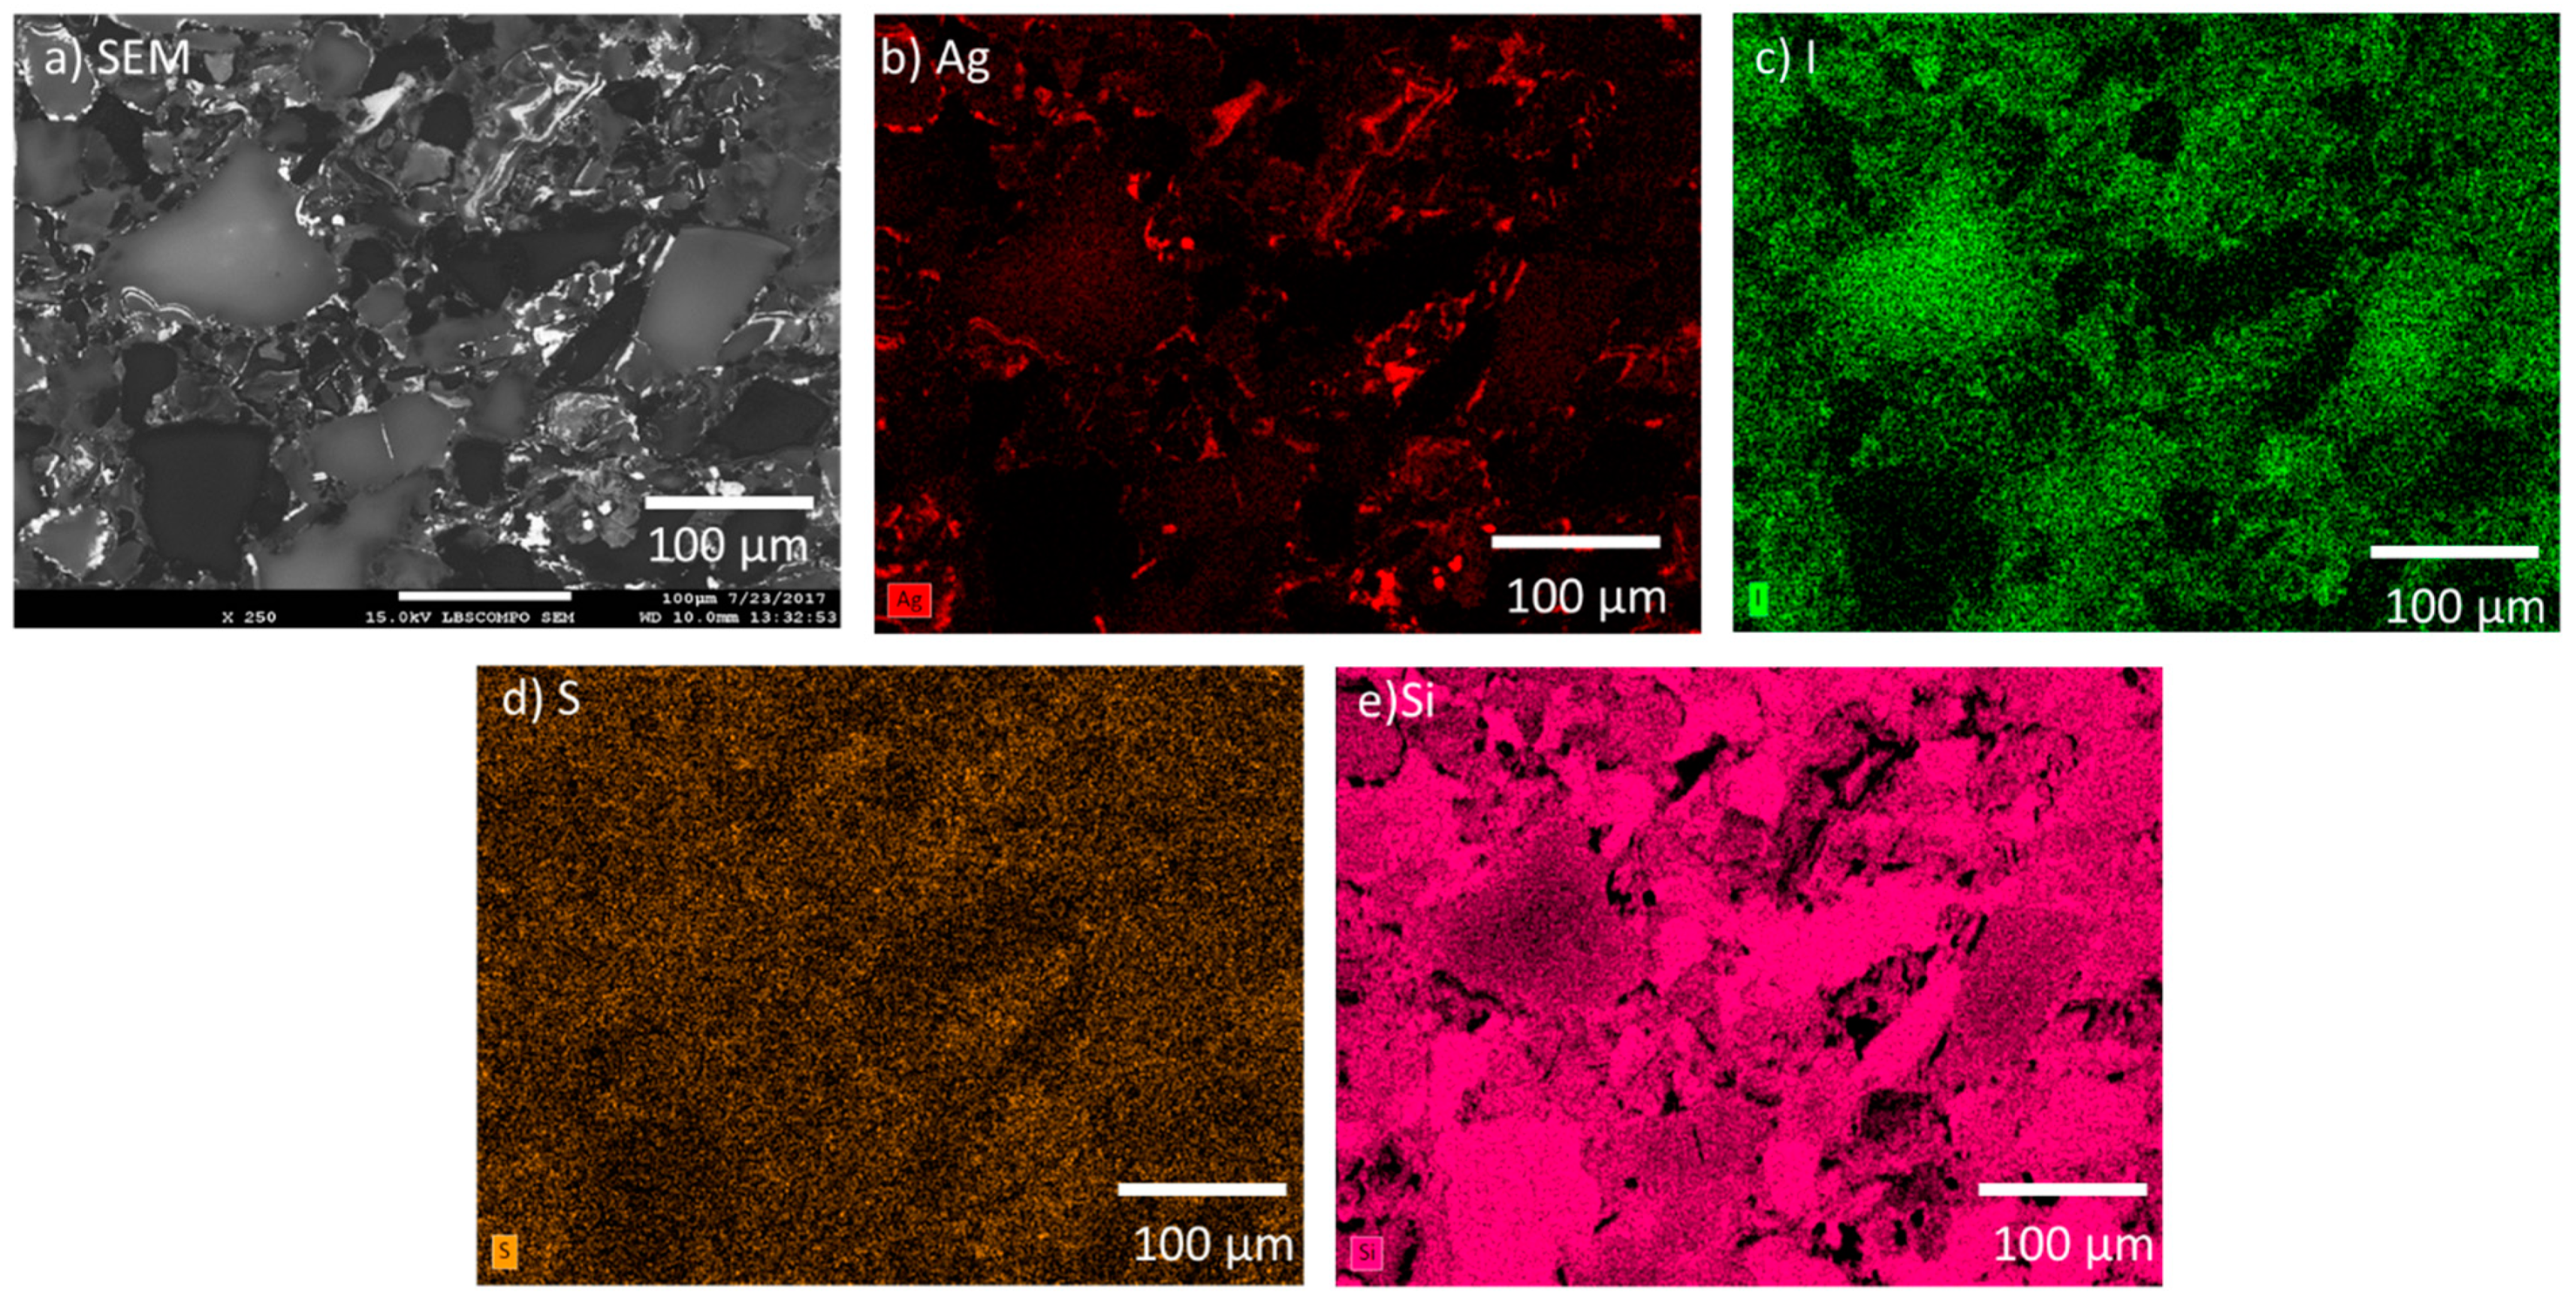
The SFA samples were also comprised of a multiphase microstructure. The SPS-1 sample can be seen in the SEM micrograph in
Figure 5a and large features were observed in the image. The Ag was observed to be sitting on the edges of the large particles and in smaller discrete isolations (see
Figure 5b). The I was generally located throughout the sample but not as intimately associated with areas of high Ag (see
Figure 5c). The SFA samples contained S from the thiol backbone of the original aerogel and the S was distributed evenly (
Figure 5d), except for areas of high Si observed in
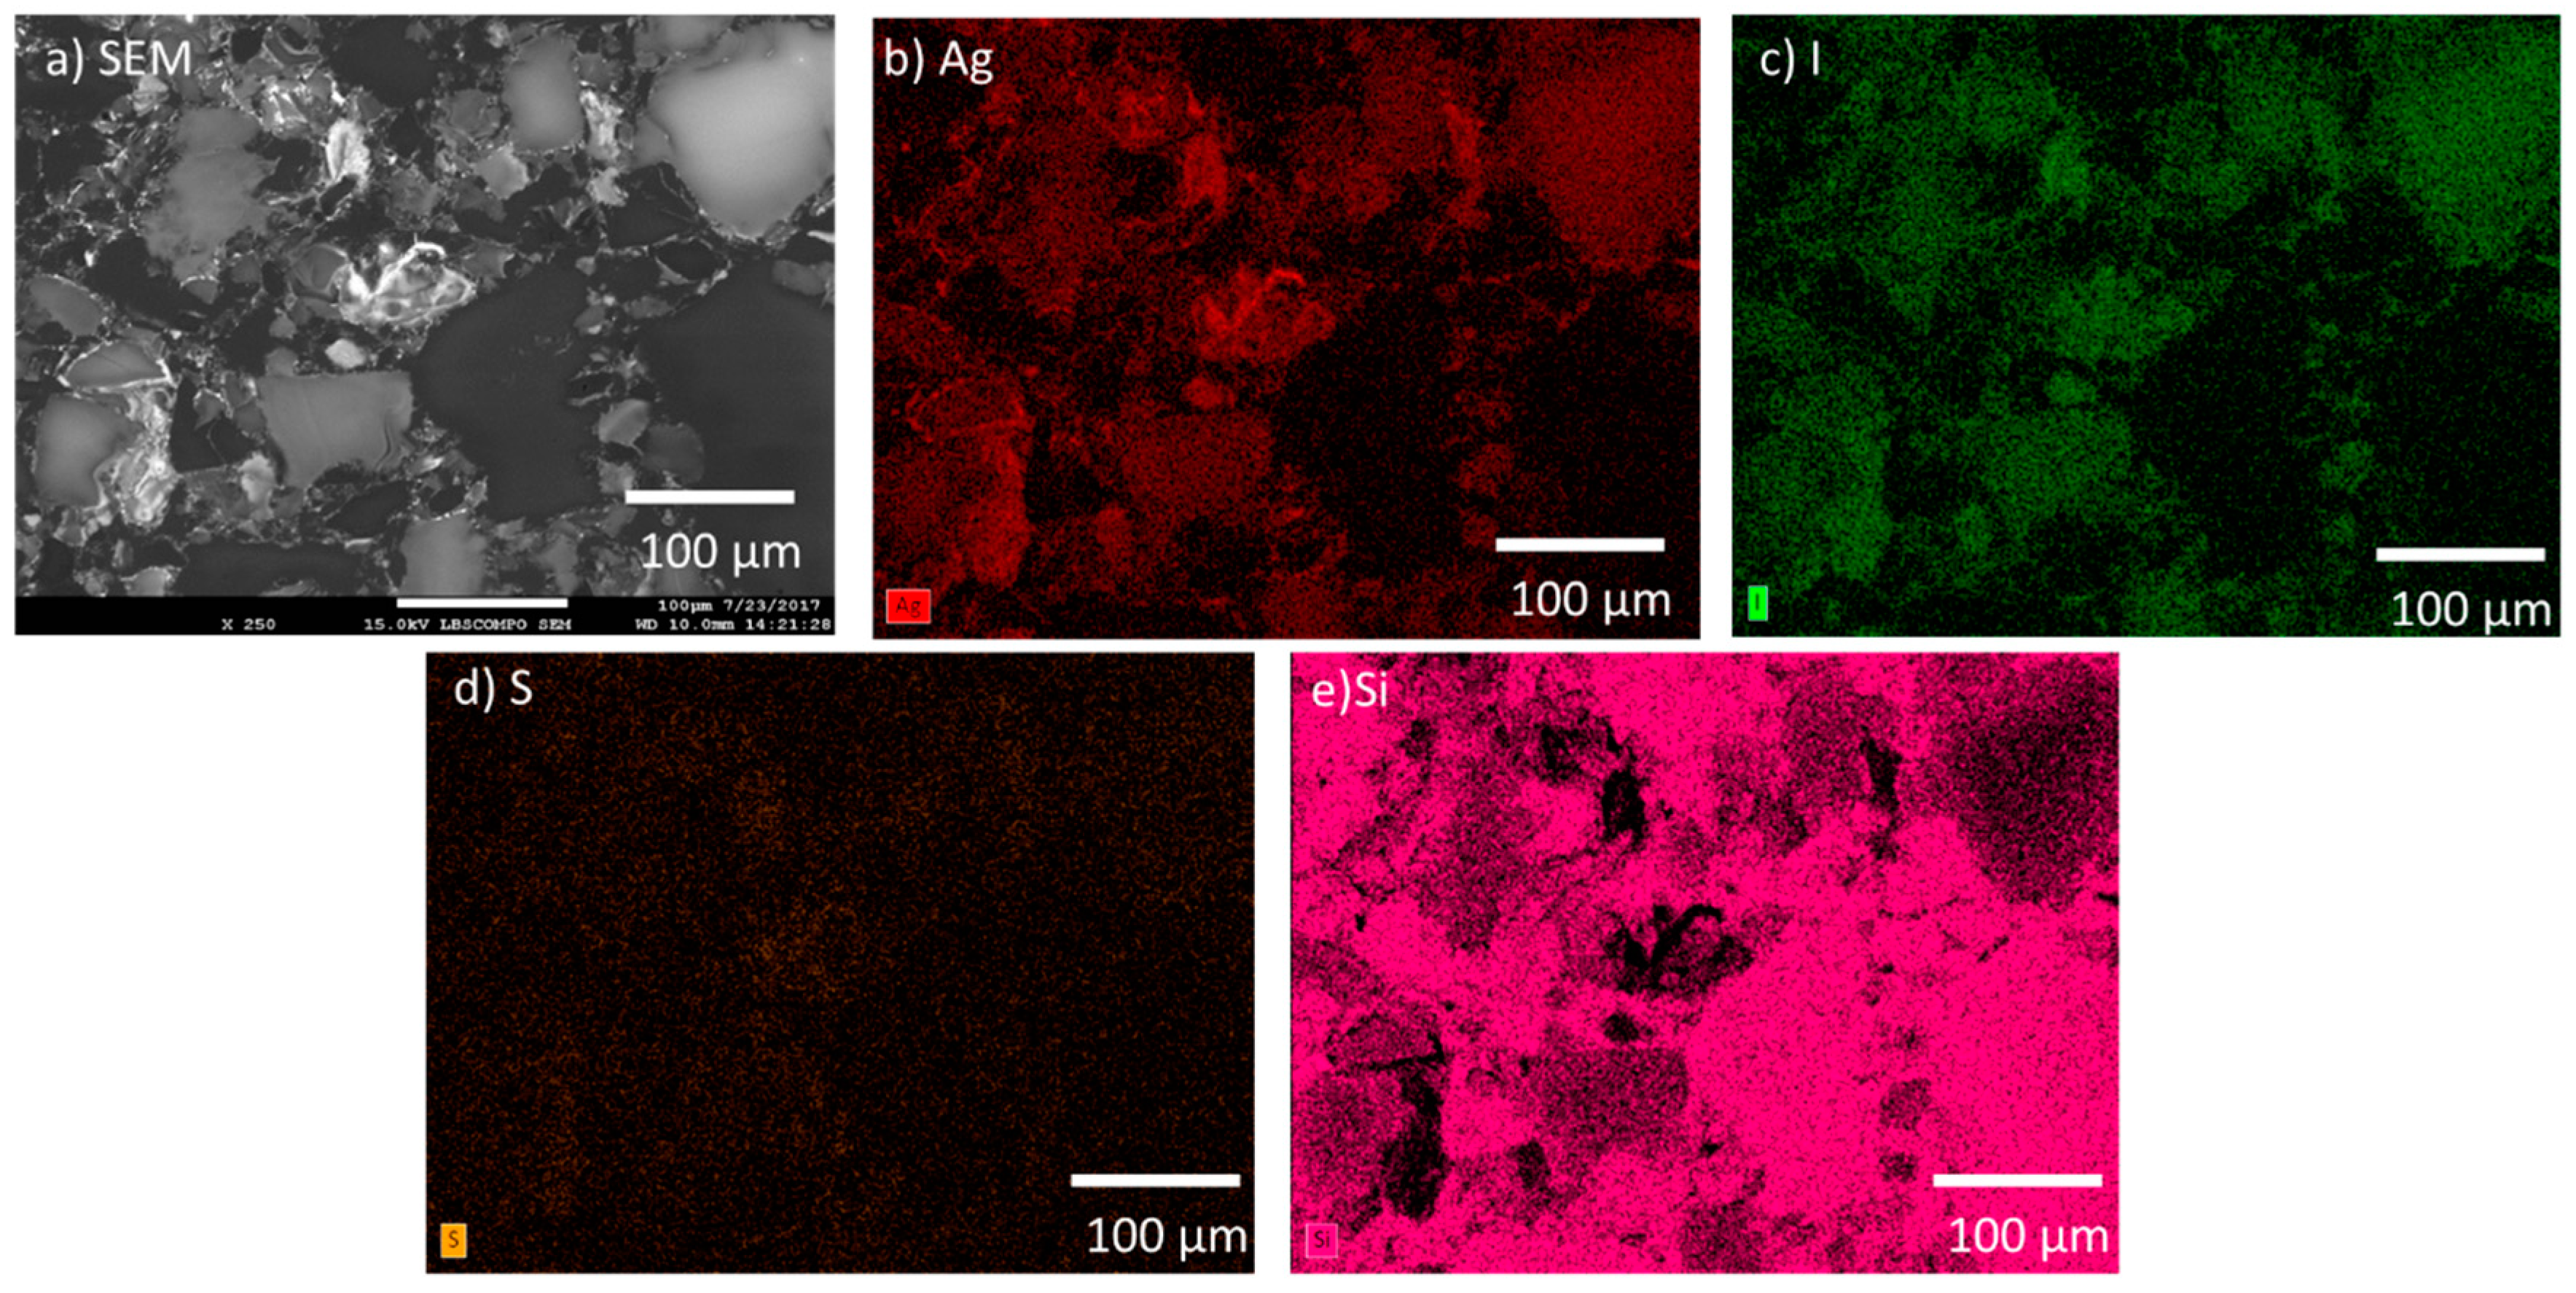
Figure 5e. The SPS-2 sample, with 20 wt % additional Si added had a similar microstructure to the SPS-1 with a larger coverage of Si-rich particles (see
Figure 6) and a more widespread distribution of Ag compared with the SPS-1 sample.
3.2. Corrosion Testing of HIPed Ag Mordenite
SPFT testing was performed on the AgZ samples with inlet solutions at pH 7, pH 9, and pH 11. The errors presented represent the standard deviation of the individual rates measured during the test. All dissolution rates in this work were normalized to the individual sample compositions (
Table 1 and
Table 2) and the dissolution rates of the samples were determined using the following equation:
|
| where | |
| X is the | concentration of the analyte in the effluent, g/L; |
| V is the | volume of the collected effluent during the interval, L; |
| SA is the | surface area of the sample, m2; |
| t is the | duration of the interval, day; and |
| fi is the | normalization factor based on the mass % of analyte, unitless. |
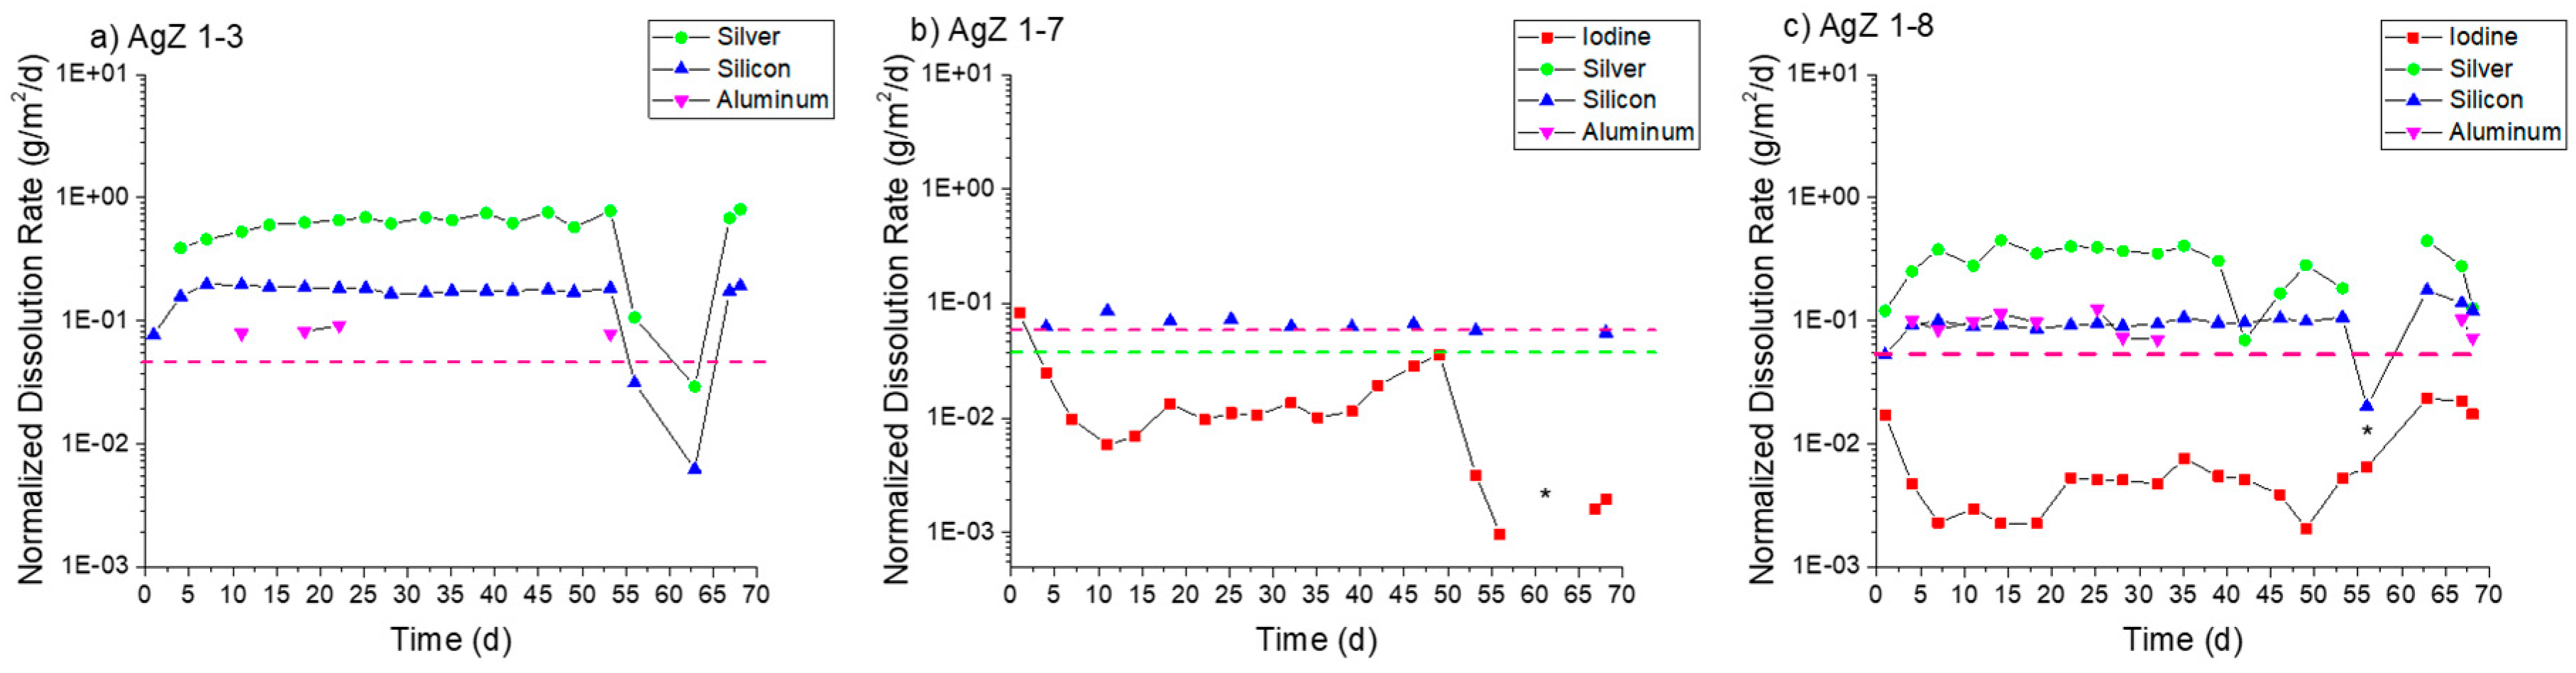
Figure 7 displays the normalized dissolution rates measured for the three AgZ samples in pH 7 solution. For the iodine-free AgZ 1-3 sample (
Figure 7a), the dissolution rates were fairly constant over the duration of the test. The decreases observed at 63 days were due to a pump failure. The Ag dissolution rate was higher (0.65 ± 0.07 g/m
2/day average) compared with the Si dissolution rate (0.17 ± 0.01 g/m
2/day average). There was only detectable Al in four samples throughout the duration of the test, the rest falling below the instrument detection limit. Using the instrument detection limit for Al as an input, a maximum rate of 0.06 g/m
2/day can be presumed for the Al dissolution rate. The AgZ 1-7 sample (
Figure 7b) showed an average Si dissolution rate of 0.066 ± 0.009 g/m
2/day while the I dissolution rate was lower at 0.015 ± 0.008 g/m
2/day. Neither the Ag nor the Al had measurable concentrations in the effluent and maximum rates of 0.04 g/m
2/day and 0.07 g/m
2/day, respectively, can be assumed using the associated instrument detection limit. The AgZ 1-8 sample, having identical processing parameters to the AgZ 1-3 but with I (
Figure 7c), behaved similarly to the iodine-free sample. The Ag dissolution rate was again higher (0.30 ± 0.11 g/m
2/day) than the Si dissolution rate (0.08 ± 0.01 g/m
2/day). The Al was measurable for this sample for the majority of the test with an average dissolution rate of 0.09 ± 0.02 g/m
2/day being measured. The I dissolution rate was measured at 0.005 ± 0.001 g/m
2/day, which was lower than the AgZ 1-7. Near the conclusion of the test, the I dissolution rate increased with time and is possibly due to the corrosion of the surface exposing more AgI that could dissolve. The difference between the AgZ 1-3 and Ag 1-8 Ag and Si dissolution rates compared with the AgZ 1-7 sample may have arisen from Ag particles being present outside of the Si matrix in the 1-3 and 1-8 samples (
Figure 2 and
Figure 4) and thus more readily attacked.
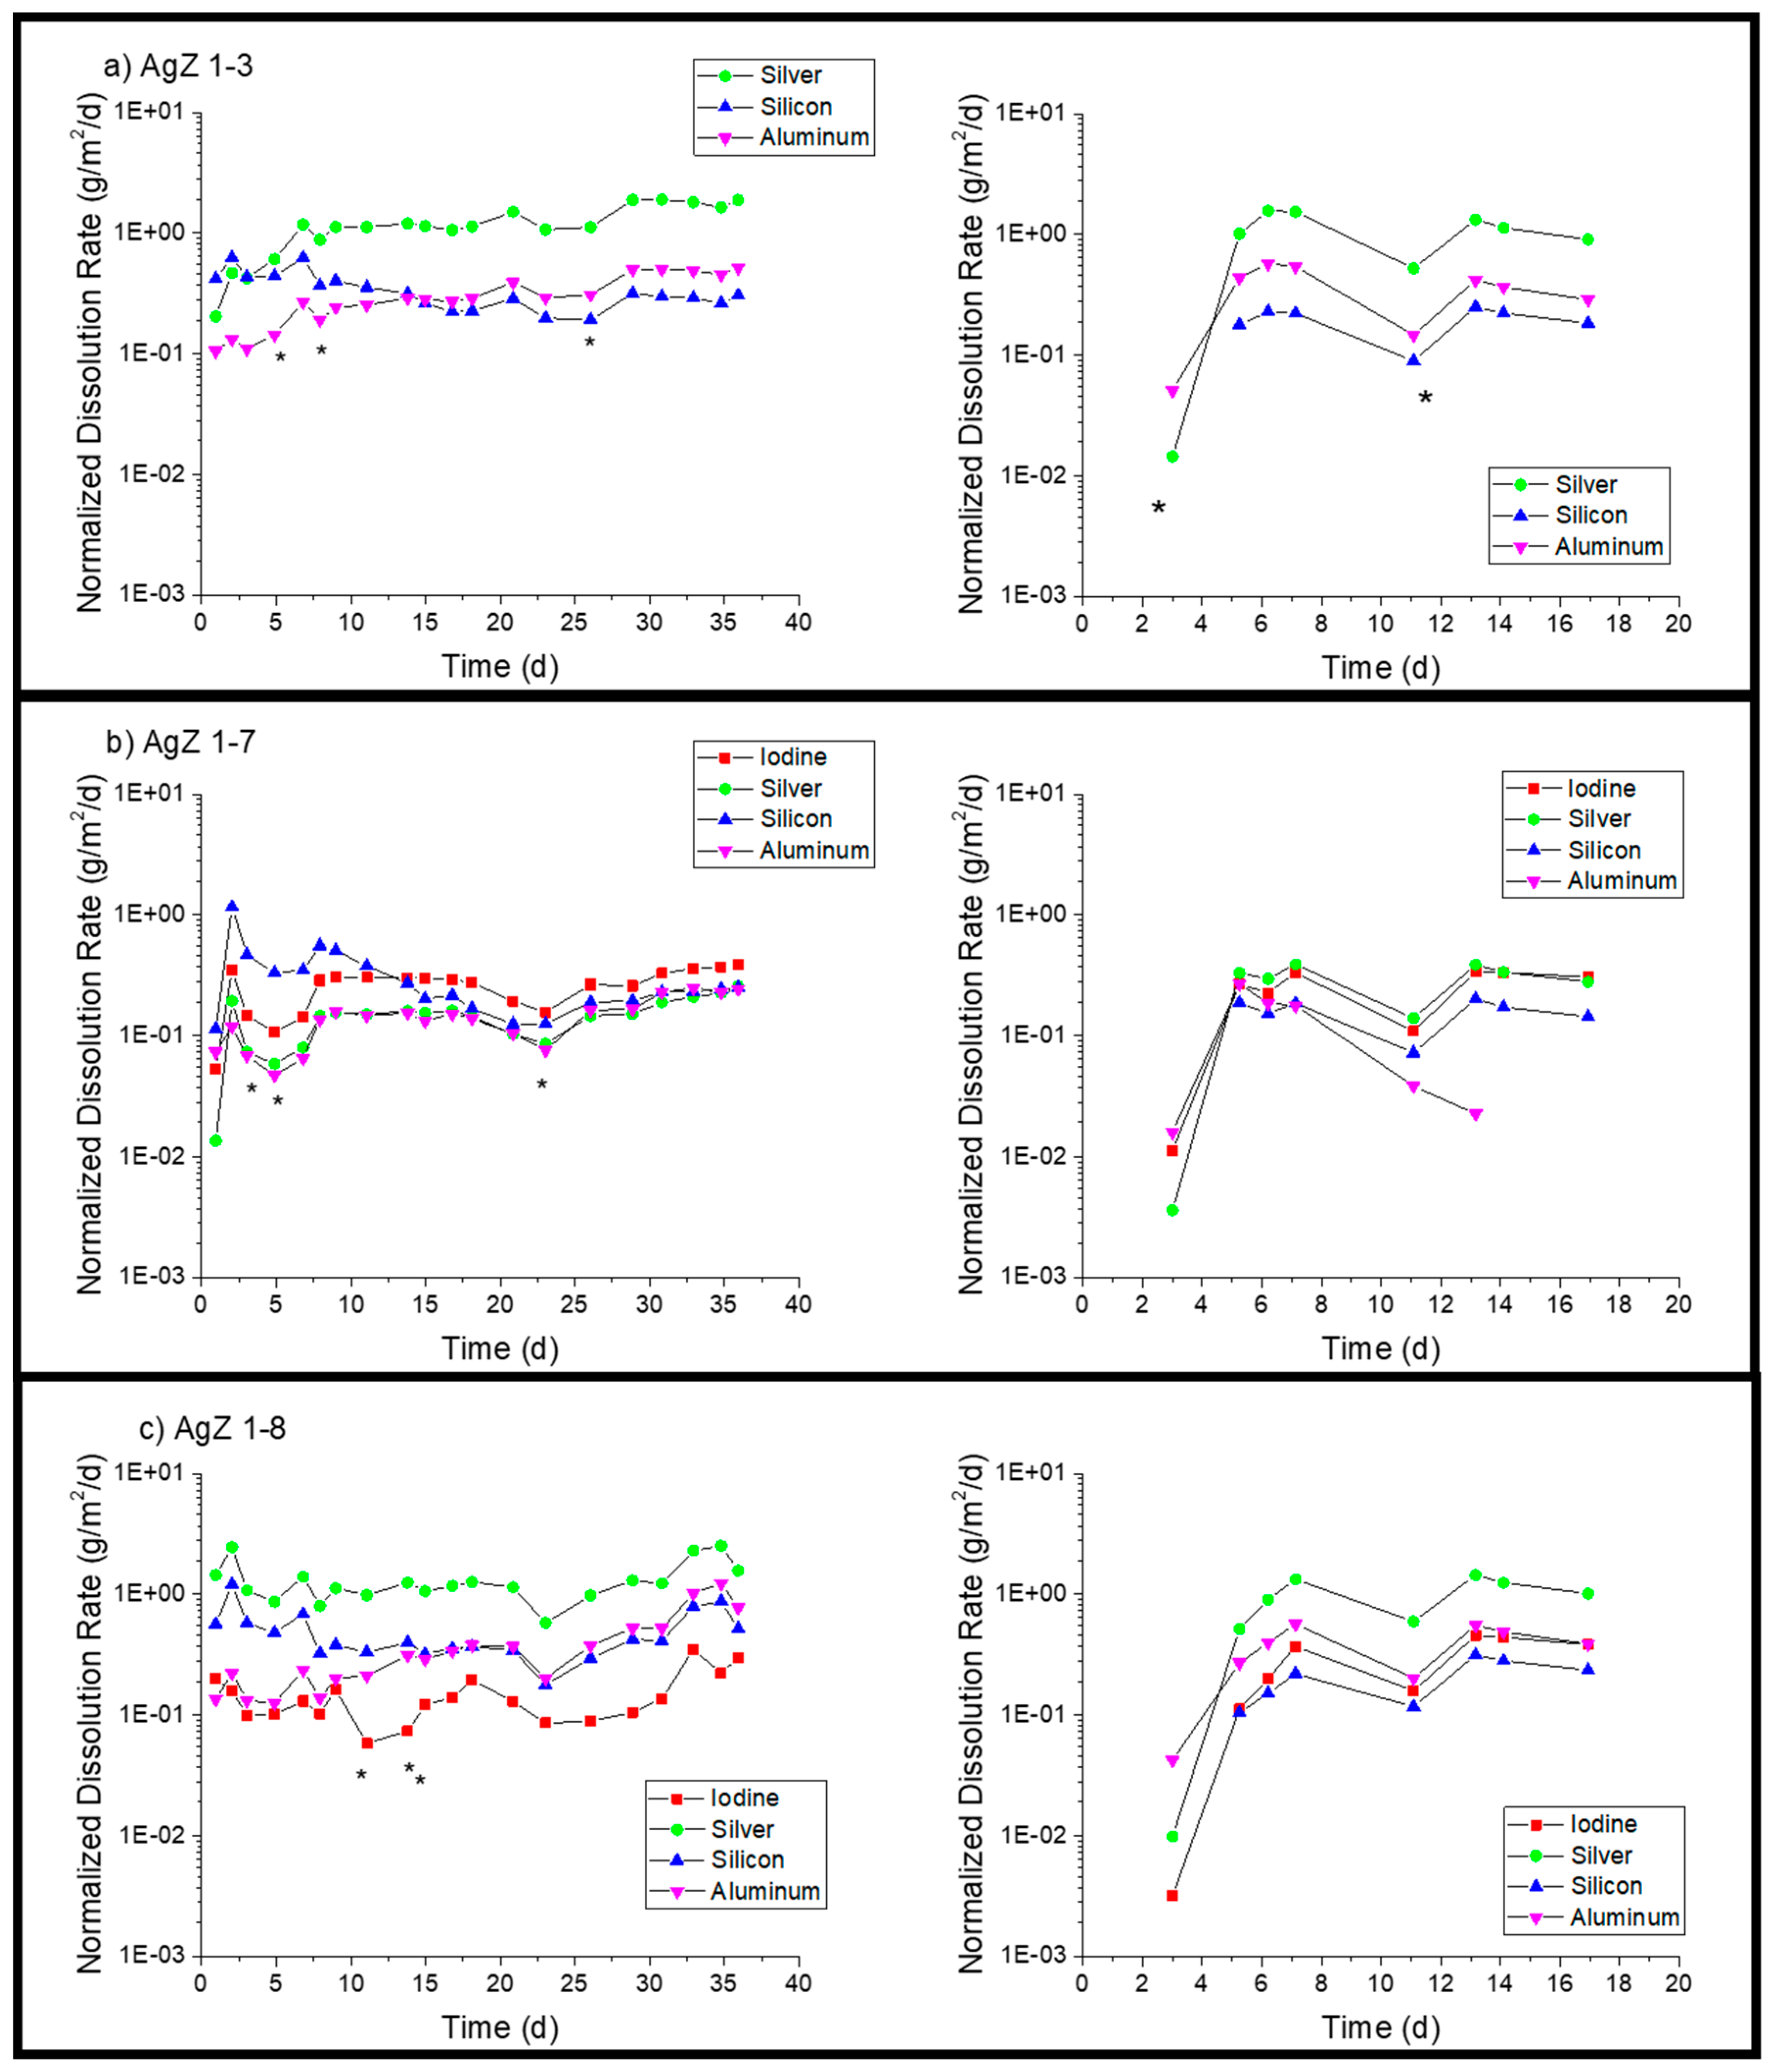
Figure 8 presents the AgZ normalized dissolution rates in pH 9 solution. With the increased alkalinity of the test solution measurable analyte concentrates were present in all effluent samples. AgZ 1-3 (
Figure 8a) showed a higher Ag dissolution rate (1.16 ± 0.49 g/m
2/day in the 36-day test and 1.01 ± 0.37 g/m
2/day in the 17-day test) compared with the Si dissolution rate (0.34 ± 0.12 g/m
2/day in the 36-day test and 0.19 ± 0.05 g/m
2/day in the 17-day test). The Al dissolution rates were measured to be 0.30 ± 0.13 g/m
2/day (36 day) and 0.30 ± 0.13 g/m
2/day (17 day). The AgZ 1-7 (
Figure 8b) showed I dissolution rates of 0.25 ± 0.09 g/m
2/day (36 day) and 0.27 ± 0.08 g/m
2/day (17 day), Ag dissolution rates of 0.14 ± 0.05 g/m
2/day (36 day) and 0.31 ± 0.08 g/m
2/day (17 day), Si dissolution rates of 0.31 ± 0.23 g/m
2/day (36 day) and 0.15 ± 0.04 g/m
2/day (17 day) and Al dissolution rates of 0.14 ± 0.06 g/m
2/day (36 day) and 0.13 ± 0.10 g/m
2/day (17 day). The AgZ 1-8 (
Figure 8c) showed I dissolution rates of 0.14 ± 0.06 g/m
2/day (36-day test) and 0.30 ± 0.14 g/m
2/day (17-day test), Ag dissolution rates of 1.32 ± 0.53 g/m
2/day (36 day) and 1.01 ± 0.36 g/m
2/day (17 day), Si dissolution rates of 0.49 ± 0.24 g/m
2/day (36 day) and 0.20 ± 0.08 g/m
2/day (17 day) and Al dissolution rates of 0.39 ± 0.30 g/m
2/day (36 day) and 0.41 ± 0.13 g/m
2/day (17 day). The measured dissolution rates at pH 9 in the 36-day tests and 17-day tests highlight the reproducibility using the SPFT technique. Similar to the pH 7 tests, the AgZ 1-3 and AgZ 1-8 samples showed similar dissolution rates with the rates for Ag being larger than the Si and Al. The AgZ 1-7 sample showed dissolution rates that tracked with one another for all four analytes. The I dissolution rates for AgZ 1-7 and AgZ 1-8 were similar despite the higher Ag dissolution rate for the AgZ 1-8. This would suggest some free Ag is generated at the higher HIP temperature of the AgZ 1-8 sample.
Moving to pH 11 (see
Figure 9), an expected increase in overall dissolution of the samples was observed with new trends in the elemental releases. The AgZ 1-3 (
Figure 9a) displayed an increase in dissolution rate until >7 days and the values measured beyond this were used to determine the average rates. The AgZ 1-3 sample showed higher Si dissolution rates (1.05 ± 0.21 g/m
2/day) than Ag (0.14 ± 0.05 g/m
2/day), which were different than rates for pH 7 and pH 9. The inversion of the two rates may have been due to the increased solubility of Si and potential decrease in Ag solubility (through formation of Ag
2O) with increased alkalinity [
31]. The Al dissolution rate was measured to be 0.49 ± 0.18 g/m
2/day. The AgZ 1-7 (
Figure 9b) showed a similar trend with a Si dissolution rate of 1.20 ± 0.32 g/m
2/day and an Ag dissolution rate of 0.09 ± 0.02 g/m
2/day. The I dissolution rate was measured to be 0.22 ± 0.02 g/m
2/day and the Al dissolution rate was 0.39 ± 0.18 g/m
2/day. AgZ 1-8 (
Figure 9c) showed a Si dissolution rate of 0.99 ± 0.46 g/m
2/day, an Ag dissolution rate of 0.81 ± 0.19 g/m
2/day, an I dissolution rate of 0.06 ± 0.02 g/m
2/day, and an Al dissolution rate of 0.52 ± 0.38 g/m
2/day. The last three sampling of the pH 11 test had a lower flow rate through the reactor and conditions within the reactor may have changed, leading to the stark decreases observed after 14 days.
Based on the solution data presented above, an incongruent dissolution of the sample surface is likely occurring. The different phases of the heterogeneous microstructure shown in
Figure 1,
Figure 2 and
Figure 3 can each corrode independently of one another. The monolithic samples were imaged following SPFT testing to observe any physical changes on the sample surface. Using SEM, no observable changes were present on the AgZ samples following the pH 7 and pH 9 tests. Following the pH 11 tests, noticeable changes were present on the AgZ samples.
Figure 10 shows the AgZ sample surfaces before and after the pH 11 exposure. The AgZ 1-3 sample (
Figure 10a) appears to have corroded at the secondary phases and not the continuous Si matrix. The Ag particles (bright spots) appeared larger following corrosion as the higher alkalinity environment may increase their stability while the rest of the material corrodes. Based on the Pourbaix diagram for Ag, above pH 9 AgO becomes a stable phase for Ag and such a process may be occurring in the pH 11 tests [
32]. For the AgZ 1-7 sample (
Figure 10b), the secondary phases also appeared to have corroded. This observation is best exemplified by the rhomboid-shaped particle in the left center of the image, which was a K-rich particle. Following corrosion, the sharp edges of this phase had disappeared. The AgZ 1-8 sample also showed attack of the secondary phases and, similar to the AgZ 1-3 sample, an apparent growth of the Ag-containing particles (
Figure 10c). The SEM micrographs suggest that corrosion preferentially occurred at the secondary phases, yet this was only observed from a two-dimensional view.
Optical profilometry was used to observe the three-dimensional (3D) profile of the AgZ samples following the SPFT experiments (
Figure 11). At pH 7, all three samples showed only minor surface topography. In fact, the surface had retained enough of its polished nature to make it difficult to create the proper reflection to image at higher resolution, and as a result, a lower magnification image is shown. At pH 9, the surface morphology resembled what was suggested by the SEM images in
Figure 10. Here, the lowest points on the surface were found to be the secondary phases for all three samples. The shapes and distributions of the phases suggest that these are the alkali- and alkaline-earth-rich phases shown in
Figure 2,
Figure 3 and
Figure 4. At pH 11, more extensive damage was observed and the AgZ 1-7 sample could not be fully resolved to generate a 3D image.
XRD analysis of the AgZ samples following testing at pH 9 and pH 11 showed no substantial difference (spectra not shown) to the starting material [
26]. Following the test, the sample surface was composed of a mixture of silicon oxides, Ag metal, and AgI (
Table 4). It should be noted that the XRD mode used generated excitation volumes between 5 µm and 50 µm and the information within this table includes the signal from the surface and inner sample in the excitation volume.
3.3. Corrosion Testing of Spark Plasma Sintered Silver-Functionalized Silica Aerogels
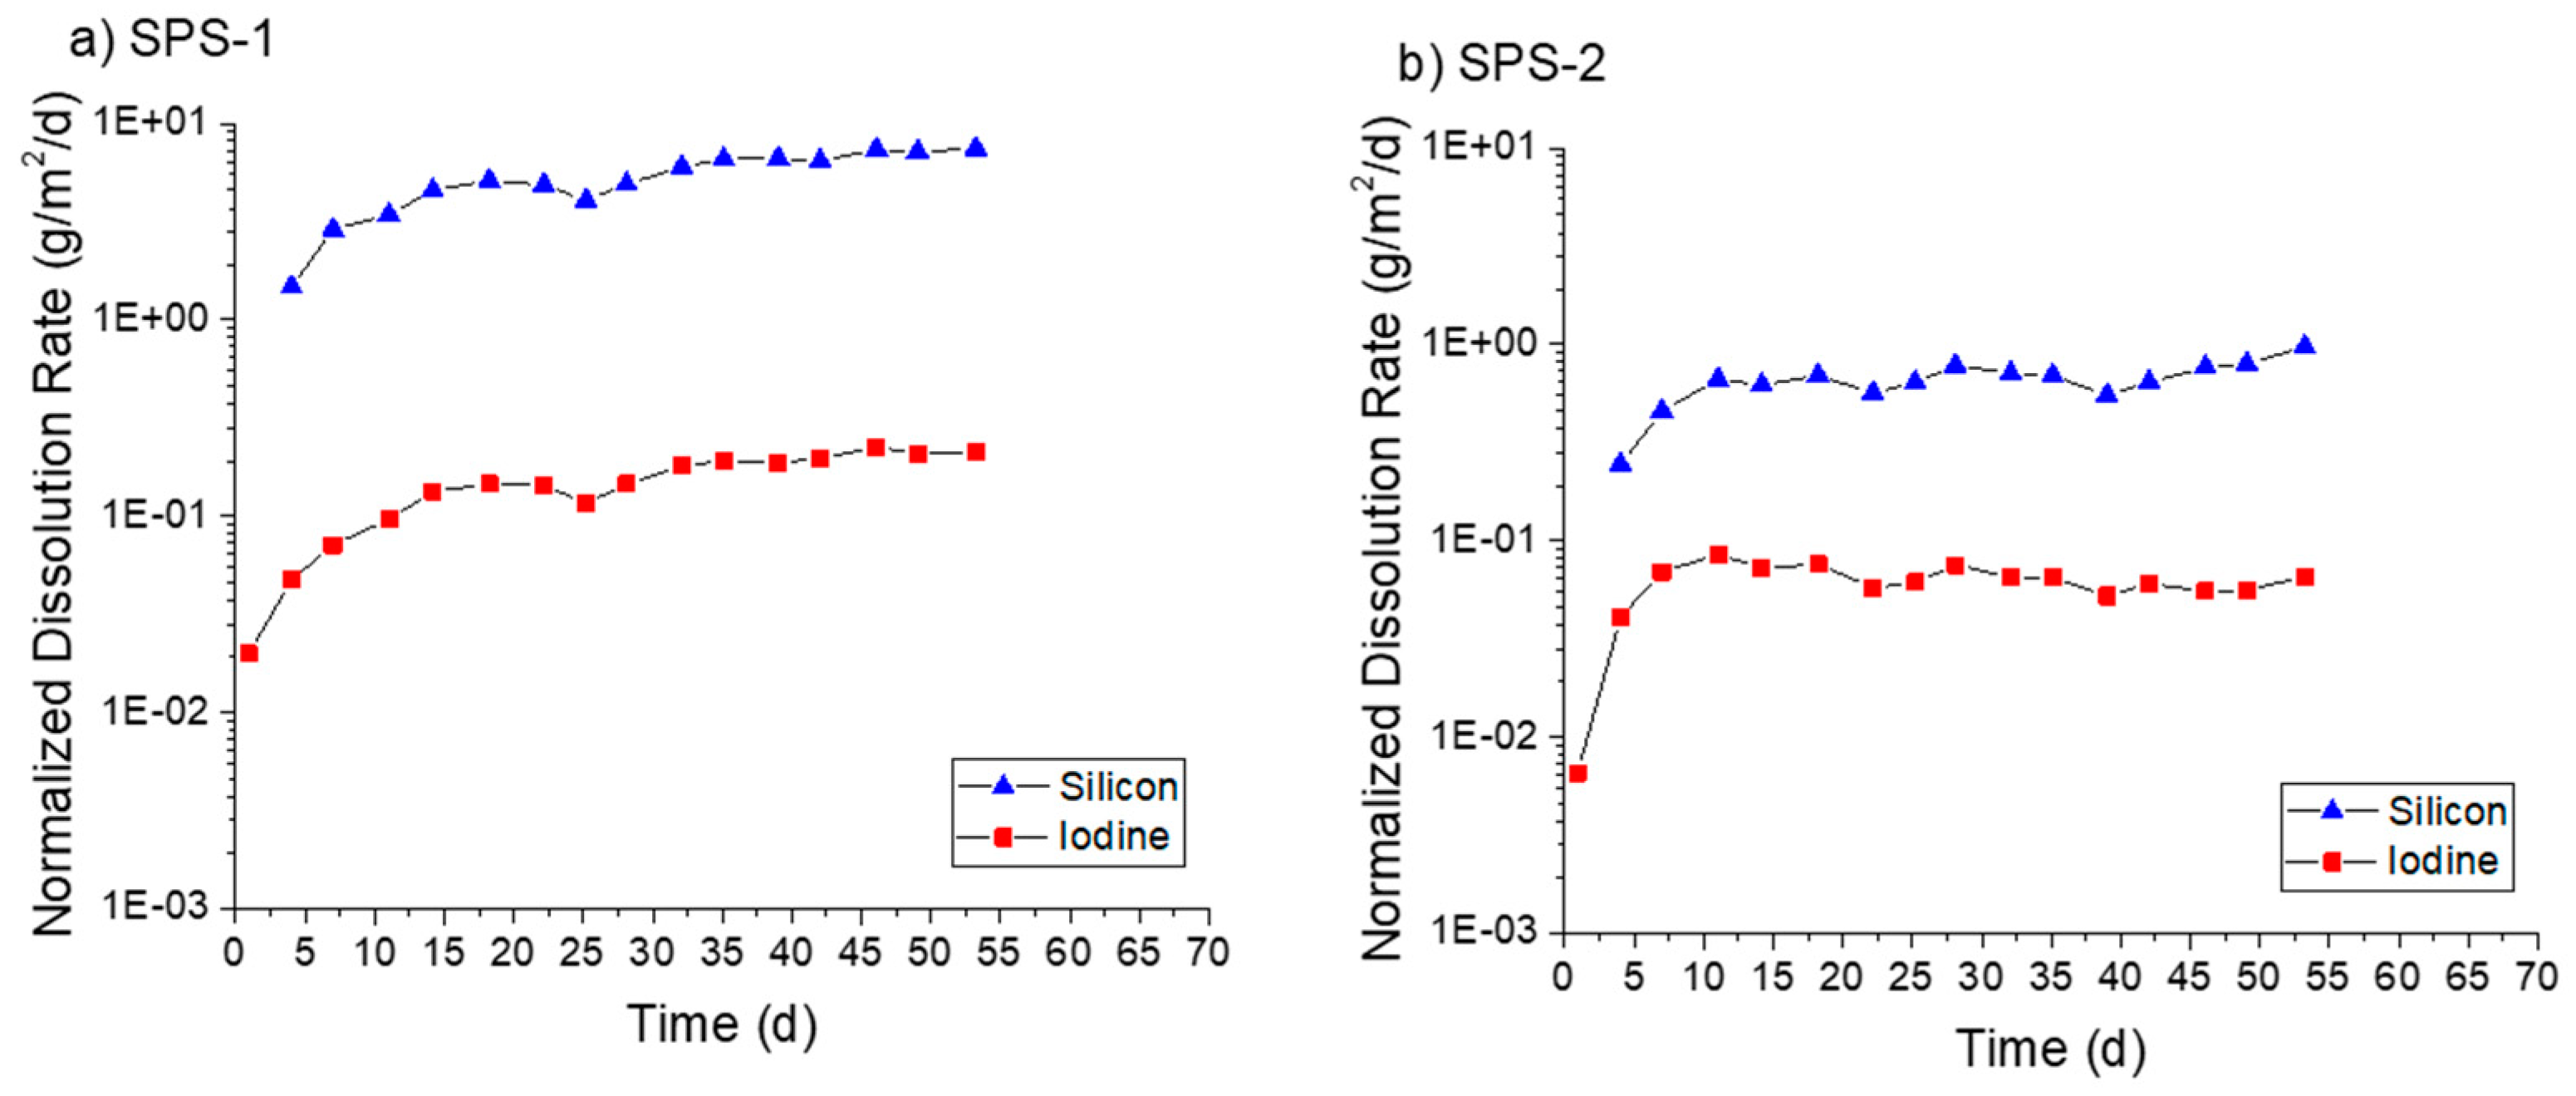
The densified SFA materials were tested using the SPFT method in a similar fashion to the AgZ. In pH 7 solution (
Figure 12a), the SPS-1 sample experienced consistent dissolution, with an average Si dissolution rate of 4.49 ± 1.52 g/m
2/day and an I dissolution rate of 0.12 ± 0.05 g/m
2/day. The SPS-2 sample (
Figure 12b), with higher Si content, measured lower Si dissolution rates averaging 0.65 ± 0.16 g/m
2/day and I dissolution rates measuring 0.06 ± 0.02 g/m
2/day. No Ag release was measured at pH 7 for either sample.
In pH 9 solution (
Figure 13), both samples showed a continual increase in dissolution rate with time. At the conclusion of the test on the SPS-1 sample (
Figure 13a), the measured Si dissolution rate was 4.67 g/m
2/day and the measured I dissolution rate was 0.37 g/m
2/day. The SPS-2 sample (
Figure 13b) showed a Si dissolution rate of 1.26 g/m
2/day and an I dissolution rate of 0.56 g/m
2/day. Only at the conclusion of the test was Ag measurable for the SPS-1 sample, corresponding to an Ag dissolution rate of 0.02 g/m
2/day. No Ag release was measurable for the SPS-2 sample.
At pH 11 (
Figure 14a), the SPS-1 sample measured an average Si dissolution rate of 33.3 ± 5.6 g/m
2/day and an I dissolution rate of 1.04 ± 0.56 g/m
2/day prior to the decrease at the final interval. The SPS-2 sample (
Figure 14b) showed a Si dissolution rate of 10.21 ± 1.73 g/m
2/day. The I release was initially low before increasing past seven days. After this increase, the average I dissolution was measured at 0.54 ± 0.16 g/m
2/day. Ag was measured in the effluent at two time points for the SPS-1 sample equaling an Ag dissolution rate of 0.02 g/m
2/day.
In all cases, the Si dissolution rates measured for SPS-2 were lower than those for SPS-1. The SPS-2 sample had additional Si added (as raw SFA) prior to sintering to improve durability and this methodology appeared to be successful. With the exception of the SPS-2 at pH 9, the I dissolution rates were also lower than the Si dissolution rates for the SFA samples. The microstructure of the SFA samples had areas of higher Si without any I present. Dissolution of those particles may have caused the higher Si dissolution rates, and more-so if the Si isolations were less durable than the matrix. The minimal release of Ag observed may be a result of the S presence in the SFA. AgS is a very insoluble compound and it is possible that dissolved Ag can become associated with S and be retained on the surface.
As with the AgZ samples, there were observable changes on the SFA surfaces following pH 11 exposure. SEM-EDS analysis performed on SPS-1, shown in
Figure 15, provided some insight as to the retention of Ag during the testing of the SFA samples. In the SEM micrographs (
Figure 15a), the large Si particles in the uncorroded image (those depleted in Ag and I) were heavily corroded, the large particle in the upper right being a perfect example. The attack appeared to have moved from the outer edge of the particles inward. The Ag remained evenly distributed following corrosion while some new Ag particles also appeared (
Figure 15b). The I-rich particles in the uncorroded image near the large particles had disappeared in the corroded image (
Figure 15c). The dissolution of the large particles likely drove the I-release. The most prominent change, however, is the increased definition of S in the image following corrosion (
Figure 15d). After corrosion, a large particle has been exposed or generated that also contained Ag (
Figure 15b) and I (
Figure 15c). The appearance of the Ag-S-containing particles coordinated with I (see the large particle in the center of the corroded images) suggests that S may be responsible for the low Ag release and present a possible mechanism for improving I-retention in the sintered SFA. Previous work has shown that S behaves as a redox control agent over the Ag [
33]. More work is planned to pursue understanding of this possible mechanism.
For the SPS-2 sample, clear corrosion attack of the Si-rich particles was observed (
Figure 16a), with the large particle in the center of the image being almost fully removed. An AgI particle was observed in the center of the non-corroded image (
Figure 16b,c). Following corrosion, this particle was more visible as a result of the Si matrix removal around the particle. Other large AgI isolations behaved similarly in the images. Compared with the small AgI particles at the boundaries of the Si-particles in SPS-1 that were removed, large AgI isolations appeared to be retained better on the surface of the SPS-2.
The change in overall surface roughness of the SFA samples based on exposure pH can be observed in the optical profilometry images shown in
Figure 17. For both the SPS-1 (
Figure 17a) and SPS-2 (
Figure 17b), following exposure at pH 7, the surface was notably roughened compared with the polished surface. The suppressed regions of the sample following corrosion appeared to be isolated and would suggest a similar dissolution pathway targeting the Si particles, as was observed at pH 11 in the SEM images. The surface was heavily corroded at pH 11.
3.4. Comparison to Other Materials
Dissolution rates for Si-based materials in SPFT testing are highly dependent on the flow to surface area (
q/
S) ratio. This can limit direct comparisons between the dissolution rates measured for materials in different SPFT testing efforts. However, any comparative assessment of the overall durability of IWFs should be made against other material types under investigation for the long-term disposal of nuclear wastes. Other iodine-containing waste forms have been tested with SPFT but the tests were performed with differing conditions. Neeway et al. performed SPFT on iodine-containing fluidized bed steam reforming (FBSR) material at 40 °C and at far lower
q/
S (largest being 3 × 10
−4 m/day) than this work [
34]. Higher temperature dissolution data on FBSR material (without iodine) has been reported but the
q/
S used in the testing was not included [
35]. Mowry et al. used a small-volume SPFT design to assess the durability of low-temperature Bi-Si-Zn oxide glass-composite materials (GCM) that contained AgZ [
36]. The experiments focused on solutions with pH < 7, a maximum temperature of 60 °C and a
q/
S of 2 × 10
−4 m/day. An iodine-containing glass (BNDL-A-S98) was investigated with SPFT at 90 °C but the raw data is not available in the report to compare the
q/
S values [
37]. The best available comparisons are works on the dissolution of high-level nuclear waste glasses [
38] and glass ceramic waste forms [
39] where SPFT tests were performed (on powdered samples) at 90 °C in pH 9 and pH 11 solutions with similar
q/
S values to this work. The glass ceramic waste forms were multi-phase, borosilicate-based materials comprised of a borosilicate glass matrix with crystalline powellite and oxyapatite phases within. A summary of the normalized dissolution rates determined in this study as well as the comparative examples is given in
Table 5. The three high-level waste glasses AFCI, ISG, and SON68 had Si dissolution rates of 0.350 g/m
2/day, 0.154 g/m
2/day, and 0.369 g/m
2/day, respectively, while the glass-ceramic waste form had a Si dissolution rate of 3.39 g/m
2/day in pH 9 tests. The highest pH 9 dissolution rates in the current study were 0.20 g/m
2/day for AgZ 1-8 and 4.67 g/m
2/day for SPS-1. This comparison suggests that the Si-matrices of the IWFs in the study are as durable as other Si-based waste form materials at pH 9. At pH 11, ISG had the highest Si dissolution rate at 3.44 g/m
2/day while AgZ 1-7 had a Si dissolution rate of 1.20 g/m
2/day and SPS-1 was higher at 33.3 g/m
2/day. The limited number of available datasets to directly compare IWF durability highlights the need for a standardized test to be defined to assess IWFs on an even playing field and to provide data to be used in long-term modelling predictions of IWF durability upon disposal.

 ,
, 


