1. Introduction
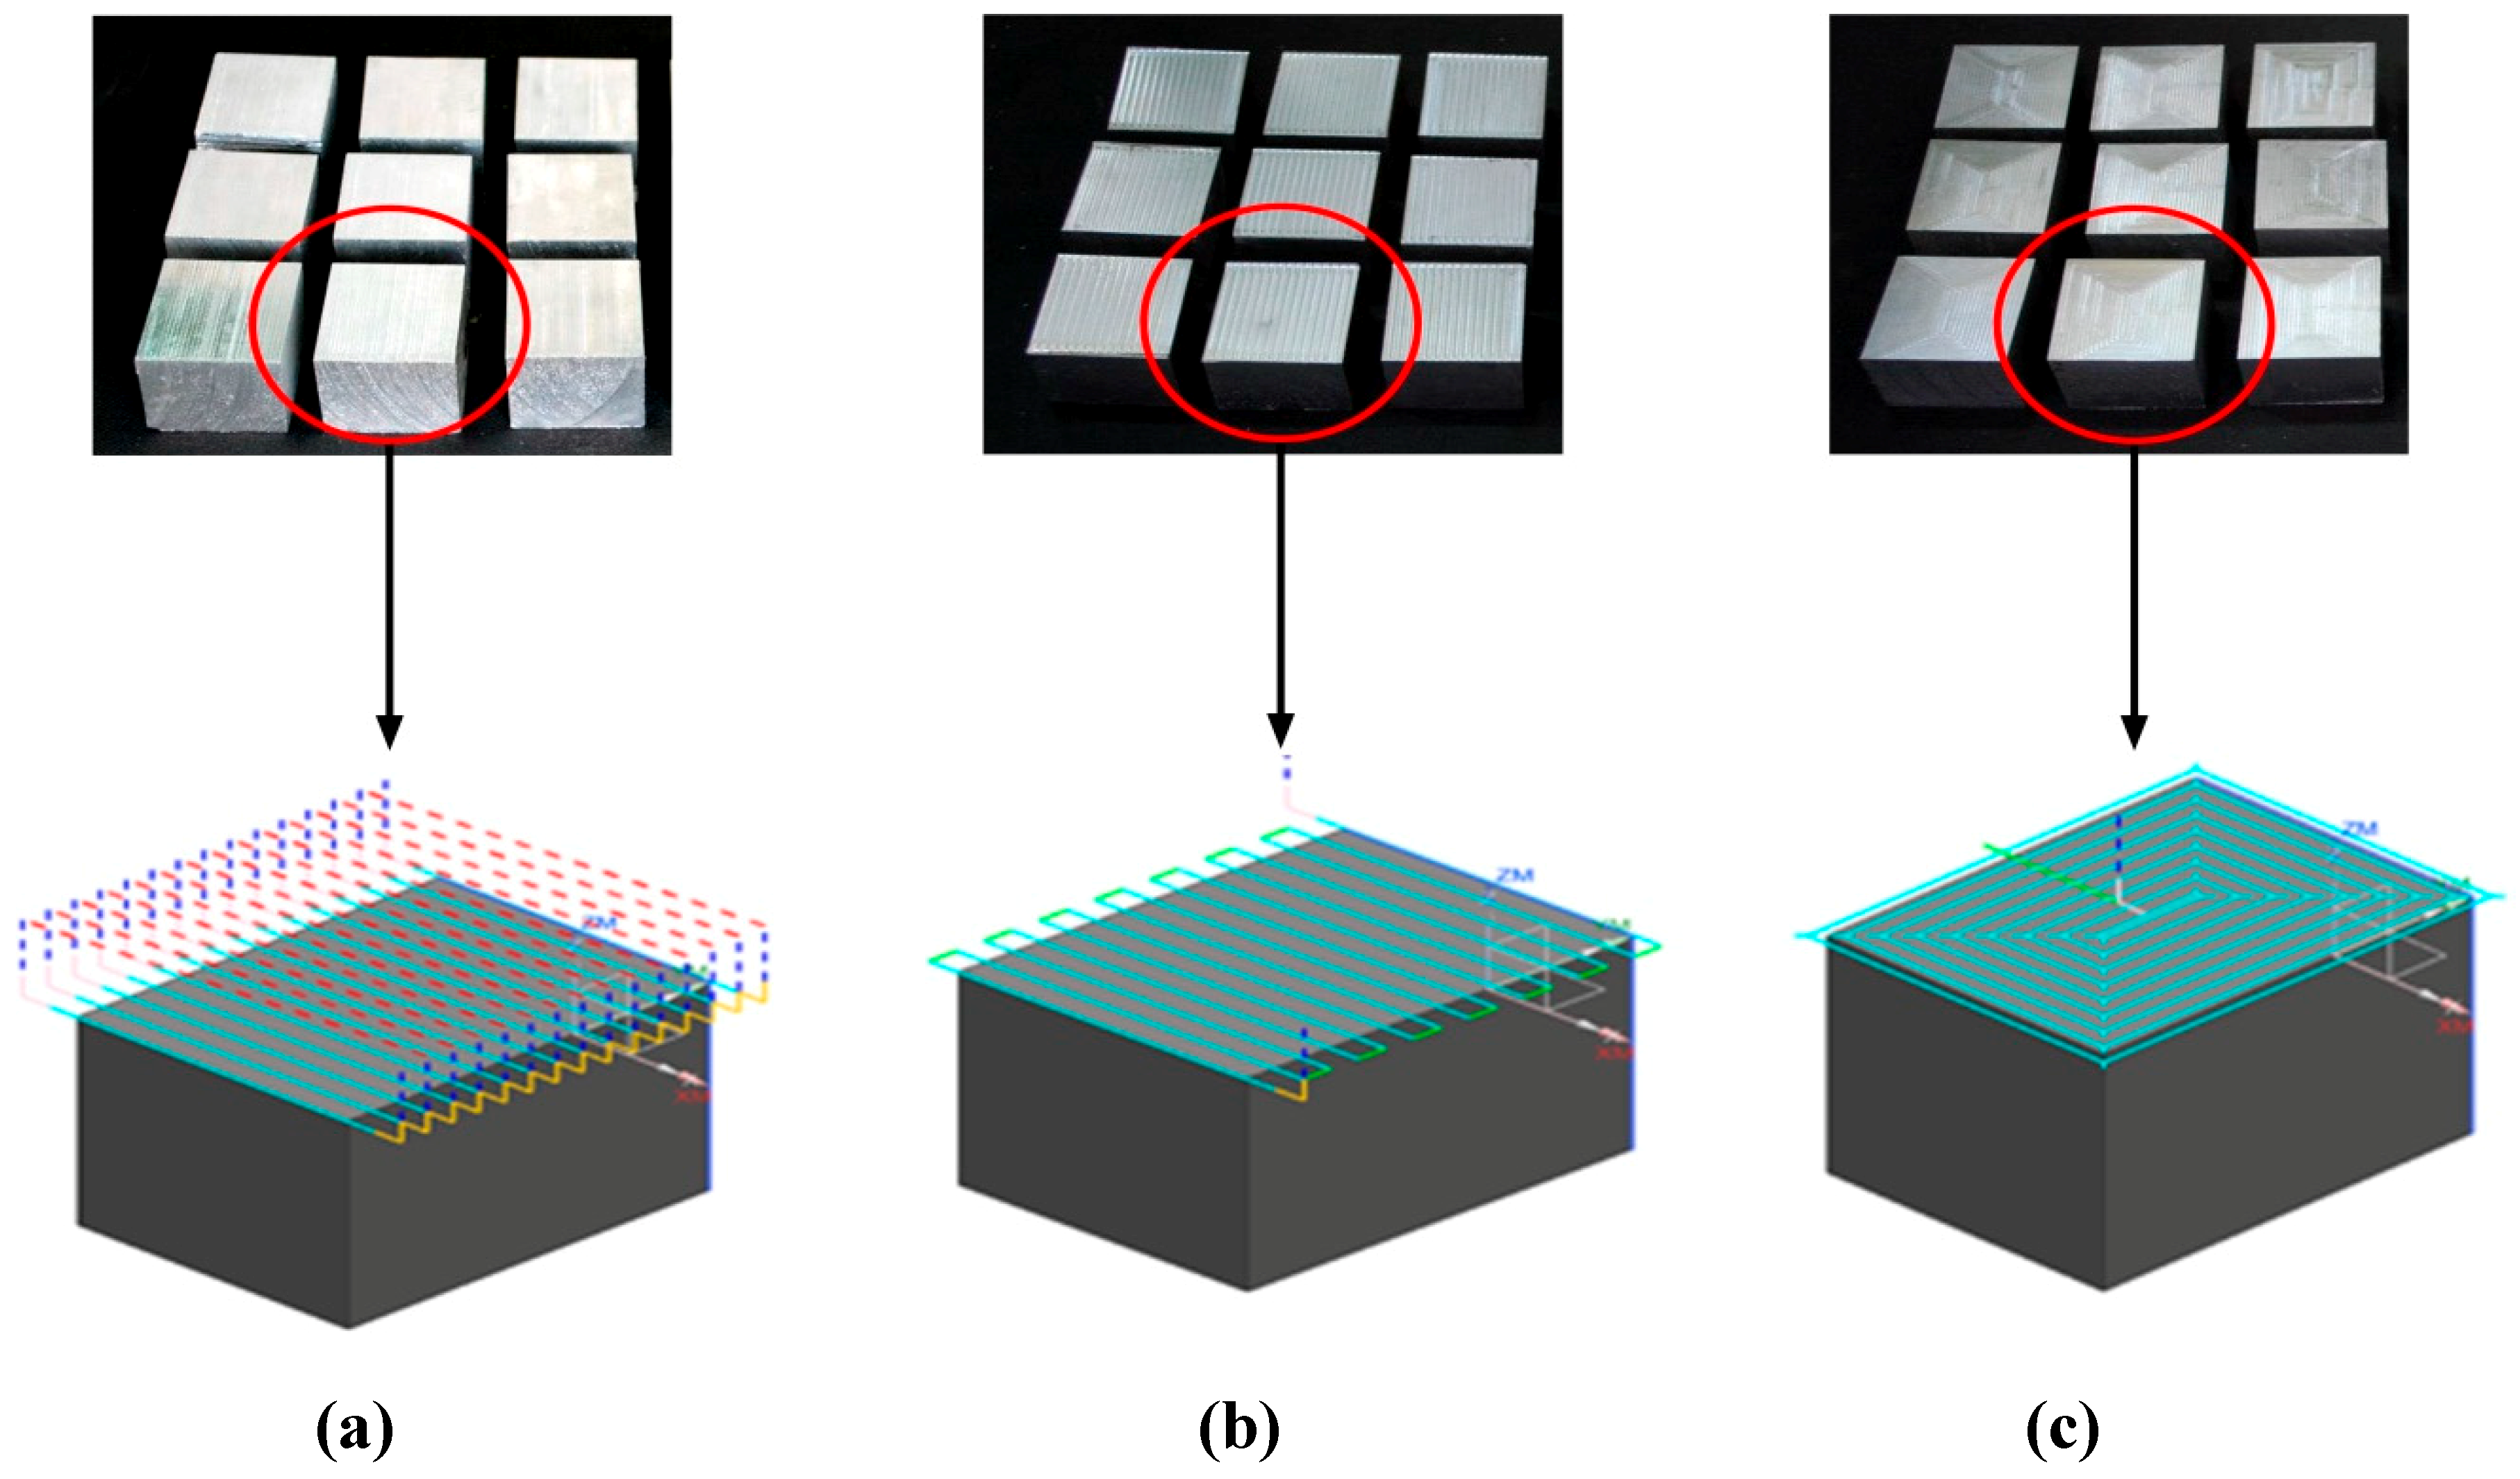
Due to the importance of the finishing stage in the manufacturing processes, the face milling process is the solution that can be used to achieve good surface quality and high accuracy in a short period of time. To achieve the high quality for the desired parts, studying the tool path strategies is inevitable too. The most common cutter path strategies in the milling process are zig, zig-zag, and contour, which can be created with the help of a computer-aided manufacturing system (CAM). Furthermore, the tool path generation is the prime issue in the different stages of NC machining that determines not only the quality of the desired shapes but also the performance of the manufacturing process [
1,
2]. Consequently, the optimization of tool path would contribute to improving the sufficiency of the milling process [
3].
The application and selection of tool path types and directions are crucial issues in the milling of the die and aerospace industries. Moreover, the intact selection may lead to reduce the machining time and enhance the surface quality of the milling parts, hence leading to higher productivity and lower product costs. Toh [
1] addressed a comprehensive review of the three most common cutting path strategies, i.e., offset, zig, zig-zag. The analytical study, effect of tool angle at the entrance and exit, and the inclined milling effects were evaluated with respect to the three previous tool path strategies. The better surface quality and optimum tool life were found with the inclination angle of 15°. Monreal and Rodriguez [
2] studied the effect of tool path strategy on the cyclic time in the high-speed milling process. Based on experimental observation, the mechanical model is constructed to evaluate the cyclic time for a raster path strategy. Rangarajan and Dornfeld [
3] showed that the features of part orientation and tool path in face milling operation with 10%–20% saving in cyclic time by using the feed rate profile. Lazoglu et al. [
4] introduced a new approach to generate the optimum tool path strategy for free-form surfaces. The optimization process was based on the determination of the tool path with minimum machining force which should not exceed the maximum limit. Kim et al. [
5] proposed an algorithm to optimize the contour tool path while considering the cutting force and vibration. The optimization was performed for two-dimensional parts with a flat end mill tool. The material removal rate and cutting forces were kept constant to prevent the vibration in the milling area. Ramos et al. [
6] studied the influence of three tool path strategies called radial, raster and 3D offset on the surface roughness, texture and dimensional deviations of the free-form surface. They revealed that the milling time was not significantly different for the used strategies. However, the last strategy showed the best surface finish, uniform texture and dimensional performance, which confirmed the dependency of this strategy in free form surface machining. Quinsat and Sabourin [
7] developed a methodology to select the optimal tool path strategy with a guarantee of high-level surface quality. This methodology based on the directional beams, which represented the feed directions to ensure the maximum performance for the strategy chosen.
Recently, due to increasing demand for manufacturing the complex parts with a large scale, the robotic milling system is used to perform this function. In this trend, many works have been achieved to improve the surface roughness and geometrical deviations, taking into consideration the optimum selection of cutter path strategies which confirmed the significance of the tool path not limited to the CNC milling process but also to the robotic system. Unnikrishna et al. [
8] studied the tool path strategies of Al6005A alloy in the milling process of the 6-axis robotic system. The optimization has been performed using the Taguchi-Grey relational method. Tunc and Stoddart [
9] addressed the tool path patterns in robotic milling. In this study, the zig tool path in two different feed directions and contour tool path are considered.
Conventionally, the optimization of process parameters is based on the trial-and-error method—it needs more time and cost. Hence, the optimization technique, which is able to predict the quality and quantity of machining characteristics, is required. Balajia et al. [
10] optimized drilling parameters of Ti-6Al-4V on surface roughness, flank wear and drill vibration using response surface methodology. Similarly, the study performed by Mia et al. [
11] used the Taguchi based GRA methodology to obtain the optimum turning parameters of AISI 4140 that gave the best surface roughness for the machined parts.
Taguchi based grey relation analysis has been adopted to predict surface roughness due to the versatility of this technique in different industrial processes. Asiltürk and Akkuş [
12] have carried out the CNC turning experiment using the Taguchi method in order to minimize the surface roughness. The Taguchi method for finding out the optimal value of surface roughness under an optimum cutting condition in turning SCM 440 alloy steel was applied by Thamizhmanii and Sulaiman [
13]. Recently, multi-objective optimization was used to enhance the surface roughness and energy consumption in the face milling process. The results revealed that the reduction in the energy consumption was about 20.7% when using nano fluid assisted milling [
14]. Ranganathan and Senthilvelan [
15] investigated the optimization of cutting parameters of stainless steel (Type 316) in hot turning using Taguchi based GRA. Pawade and Joshi [
16] studied the optimization of turning parameters of Inconel 718. The Taguchi grey relational approach is used to determine the optimum process parameters that produced the minimum cutting force and surface roughness.
Researchers have worked on milling processes to improve the performances from multivarious dimensions such as the tool wear, surface quality and the cutting forces. Twardowski et al. [
17] studied the effect of tool wear and tool life in the high speed milling process. They used coated carbide and cubic boron nitride cutting tools and they observed that, for cutting speeds over than 500m/min the cutting tool with edges of boron nitride must be used in the milling process. Krolczyk et al. [
18] determined the surface topography of the coated carbide tool in the turning process. They found the predominant failure mechanism and the main reason behind the reduction of tool life was the flank wear of the carbide tool.
Response surface methodology, Grey relation analysis, and Taguchi methodologies were commonly adopted in the milling process to predict the surface roughness, material removal rate and machining time. The obtained results confirmed the sufficiency of these techniques to predict machinability characteristics. Grey relation analysis has been adopted to optimize cutting parameters, namely milling type, spindle speed, feed per tooth, radial depth of cut, and axial depth of cut in the high-speed milling process. Based on the results of the analysis, a proper evaluation for material removal rate and tool life has been achieved corresponding to milling type, spindle speed, and feed per tooth with 79% desirability, reported by Lu et al. [
19]. Different cooling conditions assisted milling processes have been conducted to optimize quality characteristics using a response surface approach [
20]. Kuram and Ozcelik [
21] conducted an experimental study to find the desirable cutting parameters in micro-milling of Aluminum 7075 using a ball end tool. The optimization process for tool wear, cutting force and surface roughness has been performed using Taguchi based Grey relation analysis. The results indicated that the minimum values of tool wear, cutting force, and surface roughness were mostly affected by spindle speed, followed by feed per tooth and depth of cut. Rajeswari and Amirthagadeswaran [
22] developed a model to predict the surface roughness, tool wear, cutting force and MRR using response surface methodology and grey relation analysis in end milling of aluminum composites. The experimental results revealed that the weight proportion of SiC and cutting speed are the most important parameters that influenced the machinability of material composites. Wojciechowski et al. [
23] proposed a new method to improve the efficiency of the machined surfaces in the end milling process. They minimized the cutting force and increased the surface quality during the optimization process of the machining parameters.
Face milling under the semi-finishing stage was conducted in order to evaluate the surface roughness and cutting power using different lubricant conditions. Zhang and Chen [
24] optimized the surface roughness in the face milling operation based on the Taguchi method. The results indicated that the depth of cut has the minimum effect on surfaces roughness compared to cutting speed and feed rate while the tool wear is statistically affected. Hashmi et al. [
25] studied the single objective optimization of surface roughness using response surface methodology. The predicted model suggested that the depth of cut is the most critical parameter that affects the surface roughness in the machining process. Recently, Felhő and Kundrák [
26] examined 2D and 3D roughness parameters of the machined surfaces with constant depth of cut in the face milling process. They analyzed the topography of the surface with considering the increasing of the feed per tooth and axial run-out of the inserts. The results indicated that the use of single insert face milling leads to worsen the surface with increasing the feed per tooth and the decrease in surface roughness about 1.44–7.71 times when the four-insert face milling considered. In addition to the most common machining parameters, Tseng et al. [
27] predicted the effect of the cutting fluid, nose radius and cutting forces upon the surface roughness in end milling. The prediction process was included in two approaches. Firstly, the analysis of variance was implemented to determine the significant of the process parameters and the interactions of the parameters was neglected due to the impossibility of achieving them in practice. Secondly, fuzzy logic was implemented to predict the surface roughness with an accuracy of 95% compared with the experimental results. The effect of feed rate variation and insert runout errors on the surface roughness and geometric accuracy evaluated by Baek et al. [
28] during the face milling process. Moreover, they developed a model for surface roughness and controlled the roughness of the machined surface by optimization of feed rate with a max material removal rate using the bisection method. The results pointed out that the relation between the surface roughness and the feed rate resulting from the runouts was nonlinear and to get the predicted roughness, the insert runout errors should be determine beforehand. In dry face milling process of selaimia et al. [
29], modeling and optimization processes were achieved using a response surface methodology and desirability function. The modeling was performed with considering surface roughness, cutting power, cutting force, specific cutting force and metal removal rate. The results showed that the surface roughness is only influenced by feed per tooth while the material removal rate is influenced by both of feed per tooth and axial depth of cut. To assess the surface roughness of the surfaces sculptured by face milling, a general mathematical model was developed by Miko and Nowakowski [
30] with considering tool geometry, undeformed chip thickness, tool vibrations, tool runout and tool wear. They reported that the feed rate has a significant influence on the surface roughness with small cutting tool and this significance becomes greater with a decrease in the relative displacement and deformed chip thickness as well.
From the previous studies, it is appreciable that the optimization of the tool path is still a critical key in different milling processes so that more studies should be implemented to achieve a better quality for the manufactured parts to meet the industrial requirements. The objective of this paper is to improve the surface quality in the face milling process with the use of torus end mill. This article focused on the optimization of the three most common tool path strategies taking into consideration the machining time and material removal rate. The optimization process was performed based on a grey relation technique with different process parameters; hence, the optimum tool path was found based on the conditions used in this study. The optimization procedure is explained in detail in the following sections.
3. Grey-Relation Analysis
To overcome the disadvantage of the Taguchi method which has the inability to solve a multi-response optimization problem, the Taguchi method with grey relation analysis (GRA) is combined to convert the multi-objective optimization into a single objective problem. The procedure required for the GRA analysis is delineated as follows:
After performing the experiments, the data are normalized from 0 to 1 [
33]. To achieve the best surface quality with minimum time, and maximum material removal rate “the-higher-the-better” and “the-lower-the-better” conditions are chosen respectively as follows in Equations (2) and (3).
where
xi(
k) is the response after linear normalization,
yi(
k) is the experimental response, min
yi(
k) is the smallest value of
yi(
k) and max
yi(
k) is the largest value of
yi(
k).
The following step is used for calculating the grey relation coefficient, which represents the relevance between the ideal and actual experimental results after the normalization process; the Equation (4) can be used
where Δ
0i(
k) represents the absolute value of the deviation between
y0(
k),and
yi(
k), Δ
min and Δ
max are the smallest and largest values of Δ
0i(
k) respectively. ϕ is the distinguishing coefficient. The value of ϕ is defined as ϕ ∈ [0,1].The different values of the ϕ give different values of grey relation coefficients; however, the rank order of GRC, is, always the same [
34]. In this study, the value of ϕ is considered as 0.5.
The last step is calculating the average value of GRC (i.e., GRG (Υ
i)) which is defined as in Equation (5).
where
wk indicates the weight of the
kth experimental response. In the current study, the weights for surface roughness, material removal rate, and cutting time are 0.3626, 0.2928, and 0.3446 respectively which are calculated using the entropy method [
35], as shown in
Table 5. The max value of GRG indicates that the process parameters at that value are close to the optimum one [
36]. In
Table 5, the max value of GRG is corresponding to trail No. 9, which refers to A3B3C3D1 as the best combination of input factors.

 ,
, 


