Article

Interfacial Microstructure in W/2024Al Composite and Inhibition of W-Al Direct Reaction by CeO2 Doping: Formation and Crystallization of Al-Ce-Cu-W Amorphous Layers

Advanced Electronic Materials Institute, GRIMAT Engineering Institute Co., Ltd., No.11 Xingkedongda Street., Beijing 101407, China
*
Author to whom correspondence should be addressed.
Materials 2019, 12(7), 1117; https://doi.org/10.3390/ma12071117
Submission received: 8 March 2019 / Revised: 1 April 2019 / Accepted: 1 April 2019 / Published: 4 April 2019

Abstract

:
In this work, interfacial microstructure in W/2024Al composite and inhibition of the W-Al direct reaction by CeO2 doping were investigated. The composites were prepared through powder sintering, and after preparation the composites were treated by annealing at 823 K. For the prepared W/2024Al composite, a multi-phase thin layer composed of WAl12 and WAl5 compounds were formed at the interface due to the W-Al direct reaction. While doping CeO2 in the composite, Al-Ce-Cu-W amorphous substituting of W-Al compounds were formed at the interfacial reaction layer. In an annealed state, the composite with CeO2 doping shows a significant inhibitory effect on W-Al compounds, which was attributed to the crystallized layer that evolved from Al-Ce-Cu-W amorphous as an interfacial obstacle. The crystallization product for Al-Ce-Cu-W amorphous layer was identified as bcc-structure Al-Ce-Cu-W phase without any binary/ternary Ce-containing phases. Therefore, by doping CeO2 in W/2024Al composite, W-Al direct reaction was markedly inhibited during both preparation and annealing.

1. Introduction

The interfacial microstructure has played effective and important roles in the exploration of particle reinforced aluminum matrix composites (PRAMC) and improvement of their thermal stability, mechanical and physical properties. In recent decades, a number of researchers have attempted to optimize the interfacial structure of PRAMC used for many applications such as multifunctional electronic packaging [1], thermal management [2], transport industry [3,4], aerospace industry [5,6], and so on. W/2024Al composite, which could be used for radiation shielding with a relative lower density, has attracted more attention in the interfacial microstructure because of its possible reactions at the W/Al interface during preparation and annealing. Most of the W-Al intermetallic compounds (e.g., WAl12, WAl5) are brittle and will deteriorate the mechanical properties of composites as interfacial reaction products. Moreover, the formation of W-Al interfacial compounds could lead to the obvious volume expansion of composites, i.e., poor thermal stability. In previous research, hot-pressed W/2024Al and WC/2024Al composites were prepared at different temperatures [7]. The research has shown that the WC substituting of W has led to a marked increase of W-Al reaction onset temperature which was attributed to the formation of interfacial Al4C3 layers. The Al4C3 layers inhibited the W-Al reactions as physical obstacle at interfaces. In principle, W-Al direct reaction was undesirable within the W/2024Al composite.
Up to date, there have been several research studies devoted to the microstructures and properties of PRAMC with doping of rare earth oxides [8,9,10,11,12]. However, the question, does doping of rare earth oxides have an influence on interfacial reactions has not been discussed in detail in this research. In this work, W/2024Al composite and the counterpart with CeO2 doping were prepared by powder sintering, and after preparation the composites were treated by annealing. Subsequently, the microstructure at the pure W/Al interface and the effect of CeO2 doping on the interfacial microstructure were investigated in greater detail. Here we have assumed that CeO2 doping in the W/2024Al composite could result in the formation of new phases at the W/Al interfaces and thus the W-Al direct reaction can be inhibited to a certain extent.
This paper aims to provide detailed microstructures at the interfaces in the W/2024Al composite, and attempts to inhibit direct W-Al reaction through CeO2 doping. For characterizations, we investigated the phase compositions (by XRD), thermal stability (by DSC) and interfacial microstructures (by TEM) of composites in both the prepared and annealed states.

2. Materials and Methods

2.1. Preparation of Composites

In this work, W/2024Al composite and its counterpart with CeO2 doping (denoted as ‘AW’ and ‘AWC’) were prepared by powder sintering. The sintering process contains three sub-processes, i.e., preparation of powder mixtures, vacuum degassing (VD) and hot isostatic pressing (HIP).
Atomized 2024Al powders, tungsten powders (~5 μm, Zhuzhou Cemented Carbide Group Co., Ltd, Zhuzhou, China) and CeO2 powders (~5 μm, Yixing Xinwei Co., Ltd, Yixing, China) were used as starting materials. The composition of 2024 Al powders is provided in Table 1. Prior to VD, 2024Al-W powder mixture with 40 wt.% W and 2024Al-W-CeO2 powder mixture with 40 wt.% W and 3 wt.% CeO2 were prepared. The SUS 304L tapered cylinder and balls were selected as the blending medium for powder mixtures. Blending parameters of mixtures were selected as follows: Ball to powder ratio 1:1, rotation speed 20 rpm, total blending time 24 h, under an air atmosphere.
For encapsulation, the above two powder mixtures were cold isostatic pressed at 150 MPa and then filled into two pure Al containers with 1 mm thickness. Then the containers were sealed with a plug by welding and degassed through the ventilation tube on the plug at 723 K until the vacuum degree reached 10−3 Pa. After VD, the samples were placed in a hot isostatic press and heated to 723 K at a heating rate of 5 K/min. A maximum hydrostatic pressure of 100 MPa was applied on the samples with a holding time of 2 hours. After preparation, AW and AWC were annealed according to the following procedure: 5 K/min until 823 K, 5 h holding under vacuum, furnace cooling to room temperature.

2.2. Characterizations

To evaluate the structure of composites in prepared and annealed states, X-ray diffraction (XRD, PANalytical B.V., Almelo, Netherlands) was employed. The instrument X’PERT-PRO MPD with Cu radiation was used. For a determination of the W-Al reaction onset temperature during continuous heating, two prepared composites was studied by differential thermal analysis (NETZSCH DSC 404F3, NETZSCH-Gerätebau GmbH, Selb, Germany) and thermal expansion analysis (NETZSCH DIL 402PC, NETZSCH-Gerätebau GmbH, Selb, Germany). The samples were heated to 950 K with heating rate of 5 K/min under a high purity argon gas flow. Interfacial microstructures were examined and analyzed carefully by High Resolution Transmission Electron Microscope (FEI Tecnai G2 F20, FEI Company, Hillsboro, OR, USA) equipped with an energy dispersive spectroscopy (EDS, FEI Company, Hillsboro, OR, USA). Selected area electron diffraction (SAED, FEI Company, Hillsboro, OR, USA) was utilized to identify the crystalline structures of interfacial phases. Prior to TEM investigations, the thin foils were prepared by an ion beam milling technique.

3. Results and Discussion

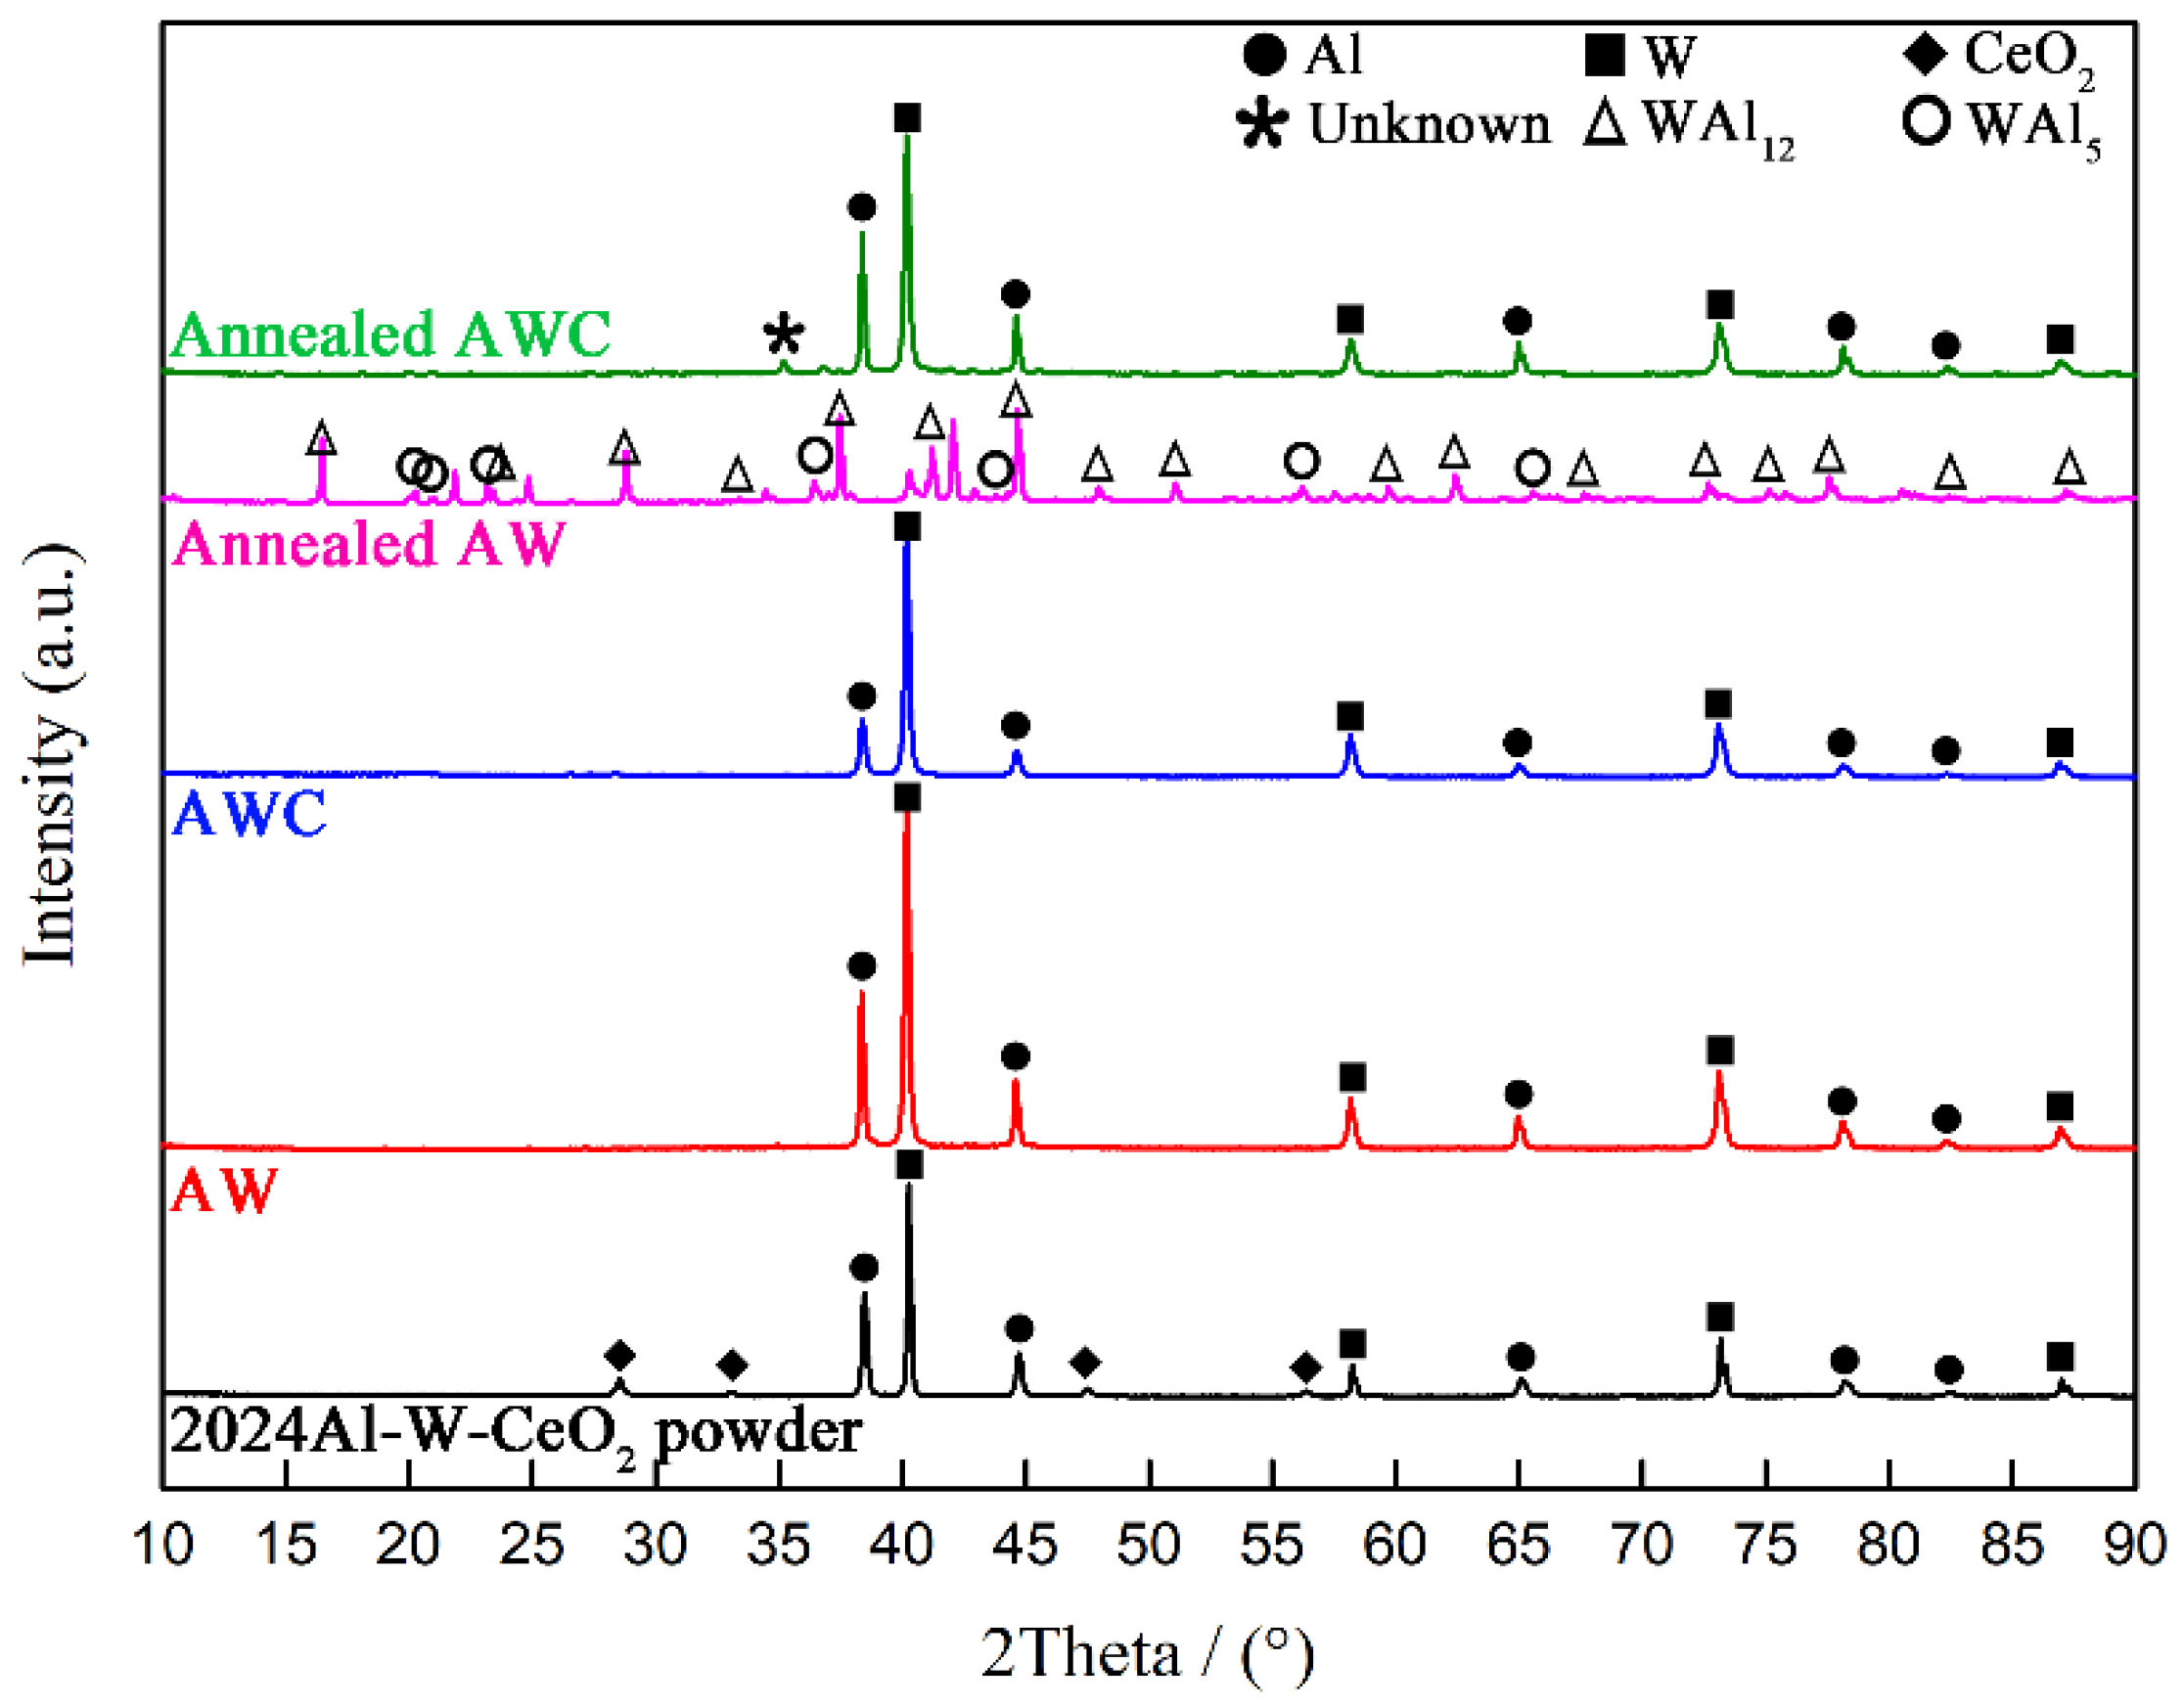
3.1. XRD Patterns and Thermal Measurements

Figure 1 shows the XRD patterns of 2024Al-W-CeO2 powder mixture, two prepared composites (AW and AWC) and two annealed counterparts, respectively. For the powder mixture, characteristic diffraction peaks of three starting materials were clearly presented in the diffraction pattern. For two prepared composites, there were only diffraction peaks of Al and W phases, that is, no obvious W-Al reactions occurred during preparation. By comparing the two prepared composites, it was apparent that the characteristic peaks of Al were sharply decreased in AWC. Adding further to the puzzle was the fact that the CeO2 phase was undetectable in the pattern of prepared AWC. From the above analyses, we speculated that one or more interfacial phases consisted predominantly of Al with subordinate Ce were formed in the AWC during preparation.
After annealing at 823 K, there were intensive interfacial reactions in AW which is indicated by diffraction peaks of WAl12 and WAl5 compounds. For annealed AWC, however, no diffraction peaks of W-Al compounds were found, while a trace of an unknown phase appeared as the reaction product. Certainly, CeO2 doping inhibited the W-Al direct reactions during annealing. The inhibition of W-Al reactions during annealing might be relevant to the interfacial phases formed in the prepared state.
In order to determine the reaction onset temperature during continuous heating, DSC traces and thermal expansion curves of AW and AWC were recorded. Figure 2 shows the DSC traces and thermal expansion curves of AW and AWC heated to 950 K with a heating rate of 5 K/min. The DSC traces are represented with solid lines and the thermal expansion curves are represented with dash lines. Exothermic peaks indicated that two obvious reactions occurred during the DSC testing for both AW and AWC. The reaction onset temperatures of AW and AWC (at the middle of the first exothermic peak) are denoted as T1 and T2, respectively. It can be clearly seen that the reaction onset temperature was pushed up from 823 K to 903 K due to CeO2 doping. In addition, the obvious reaction was confirmed as the direct consequence of the sharp expansion for both composites.

3.2. TEM Investigations at Interfaces

3.2.1. Interfacial Microstructure in Prepared AW

For a definite study of pure W/Al interface, it is important to have information on the interfacial microstructure in AW. Figure 3 shows the detailed analyses of TEM microstructures at the pure W/Al interface. Even though no apparent W-Al compounds were detected by XRD analysis in the prepared AW (Figure 1), a thin reaction layer with 50–60 nm thickness can be observed at the pure W/Al interface as shown in Figure 3a. Within the reaction layer, three typical areas labelled with ‘A’, ‘B’, ‘C’ were selected to be further magnified as shown in Figure 3b, Figure 3c and Figure 3d, respectively.
In area ‘A’ (Figure 3b), three sub-areas are labelled with ‘A1’, ‘A2’ and ‘A3’. The crystalline interplanar distances in these three sub-areas were calculated to be 0.224 nm (W (2 1 0), PDF#47-1319), 0.371 nm (WAl12 (2 0 0), PDF#08-0331) and 0.441 nm (WAl5 (0 0 0 2), PDF#30-0046), respectively. C. Mao found that the interfacial diffusion in W-Al couple was controlled by the diffusion of W into Al during hot-pressing of WC/2024Al, and the formation of WAl5 at 720 °C was attributed to following transformation [7]:
5 W A l 12 + 7 W   720   ° C 12 W A l 5
Thus, the appearance of W within the reaction layer indicated that the diffusion of W toward the Al matrix during preparation. In area ‘B’ (Figure 3c), lattice fringe of WAl5 (0 0 0 2) was observed with a d value (d = 0.439 nm) calculated in the sub-area ‘B1’. In area ‘C’ (Figure 3d), two sub-areas are labelled with ‘C1’ and ‘C2’. Identification of the phases in these two sub-areas were conducted on the fast Fourier transform (FFT) analysis. The calculated d value (d = 0.423 nm) in FFT of C1 (Figure 3e) corresponded to WAl5 (1 0 -1 0), and the calculated two d values (d1 = 0.221 nm, d2 = 0.256 nm) in FFT of C2 (Figure 3f) corresponded to W (1 -2 0) and W (2 0 0), respectively. By comparing ‘B1’ and ‘C1’, this indicated that there was a discontinuous formation of WAl5 phase at the continuous W/Al interface.

3.2.2. Interfacial Microstructure in the Prepared AWC

In order to trace the impact of CeO2 doping on microstructure at the W/Al interface, prepared AWC was also examined by TEM. Figure 4 shows the TEM morphology, SAED pattern and EDS analyses of the interface in prepared AWC. The TEM micrograph (Figure 4a) shows a two-layer interfacial structure between W and Al, i.e., a reaction layer near W and a transition layer near Al (denoted as Layer I and Layer II, respectively). The SAED pattern of the circular area labelled in Layer II is shown as Figure 4b.
EDS analyses shows that Layer I and Layer II were composed of Al-Ce-Cu-W (Figure 4c) and Al-Ce-Cu-W-Mg-O (Figure 4d), respectively. From the SAED pattern of Layer II, a broad diffuse ring in the background originated from the electrons scattered in amorphous, while a sharp diffraction ring and a set of diffraction spots corresponded to the electrons scattered from the crystalline lattice of crystallites. The broad diffuse ring indicates an amorphous matrix of Layer Ⅱ. Structural identification of the crystalline diffraction ring and spots yielded a good match with CeO2 and MgO, respectively. Thus, Layer II consists of an amorphous matrix with subordinate CeO2 and MgO crystallites. As also shown in Figure 5, the FFT analyses of marked squares provided more evidence of the formation of amorphous at interfaces. Figure 6 shows HADDF-STEM-EDS mapping analyses of the six elements (Al, Ce, Cu, W, Mg, O) at the Interface. In the mapping area, the two-layer interfacial structure ‘I–II’ between W and Al is clearly displayed. The EDS analyses demonstrated a composition of Al-Ce-Cu-W for pure amorphous layer ‘I’. Combined with XRD analyses (Figure 1), the interfacial Al-Ce-Cu-W was confirmed as one Al-based amorphous. The same distribution of Mg and O directly proved the formation of the MgO phase. Thus, by doping CeO2, Al-Ce-Cu-W amorphous substituting of W-Al compounds were formed as an interfacial reaction layer during preparation.
So far, Al-Ce-TM (TM: Transition metals) amorphous have been widely studied on the basis of liquid-solid amorphization [13,14,15,16,17,18,19,20]. Understandably, it is difficult for W to participate in liquid-solid amorphization due to its ultra-high melting point. However, W was proved to participate in the formation of Al-Ce-TM amorphous through solid-state amorphization. The Al-Ce-Cu-W discovered in this work indicated that the Al-Ce-TM amorphous can also be formed through solid-state amorphization. Certainly, the detailed mechanism involved in Al-Ce-Cu-W amorphization needs further investigation in the future.

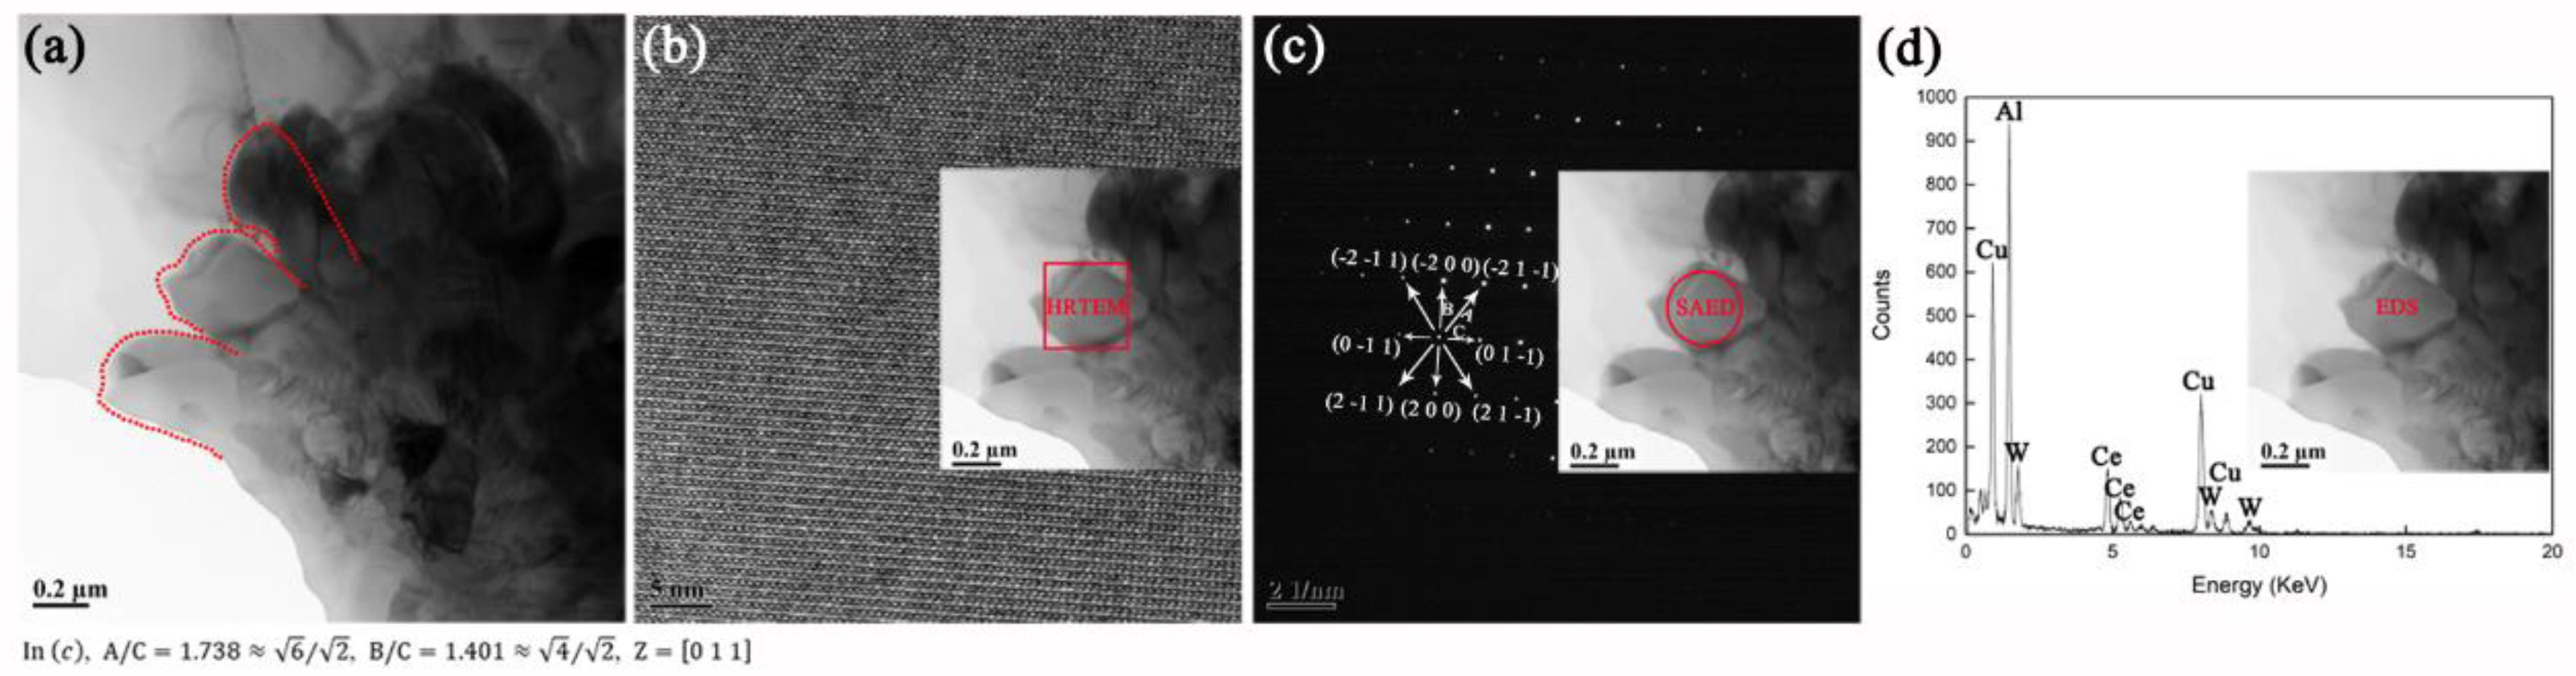
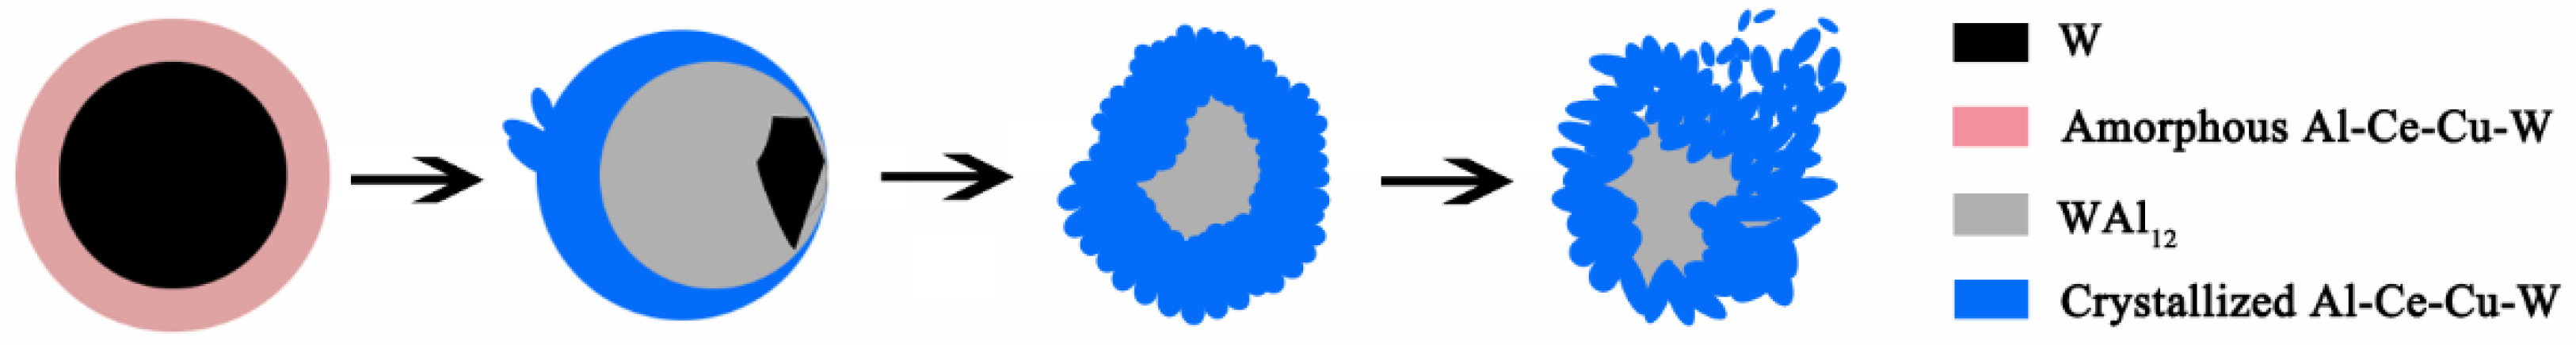
3.2.3. Interfacial Microstructure in Annealed AWC

The analyses of XRD patterns and DSC traces revealed that W-Al direct reactions were markedly inhibited by CeO2 doping during annealing. For a determination of the inhibition mechanism, it is important to have detailed information on the interfacial microstructure of annealed AWC. With TEM examinations, we investigated the interfaces with representative morphologies as shown in Figure 7. By comparing Figure 4 and Figure 7, it can be seen that the annealed AWC exhibited distinctly different interfacial morphologies with its prepared counterpart. Thus, we speculated that in some cases the former interfacial amorphous was transformed into new phases during annealing.
Evidently, the change in interfacial morphology increased from Figure 7a,b and then to Figure 7c and finally to Figure 7d. Figure 7a shows the interfacial morphology that represented the majority of interfaces, and in which the W particle is relatively stable. Figure 7b shows a three-layer ‘core-shell’ structure at its interface, and EDS points labelled with ‘EDS 1’, ‘EDS 2’ ‘EDS 3’ and ‘EDS 4’ are marked in ‘core’, ‘middle layer’ and ‘shell’, respectively. From the EDS analyses, the elemental compositions of ‘core’, ‘middle layer’ and ‘shell’ corresponded to W, Al-W and Al-Ce-Cu-W, respectively. By comparison with Figure 7a, Figure 7b shows an atrophied W ‘core’ which resulted from the reasonable consumption in the formation of Al-W ‘middle layer’. For ‘shell’, the elemental composition was inherited from the former Al-Ce-Cu-W amorphous in the prepared AWC. In Figure 7c, the W ‘core’ had completely run out and the Al-W ‘middle layer’ was in growth, which led to the structural evolution into a two-layer ‘core-shell’. With the growth of the Al-W ‘core’, Al-Ce-Cu-W ‘shell’ was fragmented into countless ‘petal-shaped grains’ as shown in Figure 7d.
For microstructural investigation of the two-layer ‘core-shell’, a high-magnification micrograph was selected to be further characterized. Figure 8 shows the TEM micrograph, SAED patterns and EDS analyses of the two-layer ‘core-shell’. EDS analyses of ‘shell’ and ‘core’ (labelled with EDS 1 and EDS 2) shows the should-be compositions of Al-Ce-Cu-W and Al-W, respectively. The SAED pattern involving a part of ‘shell’ (SAED 1, Figure 8b) did not show a broad diffuse ring originating from the electrons scattered in the amorphous. Thus, the former Al-Ce-Cu-W amorphous layer at the interface was crystallized during annealing. It can be clearly seen that the crystalline ‘shell’ is continuous and dense. The SAED pattern involving a part of ‘core’ (SAED 2, Figure 8c) shows a set of diffraction spots that yields a good match with the WAl12 phase.
In order to further characterize the crystalline ‘shell’, the fragmented ‘petal-shaped grains’ (structural units of ‘shell’) were examined by TEM as shown in Figure 9. In Figure 9a, ‘petal-shaped grains’ are compactly arranged. From the HRTEM micrograph (Figure 9b), the SAED pattern (Figure 9c) and EDS analysis (Figure 9d), the ‘petal-shaped grains’ were confirmed as bcc-structure single crystals with elemental composition of Al-Ce-Cu-W, i.e., the elemental composition of crystalline ‘petal-shaped grains’ was consistent with that of its amorphous predecessor. Thus, the crystallization product for Al-Ce-Cu-W amorphous was identified as bcc-structure Al-Ce-Cu-W phase without any binary/ternary Ce-containing phases such as Ce-Al and Ce-Al-TM. However, such a crystallization behavior was rarely observed in the reported Al-Ce-TM amorphous system [21,22,23,24,25,26,27,28,29,30,31,32,33,34,35,36,37,38,39,40]. The reported crystallization products for Al-Ce-TM amorphous system are summarized in Table 2, and the corresponding crystallization conditions are also listed. From the above research, the crystallization products for the Al-Ce-TM system can be categorized into four types: Fcc-Al phase, Ce-Al phases, Al-TM phases and Ce-Al-TM phases. Generally according to the order in which the products precipitated during annealing, the fcc-Al phase precipitated in the early stage of crystallization and the other decomposition products precipitated in the later stages of crystallization. By contrast, no binary/ternary Ce-containing phases were decomposed from the Al-Ce-Cu-W amorphous during annealing in this work. The schematic diagram for the evolution of the interfacial structure during annealing is illustrated in Figure 10. Thus during annealing, the inhibitory effect of CeO2 doping on W-Al compounds was attributed to crystallized Al-Ce-Cu-W layer as an interfacial obstacle.

4. Conclusions

In this work, the interfacial microstructure in W/2024Al composite and inhibition of W-Al direct reaction by CeO2 doping were investigated. The composites were prepared through powder sintering, and after preparation the composites were treated by annealing at 823 K. For the prepared W/2024Al composite, a multi-phase thin layer composed of WAl12 and WAl5 compounds were formed at the interface due to W-Al direct reaction. By doping CeO2 in the composite, Al-Ce-Cu-W amorphous substituting of W-Al compounds were formed as an interfacial reaction layer. In the annealed state, the composite with CeO2 doping shows a significant inhibitory effect on W-Al compounds, which was attributed to the crystallized layer that evolved from the Al-Ce-Cu-W amorphous as an interfacial obstacle. The crystallization product for Al-Ce-Cu-W amorphous was identified as bcc-structure Al-Ce-Cu-W phase without any binary/ternary Ce-containing phases. As a summary, the W-Al direct reaction within the W/2024Al composite was markedly inhibited through CeO2 doping during both preparation and annealing.

Author Contributions

Conceptualization, C.M. and Q.L.; Methodology, J.W.; Software, Y.L.; Validation, Q.L., S.M. and J.Y.; Formal Analysis, Z.L.; Investigation, J.W.; Resources, Z.Y.; Data Curation, J.Y.; Writing-Original Draft Preparation, Z.L.; Writing-Review & Editing, C.M.; Visualization, Z.L.; Supervision, Z.Y.; Project Administration, J.W.

Acknowledgments

The authors wish to thank the support of China Academy of Engineering Physics.

Conflicts of Interest

The authors declare no conflict of interest.

References

  1. Ren, S.; He, X.; Qu, X.; Li, Y. Effect of controlled interfacial reaction on the microstructure and properties of the SiCp/Al composites prepared by pressureless infiltration. J. Alloys Compd. 2008, 455, 424–431. [Google Scholar]
  2. Tan, Z.; Li, Z.; Fan, G.; Guo, Q.; Kai, X.; Ji, G.; Zhang, L.; Zhang, D. Enhanced thermal conductivity in diamond/aluminum composites with a tungsten interface nanolayer. Mater. Des. 2013, 47, 160–166. [Google Scholar] [CrossRef]
  3. Kim, Y.; Lee, J.C. Processing and interfacial bonding strength of 2014Al matrix composites reinforced with oxidized SiC particles. Mater. Sci. Eng. A 2006, 420, 8–12. [Google Scholar]
  4. Dandekar, C.R.; Shin, Y.C. Effect of porosity on the interface behavior of an Al2O3-aluminum composite: A molecular dynamics study. Compos. Sci. Technol. 2011, 71, 350–356. [Google Scholar]
  5. Contreras, A.; Angeles-Chávez, C.; Flores, O.; Perez, R. Structural, morphological and interfacial characterization of Al-Mg/TiC composites. Mater. Charact. 2007, 58, 685–693. [Google Scholar]
  6. Jamaludin, S.B.; Hadipramana, J.; Wahid, M.F.M.; Hassin, K.; Rahmat, A. Microstructure and Interface Analysis of Glass Particulate Reinforced Aluminum Matrix Composite. Adv. Mater. Res. 2013, 795, 578–581. [Google Scholar]
  7. Mao, C.; Sun, X.; Liang, Q.; Yang, J.; Du, J. Interfacial reaction process of the hot-pressed WC/2024Al composite. Rare Met. 2013, 32, 397–401. [Google Scholar]
  8. Yu, Z.; Wu, G.; Sun, D.; Chen, J.; Jiang, L. Rare-earth oxide coating for sub-micro particulates reinforced aluminum matrix composites. Mater. Sci. Eng. A 2003, 357, 61–66. [Google Scholar] [CrossRef]
  9. Wang, T.G.; Liang, Q.C.; Qin, Q. Effects of rare earth oxide La2O3 on microstructure and properties of Al2O3/Al composites. Mater. Res. Innov. 2015, 19 (Suppl. 5), S5-891–S5-893. [Google Scholar]
  10. Yu, Z.; Wu, G.; Jiang, L.; Sun, D. Effect of coating Al2O3 reinforcing particles on the interface and mechanical properties of 6061 alloy aluminium matrix composites. Mater. Lett. 2005, 59, 2281–2284. [Google Scholar]
  11. Xue, J.; Wang, J.; Han, Y.F.; Chen, C.; Sun, B.D. Behavior of CeO2 additive in in-situ TiB2 particles reinforced 2014 Al alloy composite. Trans. Nonferr. Metals Soc. China 2012, 22, 1012–1017. [Google Scholar] [CrossRef]
  12. Liu, Z.; Lin, J.; Jing, Q. Effect of mixed rare earth oxides and CaCO3 modification on the microstructure of an in-situ Mg2Si/Al-Si composite. Rare Metals 2009, 28, 169–174. [Google Scholar] [CrossRef]
  13. Matsuura, M.; Sakurai, M.; Suzuki, K.; Tsai, A.P.; Inoue, A. Local structure change of Ce and Cu in the course of nanocrystalline formation from amorphous Al87Ni8Ce3Cu2. Mater. Sci. Eng. A 1997, 226, 511–514. [Google Scholar] [CrossRef]
  14. Rios, C.T.; Suriñach, S.; Baró, M.D.; Bolfarini, C.; Botta, W.J.; Kiminami, C.S. Glass forming ability of the Al-Ce-Ni system. J. Non-Cryst. Solids 2008, 354, 4874–4877. [Google Scholar] [CrossRef]
  15. Yang, H.; Wang, J.Q.; Li, Y. Influence of TM and RE elements on glass formation of the ternary Al-TM-RE systems. J. Non-Cryst. Solids 2008, 354, 3473–3479. [Google Scholar] [CrossRef]
  16. Song, K.; Bian, X.; Lv, X.; Guo, J.; Li, G.H.; Xie, M.T. Compositional dependence of glass-forming ability, medium-range order, thermal stability and liquid fragility of Al-Ni-Ce-based amorphous alloys. Mater. Sci. Eng. A 2009, 506, 87–93. [Google Scholar] [CrossRef]
  17. Li, G.H.; Wang, W.M.; Bian, X.F.; Zhang, J.T.; Li, R.; Wang, L. Comparing the dynamic and thermodynamic behaviors of Al86Ni9-La5/(La0.5Ce0.5)5 amorphous alloys. J. Alloys Compd. 2009, 478, 745–749. [Google Scholar] [CrossRef]
  18. Sun, S.P.; Yi, D.Q.; Liu, H.Q.; Zang, B.; Jiang, Y. Calculation of glass forming ranges in Al-Ni-RE (Ce, La, Y) ternary alloys and their sub-binaries based on Miedema’s model. J. Alloys Compd. 2010, 506, 377–387. [Google Scholar] [CrossRef]
  19. Hu, X.F.; Guo, J.; Fan, G.J.; Feng, T.T. Evaluation of glass-forming ability for Al-based amorphous alloys based on superheated liquid fragility and thermodynamics. J. Alloys Compd. 2013, 574, 18–21. [Google Scholar] [CrossRef]
  20. Li, C.L.; Murray, J.W.; Voisey, K.T.; Clare, A.T.; McCartney, D.G. Amorphous layer formation in Al86.0Co7.6Ce6.4 glass-forming alloy by large-area electron beam irradiation. Appl. Surf. Sci. 2013, 280, 431–438. [Google Scholar] [CrossRef]
  21. Zhang, C.; Wu, Y.; Zhang, D.; Cai, X.; Zhou, G.; Zhang, L. The crystallization behavior of amorphous Al90Fe5Ce5 alloy. J. Mater. Sci. Lett. 2001, 20, 1415–1417. [Google Scholar] [CrossRef]
  22. Gu, X.J.; Wang, J.Q.; Ye, F.; Lu, K. Influence of pressure on crystallization kinetics in an Al-Ni-Ce-Fe amorphous alloy. J. Non-Cryst. Solids 2001, 296, 74–80. [Google Scholar] [CrossRef]
  23. Wang, S.H.; Bian, X.F.; Wang, H.R. Crystallization of amorphous Al84.2Ni10La2.1Ce2.8Pr0.3Nd0.6 alloy. Mater. Lett. 2004, 58, 539–542. [Google Scholar] [CrossRef]
  24. Sahoo, K.L.; Panda, A.K.; Das, S.; Rao, V. Crystallization study of amorphous Al87.5Ni7Mm5Fe0.5 alloy by electrical resistivity measurement. Mater. Lett. 2004, 58, 316–320. [Google Scholar] [CrossRef]
  25. Wang, S.H.; Bian, X.F. Crystallization of Al-Mg-Ce and Al-Mg-Ni-Ce amorphous alloys. J. Alloys Compd. 2007, 441, 135–138. [Google Scholar] [CrossRef]
  26. Sun, B.A.; Bian, X.F.; Guo, J.; Zhang, J.Y.; Mao, T. Hump peak formation and the crystallization in amorphous Al87Co10Ce3 alloy. Mater. Lett. 2007, 61, 111–114. [Google Scholar] [CrossRef]
  27. Ouyang, Y.; Zhang, J.; Chen, H.; Liao, S.; Zhong, X. Crystallization study of amorphous Al82Fe5Ni5Ce8 alloy. J. Alloys Compd. 2008, 454, 359–363. [Google Scholar] [CrossRef]
  28. Huang, Z.H.; Li, J.F.; Rao, Q.L.; Zhou, Y.H. Primary crystallization of Al-Ni-RE amorphous alloys with different type and content of RE. Mater. Sci. Eng. A 2008, 489, 380–388. [Google Scholar] [CrossRef]
  29. Wang, S.H.; Bian, X.F. Effect of Si and Co on the crystallization of Al-Ni-RE amorphous alloys. J. Alloys Compd. 2008, 453, 127–130. [Google Scholar] [CrossRef]
  30. Sha, P.F.; Qi, Z.; Zhang, Z.H. Effect of Ag or Pd additions on the microstructure, crystallization and thermal stability of Al–Ni–Ce amorphous alloys. Intermetallics 2010, 18, 1699–1706. [Google Scholar] [CrossRef]
  31. Zhang, Z.; Zhou, W.; Xiong, X.Z.; Kong, L.T.; Li, J.F. Glass forming ability and primary crystallization behavior of Al-Ni-Ce alloys. Intermetallics 2012, 24, 1–6. [Google Scholar] [CrossRef]
  32. Salehi, M.; Shabestari, S.G.; Boutorabi, S.M.A. Nano-crystal development and thermal stability of amorphous Al-Ni-Y-Ce alloy. J. Non-Cryst. Solids 2013, 375, 7–12. [Google Scholar] [CrossRef]
  33. Zhang, Z.; Xiong, X.Z.; Zhou, W.; Li, J.F. Influence of substitution of La by Ce on the glass forming ability and crystallization behavior of Al-Ni-La alloys. J. Alloys Compd. 2013, 576, 181–186. [Google Scholar] [CrossRef]
  34. Zhang, Z.; Xiong, X.Z.; Zhou, W.; Lin, X.; Inoue, A.; Li, J.F. Glass forming ability and crystallization behavior of Al–Ni–RE metallic glasses. Intermetallics 2013, 42, 23–31. [Google Scholar] [CrossRef]
  35. Mansouri, M.; Simchi, A.; Lee, J.I.; Park, E.S.; Varahram, N. Non-isothermal kinetic studies of crystallization in amorphous Al86Ni10MM4 alloy. J. Non-Cryst. Solids 2014, 387, 36–40. [Google Scholar] [CrossRef]
  36. Mansouri, M.; Simchi, A.; Varahram, N.; Park, E.S. Development of fcc-Al nanoparticles during crystallization of amorphous Al-Ni alloys containing mischmetal: Microstructure and hardness evaluation. Mater. Sci. Eng. A 2014, 604, 92–97. [Google Scholar] [CrossRef]
  37. Sidorov, V.; Svec, P.; Janickovic, D.; Mikhailov, V.; Son, L. Magnetic properties and crystallization behavior of Al-Co-Ce(Dy) Amorphous Ribbons. J. Magn. Magn. Mater. 2015, 395, 324–328. [Google Scholar] [CrossRef]
  38. Singh, D.; Singh, D.; Mandal, R.K.; Srivastava, O.N.; Tiwari, R.S. Crystallization behavior and mechanical properties of (Al90Fe5Ce5)100-xTix amorphous alloys. J. Alloys Compd. 2016, 687, 990–998. [Google Scholar] [CrossRef]
  39. Mansouri, M.; Bidhendi, H.R.A.; Akhavan, S. Non-isothermal kinetics study of primary crystallization in amorphous Al86Ni10Zr2MM2 alloy. J. Non-Cryst. Solids 2017, 468, 1–4. [Google Scholar] [CrossRef]
  40. Mansouri, M.; Varahram, N.; Simchi, A. Effect of copper on the thermal stability and non-isothermal crystallization behavior of Al86Ni10-xCuxRE4 (x = 0.5–2.5) amorphous alloys prepared by melt spinning. J. Non-Cryst. Solids 2019, 506, 46–50. [Google Scholar] [CrossRef]
Figure 1. XRD patterns of 2024Al-W-CeO2 powder mixture, two prepared composites and their annealed counterparts.
Materials 12 01117 g001
Figure 2. DSC traces and thermal expansion curves of AW and AWC. DSC traces are represented with solid lines and thermal expansion curves are represented with dash lines.
Materials 12 01117 g002
Figure 3. (a) TEM morphology of W/Al interface in prepared AW, and three areas ‘A’, ‘B’, ‘C’ are marked in (a). (b) high-magnification of area ‘A’ with sub-areas labelled with ‘A1’, ‘A2’, ‘A3’. (c) high-magnification of area ‘B’ with sub-area labelled with ‘B1’. (d) high-magnification of area ‘C’ with sub-areas labelled with ‘C1’, ‘C2’. FFT graphs of ‘C1’ and ‘C2’ are shown as (e) and (f), respectively.
Materials 12 01117 g003
Figure 4. (a) TEM micrograph of W/Al interface in prepared AWC, and two EDS points ‘EDS1’, ‘EDS2’ are marked in (a). (b) SAED pattern of the circular area marked in (a). EDS analyses are shown as (c) and (d), respectively.
Materials 12 01117 g004
Figure 5. (a) and (b) show TEM morphologies of W/Al interfaces in prepared AWC. The insets show FFT graphs of marked squares.
Materials 12 01117 g005
Figure 6. HADDF-STEM-EDS scanning area was marked in (a) STEM micrograph. The EDS mapping analyses of six elements ((b) Al, (c) Ce, (d) Mg, (e) Cu, (f) W, (g) O) at the W/Al interface of prepared AWC were displayed.
Materials 12 01117 g006
Figure 7. TEM morphologies of interfacial structures in annealed AWC. By comparing with the prepared AWC, the change in interfacial morphology increased from (a) to (b) and then to (c) and finally to (d). EDS analyses are displayed at the bottom.
Materials 12 01117 g007
Figure 8. (a) TEM morphology of ‘core-shell’ structure in the annealed AWC. (b) and (c) shows the SAED patterns of circular areas labelled with ‘SAED 1’ and ‘SAED 2’ in (a), respectively. EDS analyses of ‘shell’ and ‘core’ are shown as (d) and (e), respectively.
Materials 12 01117 g008
Figure 9. (a) TEM morphology of ‘petal-shaped grains’ in annealed AWC. For one single ‘grain’, (b) HRTEM micrograph, (c) SAED pattern and (d) EDS analysis were displayed.
Materials 12 01117 g009
Figure 10. Schematic diagram for the evolution of interfacial structure in AWC during annealing.
Materials 12 01117 g010
Table 1. Chemical analysis (wt.%) of 2024 aluminum alloy powders used in this work.
ElementCuMgMnFeSiAl
Chemical composition4.201.480.580.160.087Balance
Table 2. Crystallization products of reported Al-Ce-TM (TM: Transition metals) amorphous system [21,22,23,24,26,27,28,30,32,33,35,36,38,39,40]. The corresponding crystallization conditions are also listed.
Al-Ce-TM Amorphous SystemCrystallization ProductsCorresponding Crystallization Conditions
Al90Fe5Ce5 [21]Fcc-AlPre-existing in amorphous quenched from 1173 °C
Al88Ni9Ce2Fe1 [22]Fcc-AlAnnealing at 138 °C under 1.07 GPa in pressure vessel
Fcc-Al + Al3(Ni, Fe) + Al11Ce3Annealing at 306 °C under 0.85 GPa in pressure vessel
Al84.2Ni10La2.1Ce2.8Pr0.3Nd0.6 [23]Fcc-Al + Al3NiContinuous heating to 550 K in DSC instrument
Fcc-Al + Al3Ni + Al11(La, Ce)3Continuous heating to 615/680 K in DSC instrument
Al87.5Ni7Mm5Fe0.5 [24]Fcc-AlAnnealing at 433 K
Fcc-Al + Al11(La, Ce)3Annealing at 593 K
Fcc-Al + Al11(La, Ce)3 + Al3Ni + Al4CeAnnealing at 613 K
Al87Co10Ce3 [26]Fcc-Al + Co2Al9Continuous heating to 262 °C in DSC instrument
Fcc-Al + Co2Al9 + Al4CeContinuous heating to 274/303/342 °C in DSC instrument
Al82Fe5Ni5Ce8 [27] (powders)Al11Ce3 + Al3(Fe, Ni)Annealing at 673 K for 10 h
Al87Ni6Ce7 [28]Fcc-Al + unknown metastable phase 2Isochronal heating to 563 K in DSC instrument
Al85Ni6Ce9 [28]Unknown metastable phase 3Isochronal heating to 570 K in DSC instrument
Al85Ni10Ce5 [30]Fcc-Al + Al3Ni + Al4CeAnnealing at ~727 K for 1 h
[Al85Ni10Ce5]95Ag5 [30]Fcc-Al + Al3Ni + Ag3Al17Ce5Annealing at ~723 K for 1 h
[Al85Ni10Ce5]95Pd5 [30]Fcc-Al + Al3Ni + unidentified phasesAnnealing at ~861 K for 1 h
Al86Ni6Y6Ce2 [32]Fcc-AlIsochronal annealing up to 548 K in DSC instrument
Fcc-Al + Al3NiIsochronal annealing up to 618 K in DSC instrument
Fcc-Al + Al3Ni + Al11Re3Isochronal annealing up to 688 K in DSC instrument
Al86Ni9(La1−xCex)5 [33] (x = 0−1)Fcc-AlAnnealing to the end of first DSC exothermic peak
Al85.5Ni9.5(La1-xCex)5 [33] (x = 0.2−1)Fcc-Al + Al4NiCe + Al11Ce3Annealing to the end of first DSC exothermic peak
Al86Ni10MM4 [35,36,40]Fcc-AlAnnealing up to 553 K in DSC instrument
Fcc-Al + Al11MM3 + Al3NiAnnealing up to 623/714 K in DSC instrument
Al88Ni10MM2 [36,40]Fcc-AlAnnealing up to 553 K in DSC instrument
Fcc-Al + Al11MM3 + Al3NiAnnealing up to 714 K in DSC instrument
Al90Fe5Ce5 [38]Fcc-Al + icosahedral phasesAnnealing at 613 K for 2 h
(Al90Fe5Ce5)100−xTix [38] (x = 4, 8)Fcc-Al + icosahedral phasesAnnealing at 613 K for 2 h
(Al90Fe5Ce5)88Ti12 [38] Fcc-Al + icosahedral phases + Al20CeTi2Pre-existing in amorphous
Al86Ni10Zr2MM2 [39]Fcc-AlAnnealing up to ~570 K in DSC instrument
Fcc-Al + Al11MM3 + Al3Ni + Al3ZrAnnealing up to ~690 K in DSC instrument
Al86Ni9.5Cu0.5RE4 [40]Fcc-Al + Al11MM3 + Al3NiFull-crystallization annealing in DSC instrument
Al86Ni9Cu1RE4 [40]Fcc-Al + Al11MM3 + Al3NiFull-crystallization annealing in DSC instrument
Al86Ni7.5Cu2.5RE4 [40]Fcc-Al + Al11MM3 + Al3Ni + Al3MMCuFull-crystallization annealing in DSC instrument
In Reference [24], Mm contains 55 wt.% Ce, 25 wt.% La, 10 wt.% Nd, 7 wt.% Pr and 3 wt.% Fe. In References [35,36,40], Mm/RE contains 55 wt.% Ce, 25 wt.% La, 15 wt.% Nd and 5 wt.% Pr. In Reference [39], MM contains 49 wt.% Ce, 26 wt.% La, 20 wt.% Nd and 5 wt.% Pr.

