The Influence of Water/Cement Ratio and Air Entrainment on the Electric Resistivity of Ionically Conductive Mortar

Abstract
1. Introduction
2. Experiments
2.1. Materials for Test Specimens
2.2. Specimen Preparation
2.3. Measurement of Connected Porosity
2.4. Measurement of Resistivity
3. Result and Discussion
3.1. Physical Characteristics
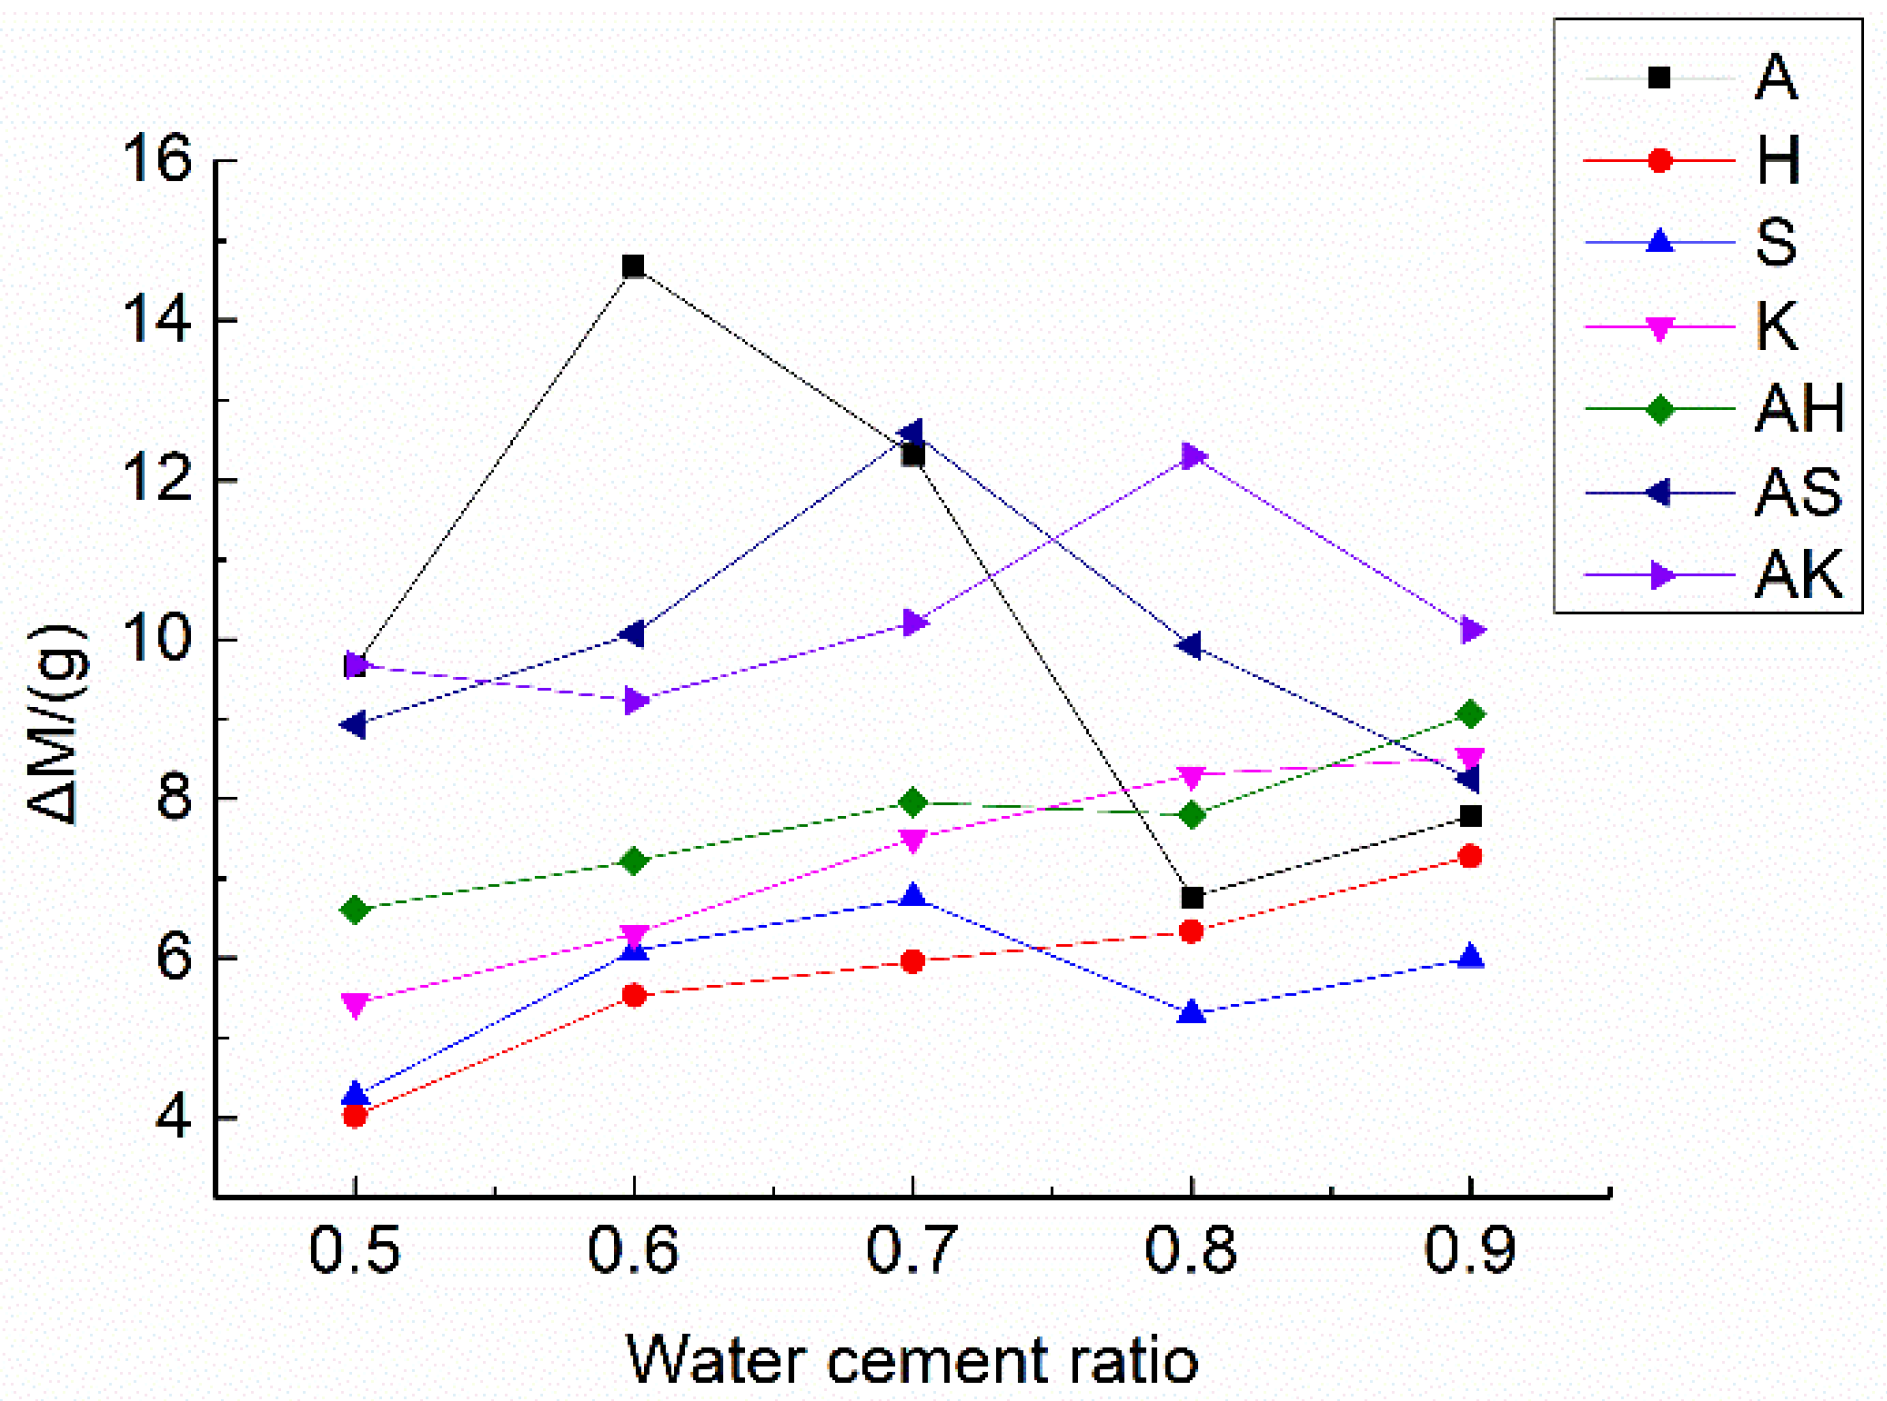
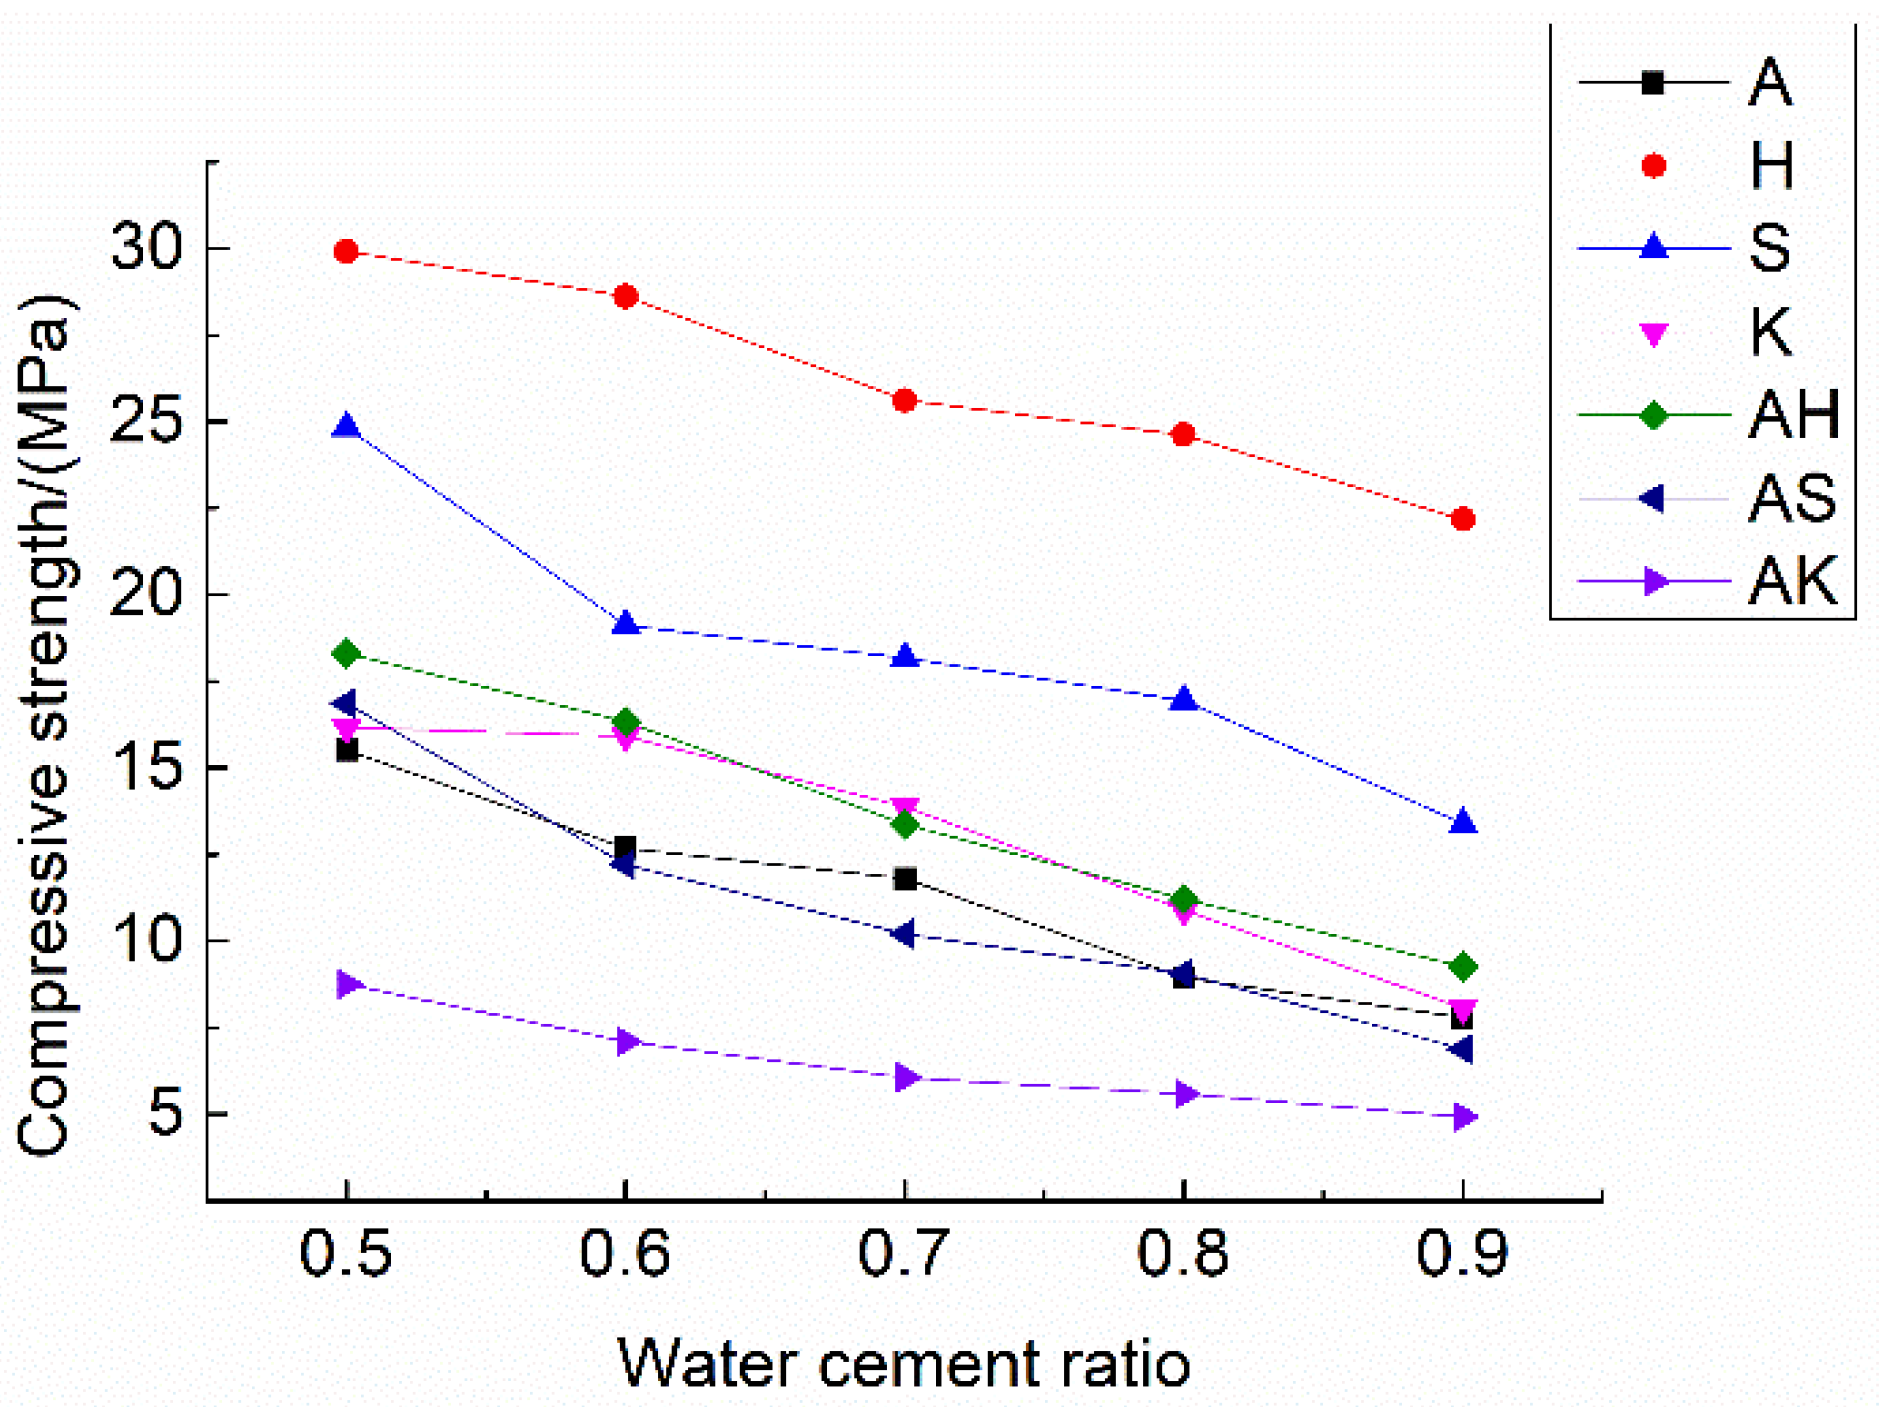
3.2. Influence of Air Entrainment and Water-Cement Ratio on the Porosity and Strength
3.3. Resistivity Influenced by Air Entrainment and Water-Cement Ratio
4. Conclusions
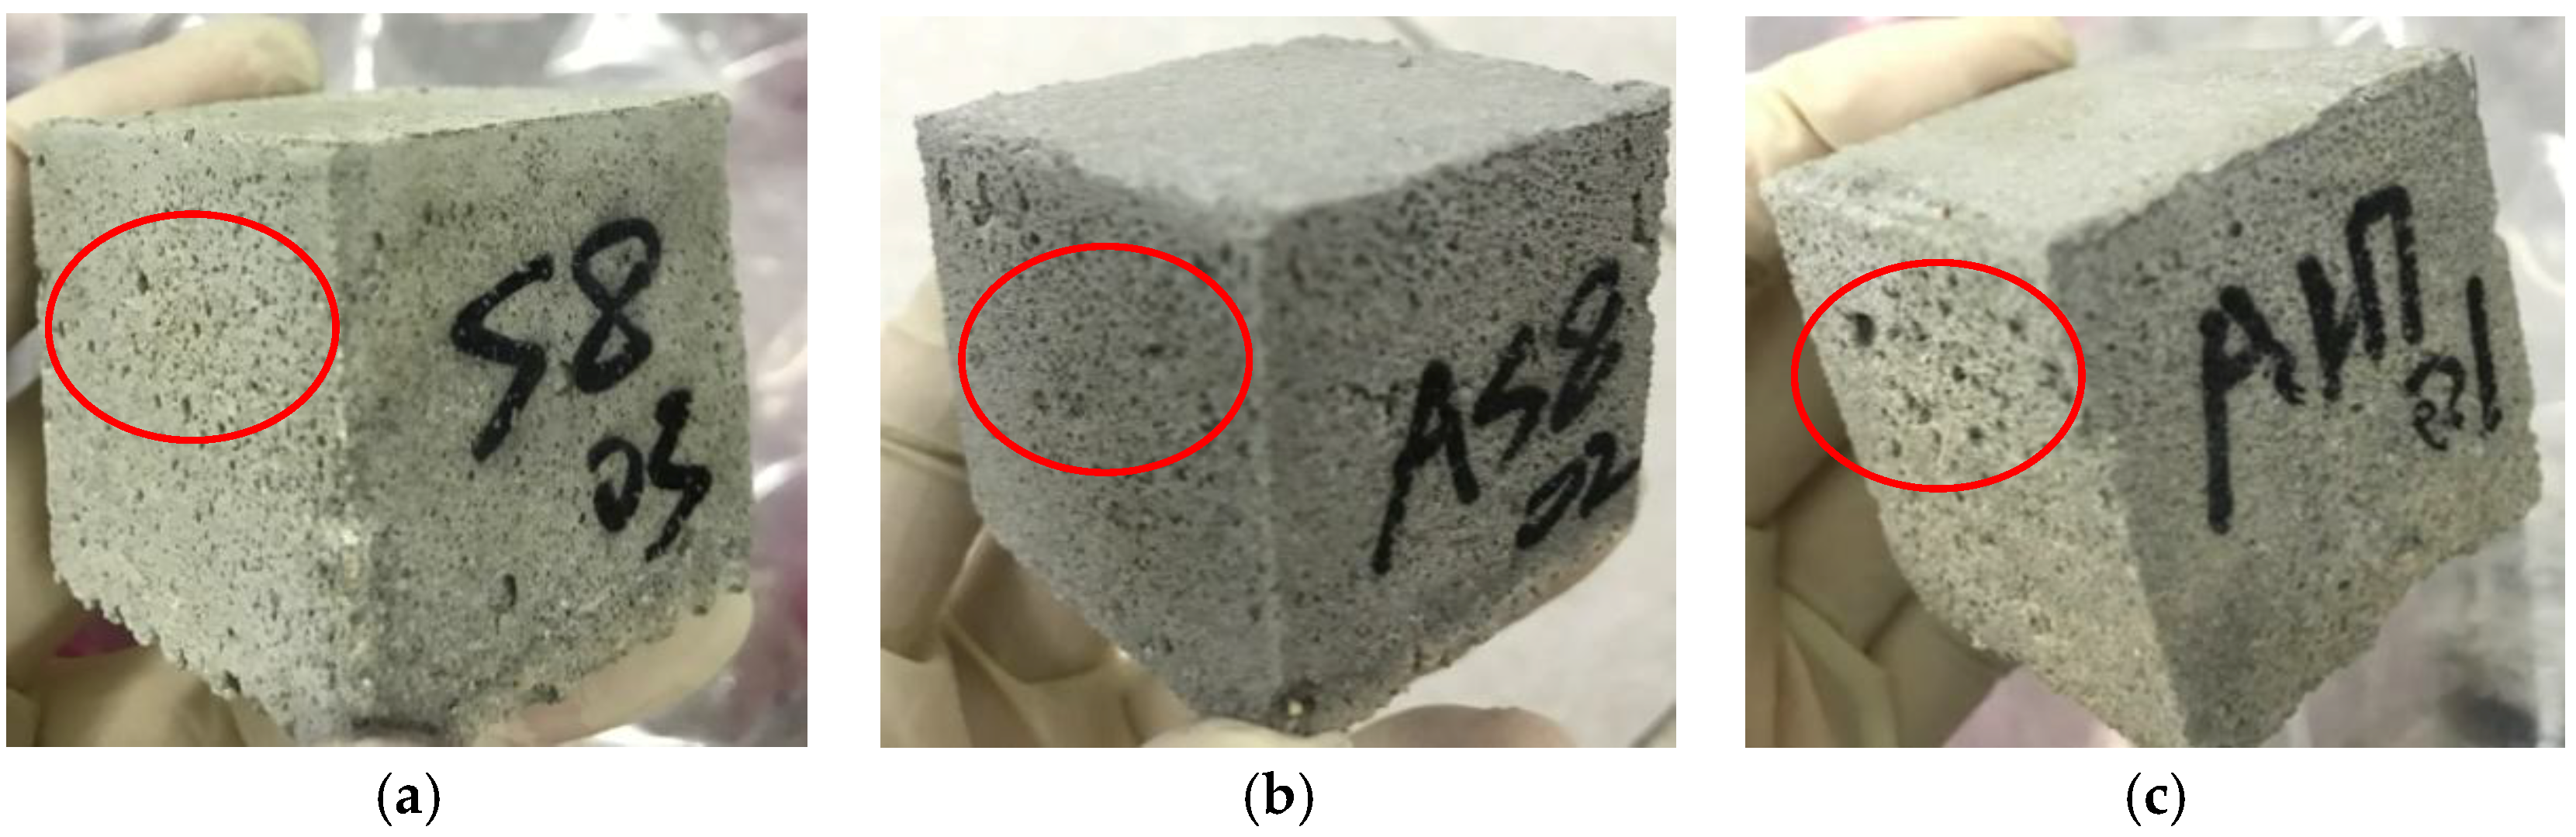
- Mixing with a single air-entraining agent can increase the porosity and permeability of ionically conductive mortar and eventually improve the conductivity of mortar. According to the results of SEM results, different air-entraining agents create different types of pores. The physical air-entraining agent mostly creates closed voids and the chemical air-entraining agent created connected voids. The porosity of most specimens increased with the increasing water–cement ratio. For the specimens fabricated with aluminum powder, the optimized water–cement ratio is about 0.6–0.7. The specimens fabricated with aluminum powder and this water–cement ratio have the highest porosity of connected voids compared with other specimens fabricated with a single air-entraining agent.
- Based on the preliminary experimental results, aluminum power was chosen to mix with other air-entraining agents to add to the mortar mixture to increase porosity. The results showed that the porosity of specimens with two different air-entraining agents is much higher than the specimens with a single air-entraining agent. SEM experiments confirmed that both connected and closed voids existed inside the mortar. The water–cement ratio was optimized when aluminum powder was used as an air-entraining agent. This optimized ratio changed when a different air-entraining agent was also added to the mixture. The optimized w/c is about 0.8 for the AH group, 0.7 for the AS group, and 0.5 for the AK group, respectively.
- The conductivity of specimens with two different air-entraining agents is significantly better than the specimens with a single air-entraining agent. The of specimens in the same group decreased with increasing porosity. This is because the conductivity of ionically conductive mortar takes the most advantage of the permeability of specimens. The higher the porosity is, the easier it is for the electrolyte to penetrate, with other conditions being equal. However, of the specimens from different groups did not always decrease with increasing porosity. Key factors which influenced the permeability of the mortar also included the characteristic of the voids inside the mortar such as category, dimension, distance between voids, etc.
- The conductivity of the ionically conductive mortar at 28 days meets the requirement of normal electrically conductive concrete. For the gradient of resistivity at 28 days, increases generally with the decreasing of porosity. This trend is not always obvious. This is because that is influenced not only by porosity, but also by many other factors such as the hydration degree of the mortar, C/S and H/S ratios of the hydration products, evaporation of water, and distribution of electrolyte solution inside the mortar, etc.
- The , and micro-image of AK-5 and AS-7 were analyzed. Even though the AK5 has lower and , AS-7 was chosen to be the optimized mixing ratio. This is because that micro-image shows that the hydration process of AS-7 is complete. There are several drawbacks of AK-5, such as micro-cracks and more Ca(OH)2 crystals which would decrease the mechanical strengths of the mortar significantly.
Author Contributions
Funding
Conflicts of Interest
References
- Tuan, C.Y. Roca Spur Bridge: The Implementation of an Innovative Deicing Technology. J. Cold Reg. Eng. 2008, 22, 1–15. [Google Scholar] [CrossRef]
- Yehia, S.; Qaddoumi, N.; Hassan, M.; Swaked, B. Conductive concrete for electromagnetic shielding applications. Adv. Civ. Eng. Mater. 2013, 3, 258–259. [Google Scholar] [CrossRef]
- Sun, M.; Liu, Q.; Li, Z.; Hu, Y. A study of piezoelectric properties of carbon fiber reinforced concrete and plain cement paste during dynamic loading. Cem. Concr. Res. 2000, 30, 1593–1595. [Google Scholar] [CrossRef]
- Ding, Y.; Chen, Z.; Han, Z.; Zhang, Y.; Pacheco-Torgal, F. Nano-carbon black and carbon fiber as conductive materials for the diagnosing of the damage of concrete beam. Constr. Build. Mater. 2013, 43, 233–241. [Google Scholar] [CrossRef]
- Zhao, R.H.; Fu, J.Y.; Duan, Y.D.; Gao, J.S. Electric-thermal and thermo-sensitive performances research of conductive concrete containing steel fiber and graphite used in melting snow. Concrete 2011, 6, 52–54. (In Chinese) [Google Scholar]
- Nam, I.W.; Lee, H.K. Image Analysis and DC Conductivity Measurement for the Evaluation of Carbon Nanotube Distribution in Cement Matrix. Int. J. Concr. Struct. Mater. 2015, 9, 427–438. [Google Scholar] [CrossRef]
- Roux, N.; Andrade, C.; Sanjuán, M.A. Experimental Study of Durability of Reactive Powder Concretes. J. Mater. Civ. Eng. 1996, 8, 1–6. [Google Scholar] [CrossRef]
- Yehia, S.A.; Tuan, C.Y. An implementation of using a conductive concrete overlay for bridge deck deicing at Roca, Nebraska. In Proceedings of the Sixth International Symposium on Snow Removal and Ice Control Technology, Spokane, WA, USA, 7–9 June 2004; pp. 58–60. [Google Scholar]
- Reza, F.; Batson, G.B.; Yamamuro, J.A. Volume electrical resistivity of carbon fiber cement composites. ACI Mater. J. 2001, 98, 25–35. [Google Scholar]
- Zhao, R.; Tuan, C.Y.; Fan, D.; Luo, B.; Xu, A. Ionically Conductive Mortar for Electrical Heating. ACI Mater. J. 2017, 114, 923–933. [Google Scholar] [CrossRef][Green Version]
- Zhao, R.H.; Tuan, C.Y.; Xu, A.; Fan, D.B. Conductivity of ionically-conductive mortar under repetitive electrical heating. Constr. Build. Mater. 2018, 173, 730–739. [Google Scholar] [CrossRef]
- Zhao, R.H.; Fan, D.B.; Xu, A.; Fu, J.Y.; Liu, A.R.; Wu, J.R. A Partition Made by Ionically Conductive Mortar. Chinese Official Patent ZL201720486020.3, 8 December 2017. [Google Scholar]
- Fan, D.B. Invention of Ionically Conductive Mortar and Research on Its Performance. Master’s Thesis, Guangzhou University, Guangzhou, China, June 2017. [Google Scholar]
- GB/T 13545-2014. National Standard: Fired Hollow Bricks and Blocks; The National Standard Publishing House: Beijing, China, 2014.
- McGrath, P.F.; Hooton, R.D. Influence of voltage on chloride diffusion coefficients from chloride migration tests. Cem. Concr. Res. 1996, 26, 1239–1244. [Google Scholar] [CrossRef]
- Lay, S.; Liebl, S.; Hilbig, H.; Schießl, P. New method to measure the rapid chloride migration coefficient of chloride-contaminated concrete. Cem. Concr. Res. 2004, 34, 421–427. [Google Scholar] [CrossRef]
- Spiesz, P.; Brouwers, H.J.H. Influence of the applied voltage on the Rapid Chloride Migration (RCM) test. Cem. Concr. Res. 2012, 42, 1072–1082. [Google Scholar] [CrossRef]
- Wang, S.G. Discussion on pore structure of concrete. Commer. Concr. 2013, 8, 61–62. (In Chinese) [Google Scholar]
- Zeng, W.B.; Sun, Z.P.; Shui, L.L.; Tang, X.B.; Li, D.Y. Mechanism and Performance Evaluation Method of Concrete Air-Entraining Agent. Available online: http://www.airitilibrary.com/Publication/alDetailedMesh?docid=jzzsclsj201511015 (accessed on 15 March 2018). (In Chinese).
- Powers, T.C. Structure and Physical Properties of Hardened Portland Cement Paste. J. Am. Ceram. Soc. 1958, 41, 1–6. [Google Scholar] [CrossRef]
- Roy, D.M. Relationships between Permeability, Porosity, Diffusion and Microstructure of Cement Pastes, Mortar and Concrete at Different Temperatures. MRS Proceedings 1988, 137, 179. [Google Scholar] [CrossRef]
- Magalhães, A.G.; Silva, F.J.; Rezende, M.A.P.; Santos, W.J.; Carrasco, E.V.M.; Mantilla, J.N.R.; Piancastelli, E.M. The Influence of the Water/Cement Ratio in the Open Porosity and in the Carbonation Front Advancing in Cementitious Matrix Composites. Appl. Mech. Mater. 2017, 864, 313–317. [Google Scholar] [CrossRef]
- Shi, H.S.; Sun, Z.P.; Deng, K.; Guo, X.L. Encyclopedia of Concrete Admixture Technology; Chemical Industry Press: Beijing, China, 2013. [Google Scholar]
- Peng, J.Z. Research on the Formation, Characteristics and Performance of Autoclaved Aerated Concrete. Ph.D. Thesis, Chongqing University, Chongqing, China, 2011. [Google Scholar]
- Ansari, F.; Zhang, Z.; Luke, A.; Maher, A. Effects of synthetic air entraining agents on compressive strength of portland cement concrete mechanism of interaction and remediation strategy. Air Entrain. Agents 1999, 3, 385–398. [Google Scholar]
- GB/T17671. Test Method for Strength of Cement Mortar (ISO Method); China Standard Press: Beijing, China, 1999.
- GB/T50081. Standard for Test Method of Mechanical Properties on Ordinary Concrete; China Architecture & Building Press: Beijing, China, 2002.
- Kearsley, E.P.; Wainwright, P.J. Porosity and permeability of foamed concrete. Cem. Concr. Res. 2001, 31, 805–812. [Google Scholar] [CrossRef]
- Sanjuán, M.A.; Muñoz-Martialay, R. Influence of the age on air permeability of concrete. J. Mater. Sci. 1995, 30, 5657–5662. [Google Scholar] [CrossRef]
- Sanjuán, M.A.; Muñoz-Martialay, R. Influence of the water/cement ratio on the air permeability of concrete. J. Mater. Sci. 1996, 31, 2829–2832. [Google Scholar] [CrossRef]
- Ye, M.; Hooton, R.D. Study of porosity measurement method of hardened cement paste. Hydro-Sci. Eng. 1991, 1, 63–73. [Google Scholar]
- Zhu, B.R.; Yang, Q.B.; Wu, X.L.; Huang, S.Y. Properties of concrete with a new type of air-entraining agent (SJ-2). Concrete 2001, 4, 21–24. (In Chinese) [Google Scholar]
- Wu, F.Z.; Wang, L.F.; Shan, J.H. Research situation of air entraining agent for concrete. In Proceedings of the Fifth International Pavement Maintenance Technology Forum, Xiamen, China, 1–3 December 2011; p. 316. [Google Scholar]
- Fu, H.L.; Zhong, Y.L.; Zhang, J.; Lin, Z.H. Study on application of different air entraining agents in polycarboxylate superplasticizer mixture. In Proceedings of the “Cologne Cup” Concrete Admixture Essay Collection—The Thirteenth Congress, Jiangmen, China, 14–15 April 2012; pp. 241–245. [Google Scholar]
- Hu, H.; Jia, X.W. Application of Catalyst in Hydrogen Peroxide Foaming Ultra-Light Foamed Concrete. Available online: http://www.cnki.com.cn/Article/CJFDTotal-QKQK201505019.htm (accessed on 18 March 2018). (In Chinese).
- Yim, H.J.; Lee, H.; Kim, J.H. Evaluation of mortar setting time by using electrical resistivity measurements. Constr. Build. Mater. 2017, 146, 679–686. [Google Scholar] [CrossRef]
- Sanjuán, M.A.; Lucio, C.A.; Ruiz, J.C.G.; Pozo, E.R. Combined effect of nano-SiO2 and nano-Fe2O3 on compressive strength, flexural strength, porosity and electrical resistivity in cement mortars. Mater. Constr. 2018, 68, e150. [Google Scholar] [CrossRef]
- Sanjuán, M.A. Overview on electrochemical parameters to assess the corrosion state of steel reinforcement in CAC mortar and concrete. J. Mater. Sci. 2000, 35, 105–108. [Google Scholar] [CrossRef]
- Li, W.G.; Liu, L.P. Research status of conductive concrete. Oil-Gas Field Surf. Eng. 2006, 25, 47. [Google Scholar]
- Illston, J.M.; Nyame, B.K. Relationships between permeability and pore structure of hardened cement paste. Mag. Concr. Res. 1981, 33, 139–146. [Google Scholar]
- Li, X.; Liu, M.; Ma, B.; Jian, S.; Su, L.; Zhao, Z. Influence of pore structure on foam concrete and controlling method. Mater. Rev. 2012, 26, 141–260. [Google Scholar]


| Materials | Properties of Materials |
|---|---|
| Cement | Portland cement PO325, ignition loss 2.28%, initial setting time ≥ 45 min, chemical composites are shown in Table 2 |
| Sand | Ordinary river sand (SiO2), 50% of the total mass particle size ≤ 0.25 mm, the average particle size: 0.25–0.5 mm |
| Water | Ordinary tap water, composites are shown in Table 3 |
| Copper electrode | Diameter 1 mm, aperture 5 mm × 5 mm, processed into a size of 40 mm × 65 mm sheet as the electrode |
| CuSO4 | Electrolyte solution for immersing the specimens; Analytical reagent; content ≥ 99% |
| Aluminum powder | 99.5% purity, diameter 60–75 µm |
| Triterpene saponin air-entraining admixture SJ-2 | Light yellow powder; content of natural triterpene saponin ≥ 63% |
| Hydrogen peroxide | Liquid, 30% purity |
| Sodium lauryl sulfate air-entraining admixture K12 | White powder, content of active substance > 94% |
| Anhydrous methanol | 99.9% purity |
| Type 3A molecular sieve | SiO2/Al2O3 ≈ 2, effective aperture is about 0.3 nm, diameter 1.7–2.5 mm, water absorption > 80%(weight) |
| Epoxy resin | AB Type epoxy resin. Part A is resin. Part B is hardener. Part A and Part B mixed by mass ratio 1:1. Initial set time 3 min, final set time 5–10 min. |
| Composites | CaO | SiO2 | Al2O3 | Fe2O3 | MgO | K2O | Na2O | SO3 | Cl− |
|---|---|---|---|---|---|---|---|---|---|
| Content (%) | 62.17 | 21.84 | 6.56 | 4.15 | 2.23 | 0.34 | 0.41 | 2.26 | 0.013 |
| Composites | Al | Fe | Mn | Cu | Zn | Cl− | SO4− | NO3− | As | Cr(VI) | Se |
|---|---|---|---|---|---|---|---|---|---|---|---|
| Content (mg/L) | 0.03 | <0.05 | <0.05 | <0.05 | <0.05 | 8.4 | 29.9 | 0.62 | <0.001 | <0.004 | <0.001 |
| Air-Entraining Agent | Water/Cement Ratio | ||||
|---|---|---|---|---|---|
| 0.5 | 0.6 | 0.7 | 0.8 | 0.9 | |
| Reference mortar | - | - | B | - | - |
| Aluminum powder | A-5 | A-6 | A-7 | A-8 | A-9 |
| Hydrogen peroxide (H2O2) | H-5 | H-6 | H-7 | H-8 | H-9 |
| SJ-2 air-entraining agent | S-5 | S-6 | S-7 | S-8 | S-9 |
| K12 air-entraining agent | K-5 | K-6 | K-7 | K-8 | K-9 |
| Aluminum + H2O2 | AH-5 | AH-6 | AH-7 | AH-8 | AH-9 |
| Aluminum + SJ-2 | AS-5 | AS-6 | AS-7 | AS-8 | AS-9 |
| Aluminum + K12 | AK-5 | AK-6 | AK-7 | AK-8 | AK-9 |
| Specimens | Weight (g) | dM (g) | ||||
|---|---|---|---|---|---|---|
| (0d) M0 | (1d) M1 | (2d) M2 | (3d) M3 | (4d) M4 | ||
| B | 145.17 | 147.77 | 148.02 | 148.24 | 148.29 | 3.12 |
| A5 | 138.98 | 147.92 | 148.50 | 148.54 | 148.64 | 9.66 |
| A6 | 127.08 | 140.33 | 140.95 | 141.47 | 141.75 | 14.67 |
| A7 | 131.13 | 142.23 | 142.94 | 143.29 | 143.44 | 12.31 |
| A8 | 138.82 | 144.48 | 144.83 | 145.30 | 145.59 | 6.77 |
| A9 | 128.34 | 134.95 | 135.26 | 135.79 | 136.12 | 7.78 |
| H5 | 146.09 | 149.75 | 150.07 | 150.08 | 150.12 | 4.03 |
| H6 | 149.72 | 155.01 | 155.21 | 155.23 | 155.25 | 5.53 |
| H7 | 150.60 | 156.34 | 156.53 | 156.55 | 156.56 | 5.96 |
| H8 | 148.01 | 154.12 | 154.33 | 154.34 | 154.35 | 6.34 |
| H9 | 143.87 | 150.86 | 151.07 | 151.13 | 151.15 | 7.28 |
| S5 | 145.82 | 149.50 | 149.84 | 149.99 | 150.10 | 4.28 |
| S6 | 134.03 | 139.19 | 139.72 | 139.95 | 140.13 | 6.10 |
| S7 | 138.38 | 144.21 | 144.74 | 145.00 | 145.14 | 6.76 |
| S8 | 140.00 | 144.74 | 144.92 | 145.12 | 145.30 | 5.30 |
| S9 | 131.25 | 136.66 | 136.88 | 137.14 | 137.25 | 6.00 |
| K5 | 120.84 | 125.25 | 125.72 | 126.19 | 126.28 | 5.44 |
| K6 | 116.72 | 122.34 | 122.67 | 123.01 | 123.03 | 6.31 |
| K7 | 125.48 | 132.53 | 132.83 | 132.96 | 132.99 | 7.51 |
| K8 | 137.73 | 145.75 | 145.87 | 145.99 | 146.03 | 8.30 |
| K9 | 142.80 | 151.10 | 151.19 | 151.29 | 151.32 | 8.52 |
| AH5 | 128.12 | 133.59 | 134.03 | 134.58 | 134.73 | 6.61 |
| AH6 | 132.02 | 137.86 | 138.51 | 139.03 | 139.24 | 7.22 |
| AH7 | 130.88 | 137.55 | 138.09 | 138.62 | 138.84 | 7.96 |
| AH8 | 128.41 | 134.93 | 135.45 | 136.01 | 136.21 | 7.80 |
| AH9 | 128.25 | 136.18 | 136.66 | 137.15 | 137.31 | 9.06 |
| AS5 | 124.44 | 131.86 | 132.54 | 133.28 | 133.37 | 8.93 |
| AS6 | 124.66 | 132.93 | 133.67 | 134.66 | 134.73 | 10.07 |
| AS7 | 113.45 | 124.29 | 125.11 | 125.92 | 126.04 | 12.59 |
| AS8 | 127.94 | 136.32 | 136.94 | 137.76 | 137.86 | 9.92 |
| AS9 | 130.21 | 137.15 | 137.66 | 138.37 | 138.46 | 8.25 |
| AK5 | 112.59 | 120.97 | 121.49 | 122.00 | 122.27 | 9.68 |
| AK6 | 111.98 | 118.99 | 120.12 | 121.00 | 121.21 | 9.23 |
| AK7 | 116.69 | 125.35 | 126.02 | 126.68 | 126.90 | 10.21 |
| AK8 | 126.27 | 136.99 | 137.68 | 138.25 | 138.57 | 12.30 |
| AK9 | 127.38 | 136.20 | 136.75 | 137.25 | 137.50 | 10.12 |
| Specimens | 28 days Compressive Strength (MPa) | Porosity | Resistivity (Ω·m) | ||||||
|---|---|---|---|---|---|---|---|---|---|
| 0 day | 1 day | 3 day | 7 day | 14 day | 28 day | ||||
| B | 29.28 | 17.34% | 11.839 | 23.711 | 40.491 | 56.549 | 93.039 | 159.819 | 1249.94% |
| A-5 | 15.50 | 16.96% | 30.293 | 36.563 | 42.962 | 58.827 | 91.261 | 143.113 | 372.42% |
| A-6 | 12.68 | 24.58% | 10.824 | 12.242 | 13.737 | 17.153 | 22.341 | 40.833 | 277.25% |
| A-7 | 11.80 | 23.21% | 11.798 | 13.732 | 15.660 | 18.847 | 25.241 | 48.465 | 310.78% |
| A-8 | 8.94 | 21.48% | 11.656 | 13.452 | 14.625 | 18.033 | 27.654 | 49.452 | 324.25% |
| A-9 | 7.79 | 19.74% | 10.112 | 11.509 | 12.740 | 16.589 | 33.256 | 68.103 | 573.47% |
| H-5 | 29.92 | 13.33% | 24.443 | 34.048 | 41.608 | 54.750 | 82.319 | 146.303 | 498.55% |
| H-6 | 28.62 | 15.65% | 18.878 | 24.541 | 29.917 | 39.621 | 55.883 | 92.332 | 389.08% |
| H-7 | 25.62 | 17.94% | 14.757 | 18.511 | 22.805 | 29.677 | 41.251 | 76.867 | 420.88% |
| H-8 | 24.61 | 19.24% | 13.798 | 15.812 | 18.552 | 24.237 | 33.156 | 58.704 | 325.44% |
| H-9 | 22.17 | 19.84% | 10.199 | 11.757 | 13.762 | 17.956 | 24.529 | 41.839 | 310.23% |
| S-5 | 24.84 | 16.87% | 30.494 | 36.631 | 45.845 | 60.320 | 84.289 | 116.051 | 280.57% |
| S-6 | 19.12 | 18.52% | 24.934 | 27.907 | 32.960 | 44.356 | 64.615 | 100.891 | 304.63% |
| S-7 | 18.18 | 20.77% | 21.376 | 21.385 | 25.388 | 33.378 | 47.308 | 69.136 | 223.43% |
| S-8 | 16.94 | 22.31% | 20.544 | 25.960 | 29.778 | 37.194 | 52.588 | 73.755 | 259.01% |
| S-9 | 13.39 | 23.99% | 17.652 | 21.932 | 26.433 | 37.933 | 57.744 | 91.537 | 418.58% |
| K-5 | 16.17 | 17.63% | 26.091 | 32.329 | 46.108 | 75.923 | 140.526 | 290.259 | 1012.49% |
| K-6 | 15.92 | 17.27% | 16.051 | 20.964 | 30.746 | 53.615 | 109.450 | 336.376 | 1995.61% |
| K-7 | 13.87 | 17.52% | 14.699 | 18.063 | 23.761 | 37.266 | 66.970 | 152.084 | 934.68% |
| K-8 | 10.90 | 19.12% | 9.439 | 11.441 | 14.952 | 23.817 | 43.265 | 105.073 | 1013.22% |
| K-9 | 8.07 | 20.60% | 8.926 | 10.479 | 12.435 | 16.557 | 25.060 | 50.711 | 468.09% |
| AH-5 | 18.31 | 20.68% | 13.165 | 15.087 | 16.360 | 19.940 | 26.614 | 59.246 | 350.02% |
| AH-6 | 16.33 | 21.86% | 11.305 | 12.726 | 13.747 | 18.952 | 23.925 | 40.292 | 256.40% |
| AH-7 | 13.38 | 22.28% | 10.215 | 11.746 | 12.816 | 16.589 | 26.127 | 47.581 | 365.79% |
| AH-8 | 11.22 | 23.04% | 10.660 | 12.370 | 14.077 | 19.252 | 35.343 | 73.361 | 588.19% |
| AH-9 | 9.26 | 22.75% | 8.080 | 9.249 | 10.552 | 16.736 | 32.336 | 62.535 | 673.91% |
| AS-5 | 16.87 | 21.47% | 9.172 | 12.724 | 15.262 | 19.896 | 28.336 | 69.629 | 659.17% |
| AS-6 | 12.21 | 21.17% | 7.328 | 9.442 | 11.323 | 14.808 | 21.413 | 57.459 | 684.05% |
| AS-7 | 10.21 | 25.31% | 4.042 | 4.955 | 5.821 | 7.283 | 8.945 | 19.375 | 379.29% |
| AS-8 | 9.06 | 22.20% | 6.566 | 7.920 | 9.136 | 11.898 | 18.274 | 48.843 | 643.85% |
| AS-9 | 6.88 | 20.47% | 6.866 | 8.539 | 9.944 | 12.174 | 18.489 | 47.910 | 597.82% |
| AK-5 | 8.75 | 34.05% | 2.852 | 3.408 | 3.681 | 4.792 | 6.109 | 8.452 | 196.35% |
| AK-6 | 7.10 | 33.43% | 4.235 | 4.931 | 5.376 | 6.719 | 8.588 | 11.288 | 166.53% |
| AK-7 | 6.06 | 31.64% | 4.589 | 5.377 | 6.174 | 8.434 | 10.959 | 18.399 | 300.96% |
| AK-8 | 5.58 | 30.08% | 3.888 | 4.507 | 4.810 | 6.123 | 8.455 | 9.984 | 156.80% |
| AK-9 | 4.93 | 27.02% | 5.417 | 6.295 | 6.855 | 8.538 | 12.956 | 27.832 | 413.80% |
© 2019 by the authors. Licensee MDPI, Basel, Switzerland. This article is an open access article distributed under the terms and conditions of the Creative Commons Attribution (CC BY) license (http://creativecommons.org/licenses/by/4.0/).
Share and Cite
Zhao, R.; Weng, Y.; Tuan, C.Y.; Xu, A. The Influence of Water/Cement Ratio and Air Entrainment on the Electric Resistivity of Ionically Conductive Mortar. Materials 2019, 12, 1125. https://doi.org/10.3390/ma12071125
Zhao R, Weng Y, Tuan CY, Xu A. The Influence of Water/Cement Ratio and Air Entrainment on the Electric Resistivity of Ionically Conductive Mortar. Materials. 2019; 12(7):1125. https://doi.org/10.3390/ma12071125
Chicago/Turabian StyleZhao, Ruohong, Yubin Weng, Christopher Y. Tuan, and An Xu. 2019. "The Influence of Water/Cement Ratio and Air Entrainment on the Electric Resistivity of Ionically Conductive Mortar" Materials 12, no. 7: 1125. https://doi.org/10.3390/ma12071125
APA StyleZhao, R., Weng, Y., Tuan, C. Y., & Xu, A. (2019). The Influence of Water/Cement Ratio and Air Entrainment on the Electric Resistivity of Ionically Conductive Mortar. Materials, 12(7), 1125. https://doi.org/10.3390/ma12071125