1. Introduction
Among the large variety of fasteners used in aircraft components, assembly-blind fasteners are a specific type, which, for installation, just require access the front side of the assembly. This offers the chance of cheaper and easier automation solutions.
The fastening process is a challenging operation involving multiple knowledge fields (metallic materials, composite materials, classic mechanics, plastic deformation, machining and manufacturing, contact mechanics, tribology, and others). The scientific community has been involved in great efforts toward the understanding and modelling of the fastening process over the years [
1,
2] and also in developing methods for assessing the state of fastened joints [
3,
4].
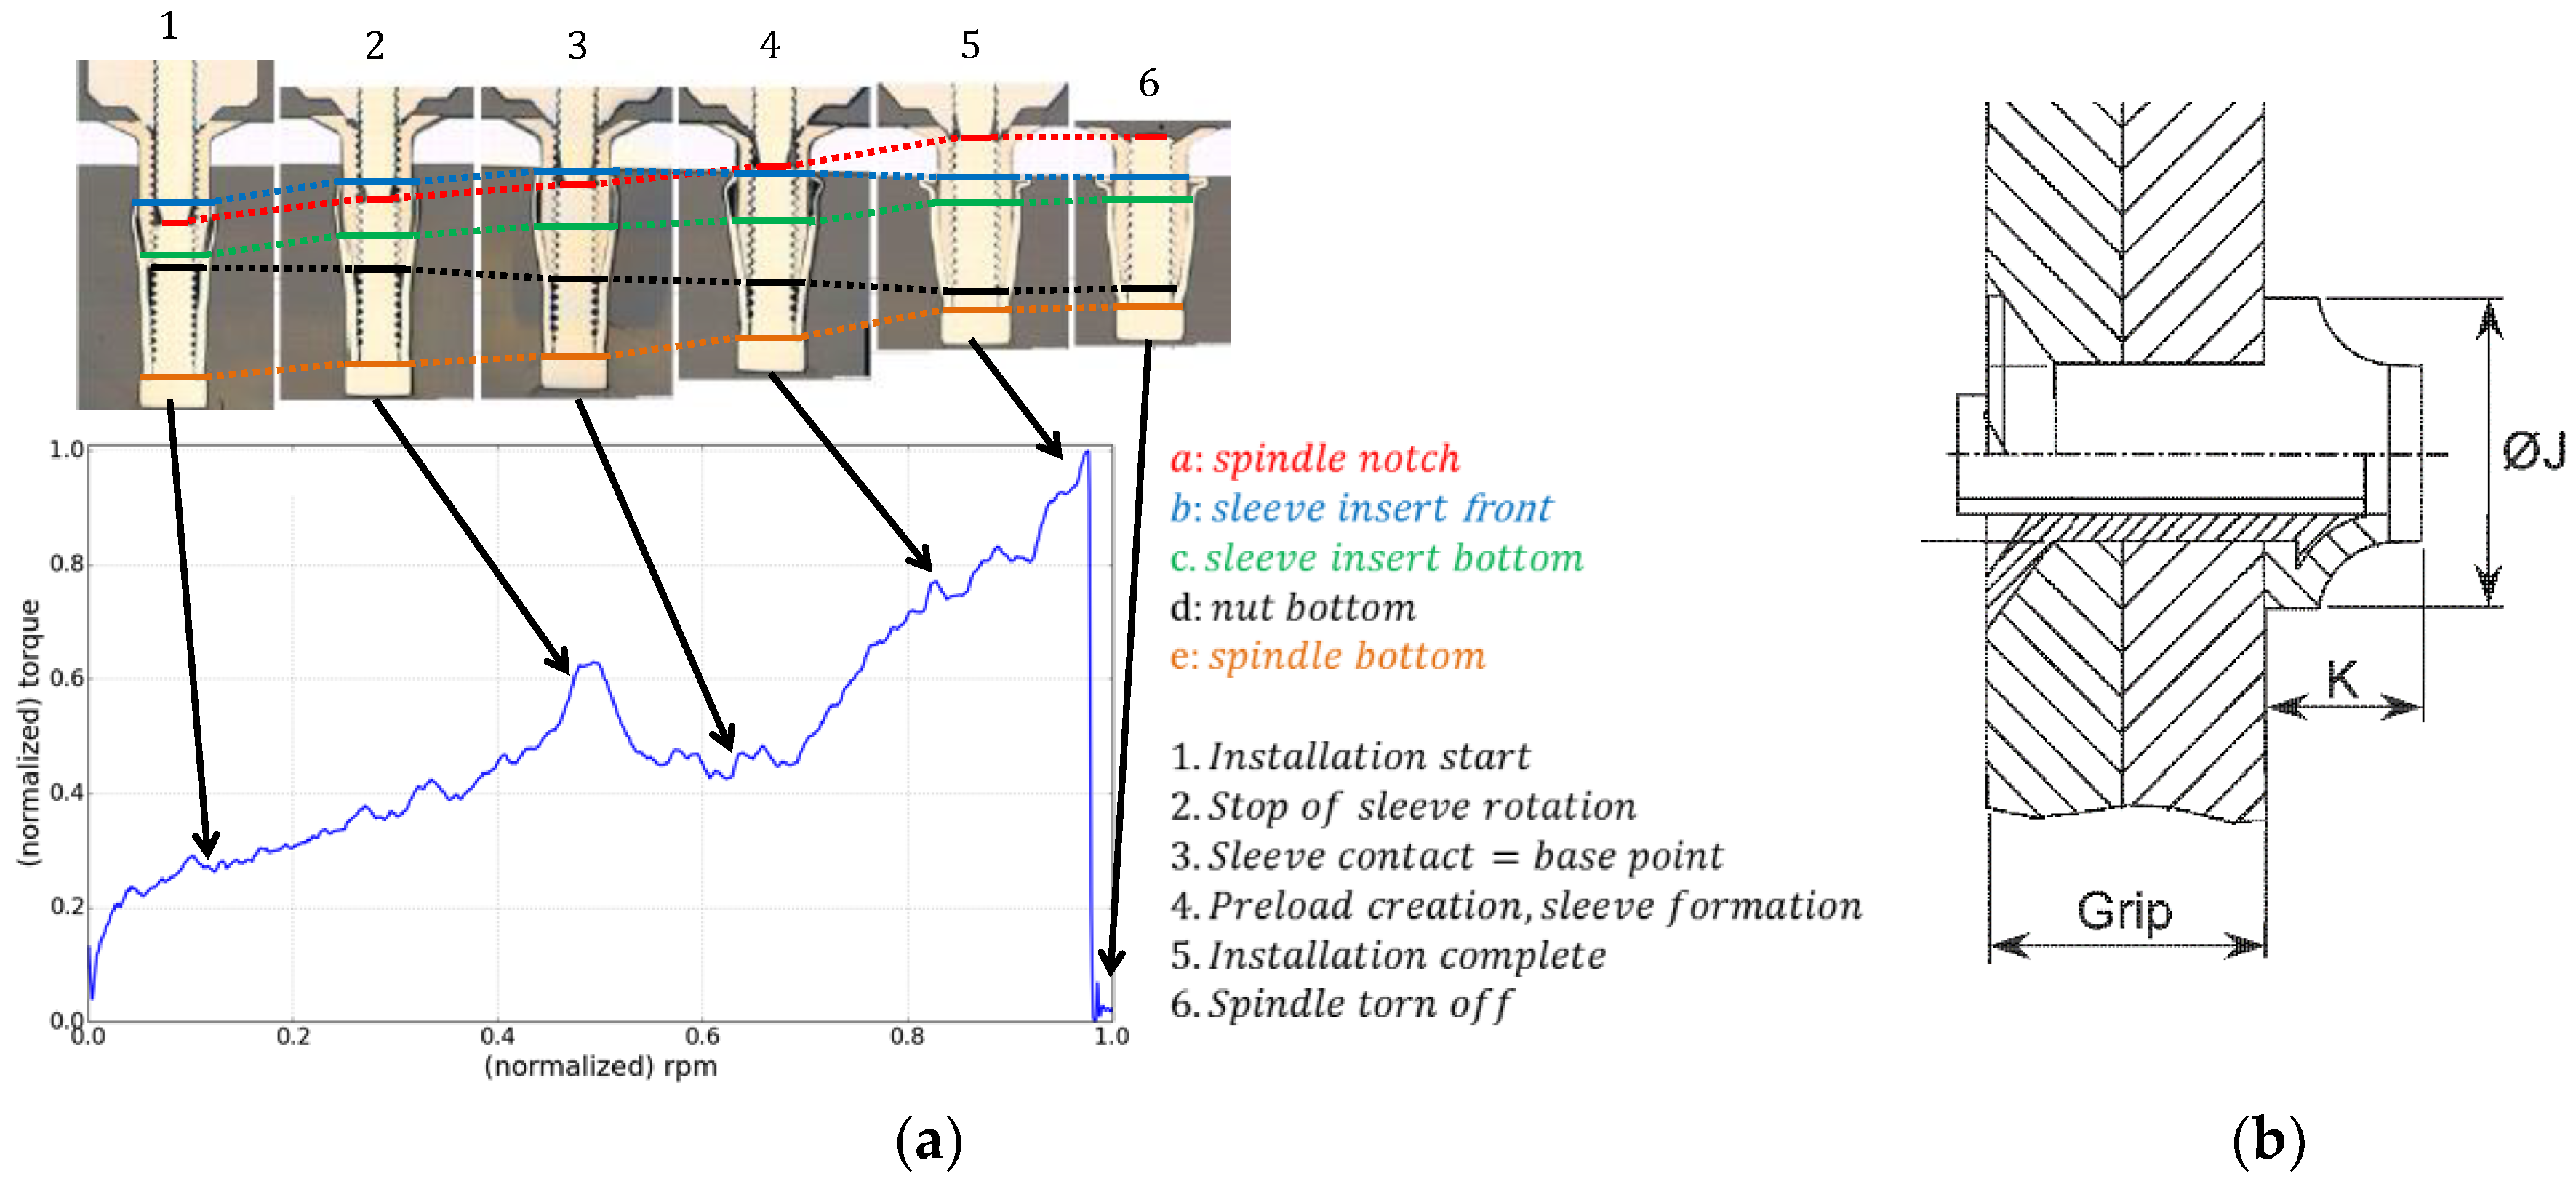
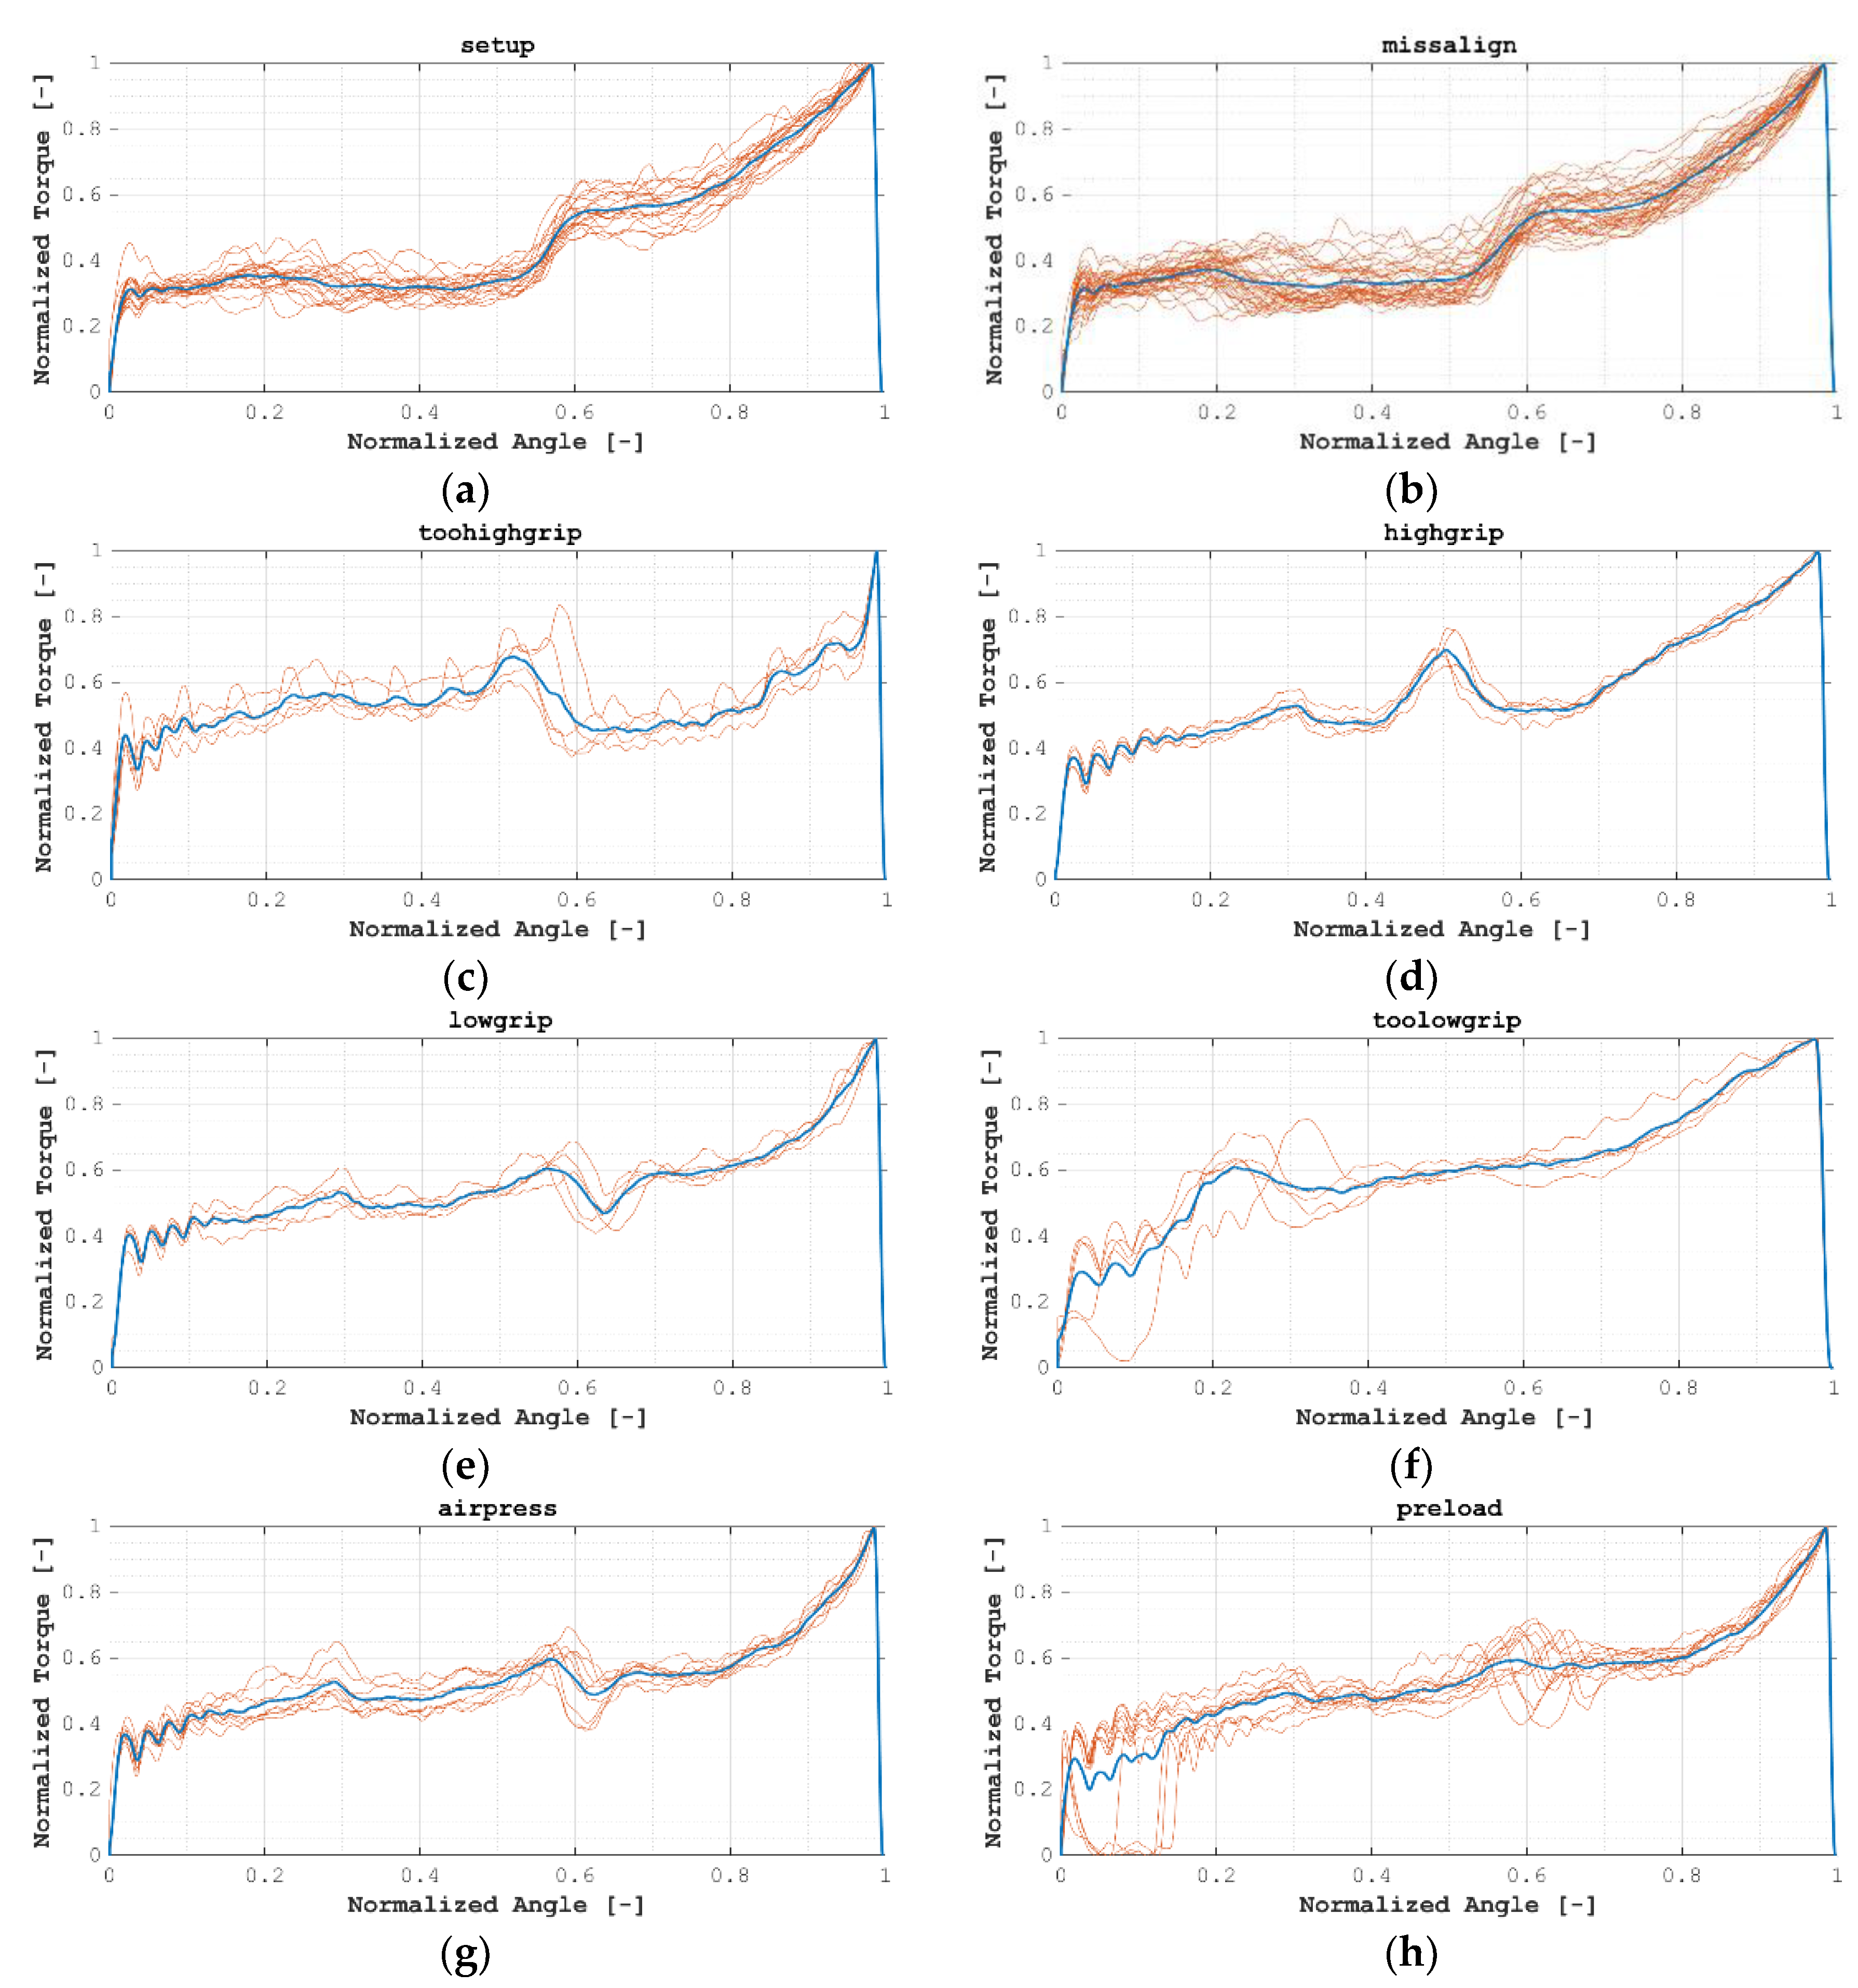
Evaluating an installed blind fastener depends greatly, as shown in
Table 1, on the examination of the formed head (sleeve and spindle) on the back side of the assembly. When blind fasteners are used in closed structures their evaluation after installation is not feasible without using time and cost-intensive equipment. Sometimes, no evaluation at all is possible. Quite often, these issues are solved by overcalculating the number of fasteners in order to meet safety requirements, though this leads to the increase of weight and production costs. Note that a commercial aircraft requires the installation of around 1,500,000–3,000,000 fasteners [
5]. A reduction of 15% fuselage weight could be achieved by substituting riveting for alternative joining processes [
6]. Under these conditions, it is clear that the potential benefits of blind fasteners are not currently being fully exploited.
Therefore, a monitoring system for the installation of blind fasteners does not only involve an automated solution that alerts on faulty installations with a high degree of reliability and robustness, but also involves a solution to avoiding any direct inspection of the formed head (i.e., with no access to the assembly back side).
Inspection for the assessment of the installation of blind fasteners is an essential component to overcome to reduce aircraft manufacturing, maintenance, and operation costs. The lack of an effective method for the inspection of blind fasteners involves a certain degree of uncertainty. Due to such uncertainty, the manufacturing of aircrafts is penalized: i) directly, because blind fastened joints are currently designed with security factors that lead to the use of a bigger number of fasteners per joint, and this way airplanes are more expensive to manufacture, require longer manufacturing lead times, and are heavier, due to the increase in number of fasteners; and ii) indirectly, because the uncertainty entails a higher risk of failure and, thus, the use of blind fasteners is avoided in certain critical components, in favor of less suitable, but more confident, joining methods. In fact, “sensor-based process monitoring and control and automated quality inspection” was set as a key research challenge for improving the joining of dissimilar materials by Martinsen, Hu, and Carlson in Reference [
7]. The industrial and scientific community are developing methods for taking advantage of the current on-line monitoring capabilities, resulting in large data quantities as the basis for the development of prognosis models (Diez et al. [
8]). For example, Palasciano et al. [
9] have developed a machine processing and sensing information-based model for abnormal energy consumption identification, caused not necessarily by failure conditions but by erroneous human-made inputs (dimensioning, established cutting conditions, and trajectory programming).
Although big efforts are being put into the inspection and maintenance of fastened joints, seeking for early detection of defects on the joints (cracks, corrosion, delamination, or others), there are no extended inspection techniques for assessing the quality of the installation itself. A review on current non-destructive methods for assessing fastened joints was performed by Thoppu et al. in Reference [
10]. Aiming at assessing the appearance of corrosion in multi-layered structures, Le et al. [
11] present a method for the inspection of the integrity of rivets themselves, which could be applicable to blind fasteners too. The method assesses the integrity of the nut, but it is not intended for assessing the quality of the installation (nor is it able to; an incorrect installation with a sound nut will not be detected by this method). Zhang et al. [
12] developed a linear index (obtained after the analysis of the energy lost by an acoustic wave passing through a tight/loose bolt) to assess the tightening state of fastened joints, which could lead to early detection of degraded joints during service, but cannot assess the quality of the installation (an incorrect installation may lead to initial proper tightening of the joint). In [
13], Camacho et al. propose a method for assessing the quality of the installation of blind rivets, based on one process parameter (cycle time) and one additional parameter to be measured after the installation: The time-of-flight of an ultrasonic pulse through the rivet nut. Saygin, Mohan, and Sarangapani [
14] analyzed the fastening process using torque and angle signals and developed a Mahalanobis-Taguchi systembased approach for detecting the real grip length of each installed rivet, aiming at assessing if the grip rivet is used correctly at each installation. In Reference [
15], a kernel density-based method is applied to the head diameter and the head height to automatically group data and remove outliers, and then identifies the classification of patterns for the corresponding torque vs rpm diagrams.
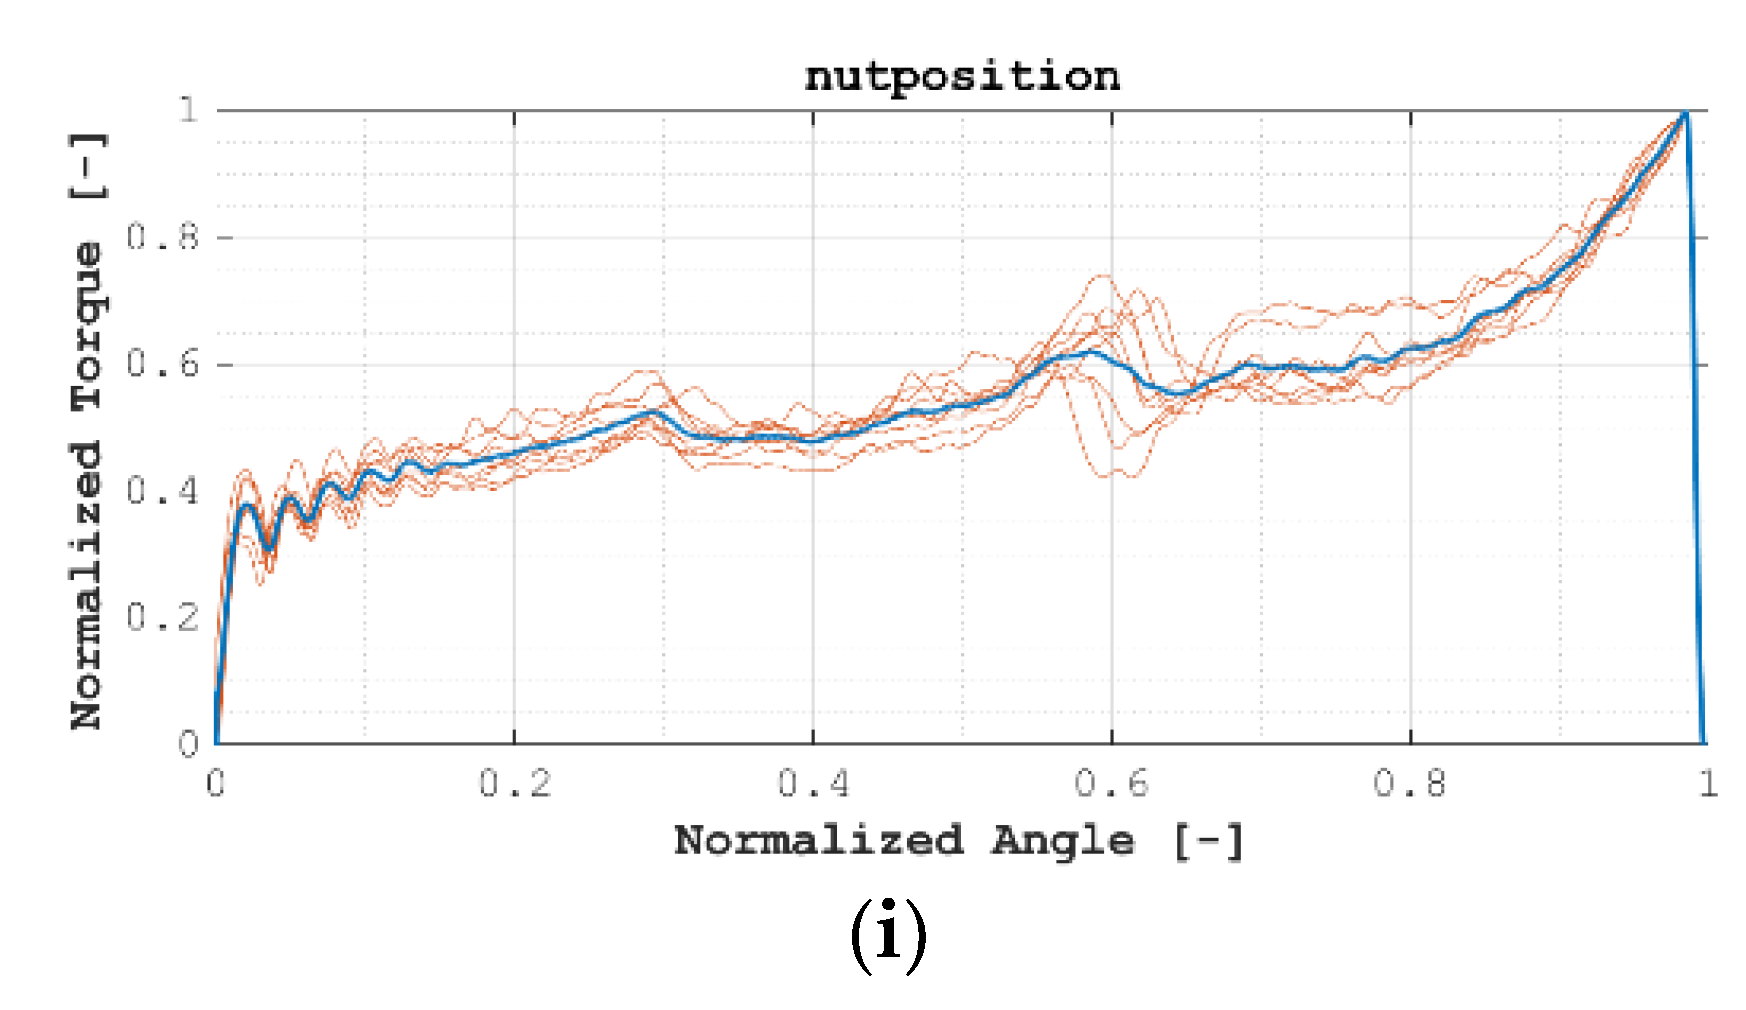
Current research work develops a method for assessing the installation of blind rivets, based on the analysis and processing of process signals measured online during the installation process. The main contribution of current work consists on a laboratory-stage method that has proved its potential for assessing the quality of the installation of blind rivets, which could be generalized for its industrial application.
3. Towards a Classification Method: Data Clustering
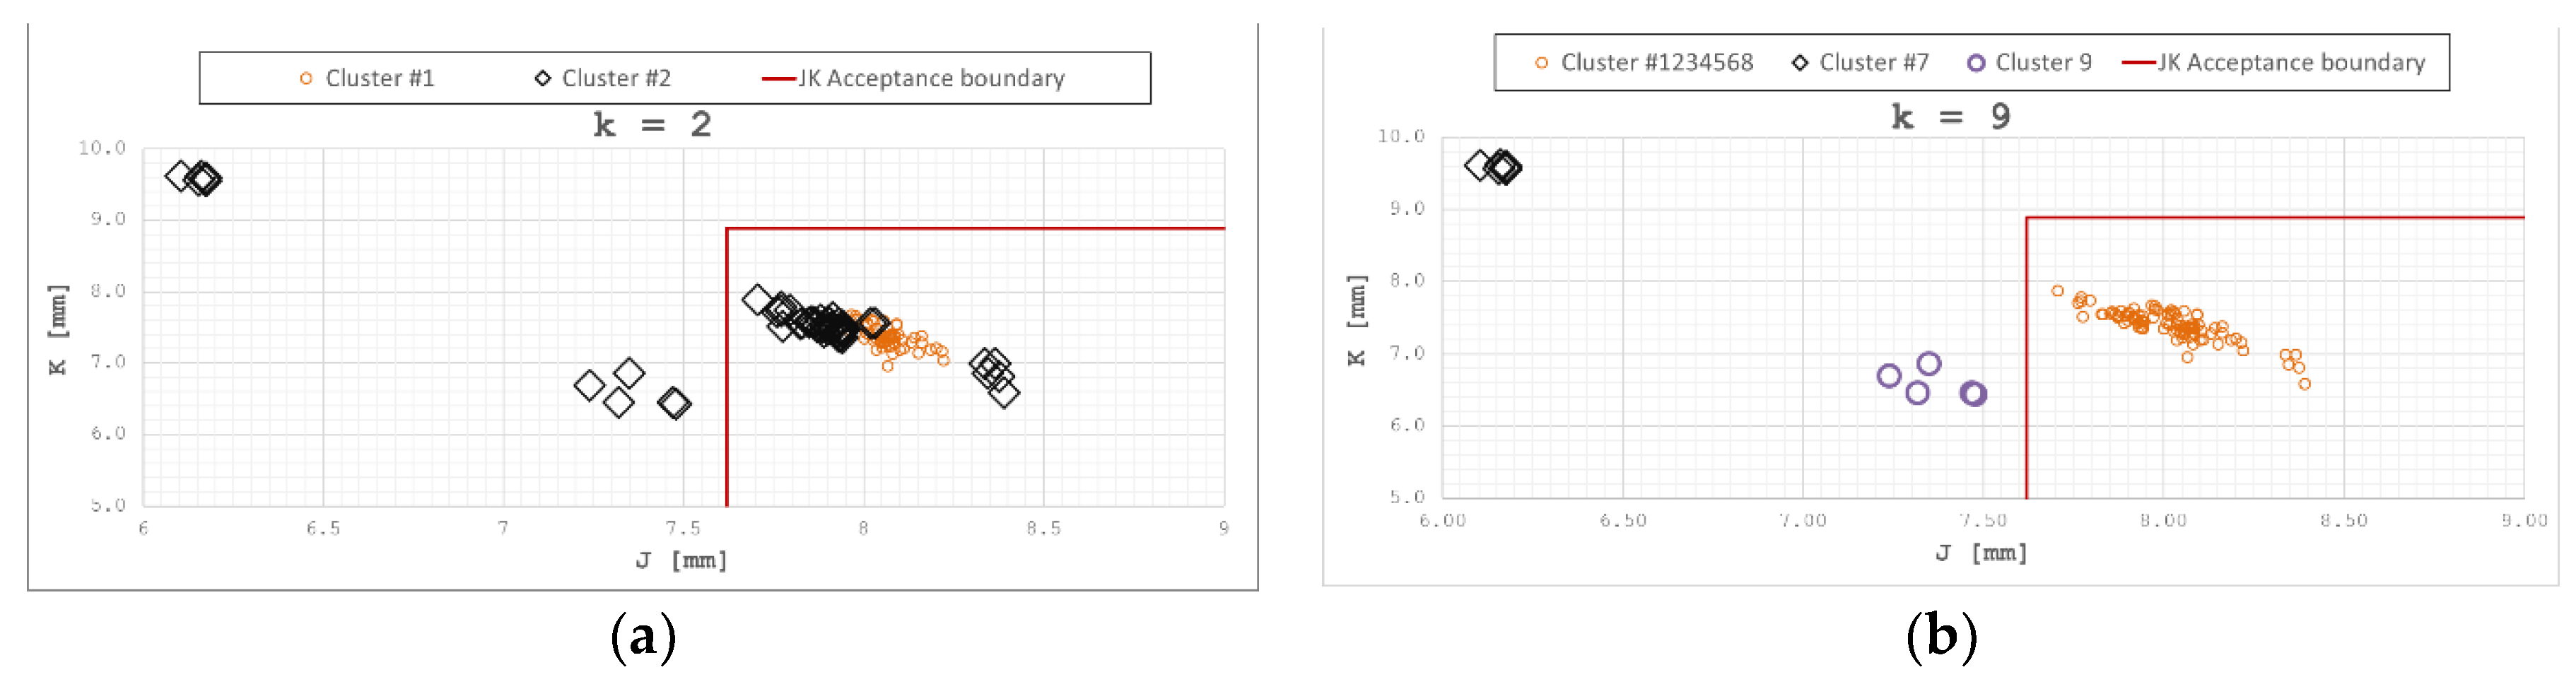
For the test samples it was possible to easily access the blind side of the joint and, thus, to measure directly J and K values and classify each installation as sound or faulty (OK or NOK). Consequently, having a direct classification of each test item, a supervised method may be expected as a classification algorithm, labeling an installation either as OK or NOK directly based on the prediction made by the classifier given by the normalized torque/normalized angle diagram of a newly tested installation.
Yet, it is believed that such classification may not be sensitive enough. It is hypothesized that the different normalized torque/normalized angle diagram may lead to OK installations and several different diagrams may lead to NOK installations. For instance, diagrams of installations of fasteners at the uppermost limit and the lowermost limit of the grip could present severe differences and still lead both to OK installations.
That is, several failure mechanisms can lead to NOK installations, as seen in
Table 1. Even for a single failure mode, it is considered that different angle-torque diagrams may lead to NOK installations.
Furthermore, a NOK installation means that the installation is unsuccessful; however, it can be due to different reasons (too low J or too high K, or even both too low J and too high K). In conclusion, the NOK label integrates all possible failure modes and, thus, it is considered as the union of subgroups. Clustering the data into groups is intended to identify such subgroups.
The aim of this research is to study the applicability of unsupervised methods to establish the similarities and differences between OK and NOK installations in terms of normalized torque/normalized angle diagrams, without considering the J–K values. The latter values will be used to evaluate the achieved results.
For that reason, the use of unsupervised classification methods is suggested in current research; for instance, the
k-means algorithm, one of the most popular clustering methods [
17]. The
k-means algorithm is an unsupervised clustering method which will group together similar samples into a predefined number of clusters, ‘
k’. The similarity between two samples was measured as the Euclidean distance between them, considering each point in the normalized angle/normalized torque signal as a degree of freedom or coordinate. That is, each point of the curve was considered as an attribute. The
k-means algorithm will seek to minimize the total distance of all riveted installations by assigning each installation to the closest cluster.
This way, two separate analyses were performed, which consider different numbers of clusters:
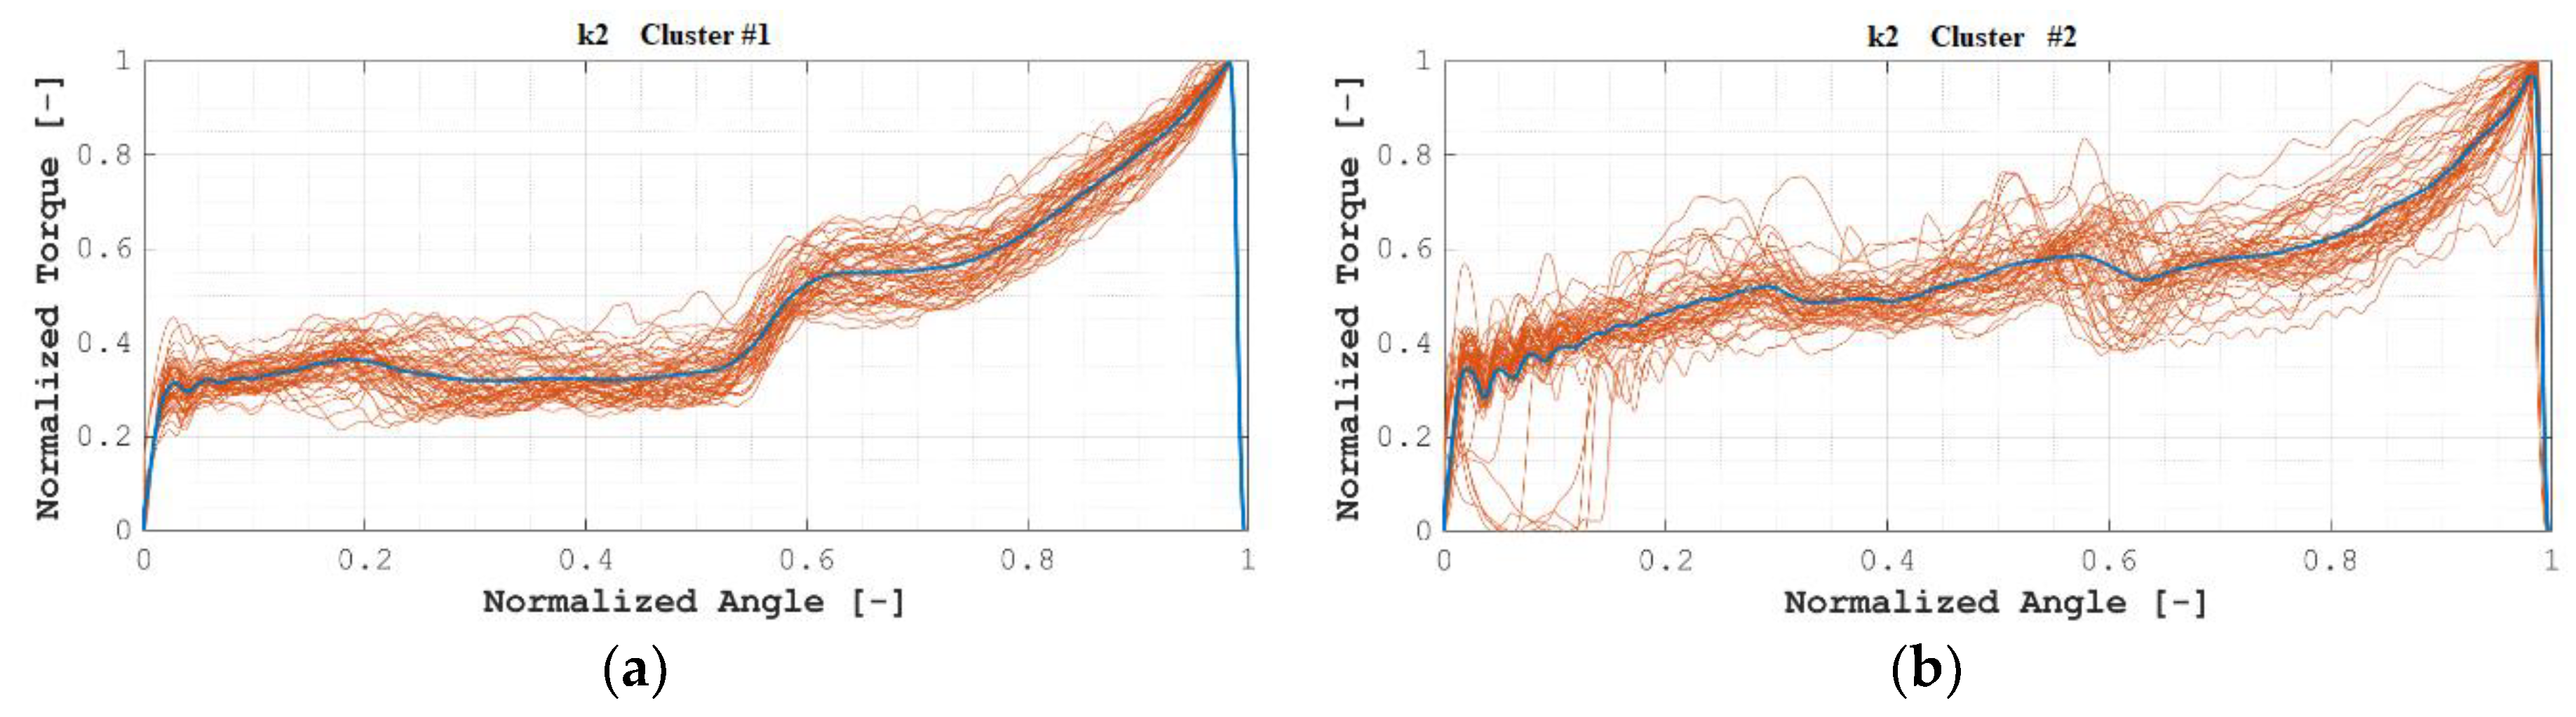
Grouping into 2 clusters, k = 2.
Although, as explained, the NOK label was expected to gather several subgroups, being the aim to classify installation as either OK or NOK, the ability to obtain directly the classification from normalized torque signals is studied.
Grouping into 9 clusters, k = 9.
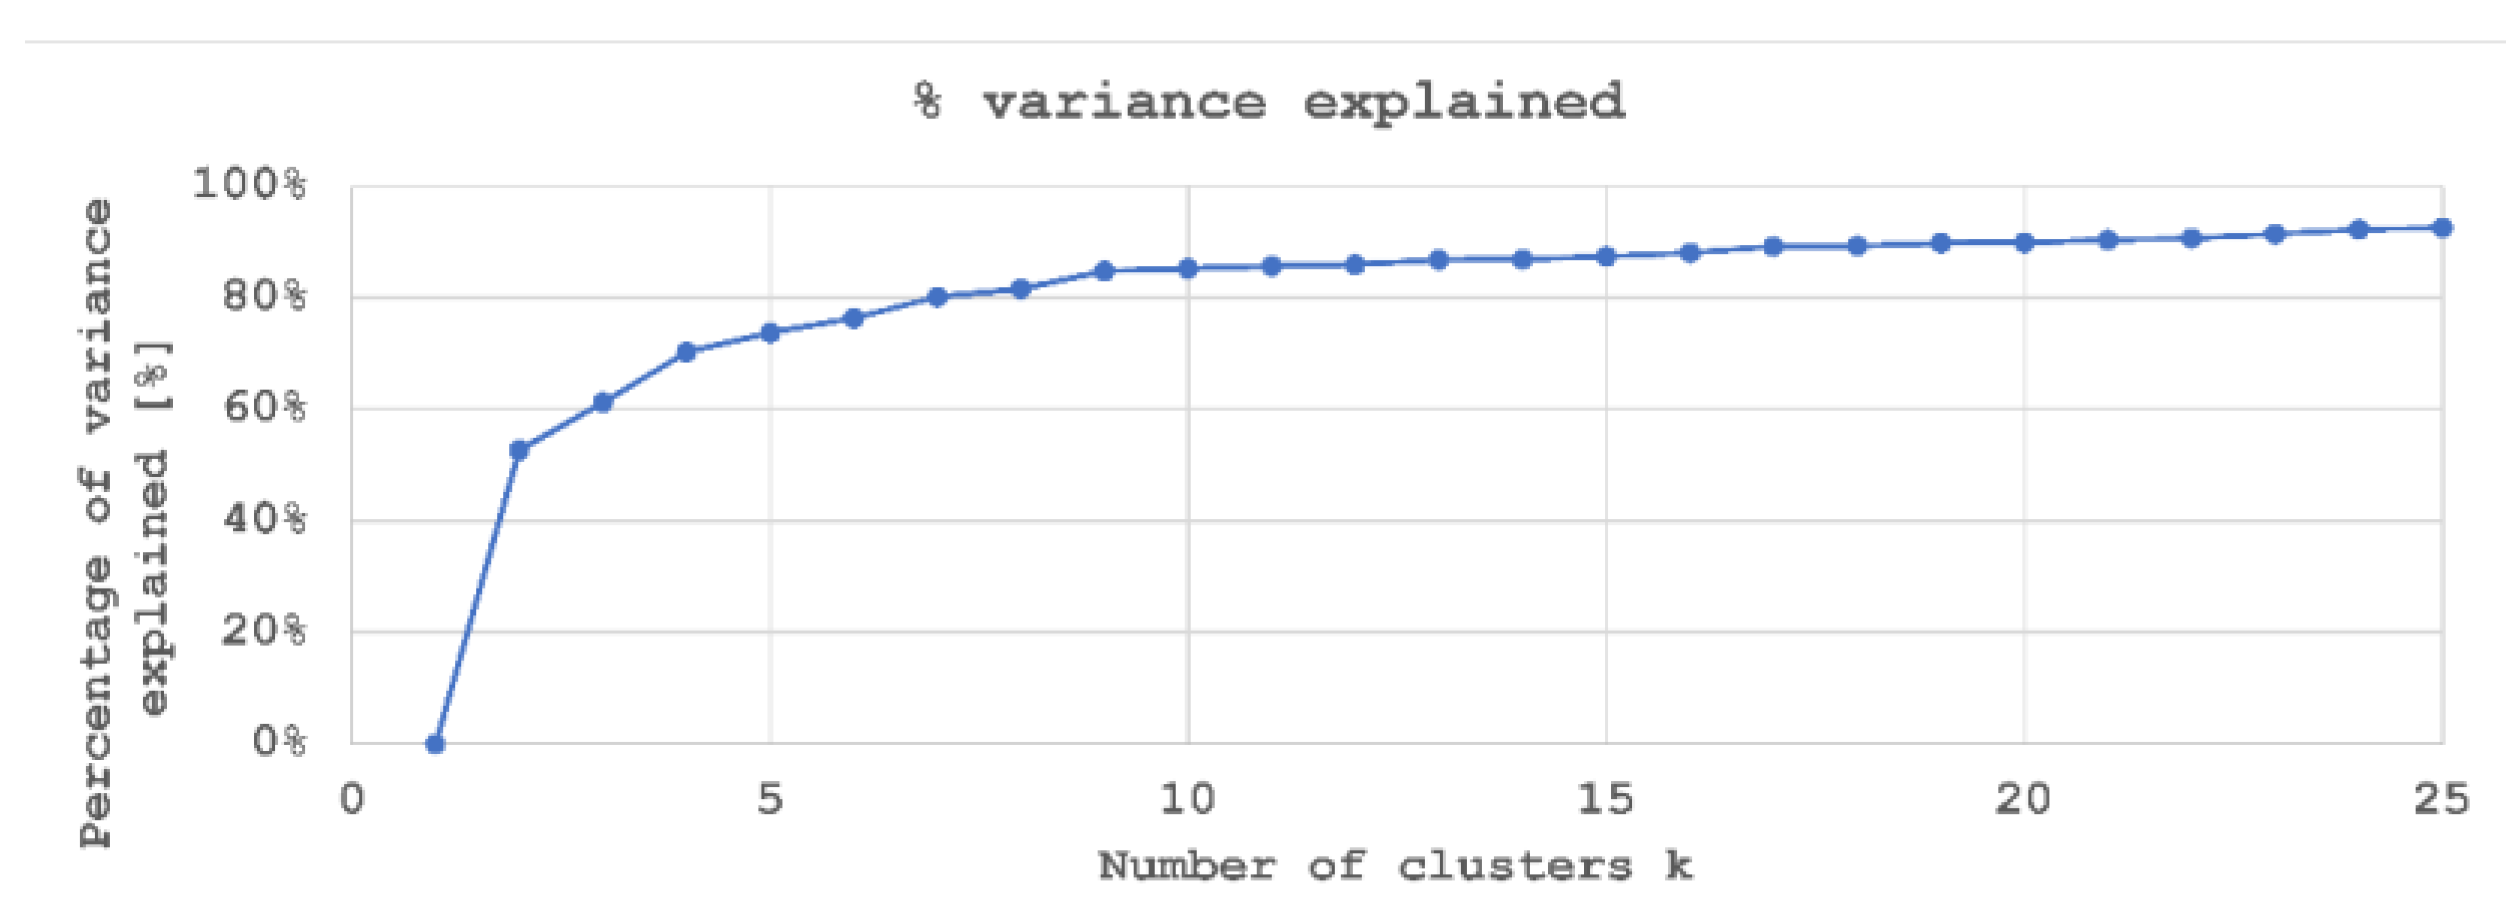
As shown in
Figure 6, the higher the number of clusters, the higher the explained variance of the rivet installation data. Considering that riveted samples were obtained in 9 groups (see
Table 2), and that higher values of k do not significantly increase the amount of variance explained, an analysis with
k = 9 was performed.

 ,
, 


