Article

Decomposition Characteristics of SF6 under Flashover Discharge on the Epoxy Resin Surface

1
School of Electrical Engineering, Wuhan University, Wuhan 430072, China
2
State Grid Electric Power Research Institute, Wuhan Nari Co Ltd, Wuhan 430074, China
3
Wuhan Branch, China Electric Power Research Institute Co., Ltd., Wuhan 430074, China
*
Author to whom correspondence should be addressed.
Materials 2019, 12(9), 1408; https://doi.org/10.3390/ma12091408
Submission received: 6 March 2019 / Revised: 11 April 2019 / Accepted: 25 April 2019 / Published: 30 April 2019
(This article belongs to the Section Materials Chemistry)

Abstract

:
In this paper, the flashover discharging experiment was carried out on epoxy resin surface in an SF6 atmosphere under pin-plate electrodes, with the electrodes distance from 5 mm to 9 mm. The concentration of seven characteristic gases was detected, indicating that the concentration of SOF2 and CF4 was the two highest, followed by SO2, CO2, SO2F2, CS2, and H2S. Based on the changes in the concentration of the characteristic gases, a preliminary rule was proposed to predict the occurrence of flashover discharge on epoxy resin: When the concentration of SOF2 reaches twice of CF4 concentration, and the total concentration of both SOF2 and CF4 is much higher than that of H2S, a possible flashover discharge on the epoxy resin surface in SF6-infused electrical equipment occurs. Through the simulation of decomposition of epoxy resin, it has been revealed that H2O has different generation paths that can facilitate the formation of SOF2, finally influencing the concentration variation of the seven characteristic gases.

1. Introduction

Gas-insulated electrical equipment has been widely used in power system because of their advantages such as compact size, high reliability, and a long maintenance period [1,2]. It was found that a considerable proportion of the internal faults of GIS (gas insulated switchgear) are closely related to the insulating spacer used to support the copper conductor, among which the surface discharge of insulating spacer is hard to be detected due to its randomness and instantaneity [3,4]. So far, attention has been paid to the fault detection technology for insulating spacer. The monitoring system on the decomposed gases of SF6 develops rapidly, which provides an effective way to judge the operation situation of SF6- infused electrical equipment.
SF6 can decompose into a series of subfluorides and sulfides when high energy imposes on SF6 molecules on the condition of partial discharge, overheating, corona, electrical breakdown, or even ultraviolet radiation [5,6,7]. Conventionally, subfluorides can recombine with fluorinion to form SF6 molecules again, owing to the intrinsic electronegativity property of SF6. However, in most cases, air and water vapor mixed with SF6 exists. These impurities react with subfluorides and produce various gases like SOF4, SOF2, SO2F2, SF4, SO2, CF4, CO2, H2S, and so on [8,9,10], which prevent the recombination of SF6 and subsequently reduce its insulation strength. Based on the concentration variation, a preliminary fault diagnosis method was provided to judge running situation of electrical equipment [8,9,10]. However, given the complicated internal situation of electrical equipment, there are many influential factors that tend to make concentration of decomposition components from SF6 fluctuate drastically, such as temperature, humidity, and running voltage. Flashover discharge on the surface of epoxy resin gives rise to partial decomposition of epoxy resin, leading to potential chemical reaction between epoxy resin and SF6 decomposition byproducts. However, this critical influential factor on SF6 byproduct concentration attracts less attention today.
The decomposition of SF6 has been extensively studied. Sausers et al. [11] conducted experiments on the effect of oxygen on SF6 decomposition byproducts and found that oxygen can promote the production of SO2F2 and SOF4, which has little effect on the generation rate of SOF2. Derdouri et al. [12] designed a study on the SF6 decomposition products when water vapor exists and found that SOF2 and SO2F2 generate stably in existence of water vapor. Later, it was found that SF6 decomposition byproducts, including SOF4, SOF2, SO2F2, SO2, HF, would appear as long as water vapor and oxygen existed [13]. Additionally, a study reported that several SF6 decomposition byproducts under four different kinds of partial discharge models, showing that CF4, CO2, SO2F2, SOF4, SOF2, SO2, and H2S were main decomposition products of SF6, among which the content of SOF2 and SO2F2 were the highest [14]. Furthermore, Belmadani et al. [15] explored the characteristics of SF6 decomposition products under AC arc and pointed out that the total content of SOF2 and SO2 would increase with current intensity. It has been generally accepted that all SF6 decomposition products concentration would increase with discharge energy, regardless of the kind of discharge [16,17,18]. The influences of solid insulation material on the decomposition of SF6 were also studied. For example, it was reported that CF4 would appear [12], since organic materials contain abundant C-H bonds that can easily react with fluorinion under high-energy arc discharge. Afterward, a small amount of CS2 was detected when flashover discharges happened on epoxy resin surface in 110 kV GIS, thus making it a characteristic gas in a fault detection system [19]. There is no dispute that SOF2, SO2F2, and SO2 will occur easily in partial discharge situation, and that H2S would be generated when discharge energy is high enough. Moreover, CF4, CO2, and CS2 would be generated when organic solid insulation materials decomposed partially under high voltage [12,15].
So far, no report has focused on how epoxy resin affects the decomposition of SF6 under flashover discharge yet. Additionally, it is too complicated to elaborate the chemical mechanism behind it. Although thermal and mechanical of epoxy resin can be enhanced through incorporating some filler into the polymer matrix, it still can decompose under arc discharge [20,21,22]. In the current study, pin-plate electrodes on the epoxy resin insulation spacer surface were designed; flashover discharge at different distances of pin-plate electrodes was carried out; and the concentration of decomposition byproducts of SF6, including SOF2, SO2F2, SO2, H2S, CF4, CO2, and CS2, was examined in order to find the relationship between decomposition of SF6 under flashover discharge on the epoxy resin surface. Besides, by simulating decomposition process of epoxy resin, the generation path of each gas was revealed.

2. Materials and Methods

2.1. Materials

In the present study, the bisphenol-A epoxy resin E51 (DGEBA) was purchased from Wuxi Lan-Star Petrochemical Co., Ltd. (Wuxi, China). Epoxy resin was cured by an amine curing agent consisting of an adduct of diethylenetriamine and butyl glycidyl ether, known as 593 curing agent, supplied by Wuhan Shen Chemical Reagents and Equipments Co., Ltd. (Wuhan, China). High-precision SF6 gas with grade of purity of 99.999% was supplied by Wuhan Newradar Gas Co., Ltd. (Wuhan, China). Therefore, the original percentage content of O2 and H2O in the gas was low enough to be omitted.

2.2. Experiment Platform

Among a multitude of documented electrical faults, flashover in the electrical equipment happens frequently. Today flashover fault can be detected easily, but it is still hard to explain the complicated mechanism behind it [5,6,7]. Flashover discharge emphasizes on electrical breakdown of gap happening on solid material surface, such as flashover discharge on basin spacer surface in gas-insulated electrical equipment, where flashover voltage or flashover current was studied. Therefore, in our experiment, pin-plate electrodes on the epoxy resin surface was devised to investigate influence of surface breakdown of epoxy resin on SF6 decomposition byproducts category and their concentration.
To create a severely uneven electrical field, pin-plate electrodes were used in this study, as shown in Figure 1. Given that the conducting rod in high-voltage cable is made of copper with better electric conductivity, the positive electrode in our study was a long-customized needle made of copper, the curvature radius of the needle electrode is 0.5 mm and beveled at 30° on the sample surface. The plate electrode is a semicircle copper sheet with a diameter of 10 mm and is stuck to the surface of epoxy resin with a small amount of conductive silver paste to ensure that the electrical arc was close enough to the surface when the gap breaks down. The epoxy spacer sample is a square piece with a size of 50 mm × 50 mm × 2 mm. The pin-plate electrodes are positioned in a sealed cylinder made of polymethyl methacrylate (PMMA) as shown in Figure 2. The AC high voltage power can provide a maximum value of 50 kV. Concentration of decomposed components of SF6 was measured on the gas chromatograph-mass spectrometer (GC-MS) and the type of GC-MS is Shimadzu QP-2010Ultra (Shimadzu Co., LTD, Kyoto, Japan).
To protect the voltage divider, the value of R2 in Figure 2 was usually below 200 Ω, and the value of R1 was usually above 3000 Ω to protect the transformer when voltage divider was totally destroyed. Because epoxy resin has a high electrical resistivity with an order of magnitude above 1013 Ω cm, it is fully accepted that the break-down voltage on the sample surface equals to the highest shown value on the operating board when the gap was not broken down.
Because roughness of sample surface has a significant influence on flashover discharge property of epoxy resin, roughness of the samples was assessed on the Surface Profilometer 2300 supplied by Wale Electromechanical Technology Co., Ltd. (Xi’an, China). Roughness of all the epoxy resin samples had an average value of 0.35 μm in the range from 0.27 μm to 0.48 μm. Conventionally, roughness of solid material surface should be kept below 1 μm in order to ensure the AC (Alternating Current) arc creeping closely on the sample surface.

2.3. Experiment Procedures

The specific experimental procedures are listed as follows:
First, all experiment materials were cleaned with anhydrous ethanol to get rid of dust and other impurities that may adhere to the experiment materials. After being volatilized with anhydrous ethanol, the epoxy spacer and electrodes were placed in the fixed position in the container. The distance between the pin-plate electrodes was set at 5, 6, 7, 8 and 9 mm, respectively. Then, the container was sealed.
Second, the chamber was evacuated to 0.01 MPa and filled with fresh SF6 until the pressure reached 0.2 MPa. It needed to take three times to remove most of water vapor and air. Subsequently, 100 mL of gas was extracted as the initial reference.
Finally, voltage was imposed slowly at the rate of 2 kV/30 s until the gap between the electrodes broke down, then the discharge voltage was recorded. After the decomposed gases diffused for 3 min in the chamber, 100 mL of gas was extracted from the chamber and then injected into the GC-MS. Twenty-one flashover discharge times were conducted for each gap distance in order to find the basic growth law of SF6 decomposition byproducts. As we all know, the surface flashover does significant harm to the dielectric property of epoxy resin. As the discharge number increased, the flashover voltage decreased slowly. The small decomposition, or the carbonization of the epoxy resin surface can cause obvious characteristic gases concentration change [23]. Therefore, 21 times of flashover discharges are enough to make significant harm to dielectric properties of epoxy resin and create more precise concentration variation.

3. Results and Discussion

3.1. Discharge Voltages Comparison

Figure 3 shows initial flashover discharge voltages vs. discharge times at different pin-plate electrodes distances. It is apparent that discharge voltage decreased rapidly in the first three times flashover discharges. Then, discharge voltage fluctuated slowly in a downward trend on the whole. After the breakdown of the gap between the electrodes, roughness of the epoxy resin sample surface increased with an obvious carbonization trace, which would greatly reduce flashover discharge voltage under the uneven electrical field. At the same time, water vapor generating during the decomposition of epoxy resin could also enhance the conductivity of carbonized trace on the surface [24]. As a result, the flashover discharge voltage decreased in the first three times. However, the roughness of the sample surface did not markedly change after being discharged four to six times, and water vapor maintained at a relatively stable level because it was exhausted quickly after it was generated. Hence, the flashover discharge voltage fluctuated in a downward trend.
A longer distance between the electrodes could cause a higher discharge voltage in the first three times, but longer distances cannot guarantee a higher discharge voltage as the discharge continued. In Figure 3, by keeping the distance of pin-plate electrodes at 9 mm, the flashover voltage increased slowly from 10 to 15 times flashover discharges, which can be attributed to the randomness of flashover discharge and surface structure change. A longer gap distance led to greater dispersion of discharge voltage, creating more arc discharge channels among which the actual surface creepage distance was longer than 9 mm (Figure 4). In Figure 4a, the flashover distance was obviously larger than 9 mm, while the creepage distances in Figure 4b,c were a little shorter. Mostly, the creepage distances were all above 9 mm in which the surface structure played an important role in the development direction of electrical tree. Compared with discharging at shorter gap distances, the electrical tree may develop in more directions at the gap distance of 9 mm, leading to more fluctuating flashover discharge voltages.
The surface roughness of the epoxy resin samples before flashover discharge had an average value of 0.35 μm. After 21 times discharges, there generated several visible carbonized traces, so the roughness around the traces on the samples were measured to assess the decomposition extent of epoxy resin at different gap distances. The average roughness of the epoxy resin samples after 21 times discharges was shown in Table 1.
It was reported that with the accumulation of aging energy on the material surface, the particles formed on the material surface were increased both in number and size, leading to the growth of surface roughness; and, the break of the molecular chains of epoxy resin on the surface resulted in oxidation and carbonization [25]. Increased roughness can also result in larger fluctuation of break-down voltages. Taken together, average roughness should be kept in a reasonable range for ensuring the arc creeping to be closely enough to the surface.

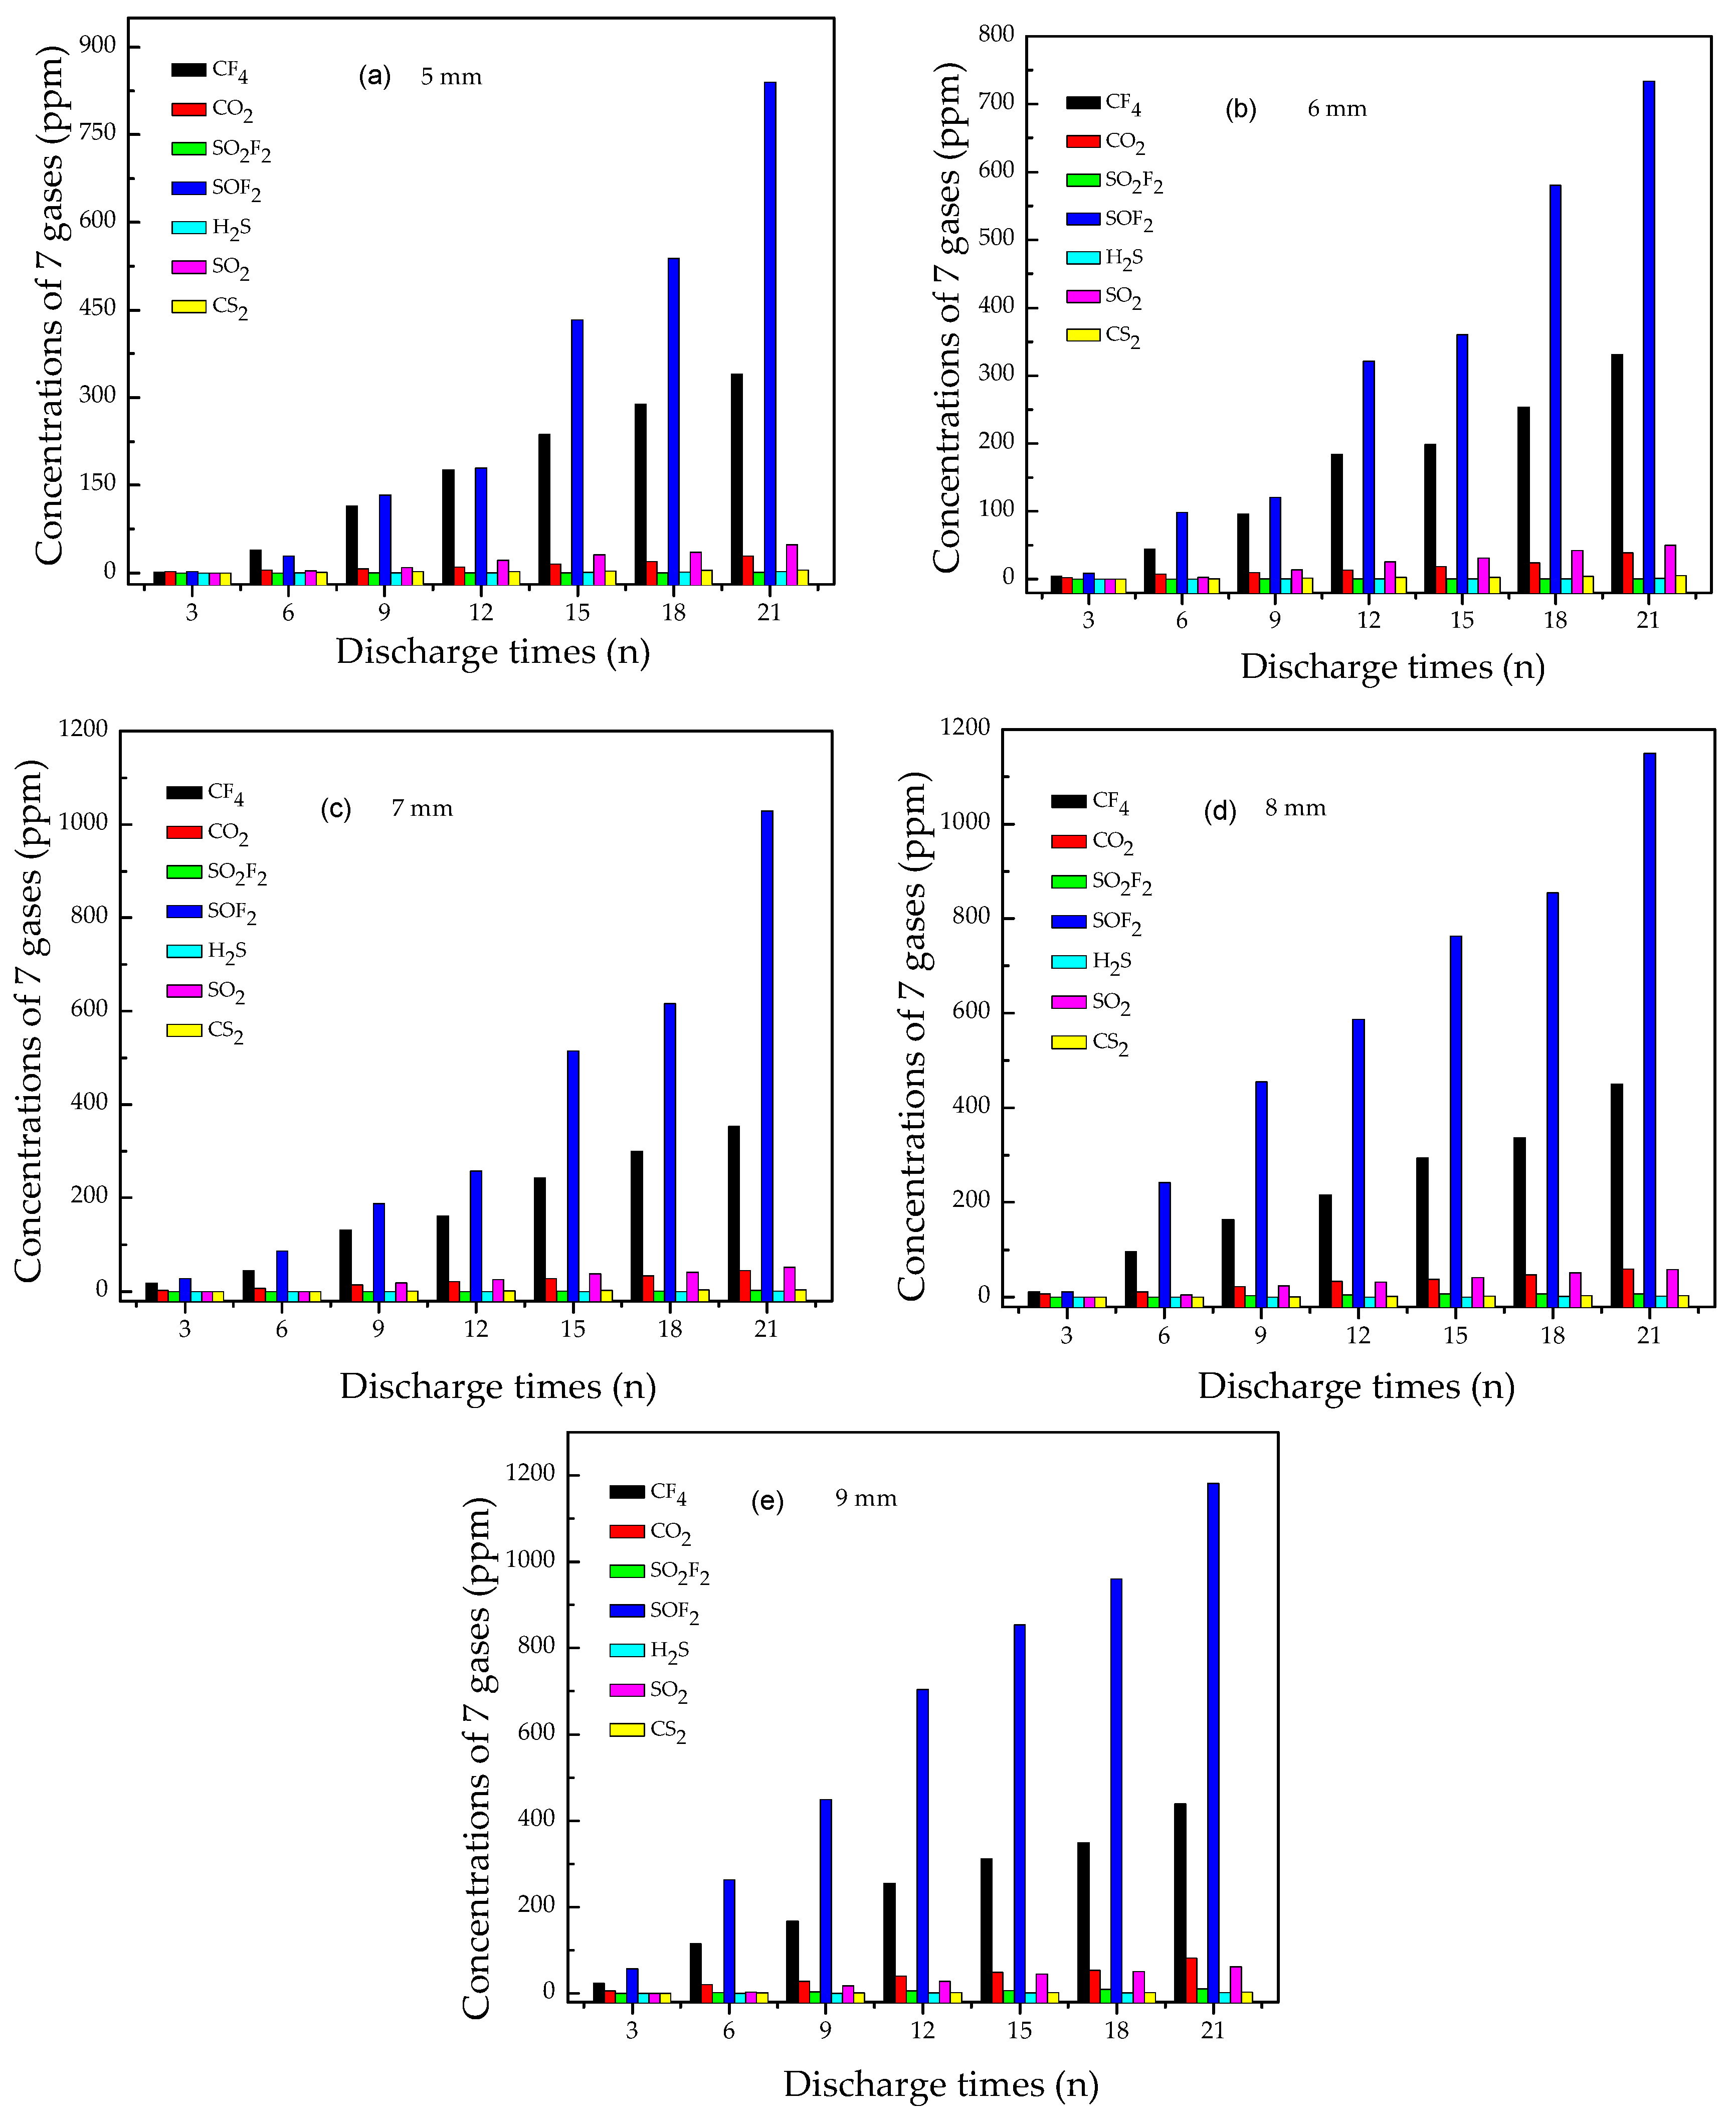
3.2. Concentration Variation of Seven Characteristic Gases

Figure 5 shows the concentration of the seven characteristic gases (CF4, CO2, SO2F2, SOF2, H2S, SO2, and CS2) vs. discharge times at different pin-plate electrodes distances. The results showed a tendency that all gases concentration increased steadily with the increase of flashover discharge times. It is obvious that the concentration of SOF2 and CF4 was the highest while the concentration of other gases was relatively lower, especially SO2F2, CS2, and H2S. Taken together, the concentration of the seven characteristic gases follows the following order: SOF2 > CF4> SO2 > CO2 > SO2F2 >CS2 > H2S.
At the pin-plate electrodes distance of 5 mm, after flashover discharge six times, the concentration of SOF2 rose above 50 ppm, a value that can be detected easily. At the pin-plate electrodes distance of 9 mm, after flashover discharge six times, the concentration of SOF2 rose closely to 300 ppm. Thus, longer pin-plate electrodes distance may facilitate the generation of characteristic gas. After flashover discharge 15 times, the SOF2 concentration was almost twice the CF4 concentration, whereas other gas byproducts increased at slow rates.

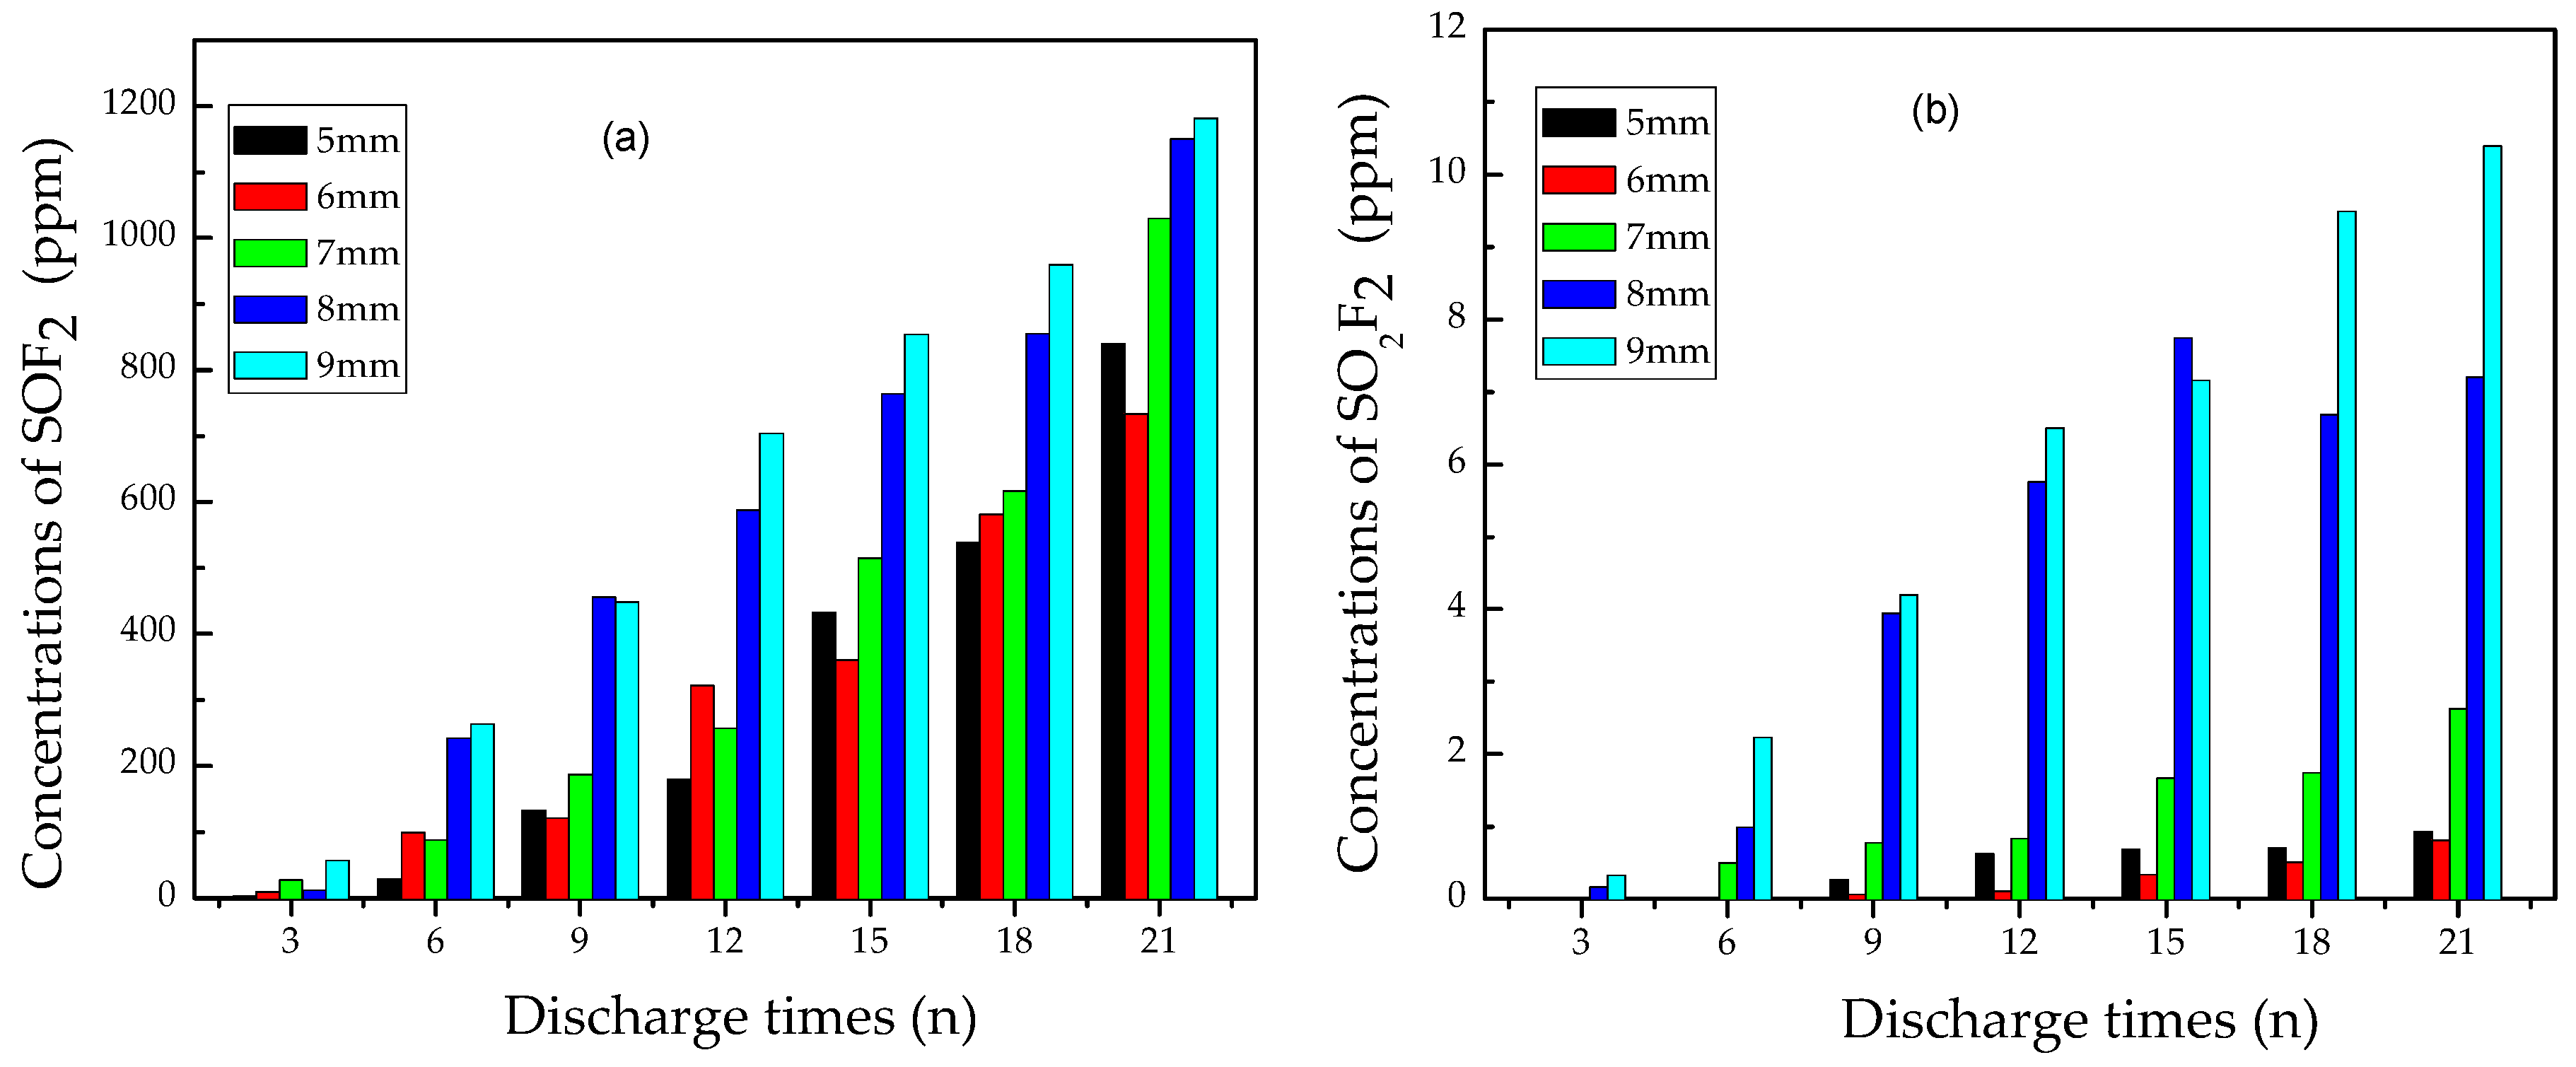
3.2.1. Analysis of SOF2 and SO2F2

The concentration of SOF2 and SO2F2 vs. flashover discharge times at different discharge distance were shown in Figure 6. The data indicate that SOF2 and SO2F2 generated steadily as the discharge times increased, and the concentration of SOF2 was nearly 100 times as high as that of SO2F2. After 6 times flashover discharge, SOF2 reached almost 300 ppm, while SO2F2 was still below 3 ppm. The concentration of SO2F2 did not reach 10 ppm before 21 discharge times, however, the SOF2 concentration exceeded 1000 ppm at this discharge time point. It was also found that as the discharge distance increased, the content of both SOF2 and SO2F2 elevated.
SF 2 + O SOF 2
SF 4 + H 2 O SOF 2 + 2 HF
SOF 2 + O SO 2 F 2
SF 4 + O SOF 4
SOF 4 + H 2 O SO 2 F 2 + 2 HF
Dominant reaction pathways for SOF2 and SO2F2 were described in Equations (1)–(5). As reported previously, when partial discharge happened in SF6 atmosphere involving no solid insulation materials, SOF2 and SO2F2 concentration increased at similar rates [13,26]. However, in our experiment, the SO2F2 concentration remained far below the SOF2 concentration. Therefore, flashover discharge happening on epoxy resin may cause a different chemical reaction pathway to facilitate SOF2 generation.
Actually, under high-energy electron collision, electron-impact-induced dissociation of SF6 can lead to fluoride sulfide generation such as SF5, SF4, SF3, SF2, SF, and so on. It was reported that the amount of SF4 and SF2 was larger than that of other gas byproducts [26,27]. When SF4 comes into contact with H2O, SOF2 will soon form, as illustrated in Equation (2). SF2 can also be oxidized easily into SOF2 because S atoms of +2 valence can be turned to S atoms of +4 valence during reaction with high-active O atoms from arc discharge as shown in Equation (1). Therefore, it is reasonable to mark it as an indicator for flashover discharge fault on solid insulation surface.
Generation of SO2F2 is more complicated than that of SOF2. From the chemical perspective, the S atom in SOF2 molecule is +4 valence, that means the unsaturated chemical valence needs further oxidation to turn into SO2F2 that has an S atom of +6 valence. On the other hand, SF4 can be oxidized into SOF4, then SOF4 contacts with H2O to generate SO2F2 molecules, which is the main generation resource of SO2F2, as indicated in Equations (4) and (5) [28].
To sum up, SOF2 was a generated from the reaction between SF4 and H2O, while SO2F2 mainly comes from the reaction between SOF4 and H2O. SOF4 needs further oxidization of SF4 by activating O atoms. So the generation of SOF2 is easier than that of SO2F2. In our study, another characteristic gas CO2 was generated and its amount increased steadily with the increase of flashover discharge times. The generation of CO2 can consume a large number of active O atoms, so the SO2F2 generation became more difficult under flashover discharge happening on the epoxy resin surface, compared with partial discharge in the SF6 atmosphere involving no epoxy resin. As a result, the production of SO2F2 increased at a quite low rate with flashover discharge times increasing.
Without reckoning the effect of impurities such as H2O or O2 in the original SF6, epoxy resin decomposition may produce a small amount of water under flashover discharge, which acts as a main factor for Equation (2). Furthermore, H2O would decompose and release O2 under imposition of high-current, so Equation (1) also contributes to the generation of SOF2. Hence, the concentration of SOF2 rose rapidly as discharge continued.

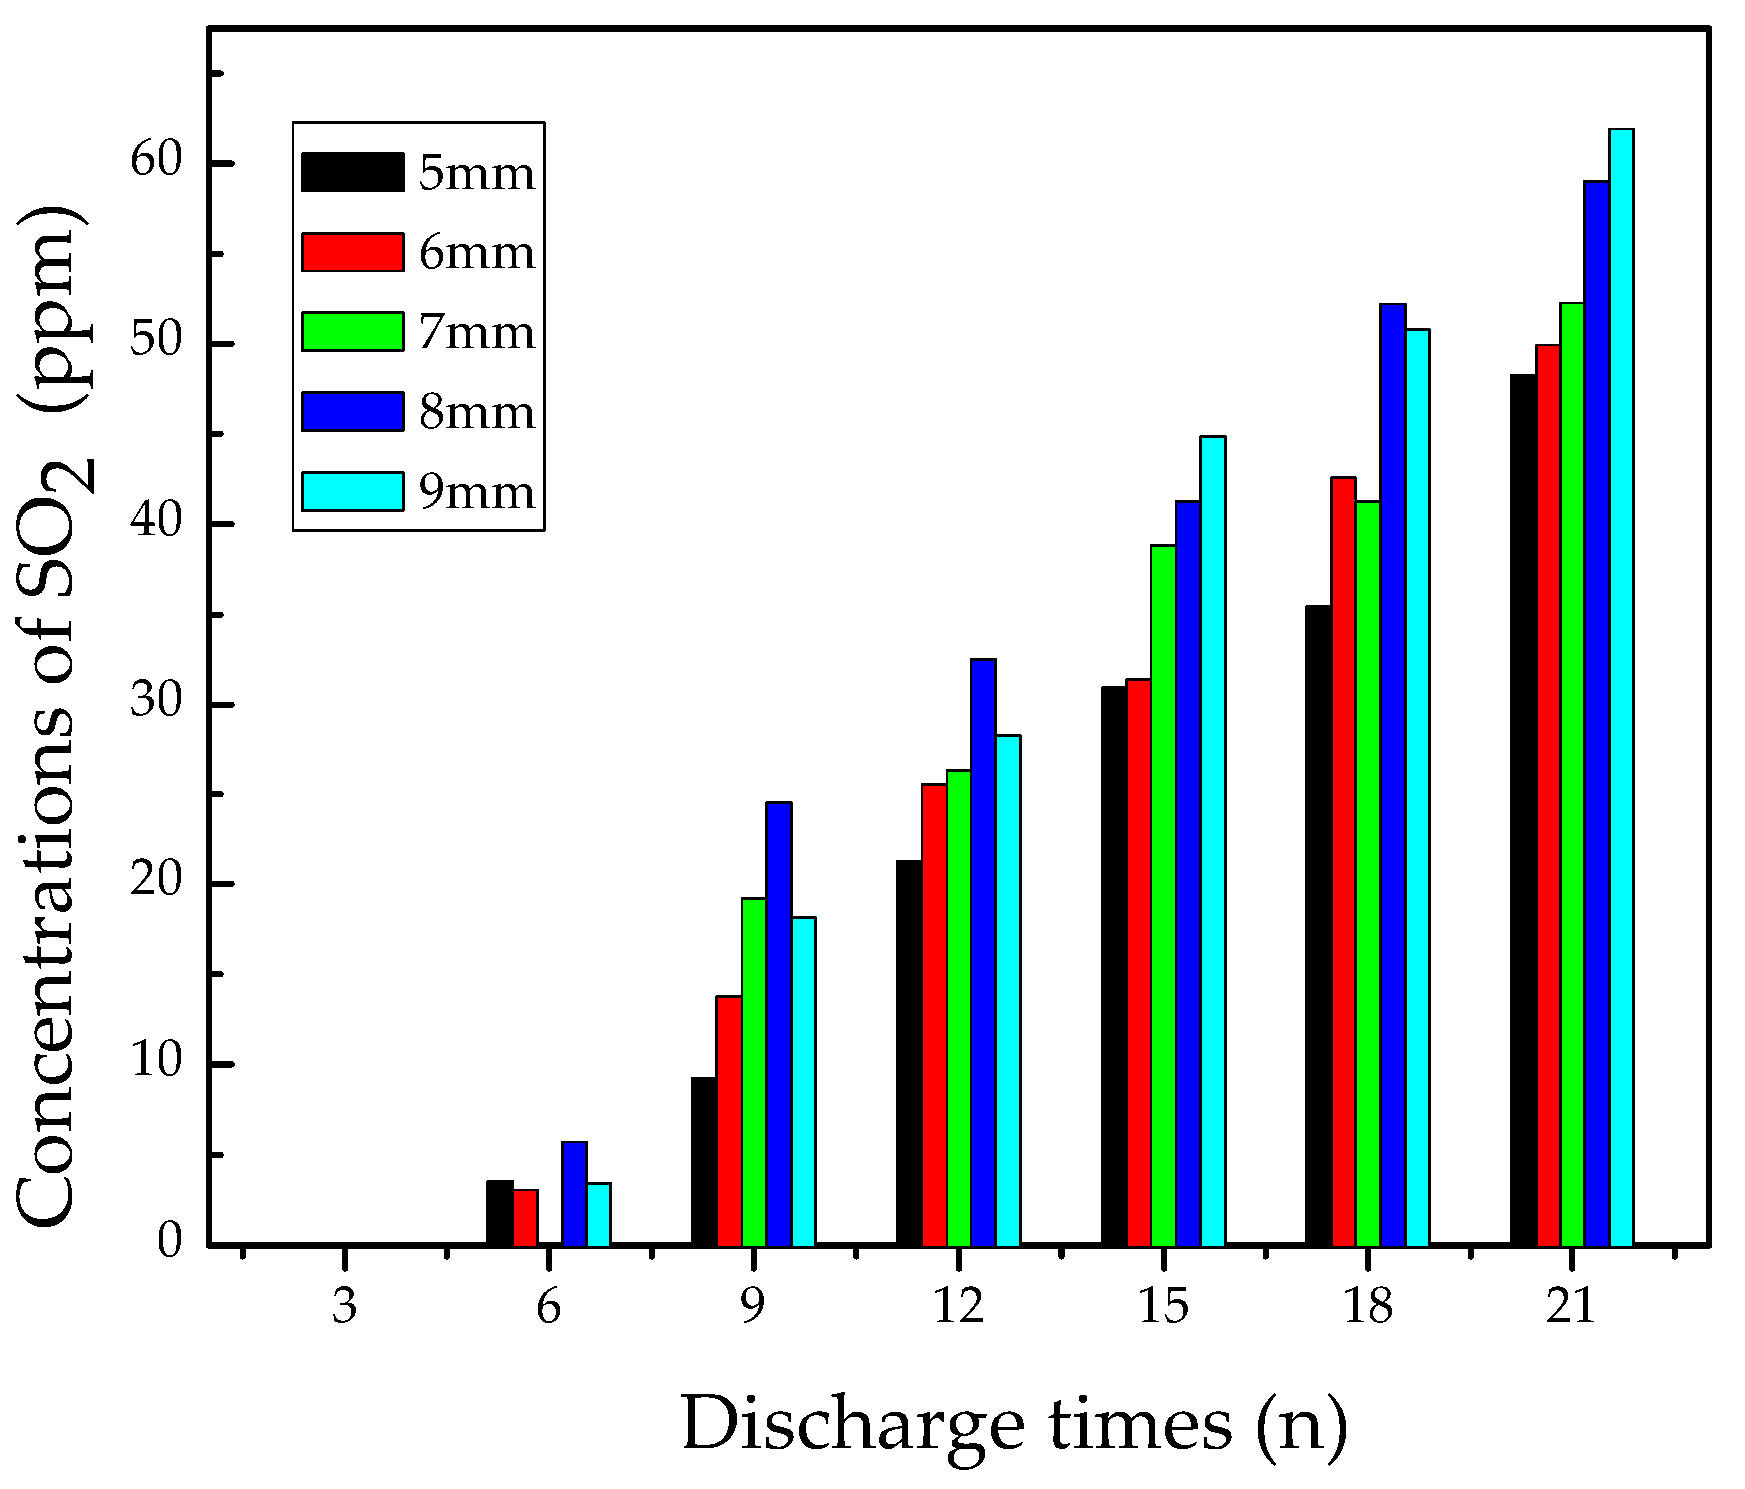
3.2.2. Analysis of SO2

Figure 7 shows the concentration variation of SO2 vs. discharge times at different pin-plate electrodes distances. At the beginning, the amount of SO2 was quite small, around 5 ppm after flashover discharge six times. Later, SO2 was generated steadily as discharge continued, and its concentration reached to about 30 ppm and 55 ppm after discharging 12 times and 21 times, respectively. In addition, the concentration of SO2 also elevated with the discharge distance increasing.
S + 2O→SO2
SOF2 + H2O→SO2 + 2HF
SF + OH→SO + HF
SO + O→SO2
To better explain the concentration variation of SO2, the generation path of SO2 is depicted in Equations (6)–(9) [29]. It can be seen that the production of SO2 needs oxygen or water. It is extensively accepted that F atom has stronger reducibility than O atom, but the structure of SO2 (O=S=O) is more symmetrical than that of SOF2. Therefore, it is also easy for the generation of SO2.
During the reactions, the amount of H2O was limited, and most of H2O reacted with subfluorides to form SOF2, so there is less amount of H2O for the generation of SO2 in Equation (7). Besides, there were very few S atoms provided for the Equation (6) reaction, since S atom is not the main decomposition byproduct of SF6. As a result, the content of SO2 was quite low at the beginning. As discharge continued, S and SF accumulated and had more chances to react with O2 and H2O. Thus, after about discharging nine times, the SO2 concentration reached a high level and increased steadily.
In conclusion, SO2 began to generate after a certain amount of SF6 decomposed into S or SF, indicating that SF6 has already lost its original dielectric property. In order to take SO2 into consideration for the flashover discharge fault diagnosis method, it is better to take the total concentration of SOF2 and SO2 as an indicator for flashover discharge fault.

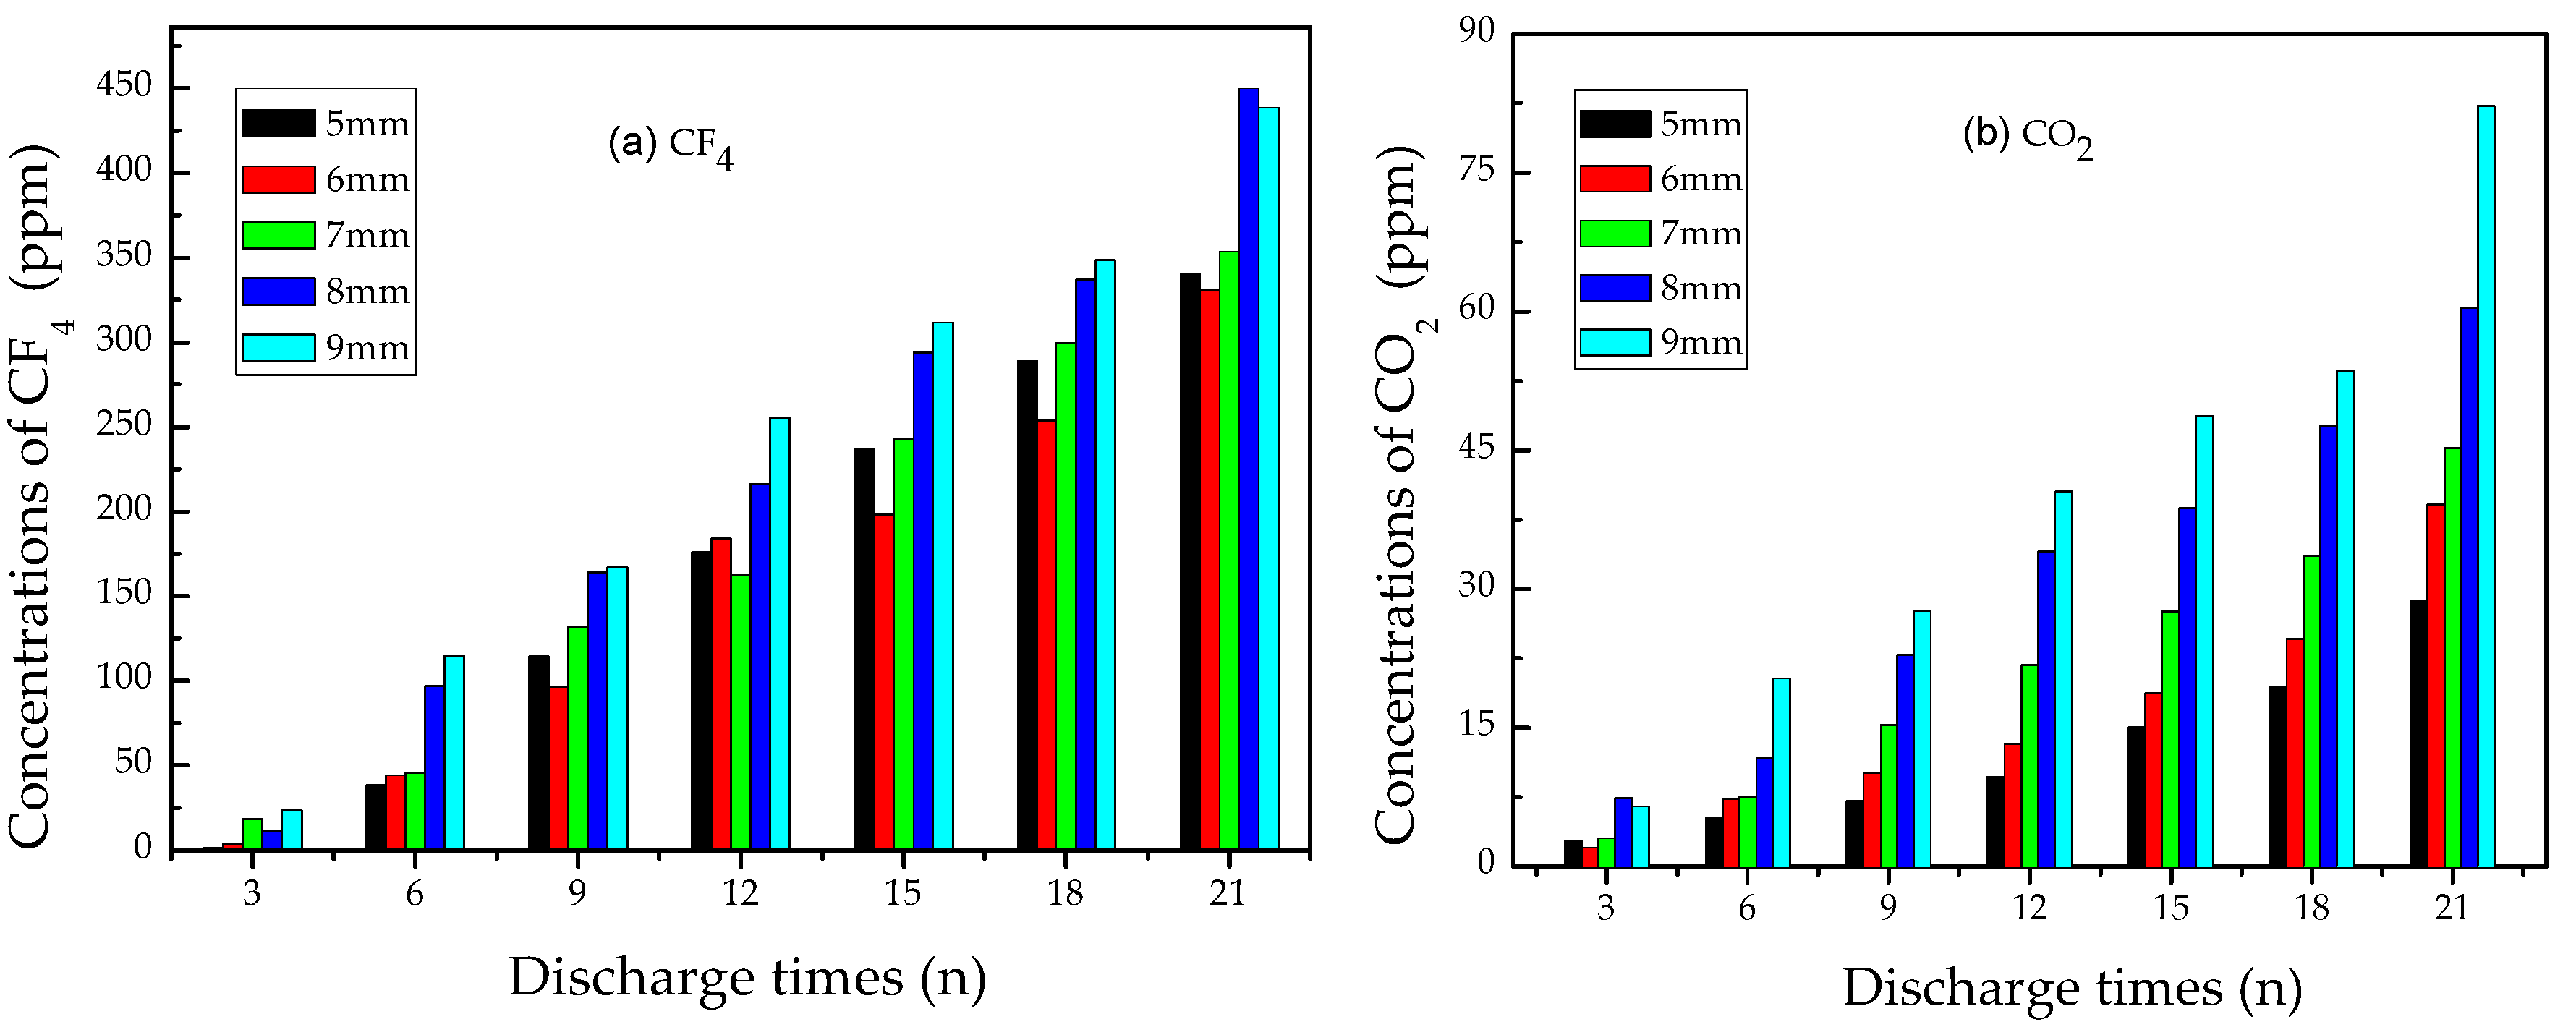
3.2.3. Analysis of CO2 and CF4

Figure 8 shows the concentration variation of CO2 and CF4 vs. discharge times under different distances. Both of them were produced once the flashover discharge occurred. After discharging six times, the concentration of CO2 reached about 10 ppm, while CF4 exceeded 50 ppm. After discharging 21 times, CF4 concentration reached over 400 ppm, yet CO2 concentration was still below 90 ppm, which means that the amount of CF4 was nearly five times as large as that of CO2.
CF4 is an important gas byproduct involved in solid insulation materials decomposition defects. When flashover discharge occurred on epoxy resin, methyl fragments (CHx) were produced. Through substitution reaction with free F atoms, CHx would be turned into CF4. Flashover discharge provided enough energy for the formation of CF4, whereas CO2 mainly came from intrinsic decomposition of epoxy resin. So the concentration of CF4 was much higher than that of CO2.
In conclusion, CF4 has a close relationship with epoxy resin decomposition, which can indicate the occurrence of flashover discharge fault on epoxy resin dielectrics in SF6 insulation equipment. Therefore, the concentration of CF4 should be monitored intensely.

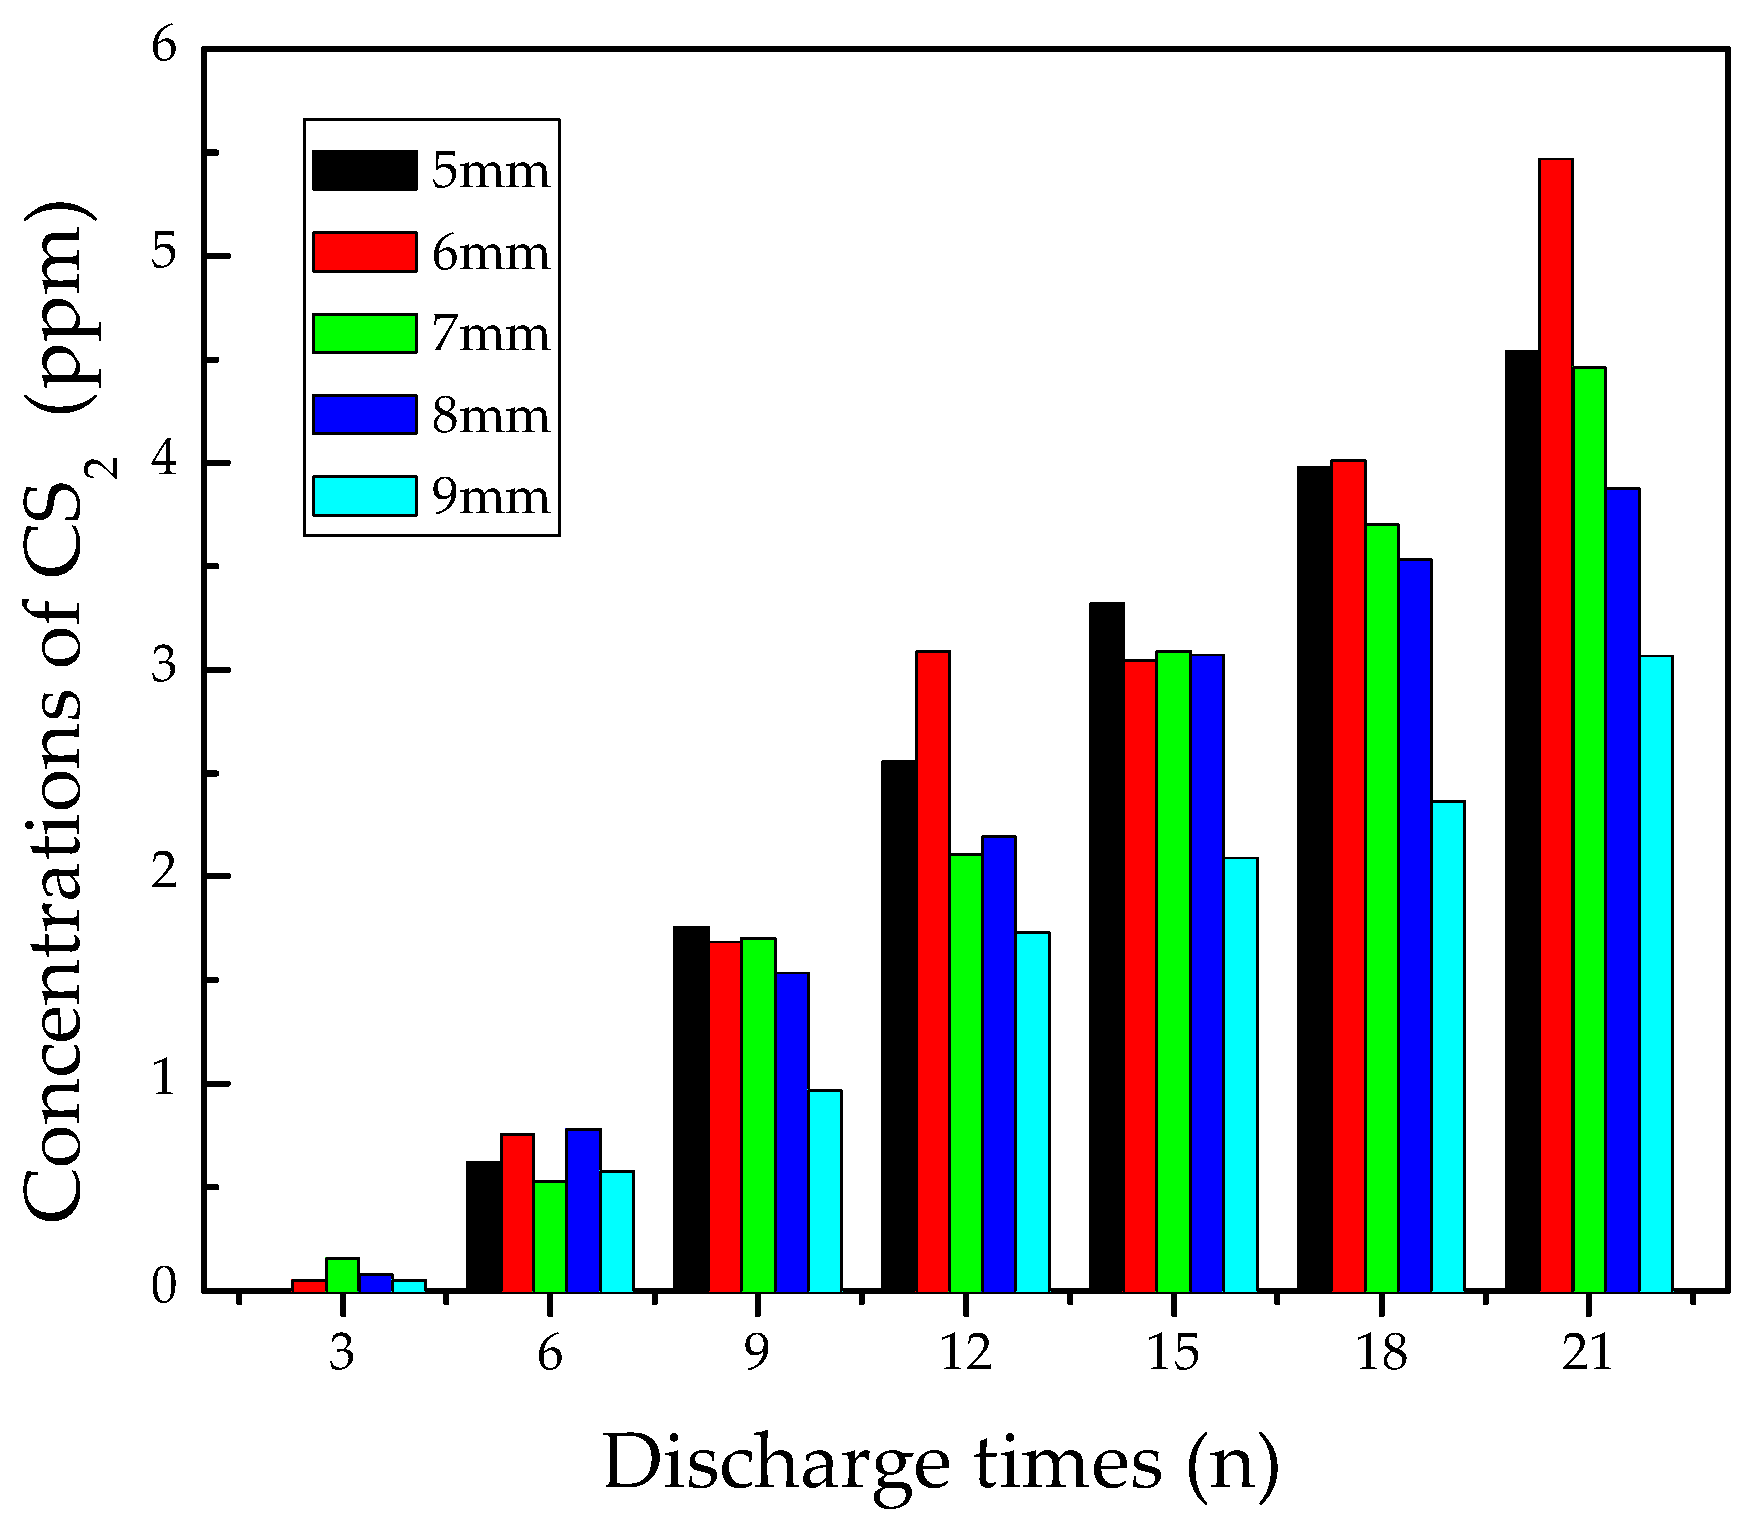
3.2.4. Analysis of CS2

Figure 9 shows the concentration changes of CS2. It can be seen that the content of CS2 did not reach 3 ppm until discharging 10–15 times. As the discharge times increased, the CS2 amount grew slowly. After discharging 21 times, the maximum concentration of CS2 was still less than 6 ppm.
The generation of CS2 is difficult because its generation needs active C atoms and S atoms [14,27,28]. On one hand, the amount of C atoms from the decomposition of epoxy resin was limited. The formation of SO2 also consumed some S atoms, so the remaining amount of S atoms from SF6 ionization was too low to facilitate the formation of CS2. C atoms mainly came from ionization of epoxy resin decomposition, and a large number of C atoms were required by the formation of CO2 and CF4, so the existing amount of CS2 was quite low. Besides, the 9 mm gap distance also contributed to the formation of CS2 to some extent.
As one of the typical byproducts of flashover discharging on epoxy resin dielectrics, CS2 is too difficult to be generated in comparison with CF4. Therefore, the appearance of CS2 could indicate the severest stage of flashover discharge.

3.2.5. Analysis of H2S

Figure 10 shows the concentration variation of H2S vs. discharge times at different pin-plate electrodes distances. The results show that the concentration of H2S was less than 0.3 ppm after discharging nine times, and its concentration only reached 1 ppm after discharging 15 times. After discharging 21 times, its concentration was about 2.5 ppm. A conclusion can be drawn that, like CS2, the generation of H2S is as difficult as that of CS2 among the seven characteristic gases.
The generation of H2S requires active S atoms and free H atoms [14,28,29]. The S atom is not the main decomposition byproduct of SF6 [26], and the rising concentration of SO2 could also reduce the reaction between S atoms and free H atoms. Therefore, the amount of H2S was extremely small. Although the longer distance between the electrodes can facilitate the generation of H2S, its amount still stayed at a very low level.
In conclusion, the generation of H2S can also be used as an indicator to judge the serious stage of flashover discharge faults on epoxy resin.

3.3. Basic Rules for Judging the Happening of Flashover Discharge

Based on the concentration variation of seven different characteristic gases above, it can be seen that SOF2 and CF4 had the highest concentration far beyond other gas byproducts, both of which can therefore represent the main decomposition component resulting from flashover discharge happening on the epoxy resin surface. Compared with the previous studies focusing on partial discharge in SF6 insulation equipment [1,14,17,24,29], flashover discharge on the epoxy resin surface could cause a drastically elevation in the concentration of SOF2 and CF4, but generated a relatively lower concentration for H2S. According to these two statistics’ data, a preliminary rule can be summarized as follows:
c SOF 2 > 2 c CF 4 and ( c SOF 2 + c CF 4 ) > 400 c H 2 S
among which, c represents concentration for the selected gases. That is to say, when concentration of SOF2 reaches twice of that of CF4, and the sum concentration of both SOF2 and CF4 is much higher than that of H2S, a possible flashover discharge on the epoxy resin surface in SF6-infused electrical equipment occurs.

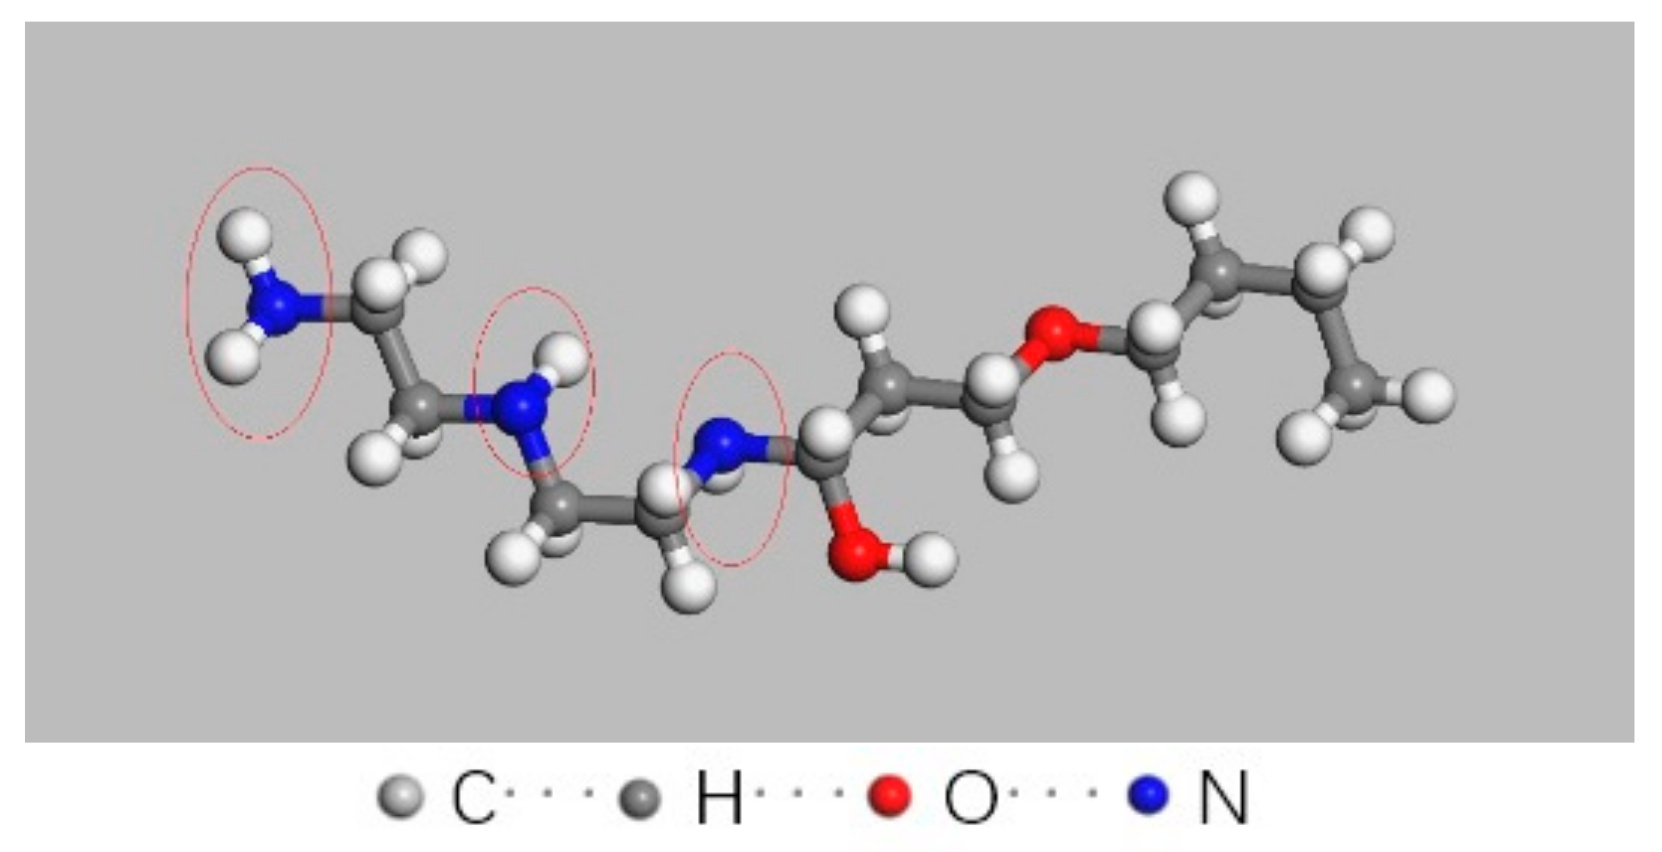
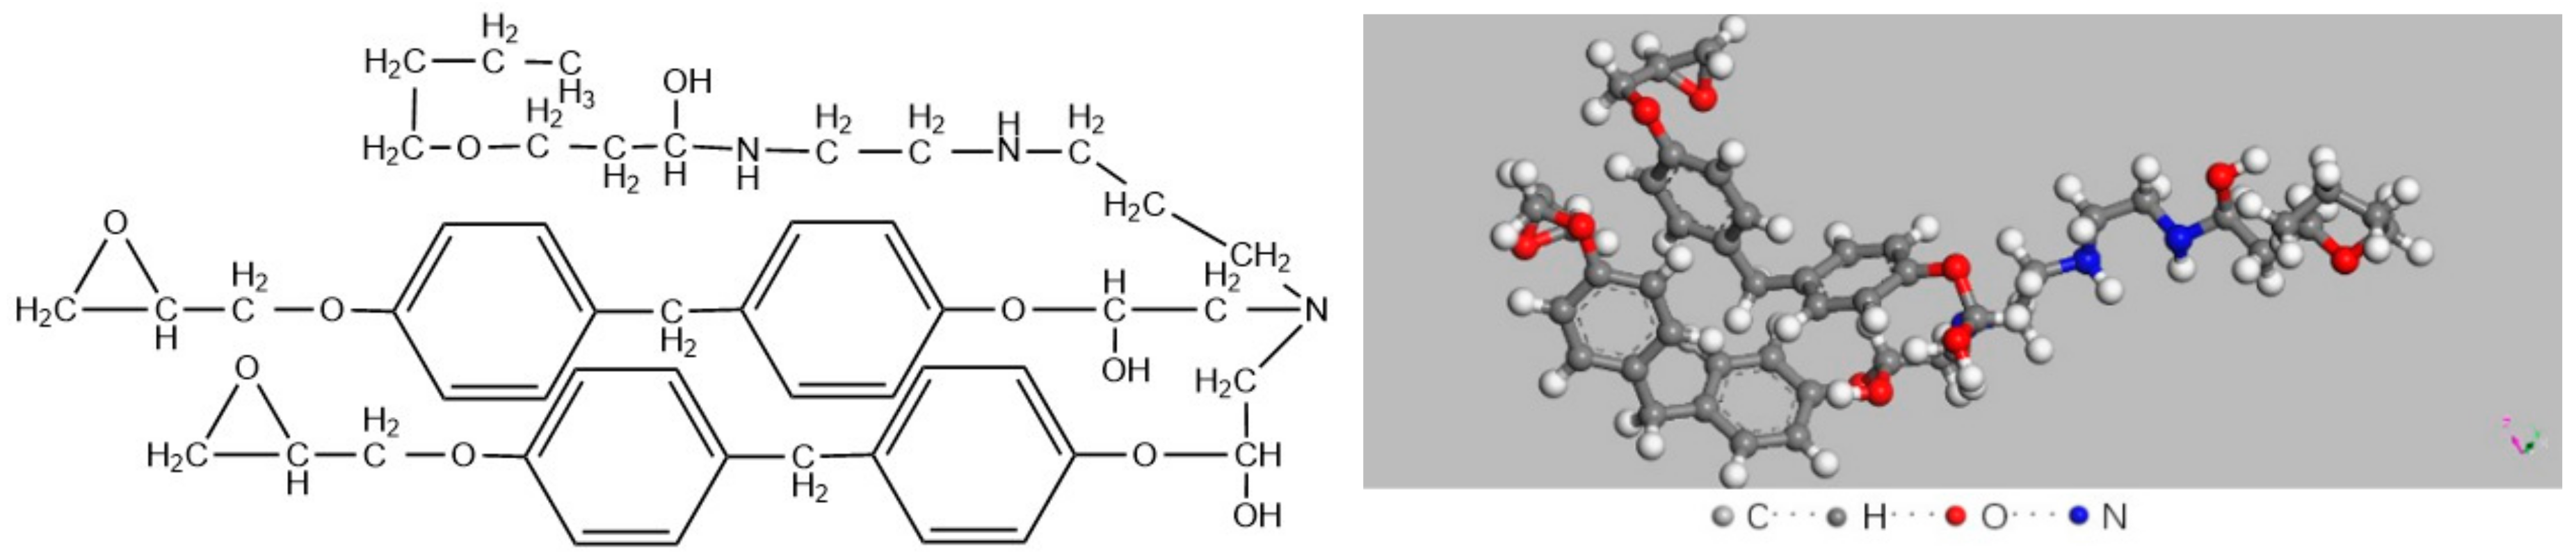
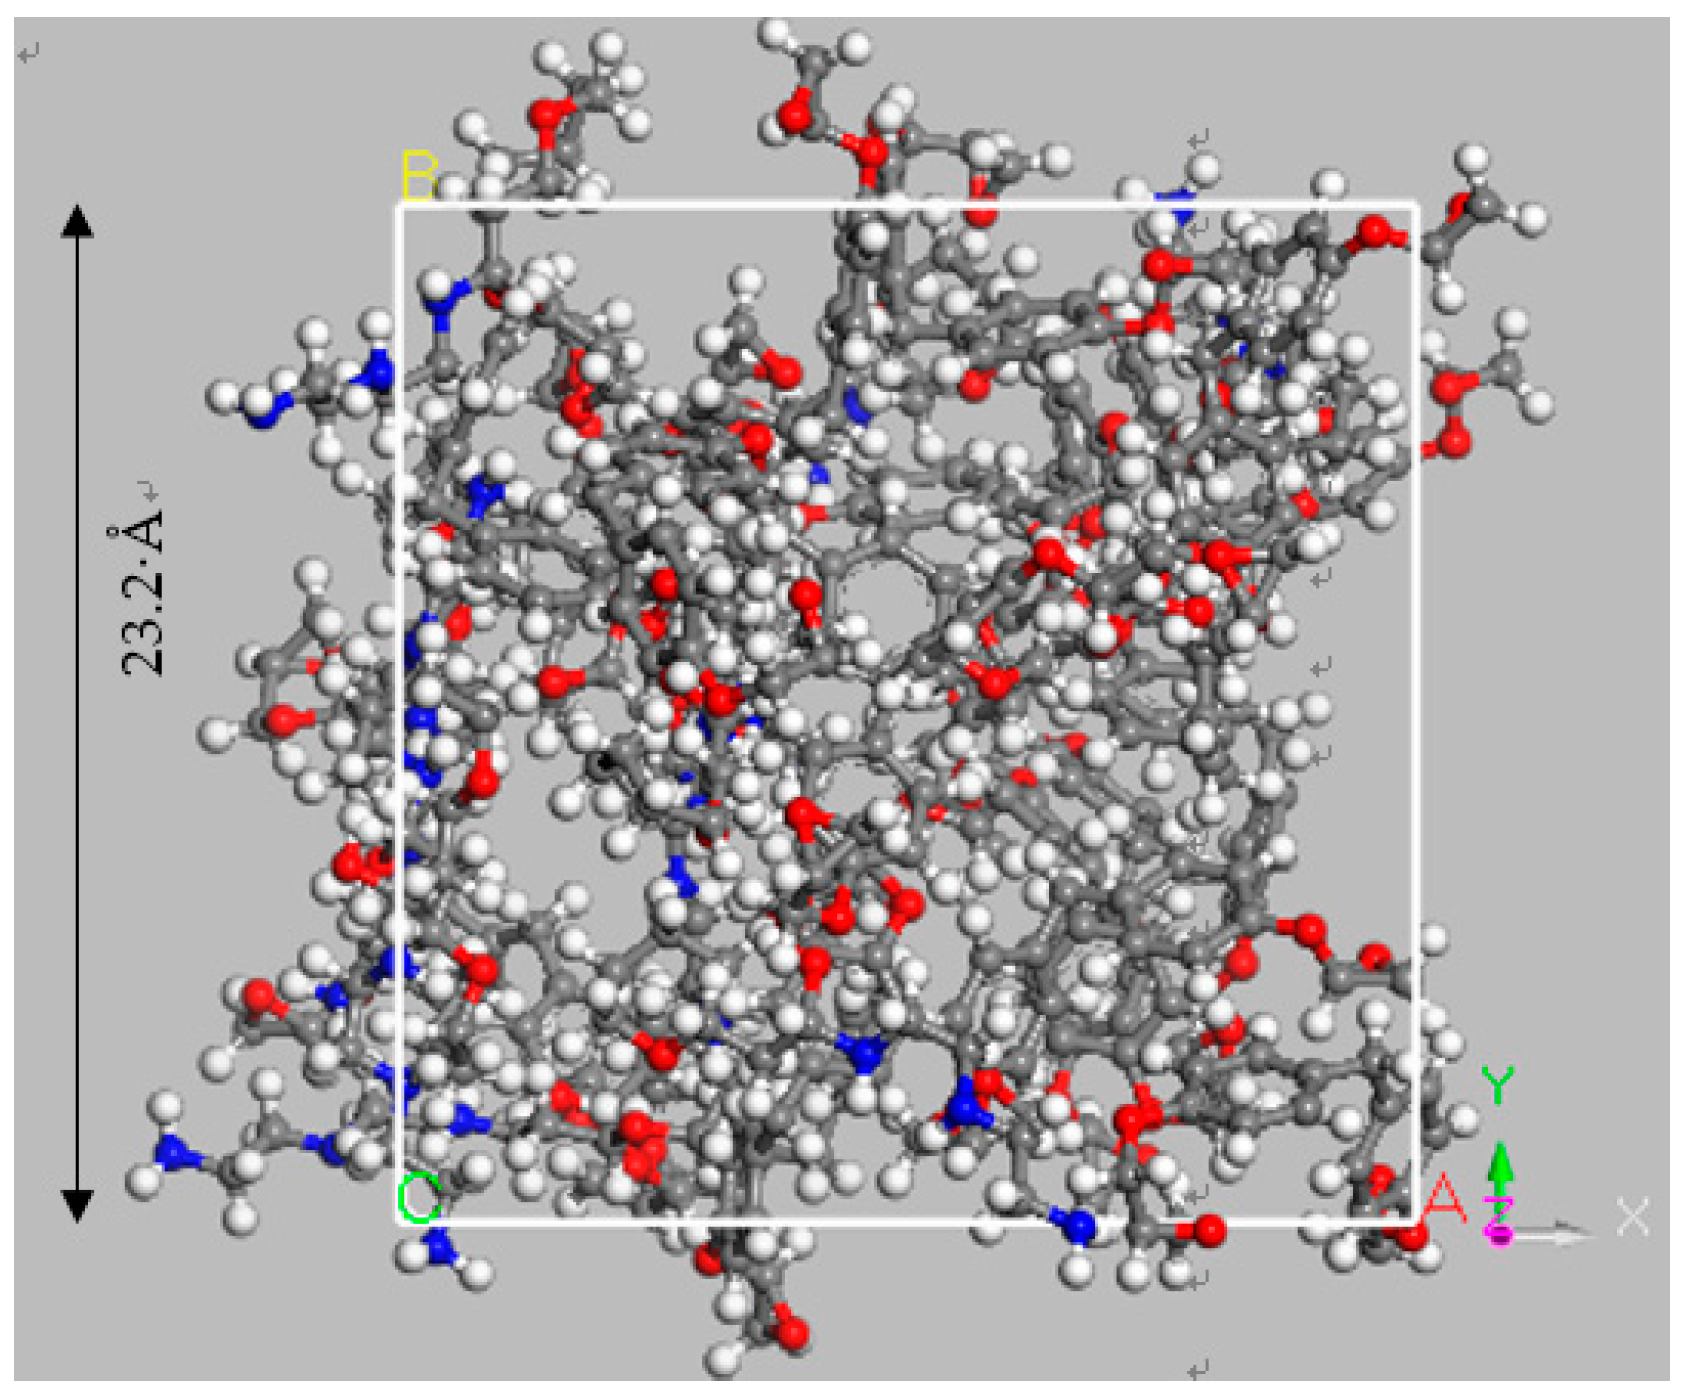
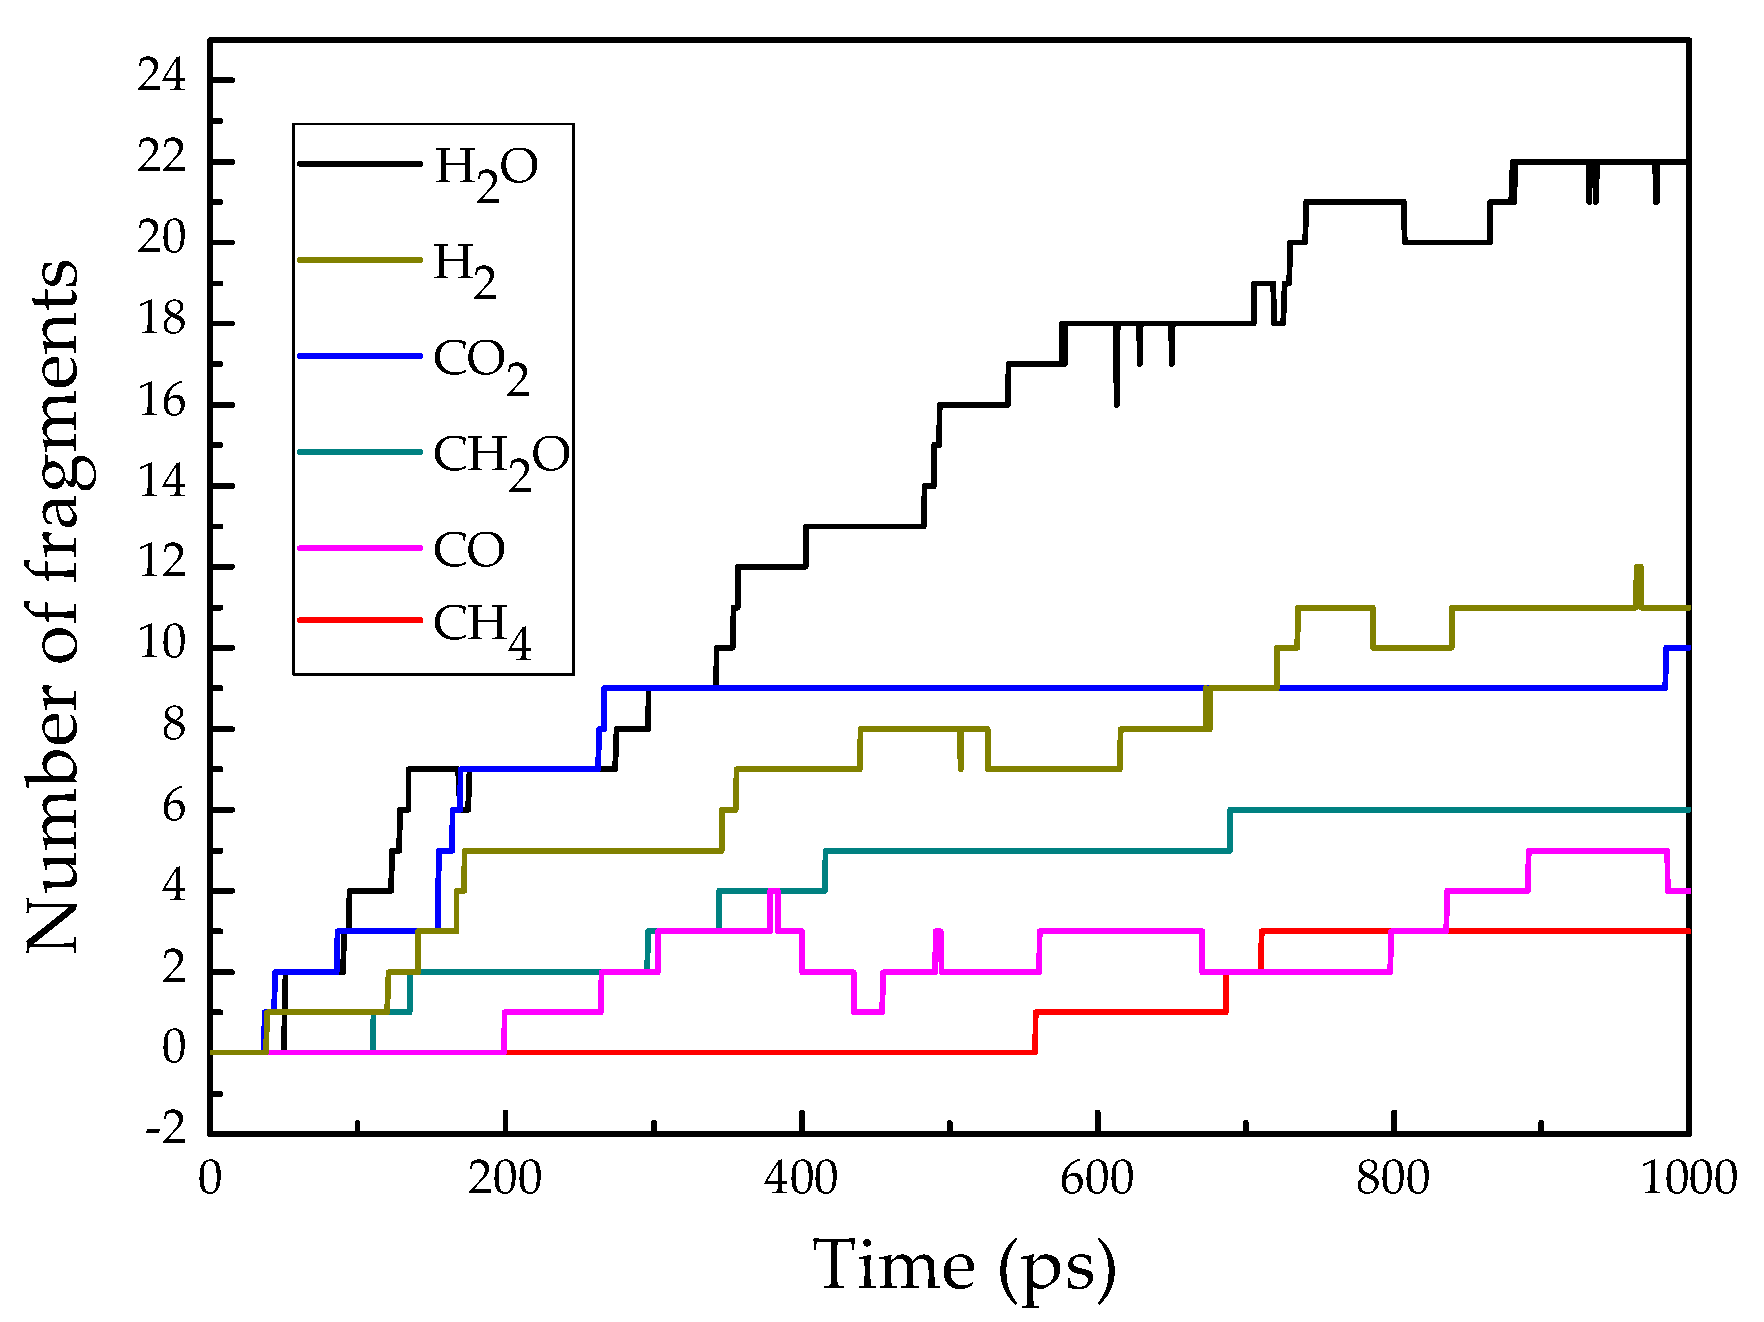
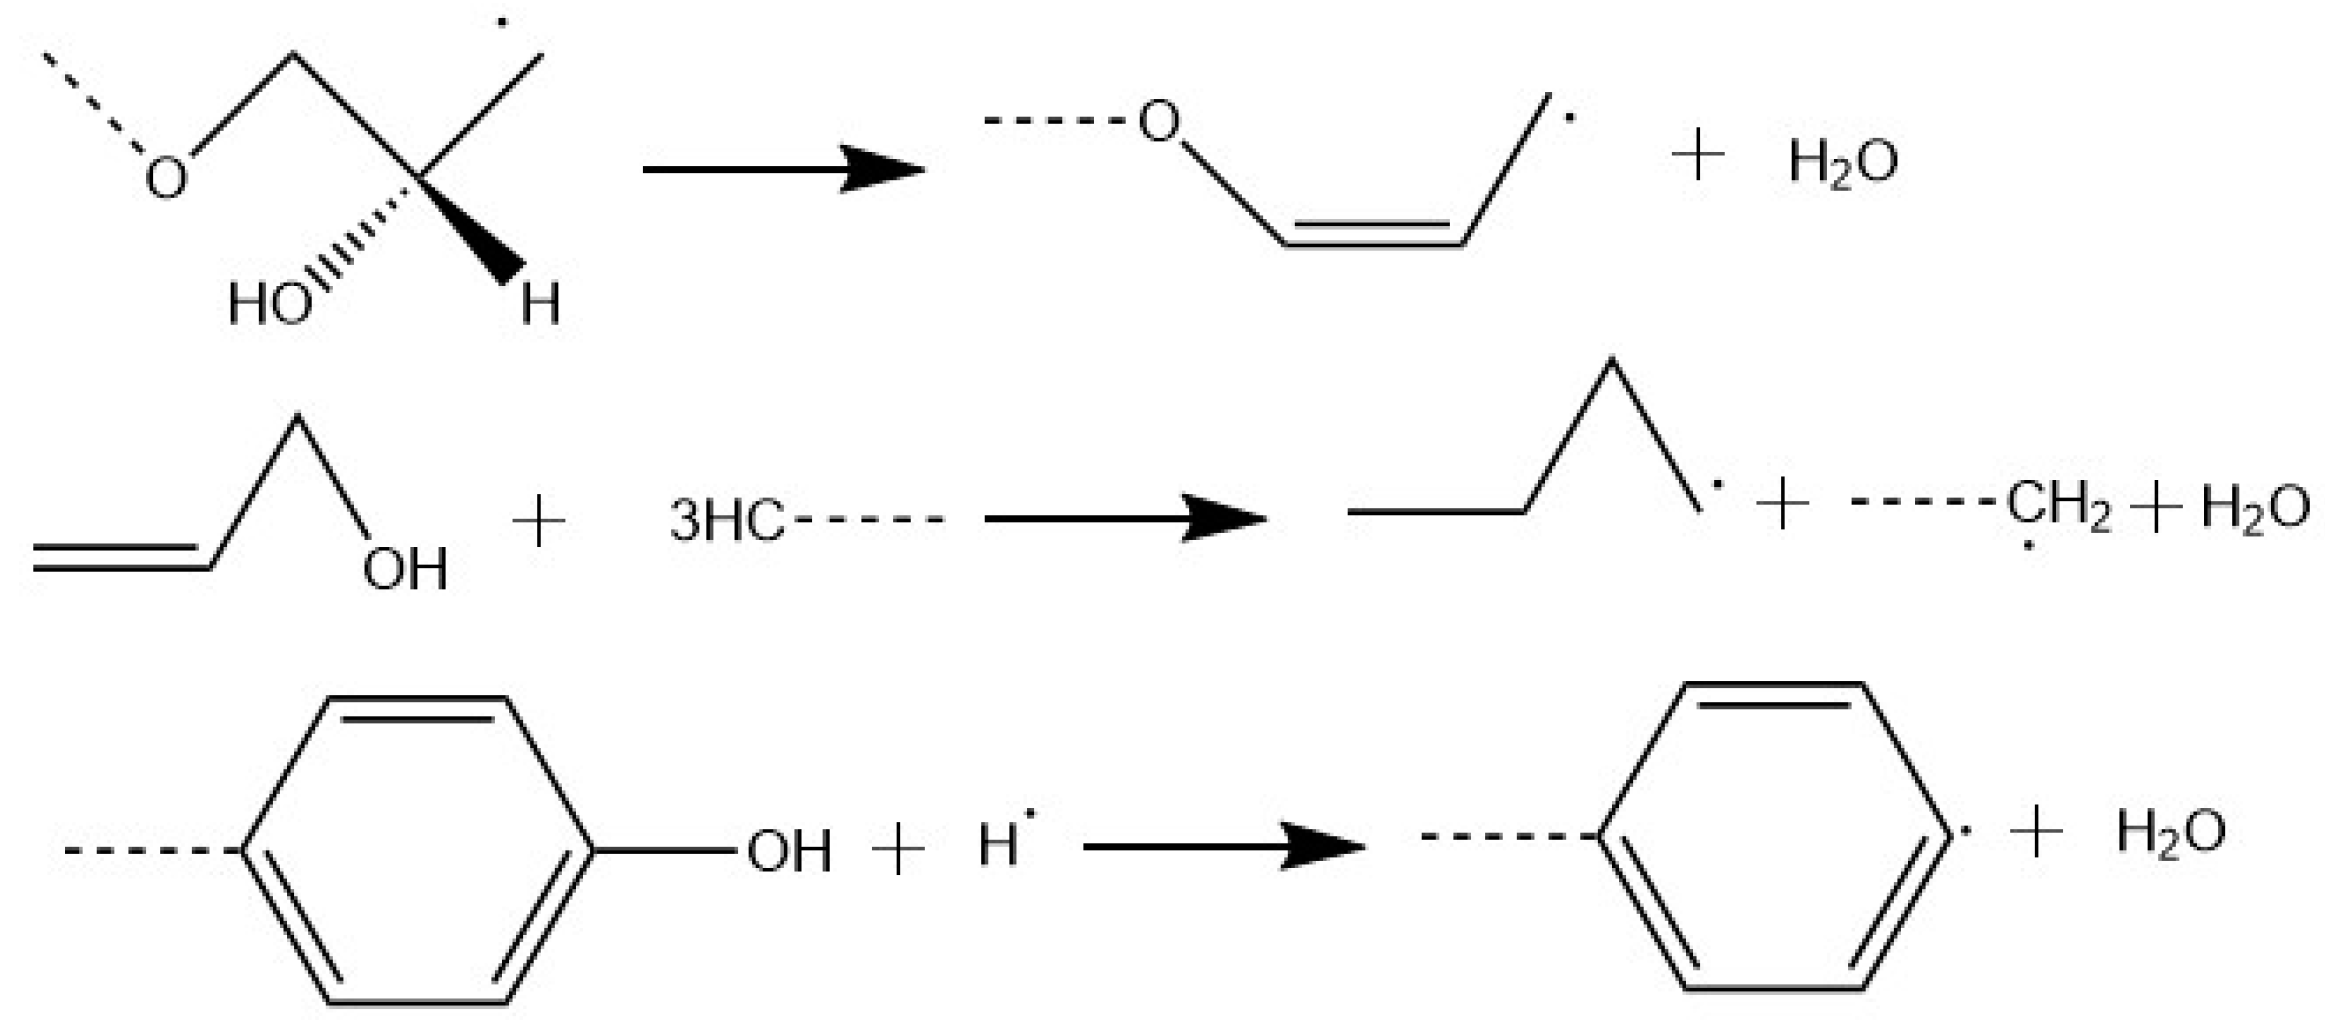
3.4. Simulation for Decomposition of Epoxy Resin under High Energy

To verify whether H2O mainly comes from decomposition of epoxy resin, simulation methods were employed to further investigate decomposition of epoxy resin under high energy. For the sake of simplification, the energy for epoxy resin decomposition was supplied via temperature setting. The whole simulation was conducted with the ReaxFF program and NVT ensemble. NVT represents the three parameters (number (N), volume (V), and temperature (T)) that are fixed parameters, and the other two parameters (pressure (P) and energy (E)) are variables.
Firstly, a ball-stick model of the curing agent molecule was given in Figure 11. After curing, a bisphenol-A epoxy resin (DGEBA) molecule with polymerization degree of 0 was built, as shown in Figure 12. Then, a periodic unit cell of epoxy resin consisting of 20 epoxy resin molecules was constructed with an initial density of 0.5 g/cm3 in a 23.2 Å × 23.2 Å × 23.2 Å cubic box, as shown in Figure 13. The structure was treated by annealing process at the cooling rate of 10 K/500 ps and Energy Minimization and Geometry Optimization were carried out before the decomposition simulation began. The final density of the epoxy resin model was 1.13 g/cm3.
The reaction temperature was set at 1300 K to ensure that energy was high enough for epoxy resin decomposition within a total simulation time of 1000 ps [30]. It is already known that the main small molecular products are CH2O, H2O, CO, CO2, CH4, and H2 [30]. Figure 14 shows the number change of fragments from the periodic unit cell of epoxy resin as a function of time. It can be seen that the number of H2O molecules was the highest among the 6 byproducts, followed by H2, CO2, CH2O, CO, and CH4. The dominant reaction pathways (RPWs) of H2O were shown in Figure 15. CH4 was mainly derived from demethylation of methyl-group-containing fragments, and H2 was mainly produced by free hydrogen derived from C-H bond.
In conclusion, epoxy resin could produce H2O, CH4, CO2 and H2 that would mainly affect the concentration of seven characteristic gases. H2O could facilitate the formation of SOF2 according to Equations (1)–(3), and CH4 could facilitate the formation of CF4 through substitution reaction under high-energy arc discharge. CF4 decomposed from SF6 can react with H2O to form SOF2, leading to significantly higher concentration of SOF2 than other decomposition byproducts. Although the theoretical amount of CH4 from decomposition of epoxy resin unit cell was relatively lower, F atoms during ionization of SF6 can help intensify the chemical reaction changing CH4 to CF4 under arc discharge; in addition, the C-F bond in the surface structure of fluorinated epoxy resin may also break to form CF4 directly. Taken together, CF4 had the second highest concentration during flashover discharge happening on the surface of epoxy resin.

4. Conclusions

In the present study, flashover discharge experiments were carried out on the epoxy resin surface in SF6 different pin-plate electrodes distances. The concentration of seven characteristic gases including SOF2, SO2, CF4, CO2 SO2F2, CS2, and H2S were measured. The following conclusions can be drawn:
Initial flashover discharge voltage decreased sharply in the first three times of flashover discharge, and the discharge voltage fluctuated in a downward tendency.
The concentration of the seven characteristic gases elevated with the flashover discharge times increasing, and the final concentration from high to low follows the order: SOF2 > CF4 > SO2 > CO2 > SO2F2 > CS2 > H2S. Among these gases, the concentration of SOF2 and CF4 was obviously higher than that of other gases. In addition, the concentration of SO2F2, CS2, and H2S kept below 10 ppm after discharging 21 times. Based on the concentration variation of seven characteristic gases, a preliminary rule can be proposed: When the concentration of SOF2 reaches two times of that of CF4, and the sum concentration of both SOF2 and CF4 is 400 times higher than that of H2S, a possible flashover discharge on the epoxy resin surface in SF6-infused electrical equipment occurs.
The simulation for decomposition of epoxy resin on the ReaxFF program showed that epoxy resin could produce H2O, CH4, CO2, and H2 that would drastically affect the concentration of the seven characteristic gases. More specifically, H2O could facilitate the formation of SOF2, and CH4 could react with subfluorides to form CF4 under high-energy arc discharge.

Author Contributions

Data curation, H.W.; Formal analysis, H.W.; Methodology, H.W., X.Z., R.X. and Y.W.; Project administration, H.W., G.H. and Y.W.; Supervision, X.Z. and R.X.; Writing – original draft, H.W. and G.H.; Writing – review & editing, H.W. and X.Z.

Funding

This research was funded by the National Key R&D Program of China with grant number (2017YFB0903805) and the APC was funded by Wuhan University.

Conflicts of Interest

The authors declare no conflicts of interest.

References

  1. Qi, B.; Li, C.; Xing, Z.; Wei, Z. Partial Discharge Initiated by Free Moving Metallic Particles on GIS Insulator Surface: Severity Diagnosis and Assessment. IEEE Trans. Dielectr. Electr. Insul. 2014, 21, 766–774. [Google Scholar] [CrossRef]
  2. Albano, M.; Haddad, A.; Griffiths, H.; Coventry, P. Environmentally Friendly Compact Air-Insulated High-Voltage Substations. Energies 2018, 11, 2492. [Google Scholar] [CrossRef]
  3. Okubo, H. Recent activity and future trend on ageing characteristics of electrical insulation in GIS from manufacturer’s view point. In Proceedings of 1994 4th International Conference on Properties and Applications of Dielectric Materials (ICPADM), Brisbane, Australia, 3–8 July 1994; IEEI: Piscataway, NJ, USA, 1994; Volume 2, pp. 837–840. [Google Scholar]
  4. Eriksson, A.; Pettersson, K.G.; Krenicky, A.; Baker, R.; Ochoa, J.R.; Leibold, A. Experience with gas insulated substations in the USA. IEEE Trans. Power Deliv. 1994, 10, 210–218. [Google Scholar] [CrossRef]
  5. Piemontesi, M.; Niemeyer, L. (Eds.) Sorption of SF6 and SF6 decomposition products by activated alumina and molecular sieve 13X. In Proceedings of Conference Record of the 1996 IEEE International Symposium on Electrical Insulation, Montreal, QC, Canada, 16–19 June 1996; IEEI: Piscataway, NJ, USA, 1964; Volume 2, pp. 828–838. [Google Scholar]
  6. Beyer, C.; Jenett, H.; Klockow, D. Influence of reactive SFx gases on electrode surfaces after electrical discharges under SF6 atmosphere. IEEE Trans. Dielectr. Electr. Insul. 2000, 7, 234–240. [Google Scholar] [CrossRef]
  7. Qiu, Y.; Kuffel, E. Comparison of SF6/N2 and SF6/CO2 gas mixtures as alternatives to SF6 gas. IEEE Trans. Dielectr. Electr. Insul. 1999, 6, 892–895. [Google Scholar] [CrossRef]
  8. Tang, J.; Liu, F.; Zhang, X.X.; Ren, X.L. Characteristics of the Concentration Ratio of SO2F2 to SOF2 as the Decomposition Products of SF6 Under Corona Discharge. IEEE. Trans. Plasma Sci. 2012, 40, 56–63. [Google Scholar] [CrossRef]
  9. Tang, J.; Pan, J.; Yao, Q.; Miao, Y.; Huang, X.; Zeng, F. Feature extraction of SF6 thermal decomposition characteristics to diagnose overheating fault. IET Sci. Meas. Technol. L 2015, 9, 751–757. [Google Scholar] [CrossRef]
  10. Tang, J.; Rao, X.; Tang, B.; Liu, X.; Gong, X.; Zeng, F.; Yao, Q. Investigation on SF6 spark decomposition characteristics under different pressures. IEEE Trans. Dielectr. Electr. Insul. 2017, 24, 2066–2075. [Google Scholar] [CrossRef]
  11. Sauers, I. Evidence for SF4 and SF2 formation in SF6 corona discharges. Presented at the Electrical Insulation and Dielectric Phenomena Conference, Knoxville, TN, USA, 20–24 October 1991. [Google Scholar]
  12. Derdouri, A.; Casanovas, J.; Grob, R.; Mathieu, J. Spark decomposition of SF6/H2O mixtures. IEEE Trans. Electr. Insul. 1990, 24, 1147–1157. [Google Scholar] [CrossRef]
  13. Sauers, I.; Christophorou, L.G.; Spyrou, S.M. Negative ion formation in compounds relevant to SF6 decomposition in electrical discharges. Plasma Chem. Plasma Process. 1993, 13, 17–35. [Google Scholar] [CrossRef]
  14. Tang, J.; Liu, F.; Zhang, X.; Meng, Q.; Zhou, J. Partial discharge recognition through an analysis of SF6 decomposition products part 1: Decomposition characteristics of SF6 under four different partial discharges. IEEE Trans. Dielectr. Electr. Insul. 2012, 19, 29–36. [Google Scholar] [CrossRef]
  15. Belmadani, B.; Casanovas, J.; Casanovas, A.M. SF6 decomposition under power arcs. II. Chemical aspects. IEEE Trans. Electr. Insul. 1991, 26, 1177–1182. [Google Scholar] [CrossRef]
  16. Chu, F.Y. SF6 Decomposition in Gas-Insulated Equipment. IEEE Trans. Electr. Insul. 1986, 21, 693–725. [Google Scholar] [CrossRef]
  17. Hergli, R.; Casanovas, J.; Derdouri, A.; Grob, R.; Mathieu, J. Study of the Decomposition of SF6 in the Presence of Water, Subjected to Gamma Irradiation or Corona Discharges. IEEE Trans. Electr. Insul. 2002, 23, 451–465. [Google Scholar] [CrossRef]
  18. Griffin, G.D.; Sauers, I.; Kurka, K.; Easterly, C.E. Spark decomposition of SF6: Chemical and biological studies. IEEE Trans. Power Deliv.r 1989, 4, 1541–1551. [Google Scholar] [CrossRef]
  19. Chen, J.; Zhou, W.; Yu, J.; Su, Q.; Zheng, X.; Zhou, Y.; Li, L.; Yao, W.; Wang, B.; Hu, H. Insulation condition monitoring of epoxy spacers in GIS using a decomposed gas CS2. IEEE Trans. Dielectr. Electr. Insul. 2013, 20, 2152–2157. [Google Scholar] [CrossRef]
  20. Zhang, Y.; Rhee, K.Y.; Park, S.-J. Nanodiamond nanocluster-decorated graphene oxide/epoxy nanocomposites with enhanced mechanical behavior and thermal stability. Compos. B Eng. 2017, 114, 111–120. [Google Scholar] [CrossRef]
  21. Zhang, Y.; Choi, J.R.; Park, S.-J. Thermal conductivity and thermo-physical properties of nanodiamond-attached exfoliated hexagonal boron nitride/epoxy nanocomposites for microelectronics. Compos. Part A: Appl. Sci. Manuf. 2017, 101, 227–236. [Google Scholar] [CrossRef]
  22. Zhang, Y.; Heo, Y.-J.; Son, Y.-R.; In, I.; An, K.-H.; Kim, B.-J.; Park, S.-J. Recent advanced thermal interfacial materials: A review of conducting mechanisms and parameters of carbon materials. Carbon 2019, 142, 445–460. [Google Scholar] [CrossRef]
  23. Tang, J.; Zeng, F.P.; Pan, J.Y.; Zhang, X.X. Correlation Analysis between Formation Process of SF6 Decomposed Components and Partial Discharge Qualities. IEEE. Trans. Dielect. Electr. Insul. 2013, 20, 864–876. [Google Scholar] [CrossRef]
  24. Fukunaga, K.; Takai, H. Deterioration of epoxy resin as a result of internal partial discharge. Electr. Eng. Jpn. 2010, 111, 11–19. [Google Scholar] [CrossRef]
  25. Xie, Q.; Liu, X.; Zhang, C.; Wang, R.; Rao, Z.; Shao, T. Aging Characteristics on Epoxy Resin Surface Under Repetitive Microsecond Pulses in Air at Atmospheric Pressure. Plasma Sci. Technol. 2016, 18, 325–330. [Google Scholar] [CrossRef]
  26. Brunt, R.J.V.; Sauers, I. Gas-phase hydrolysis of SOF2 and SOF4. J. Chem. Phys. 1986, 85, 4377–4380. [Google Scholar] [CrossRef]
  27. Brunt, R.J.V.; Herron, J.T. Plasma chemical model for decomposition of SF6 in a negative glow corona discharge. Phys. Scr. 1994, T53, 9. [Google Scholar] [CrossRef]
  28. Fan, L.; Ju, T.; Liu, Y. Mathematical model of influence of oxygen and moisture on feature concentration ratios of SF6 Decomposition Products. In Proceedings of the 2012 IEEE Power and Energy Society General Meeting, San Diego, CA, USA, 22–26 July 2012; pp. 1–5. [Google Scholar]
  29. Zeng, F.; Tang, J.; Zhang, X.; Sun, H.; Yao, Q.; Miao, Y. Study on the influence mechanism of trace H2O on SF6 thermal decomposition characteristic components. IEEE Trans. Dielectr. Electr. Insul. 2017, 24, 367–374. [Google Scholar] [CrossRef]
  30. Diao, Z.; Zhao, Y.; Chen, B.; Duan, C.; Song, S. ReaxFF reactive force field for molecular dynamics simulations of epoxy resin thermal decomposition with model compound. J. Anal. Appl. pyrolysis 2013, 104, 618–624. [Google Scholar] [CrossRef]
Figure 1. Pin-plate electrodes on epoxy resin.
Materials 12 01408 g001
Figure 2. AC experimental equipment.
Materials 12 01408 g002
Figure 3. Initial flashover discharge voltages vs. discharge times at different pin-plate electrodes distances.
Materials 12 01408 g003
Figure 4. Digital images showing randomness of creepage distance at the gap distance of 9 mm.
Materials 12 01408 g004
Figure 5. Concentration of seven gases vs. discharge times at different pin-plate electrodes distances. (a) 5 mm, (b) 6 mm, (c) 7 mm, (d) 8 mm, and (e) 9 mm.
Materials 12 01408 g005
Figure 6. Concentration variation of (a) SOF2 and (b) SO2F2 vs. flashover discharge times.
Materials 12 01408 g006
Figure 7. Concentration variation of SO2.
Materials 12 01408 g007
Figure 8. Concentration variation of (a) CF4 and (b) CO2.
Materials 12 01408 g008
Figure 9. Concentration variation of CS2.
Materials 12 01408 g009
Figure 10. Concentration variation of H2S.
Materials 12 01408 g010
Figure 11. Structure of a single molecule of 593 type curing agent.
Materials 12 01408 g011
Figure 12. Chemical structure and ball-stick model of an epoxy resin molecule.
Materials 12 01408 g012
Figure 13. Periodic cubic box of epoxy resin molecules.
Materials 12 01408 g013
Figure 14. Theoretical number of fragments for the decomposition of epoxy resin heated at 1300 K over time.
Materials 12 01408 g014
Figure 15. Dominant reaction pathways (RPWs) of H2O.
Materials 12 01408 g015
Table 1. Average roughness of the epoxy resin samples after 21 times flashover discharges at different pin-plate electrodes distances.
Gap Distances (mm)56789
Roughness/(μm)0.70.7610.8590.8070.887

