Article

Thermal Conductivity of Molten Carbonates with Dispersed Solid Oxide from Differential Scanning Calorimetry

by
Sathiyaraj Kandhasamy
1,*,
Anne Støre
2,
Geir Martin Haarberg
1,
Signe Kjelstrup
3 and
Asbjørn Solheim
2
1
Department of Materials Science and Engineering, Norwegian University of Science and Technology (NTNU), NO-7034 Trondheim, Norway
2
SINTEF Industry, SINTEF, NO-7034 Trondheim, Norway
3
PoreLab, Department of Chemistry, NTNU, NO-7034 Trondheim, Norway
*
Author to whom correspondence should be addressed.
Materials 2019, 12(9), 1486; https://doi.org/10.3390/ma12091486
Submission received: 27 February 2019 / Revised: 13 April 2019 / Accepted: 7 May 2019 / Published: 8 May 2019
(This article belongs to the Section Energy Materials)

Abstract

:
Recently, there has been a noticeable increase in the applications of composite mixtures containing molten salt and solid oxide for thermal energy conversion and storage systems. This highlights that thermal conductivity of the composites are central for the purpose of designing and devising processes. Measuring the thermal conductivity of molten samples at elevated temperatures remains challenging. In this study, the possibility to use heat flux differential scanning calorimetry (DSC) to measure the thermal conductivity of molten samples at elevated temperatures is reported for the first time. The thermal conductivity of composite mixtures containing eutectic (Li,Na)2CO3 with and without selected solid oxides at ~675 °C was determined by using the proposed DSC approach. This mixture is a candidate for high temperature waste heat conversion to electric energy. In the DSC measurement program, steps with repeated thermal cycles between 410 and 515 °C were included to limit the effect of the interface thermal contact resistance. The determined values 0.826 ± 0.001, and 0.077 ± 0.004 W m−1K−1 for the carbonate mixtures with and without solid MgO were found to match the reliable analysis at similar conditions.

1. Introduction

Molten salt based composite mixtures are emerging as vital components for many high temperature heat conversion and storage systems [1,2,3,4]. The latest concentrating solar power (CSP) plants are using such composite mixtures for thermal energy storage (TES) [3,5,6]. Recently, electrolyte mixtures, in the form of composites with molten carbonate and solid oxide, were found to be suitable for high temperature thermoelectric cells with liquid electrolyte (i.e., thermocell) [4,7,8]. Utilization of these composites was found to improve conditions for operation and enhance efficiency. Among physical and chemical properties of the composites, thermal conductivity is a critical factor for designing the process [9,10,11,12].
Many high temperature thermal conductivity measurement techniques have been established, such as transient hot-wire/strip and laser flash analysis (LFA) [13,14]. However, due to the high electrical conductivity, the transient hot-wire requires a non-conducting probe to measure in melts [15,16]. The LFA analysis demands a special sample container to measure the molten samples and high sampling precision to form an ideal three-layer interface [17]. These modifications make the analysis expensive and difficult to perform. Differential scanning calorimetry (DSC) is a simple and common tool that can measure several thermal properties, such as heat capacity, melting point, and phase transition temperature [18]. It is suitable for a variety of samples (solids, powders, thin films, and melts).
In DSC, the heat flow into the sample is monitored, and used to determine the thermal properties. The sensor, integrated with the furnace (bottom of the pan), measures the heat flowing into the sample. Furthermore, in DSC, for measurements under 700 °C error due to heat transfer by radiation is not significant. This is because the furnace used to heat sample in the DSC apparatus is assembled with a sequence of radiation shields (see Figure S1) to avoid heat loss by radiation [19]. However, the heat flowing out from the sample is not measured, but this is also essential for computation of the thermal conductivity of the sample. In 1985, Hakvoort et al. [20] demonstrated the possibility of using the heat flux in DSC to measure thermal conductivity of solids. The heat flowing out from the sample was indirectly determined by placing a pure metal reference over the sample and the melting behavior of the metal was recorded [20]. Thus, the change in melting behavior of the metal revealed the thermal resistance of the sample.
Hakvoort et al. [20] determined the thermal conductivity of a few solid samples by using a Ga or In metal reference on top of the sample. The solid samples with a thermal conductivity of 1 W m−1K−1 or higher showed reliable results only when the thermal contact was improved by applying a special paste. But for the solid samples with low thermal conductivity (like plastic or porous materials), application of contact paste was not strictly required provided the samples are sufficiently flat. In the case of porous solid samples, the gas atmosphere used in the analysis was found to influence the estimated thermal conductivity of the samples [20]. Moreover, the value for thermal conductivity of a few powders and polymer films has been determined by DSC at low temperatures [21,22,23,24,25,26]. Recently, Hamidreza et al. [27,28,29,30,31] reported an appropriate approach to deconvolute the thermal contact resistance from the measured total thermal resistance of the sample. For the purpose of accurate thermal conductivity, a two-thickness method (i.e., identical samples with different thickness) was considered and the average value of their actual thermal conductivities was used [27,28,31]. In the present study, for the first time, we optimize experimental conditions to use with heat flux DSC for computation of the thermal conductivity of the molten salt composite mixtures at higher temperatures. The thermal conductivity of a sample is also determined by using LFA analysis for validation of the DSC approach.

2. Materials and Methods

The sample compositions are listed in Table 1. High purity (>99%) molten carbonates and solid oxides were purchased from Sigma-Aldrich. Samples were prepared by mixing the as-purchased chemicals in a hand mortar and pestle; then dried in a hot air oven at 200 °C for 48 h. A NETZSCH STA 449C Jupiter apparatus for simultaneous DSC and thermal gravimetric analysis (TGA) was used for the analysis. The DSC metal standards were used to calibrate the apparatus. The dried powders were packed into the DSC cylindrical alumina pan (~5.8 mm inner dia and 3.9 mm inner height) by a gentle press. Following this, (Figure S1) the pure Al metal was machined as a flat surfaced disk (5 mm dia and 1 mm thick) and was slightly pressed over the packed powder sample in the DSC pan. To obtain an accurate thermal resistance of the sample, the heat flow path to the metal should be confined through the sample. To ensure the essential heat flow path, the Al disk was centered over the sample to avoid contact with the pan walls. First, a blank measurement was executed with two identical empty pans placed in the two compartments of the instrument for the background correction. After this, an empty pan was replaced by the pan loaded with the sample and Al disk. The heat flow into the sample was recorded as a function of temperature under N2 atmosphere. For each sample, the measurement was performed with three different quantities (30, 45, and 60 mg) of the powder sample. A multi-thickness method was used, where the sample composition and Al reference disk remain the same, with the only difference being the sample thickness. A new pan and Al disk were used for each measurement, the disks were identical, with an equal weight of 52.8 mg (±0.3 error).
The thermal conductivity of an LNC-MO (eutectic (Li,Na)2CO3 dispersed with solid MgO) sample was also determined by NETZSCH 457 MicroFlash (LFA) for comparison. A special container from NETZSCH made of an alloy (Pt10%Rh) with a top lid was used to measure the sample in the molten phase. The outer surface of the container was coated with a thin layer of graphite to avoid laser reflection. To avoid the formation of interface voids (container-sample-top lid) and overflow of the sample on melting, a specific amount of the sample was used to fill the container. A quantity of 2 g of the as-prepared LNC-MO powder was compacted into a circular disk (10 mm diameter) in a hydraulic press with a load of 250 kg. In the LFA instrument, the container with a LNC-MO disk was heated to the measurement temperature under N2 atmosphere. Once the measurement temperature (675 °C) was established, a short laser beam heated one side of the sample. The temperature rise on the other side was measured by the infrared detector (IR) detector to estimate thermal diffusivity (α). The sample was exposed to 5 successive laser shots for better accuracy, with an interval of 1 min between each subsequent shot. The measurement was repeated with a new LNC-MO disk to confirm the reproducibility. The measured thermal diffusivity (α) was converted into thermal conductivity (λ) through the expression λ = αρCp [32]. A push rod dilatometer was used to determine the density (ρ) and a separate DSC measurement (Table S1) was performed to attain the heat capacity (Cp). The procedure to determine the ρ and Cp of the samples is provided in the Supplementary material (Figures S2 and S3).

3. Results and Discussion

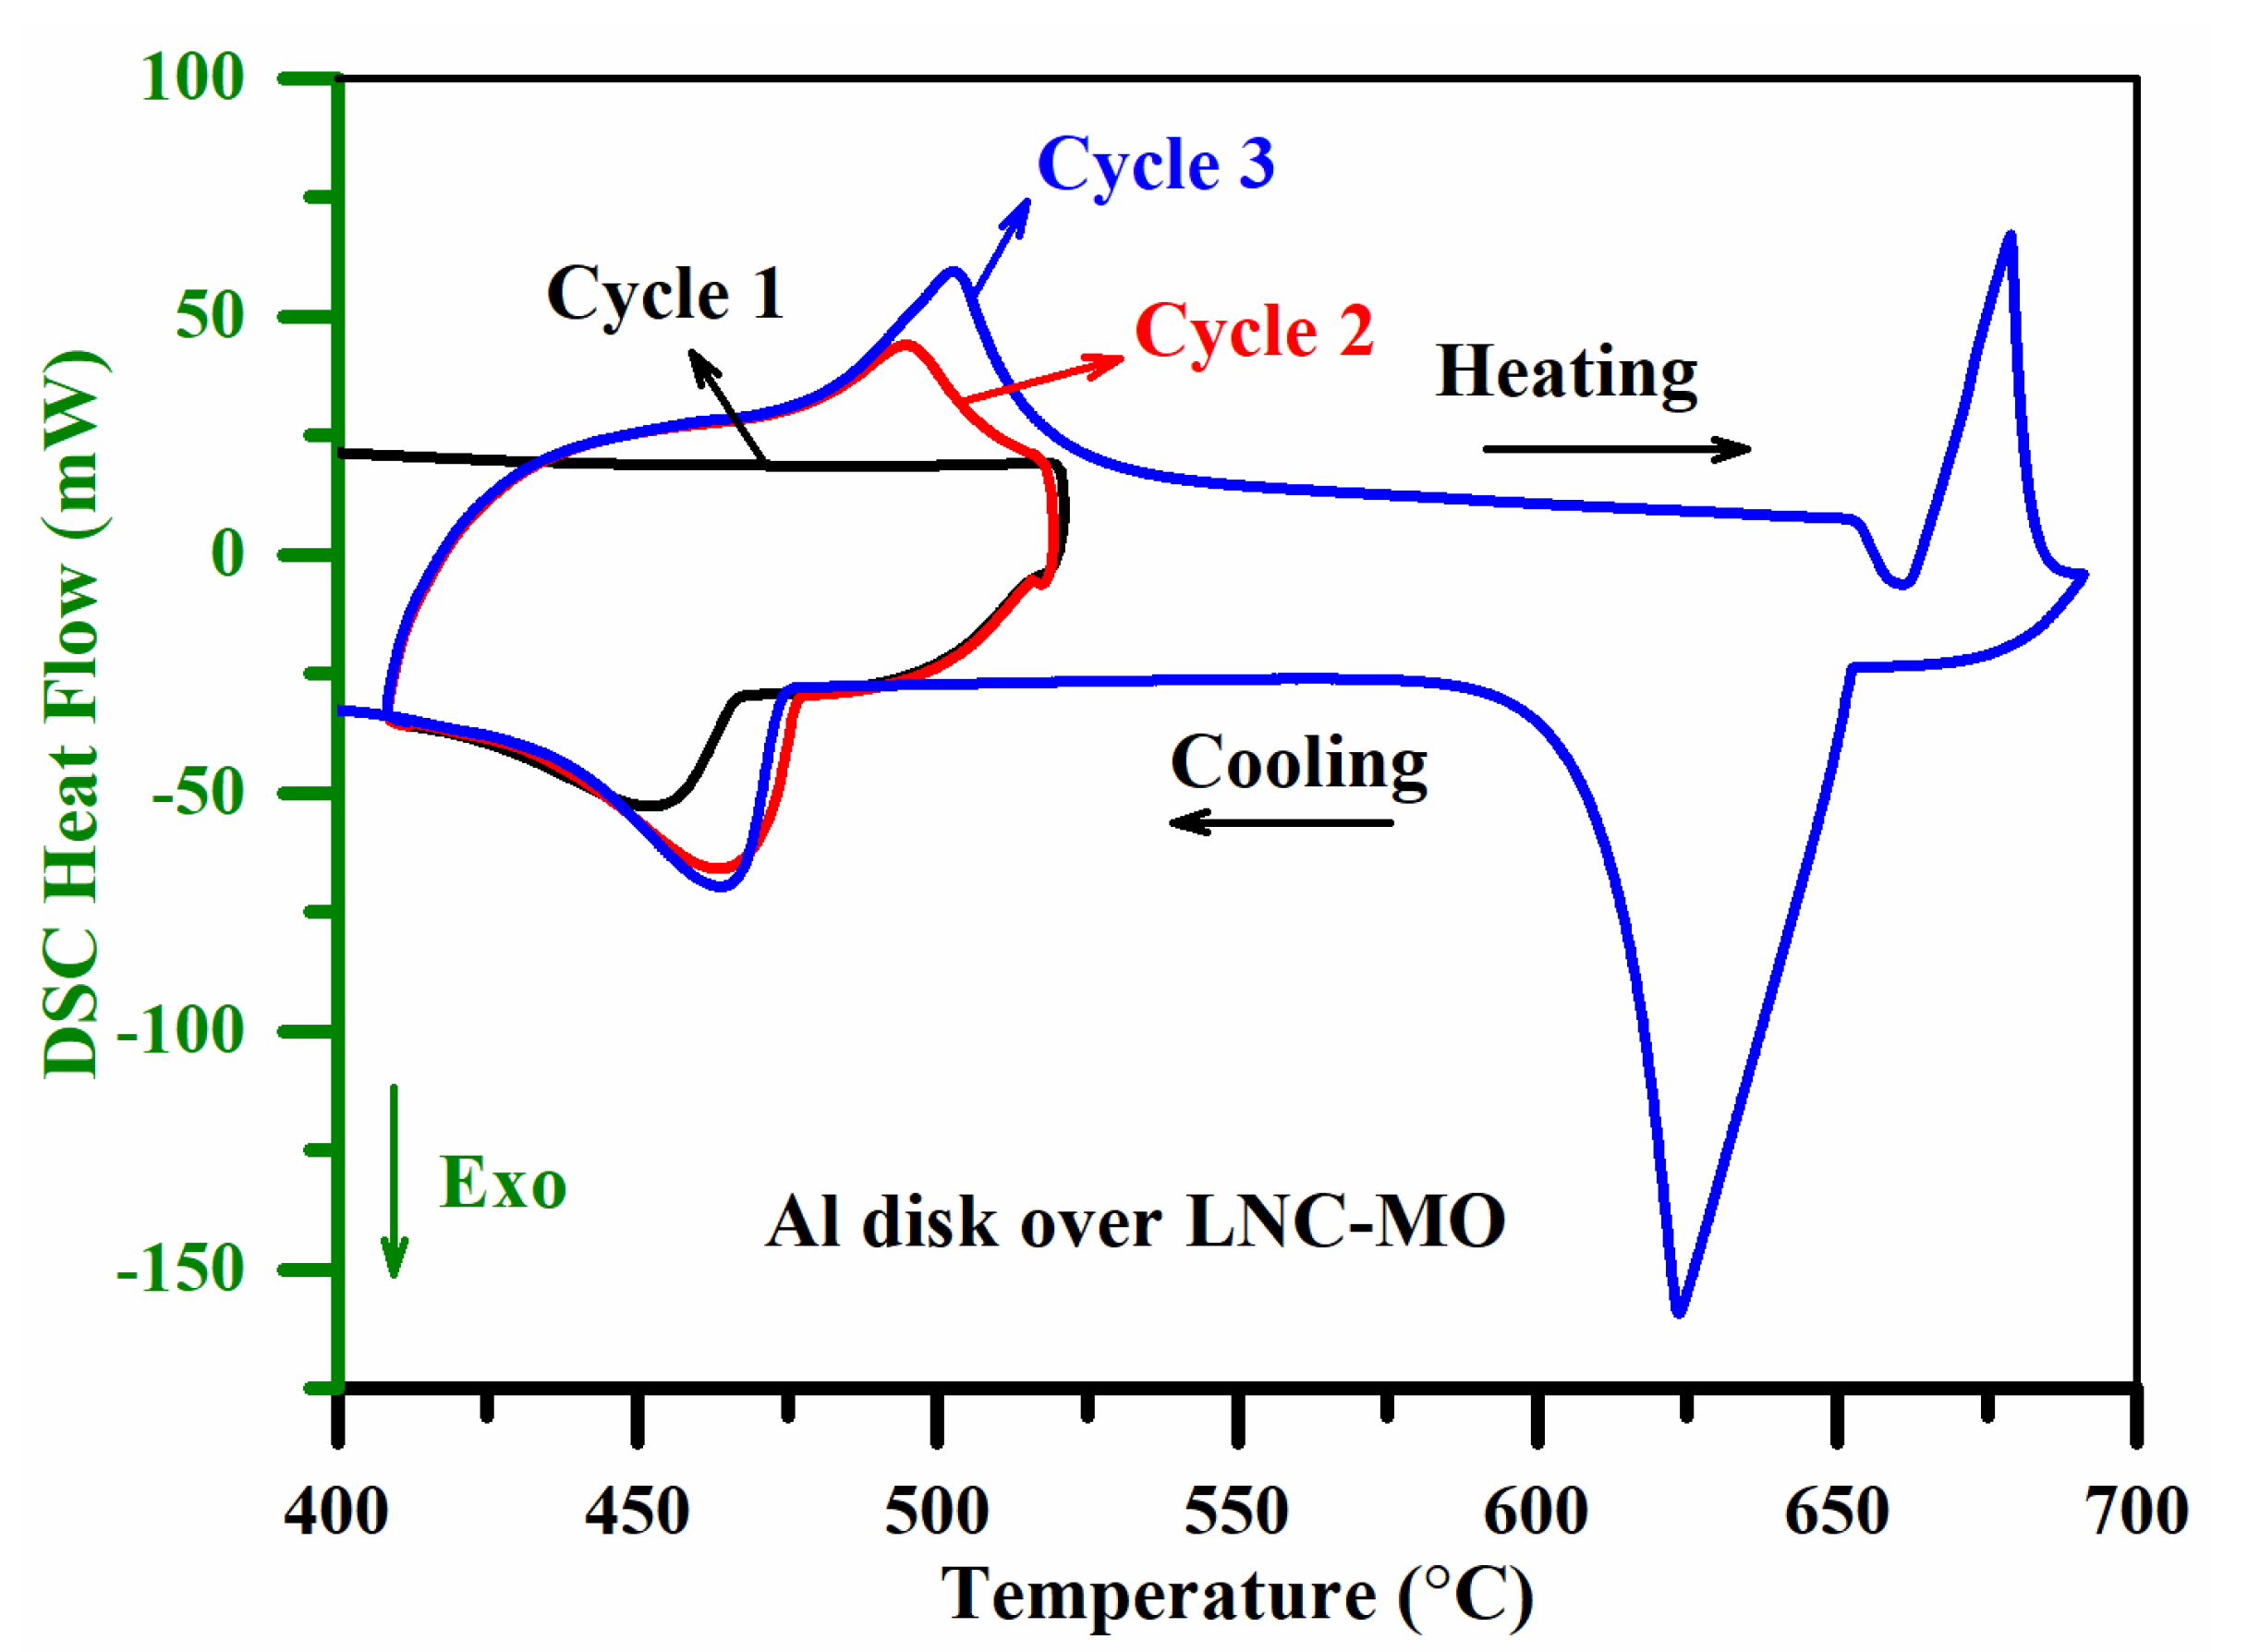
The composition of the samples (Table 1) under investigation were used as candidates for high temperature thermal energy conversion and storage systems. For thermoelectric energy conversion and thermal energy storage operations, it is essential to know the solid–liquid phase transition of the salt in the composite mixture. The systems are always operated at temperatures well above the melting point of the molten salt. Therefore, the DSC thermal conductivity measurement program (Table 2) was set up, considering the melting point of the molten salt mixtures along with a few other parameters, such as the thermal and chemical stability of the samples and the melting point of the metal disk. In Figure 1, the TGA weight loss detected before the first heating cycle was due to evaporation of moisture (<200 °C) and melting (~495 °C) of LNC (eutectic Li and Na carbonates) in the LNC-MO mixture [33]. No significant weight loss was observed, demonstrating a high thermal and chemical stability of the sample during the analysis [34]. The steady baseline of the DSC cooling curves (Figure 2) before the exothermic peaks also confirms the chemical stability and retention of the homogeneity of the sample [33,35]. The LNC in the sample mixtures had a liquidus temperature of ~495 °C [4]. Therefore, the selection of pure Al metal (melting point ~660 °C) as the reference is reasonable.
The interface thermal contact resistance between the pan, sample, and Al disk could add an additional thermal resistance. In case of solid samples, Hakvoort et al. [20] reported that applying a silicon paste with high thermal conductivity at the interface minimized the effect of contact resistance. The silicon paste at the interface could, however, also affect the homogeneity of the sample in the molten state. It is well-known that the LNC in the sample mixture undergoes a significant thermal expansion and contraction upon heating and cooling, with a liquidus temperature of ~495 °C [33,36]. Therefore, subjecting the sample to an appropriate thermal cycling (heating and cooling) could improve the thermal contact. Thus, steps with repeated thermal cycles between 410 and 515 °C were included to limit the effect of the interface thermal contact resistance between the pan, sample, and Al disk. Meanwhile, in this DSC approach, the heating curve between 650 and 690 °C showing the melting behavior of the Al disk, is the only essential region to determine the thermal conductivity of the sample. Therefore, the Al disk should melt with a sharp endothermic peak to display the change in heat flowing out from the sample [21,22]. To hold the Al disk in its solid phase during the thermal cycles, the heating temperature of the thermal cycles was limited to 515 °C. However, the isothermal step for 15 min at 515 °C will melt LNC completely while establishing the solid–liquid phase transition. A slow heating rate (5 °C/min) was used to execute the particular region (650 to 690 °C) showing the Al melting behavior. Otherwise, a relatively fast rate (20 °C/min) was used to shorten the analysis time.
The DSC endothermic peak (Figure 2) observed in the second and third heating cycles represents the LNC solid to liquid phase transition. The endothermic peak is intense and well defined in the third heating cycle, but not even initiated in the first heating cycle. This illustrates that the repeated solid and liquid phase transition had established a better thermal contact after a few thermal cycles [33,34]. The heating curve recorded between 650 and 690 °C (Al melting behavior) in the third cycle (after establishing a better thermal contact) was used to determine the thermal resistance of the sample. Hence, further deconvolution of thermal contact resistance from the estimated bulk resistance was not considered. Figure 3a shows that the Al melting point was not at the exact expected temperature of 660 °C. This shift may be associated with the thermal resistance of the heat flow path (sample) [20,21]. However, Al melting behavior was initiated around 660 °C (±2 °C) in all measurements. The difference in sample quantity will change the heat flow path length (i.e., the sample height) and consequently shift the measured Al melting point (Figure 3a) [21,22]. The thermal resistance of each measurement was determined from the slope of the rising side of the endothermic peak [20,21,22]. The temperature of the measurement was considered to be ~675 °C, the average temperature of the endothermic peak’s rising side.
The calculated thermal resistances were plotted against the corresponding height to contact area ratio of the sample in Figure 3b [21,22]. The contact area between the molten sample and pan will be the same as the inner cross-sectional area of the pan. However, the height (thickness) of the molten sample packed between the pan and the Al disk was varied, and was determined from the quantity and density of the sample mixture. The change in density of the sample on heating was estimated by using the push rod dilatometer (Supplementary material Figure S2) to process the LFA measurement for better accuracy. The estimated density at 675 °C, and the known sample quantity, were used to determine the appropriate change in sample height. The appropriate height (thickness) for the different quantities (30, 45, and 60 mg) of the molten LNC-MO sample was determined to be 0.36, 0.51, and 0.66 mm. Therefore, a multi-thickness method was used, where the sample composition and Al reference disk remain same with only difference in sample thickness. The inverse of the slope of the linear fit (Figure 3b) is the absolute thermal conductivity of the LNC-MO (0.08 ± 0.004 W m−1K−1) [22]. The slope of the linear fit and associated standard error were determined by linear least-square regression analysis. Therefore, average of actual thermal conductivity of the measurements with different thickness of same sample was reported as measured thermal conductivity in Table 3. In a similar way, the thermal conductivity (Table 3) of the other samples was also determined using the DSC method (Figures S4 and S5).
Table 3 shows that the thermal conductivity of the LNC-MO mixture determined by the DSC (0.077 ± 0.004 W m1K1) and the LFA (0.078 ± 0.001 W m1K1) was the same within the ascertained accuracy of the experiment. The LFA thermal diffusivity measured for the five successive laser shots were converted into thermal conductivity individually, as shown in Table 4. The absolute value and standard deviation reported from the LFA analysis in Table 3 is mean and standard error of the mean of the thermal conductivity for the five shots in Table 4. While the LFA technique requires a special container and separate specific heat capacity (Cp) measurement for data processing, the DSC method is less expensive. Thus, the thermal conductivity measurement by the DSC method is inexpensive compared to the LFA method. We have seen that the thermal conductivity of the pure eutectic (Li,Na)2CO3 melt (i.e., LNC), determined by using the DSC approach (0.83 ± 0.001 W m1K1), matches with a reliable data set (0.887 ± 0.002 W m1K1) [15].

4. Conclusions

The thermal conductivity of composite mixtures containing molten carbonate and solid oxides was determined by the DSC approach. For the mixtures containing eutectic (Li,Na)2CO3 with and without solid MgO, the measured thermal conductivity was identical to the LFA and a reliable data set in the literature [15]. The DSC approach appears to be a simple and inexpensive method to determine the thermal conductivity of molten samples. Therefore, the heat flux DSC analysis is a suitable tool to determine the thermal conductivity of molten salt composites at elevated temperatures. We reported new data for thermal conductivity of eutectic (Li,Na)2CO3 with and without dispersed solid oxide (MgO / LiAl2O3 / Al2O3 / CeO2) at 675 °C.

Supplementary Materials

The following are available online at https://www.mdpi.com/1996-1944/12/9/1486/s1, Full experimental procedure used to determine the density and heat capacity of the samples; Figure S1: (a) STA 449 C Jupiter® equipment, (b) Schematic of NETZCH STA 449C Jupiter and, (c) LNC-MO sample mixture, Al metal disk and DSC alumina crucible; Figure S2: Dilatometer measurement to determine the change in density; Figure S3: DSC measurement to determine the Cp of LNC-MO; Figure S4 and S5: Recorded DSC heat flow and TGA weight loss profiles of LNC-AO, LNC-CO, LNC-LAO and LNC samples (30 mg of sample); Table S1: DSC temperature program used in determining the Cp.

Author Contributions

S.K. (Sathiyaraj Kandhasamy): performed methodology, DSC analysis, determination of thermal expansions, writing—original draft preparation; A.S. (Anne Støre): thermal conductivity measurements by LFA, G.M.H.; S.K. (Signe Kjelstrup) and A.S. (Asbjørn Solheim): discussion, suggestions, review and editing.

Funding

The authors wish to acknowledge the Research Council of Norway for financial support of the research project “Sustainable and Energy Efficient Electrochemical Production and Refining of Metals (SUPREME)” project no. 228296 under the ENERGIX program and the industrial partners Hydro Aluminum, Boliden, Glencore, and Permascand for support. S. Kjelstrup thanks the Research Council of Norway for its Center of Excellence Funding scheme for Porelab, project no. 262644. The APC was funded by NTNU’s Publishing Fund.

Conflicts of Interest

The authors declare no conflict of interest.

References

  1. Frangini, S.; Masi, A. Molten carbonates for advanced and sustainable energy applications: Part I. Revisiting molten carbonate properties from a sustainable viewpoint. Int. J. Hydrogen Energy 2016, 41, 18739–18746. [Google Scholar] [CrossRef]
  2. Fan, L.D.; He, C.X.; Zhu, B. Role of carbonate phase in ceria-carbonate composite for low temperature solid oxide fuel cells: A review. Int. J. Energy Res. 2017, 41, 465–481. [Google Scholar] [CrossRef]
  3. Sang, L.; Li, F.; Xu, Y. Form-stable ternary carbonates/MgO composite material for high temperature thermal energy storage. Sol. Energy 2019, 180, 1–7. [Google Scholar] [CrossRef]
  4. Kandhasamy, S.; Solheim, A.; Kjelstrup, S.; Haarberg, G.M. Electrolyte Melt Compositions for Low Temperature Molten Carbonate Thermocells. ACS Appl. Energy Mater. 2018, 1, 5386–5393. [Google Scholar] [CrossRef]
  5. Serrano-Lopez, R.; Fradera, J.; Cuesta-Lopez, S. Molten salts database for energy applications. Chem. Eng. Process. 2013, 73, 87–102. [Google Scholar] [CrossRef] [Green Version]
  6. Turchi, C.S.; Vidal, J.; Bauer, M. Molten salt power towers operating at 600–650 °C: Salt selection and cost benefits. Sol. Energy 2018, 164, 38–46. [Google Scholar] [CrossRef]
  7. Kang, X.; Børset, M.T.; Burheim, O.S.; Haarberg, G.M.; Xu, Q.; Kjelstrup, S. Seebeck coefficients of cells with molten carbonates relevant for the metallurgical industry. Electrochim. Acta 2015, 182, 342–350. [Google Scholar] [CrossRef] [Green Version]
  8. Kandhasamy, S.; Calandrino, L.; Burheim, O.S.; Solheim, A.; Kjelstrup, S.; Haarberg, G.M. Influence of Electrode Gas Flow Rate and Solid Oxide Ratio in Electrolyte on the Seebeck Coefficient of Molten Carbonate Thermocell. J. Electrochem. Soc. 2017, 164, H5271–H5276. [Google Scholar] [CrossRef] [Green Version]
  9. Liu, M.; Saman, W.; Bruno, F. Review on storage materials and thermal performance enhancement techniques for high temperature phase change thermal storage systems. Renew. Sustain. Energy Rev. 2012, 16, 2118–2132. [Google Scholar] [CrossRef]
  10. Wei, X.; Yin, Y.; Qin, B.; Ding, J.; Lu, J. Thermal conductivity improvement of liquid Nitrate and Carbonate salts doped with MgO particles. Energy Procedia 2017, 142, 407–412. [Google Scholar] [CrossRef]
  11. Ge, Z.W.; Ye, F.; Ding, Y.L. Composite Materials for Thermal Energy Storage: Enhancing Performance through Microstructures. Chemsuschem 2014, 7, 1318–1325. [Google Scholar] [CrossRef] [Green Version]
  12. Cornwell, K. The possibility of using molten salts for thermoelectric generation. J. Phys. D Appl. Phys. 1968, 1, 173–178. [Google Scholar] [CrossRef]
  13. Gheribi, A.E.; Torres, J.A.; Chartrand, P. Recommended values for the thermal conductivity of molten salts between the melting and boiling points. Sol. Energy Mater. Sol. Cells 2014, 126, 11–25. [Google Scholar] [CrossRef]
  14. Khokhlov, V.; Korzun, I.; Dokutovich, V.; Filatov, E. Heat capacity and thermal conductivity of molten ternary lithium, sodium, potassium, and zirconium fluorides mixtures. J. Nucl. Mater. 2011, 410, 32–38. [Google Scholar] [CrossRef]
  15. Zhang, X.; Fujii, M. Simultaneous measurements of the thermal conductivity and thermal diffusivity of molten salts with a transient short-hot-wire method. Int. J. Thermophys. 2000, 21, 71–84. [Google Scholar] [CrossRef]
  16. Hoshi, M.; Omotani, T.; Nagashima, A. Transient Method to Measure the Thermal-Conductivity of High-Temperature Melts Using a Liquid-Metal Probe. Rev. Sci. Instrum. 1981, 52, 755–758. [Google Scholar] [CrossRef]
  17. Tada, Y.; Harada, M.; Tanigaki, M.; Eguchi, W. Laser Flash Method for Measuring Thermal-Conductivity of Liquids - Application to Molten-Salts. Ind. Eng. Chem. Fundam. 1981, 20, 333–336. [Google Scholar] [CrossRef]
  18. Vyazovkin, S. Thermal Analysis. Anal. Chem. 2006, 78, 3875–3886. [Google Scholar] [CrossRef]
  19. Haines, P.J.; Reading, M.; Wilburn, F.W. Chapter 5—Differential Thermal Analysis and Differential Scanning Calorimetry. In Handbook of Thermal Analysis and Calorimetry; Brown, M.E., Ed.; Elsevier Science B.V.: Amsterdam, The Netherlands, 1998; Volume 1, pp. 279–361. [Google Scholar]
  20. Hakvoort, G.; Vanreijen, L.L.; Aartsen, A.J. Measurement of the Thermal-Conductivity of Solid Substances by DSC. Thermochim. Acta 1985, 93, 317–320. [Google Scholar] [CrossRef]
  21. Flynn, J.H.; Levin, D.M. A Method for the Determination of Thermal-Conductivity of Sheet Materials by Differential Scanning Calorimetry (DSC). Thermochim. Acta 1988, 126, 93–100. [Google Scholar] [CrossRef]
  22. Camirand, C.P. Measurement of thermal conductivity by differential scanning calorimetry. Thermochim. Acta 2004, 417, 1–4. [Google Scholar] [CrossRef]
  23. Marcus, S.M.; Blaine, R.L. Thermal conductivity of polymers, glasses and ceramics by modulated DSC. Thermochim. Acta 1994, 243, 231–239. [Google Scholar] [CrossRef]
  24. Sánchez-Rodríguez, D.; López-Olmedo, J.P.; Farjas, J.; Roura, P. Determination of thermal conductivity of powders in different atmospheres by differential scanning calorimetry. J. Therm. Anal. Calorim. 2015, 121, 469–473. [Google Scholar] [CrossRef] [Green Version]
  25. Pujula, M.; Sanchez-Rodriguez, D.; Lopez-Olmedo, J.P.; Farjas, J.; Roura, P. Measuring thermal conductivity of powders with differential scanning calorimetry A simplified method. J. Therm. Anal. Calorim. 2016, 125, 571–577. [Google Scholar] [CrossRef]
  26. Hu, M.; Yu, D.M.; Wei, J.B. Thermal conductivity determination of small polymer samples by differential scanning calorimetry. Polym. Test. 2007, 26, 333–337. [Google Scholar] [CrossRef]
  27. Sadeghifar, H. In-plane and through-plane electrical conductivities and contact resistances of a Mercedes-Benz catalyst-coated membrane, gas diffusion and micro-porous layers and a Ballard graphite bipolar plate: Impact of humidity, compressive load and polytetrafluoroethylene. Energy Convers. Manag. 2017, 154, 191–202. [Google Scholar]
  28. Sadeghifar, H.; Djilali, N.; Bahrami, M. Thermal conductivity of a graphite bipolar plate (BPP) and its thermal contact resistance with fuel cell gas diffusion layers: Effect of compression, PTFE, micro porous layer (MPL), BPP out-of-flatness and cyclic load. J. Power Sources 2015, 273, 96–104. [Google Scholar] [CrossRef]
  29. Sadeghifar, H.; Djilali, N.; Bahrami, M. Effect of Polytetrafluoroethylene (PTFE) and micro porous layer (MPL) on thermal conductivity of fuel cell gas diffusion layers: Modeling and experiments. J. Power Sources 2014, 248, 632–641. [Google Scholar] [CrossRef]
  30. Sadeghifar, H.; Djilali, N.; Bahrami, M. A new model for thermal contact resistance between fuel cell gas diffusion layers and bipolar plates. J. Power Sources 2014, 266, 51–59. [Google Scholar] [CrossRef]
  31. Sadeghifar, H.; Bahrami, M.; Djilali, N. A statistically-based thermal conductivity model for fuel cell Gas Diffusion Layers. J. Power Sources 2013, 233, 369–379. [Google Scholar] [CrossRef]
  32. An, X.H.; Cheng, J.H.; Yin, H.Q.; Xie, L.D.; Zhang, P. Thermal conductivity of high temperature fluoride molten salt determined by laser flash technique. Int. J. Heat Mass Transfer 2015, 90, 872–877. [Google Scholar] [CrossRef]
  33. Trahan, J.; Kuravi, S.; Goswami, D.Y.; Rahman, M.; Stefanakos, E. Thermal Characterization of High Temperature Inorganic Phase Change Materials for Thermal Energy Storage Applications. In Proceedings of the ASME 2012 6th International Conference on Energy Sustainability, Pts A and B 2012, San Diego, CA, USA, 23–26 July 2012; pp. 621–628. [Google Scholar] [CrossRef]
  34. Glenn, M.J.; Allen, J.A.; Donne, S.W. Thermal Investigation of a Doped Alkali-Metal Carbonate Ternary Eutectic for Direct Carbon Fuel Cell Applications. Energy Fuels 2015, 29, 5423–5433. [Google Scholar] [CrossRef]
  35. Frangini, S.; Scaccia, S. Influence of lanthanum carbonate additions on thermal stability of eutectic lithium–sodium carbonate near its melting point. Thermochim. Acta 2013, 551, 33–39. [Google Scholar] [CrossRef]
  36. Ward, A.T.; Janz, G.J. Molten carbonate electrolytes: Electrical conductance, density and surface tension of binary and ternary mixtures. Electrochim. Acta 1965, 10, 849–857. [Google Scholar] [CrossRef]
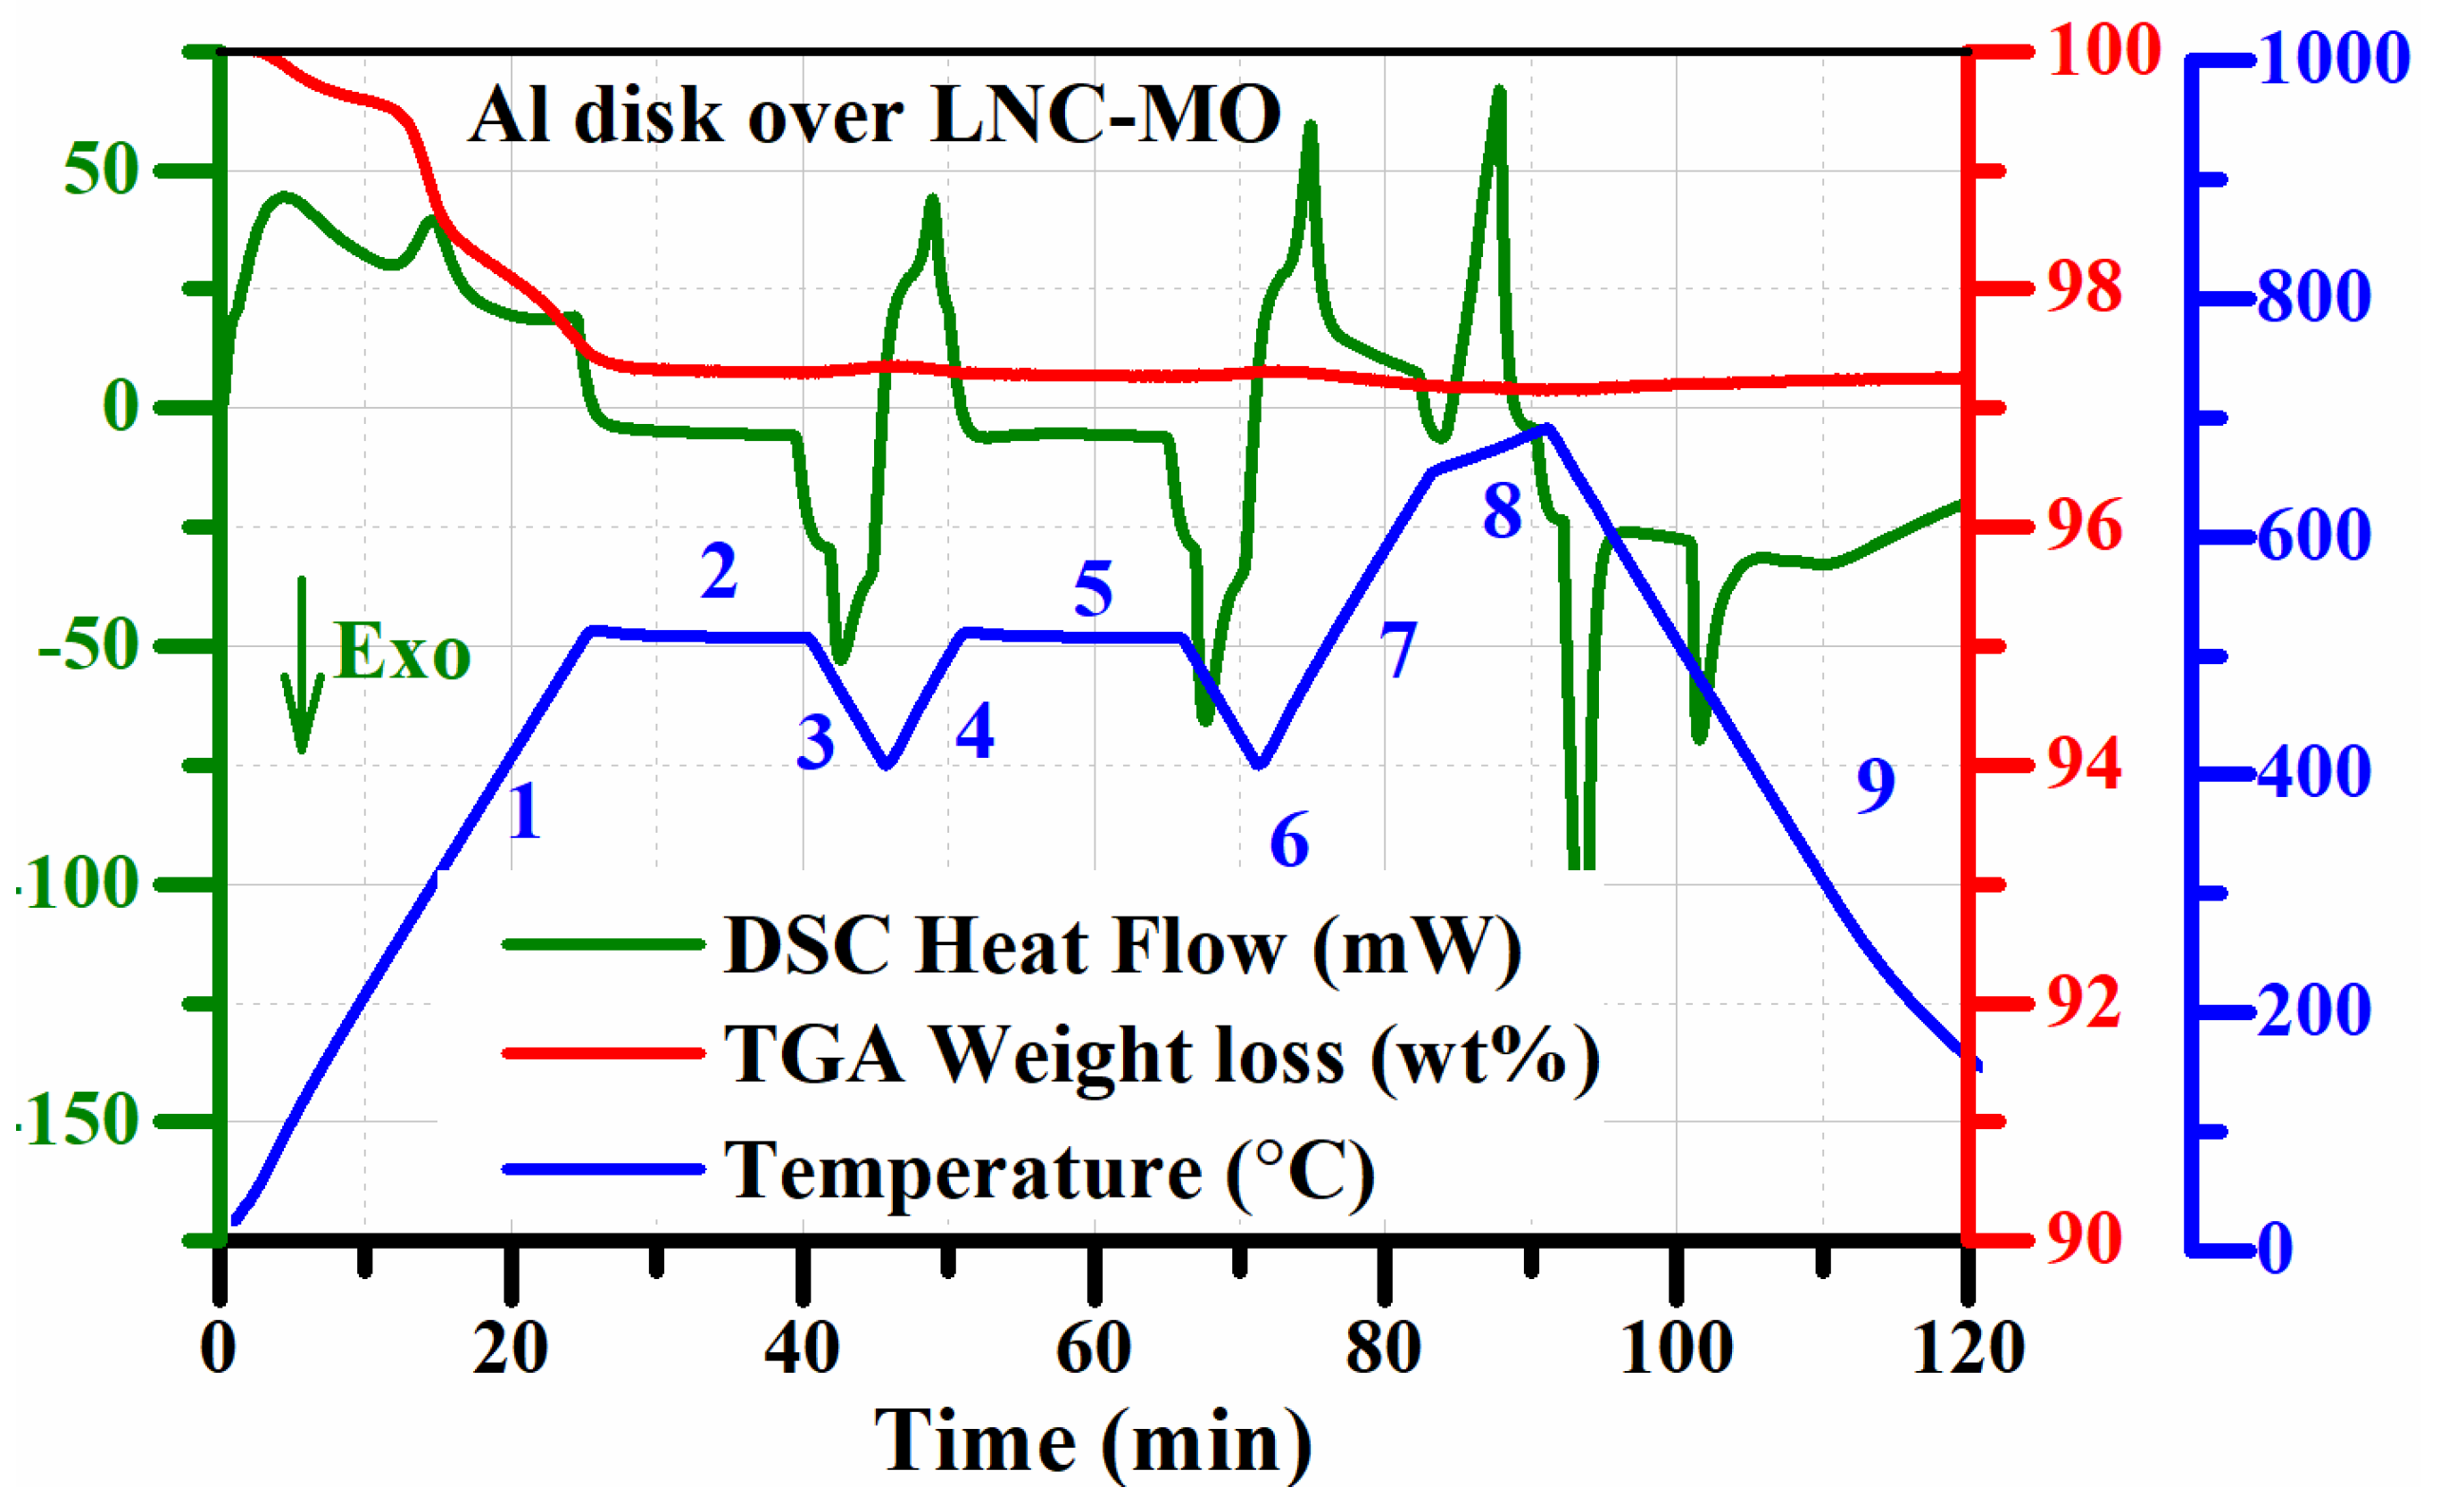
Figure 1. Recorded DSC heat flow and TGA weight loss profiles (numbers along the temperature profile are the segments listed in Table 2).
Materials 12 01486 g001
Figure 2. Influence of the thermal cycles and reduction in thermal contact resistance.
Materials 12 01486 g002
Figure 3. (a) The endothermic peak (segment 8—Al disk melting) of measurements with different quantity of LNC-MO, (b) The plot is used to estimate the absolute thermal conductivity.
Materials 12 01486 g003
Table 1. The composition of the samples used in the experiments.
SampleSample CompositionComposition Ratio (vol %)
Molten SaltSolid OxideMolten SaltSolid Oxide
LNC-MOEutectic molten carbonate (0.53 mol Li2CO3 + 0.47 mol Na2CO3)MgO4555
LNC-AOAl2O34555
LNC-COCeO24555
LNC-LAOLiAl2O34555
LNC--100--
Table 2. The differential scanning calorimetry (DSC) thermal conductivity measurement program.
SegmentModeTemperature (°C)Rate (°C/min)Hold Time (min)
1Dynamic (Heating)30–51520---
2Isothermal515---15
3Dynamic (Cooling)515–41020---
4Dynamic (Heating)410–51520---
5Isothermal515---15
6Dynamic (Cooling)515–41020---
7Dynamic (Heating)410–65020---
8Dynamic (Heating)650–6905---
9Dynamic (Cooling)690–3020---
Table 3. The estimated thermal conductivity of the samples.
SampleThermal Conductivity (W m−1K−1)
DSCLFALiterature [15]
LNC-MO0.077 ± 0.0040.078 ± 0.001--
LNC-AO0.039 ± 0.006----
LNC-CO0.038 ± 0.004----
LNC-LAO0.066 ± 0.011----
LNC0.826 ± 0.001--0.887 ± 0.002
Table 4. The laser flash analysis (LFA) thermal diffusivity and estimated thermal conductivity of LNC-MO at 675 °C.
Laser Shot NumberThermal Diffusivity (mm2/s)Thermal Conductivity
(W m−1K−1)
10.3010.078
20.3000.078
30.2970.077
40.2980.077
50.3040.079