Solidification Cracking Assessment of LTT Filler Materials by Means of Varestraint Testing and µCT


Abstract
:1. Introduction
2. State of the Art
- Material specific factors (e.g., chemical composition)
- Design specific factors (e.g., specimen geometry or restraint)
- Welding parameters (e.g., heat input)
- There has to be a solidification crack susceptible microstructure
- Thermal or mechanical strains have to be present
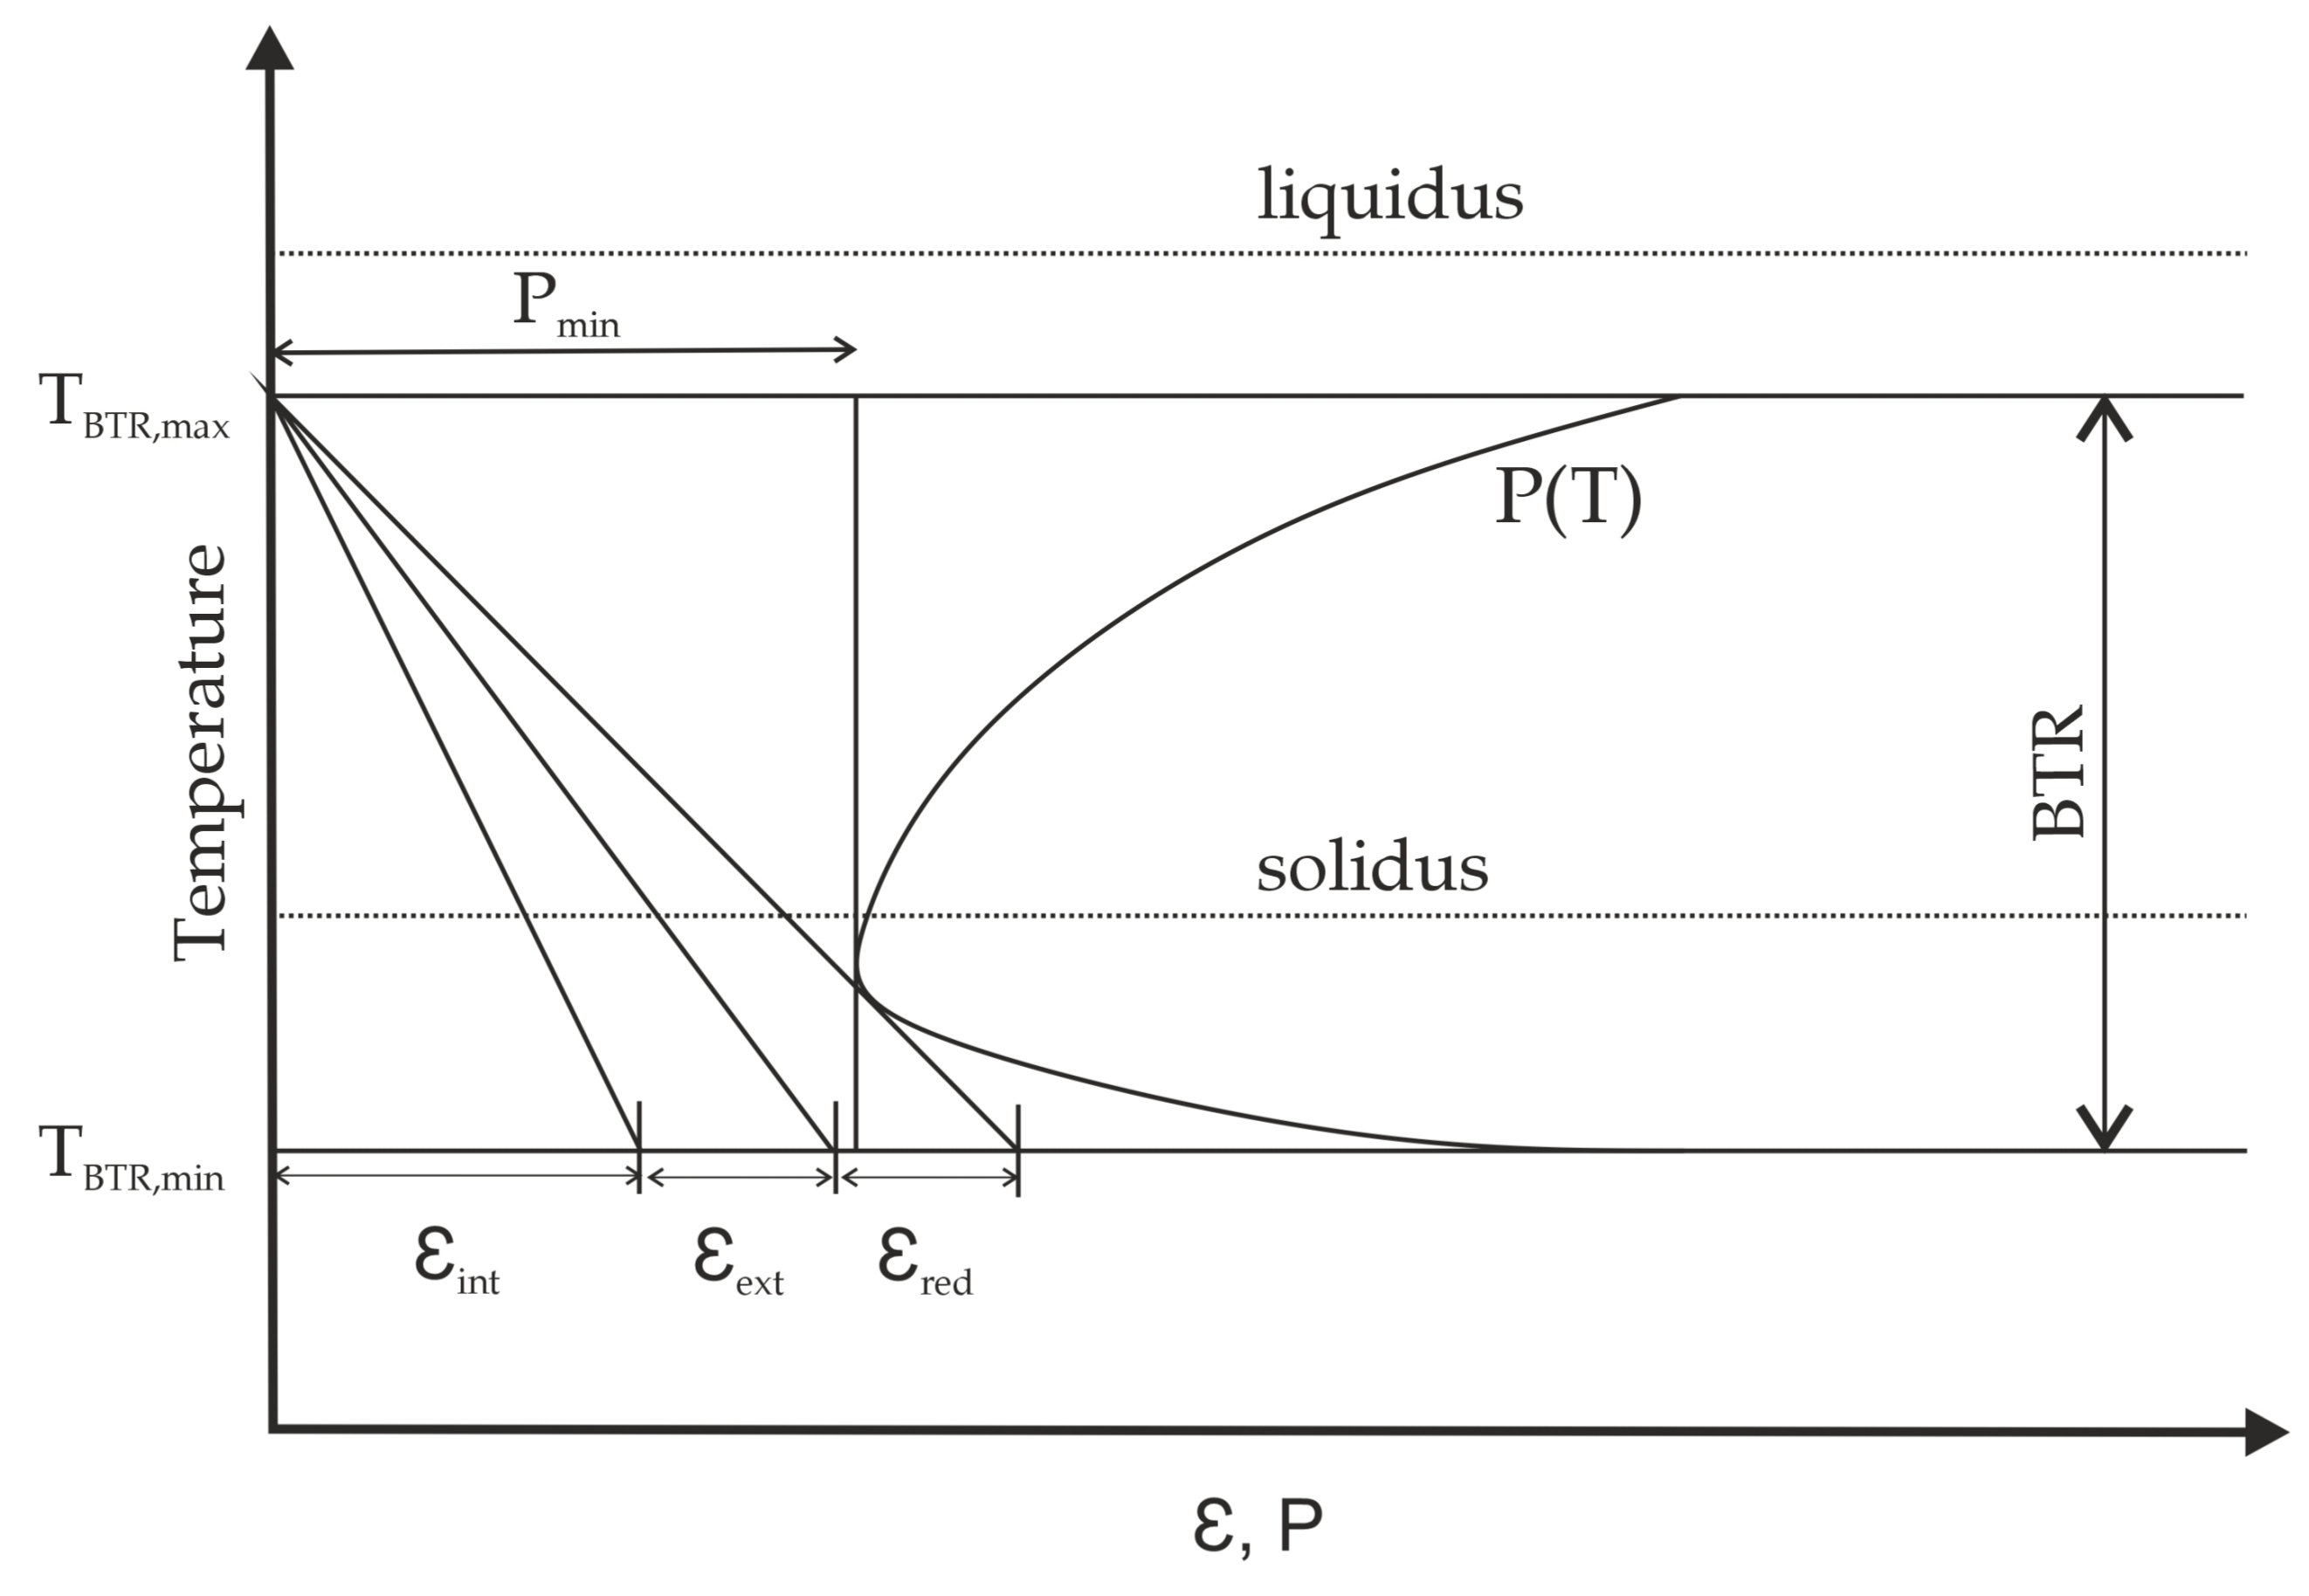
2.1. Hot Cracking Model Following Prokhorov
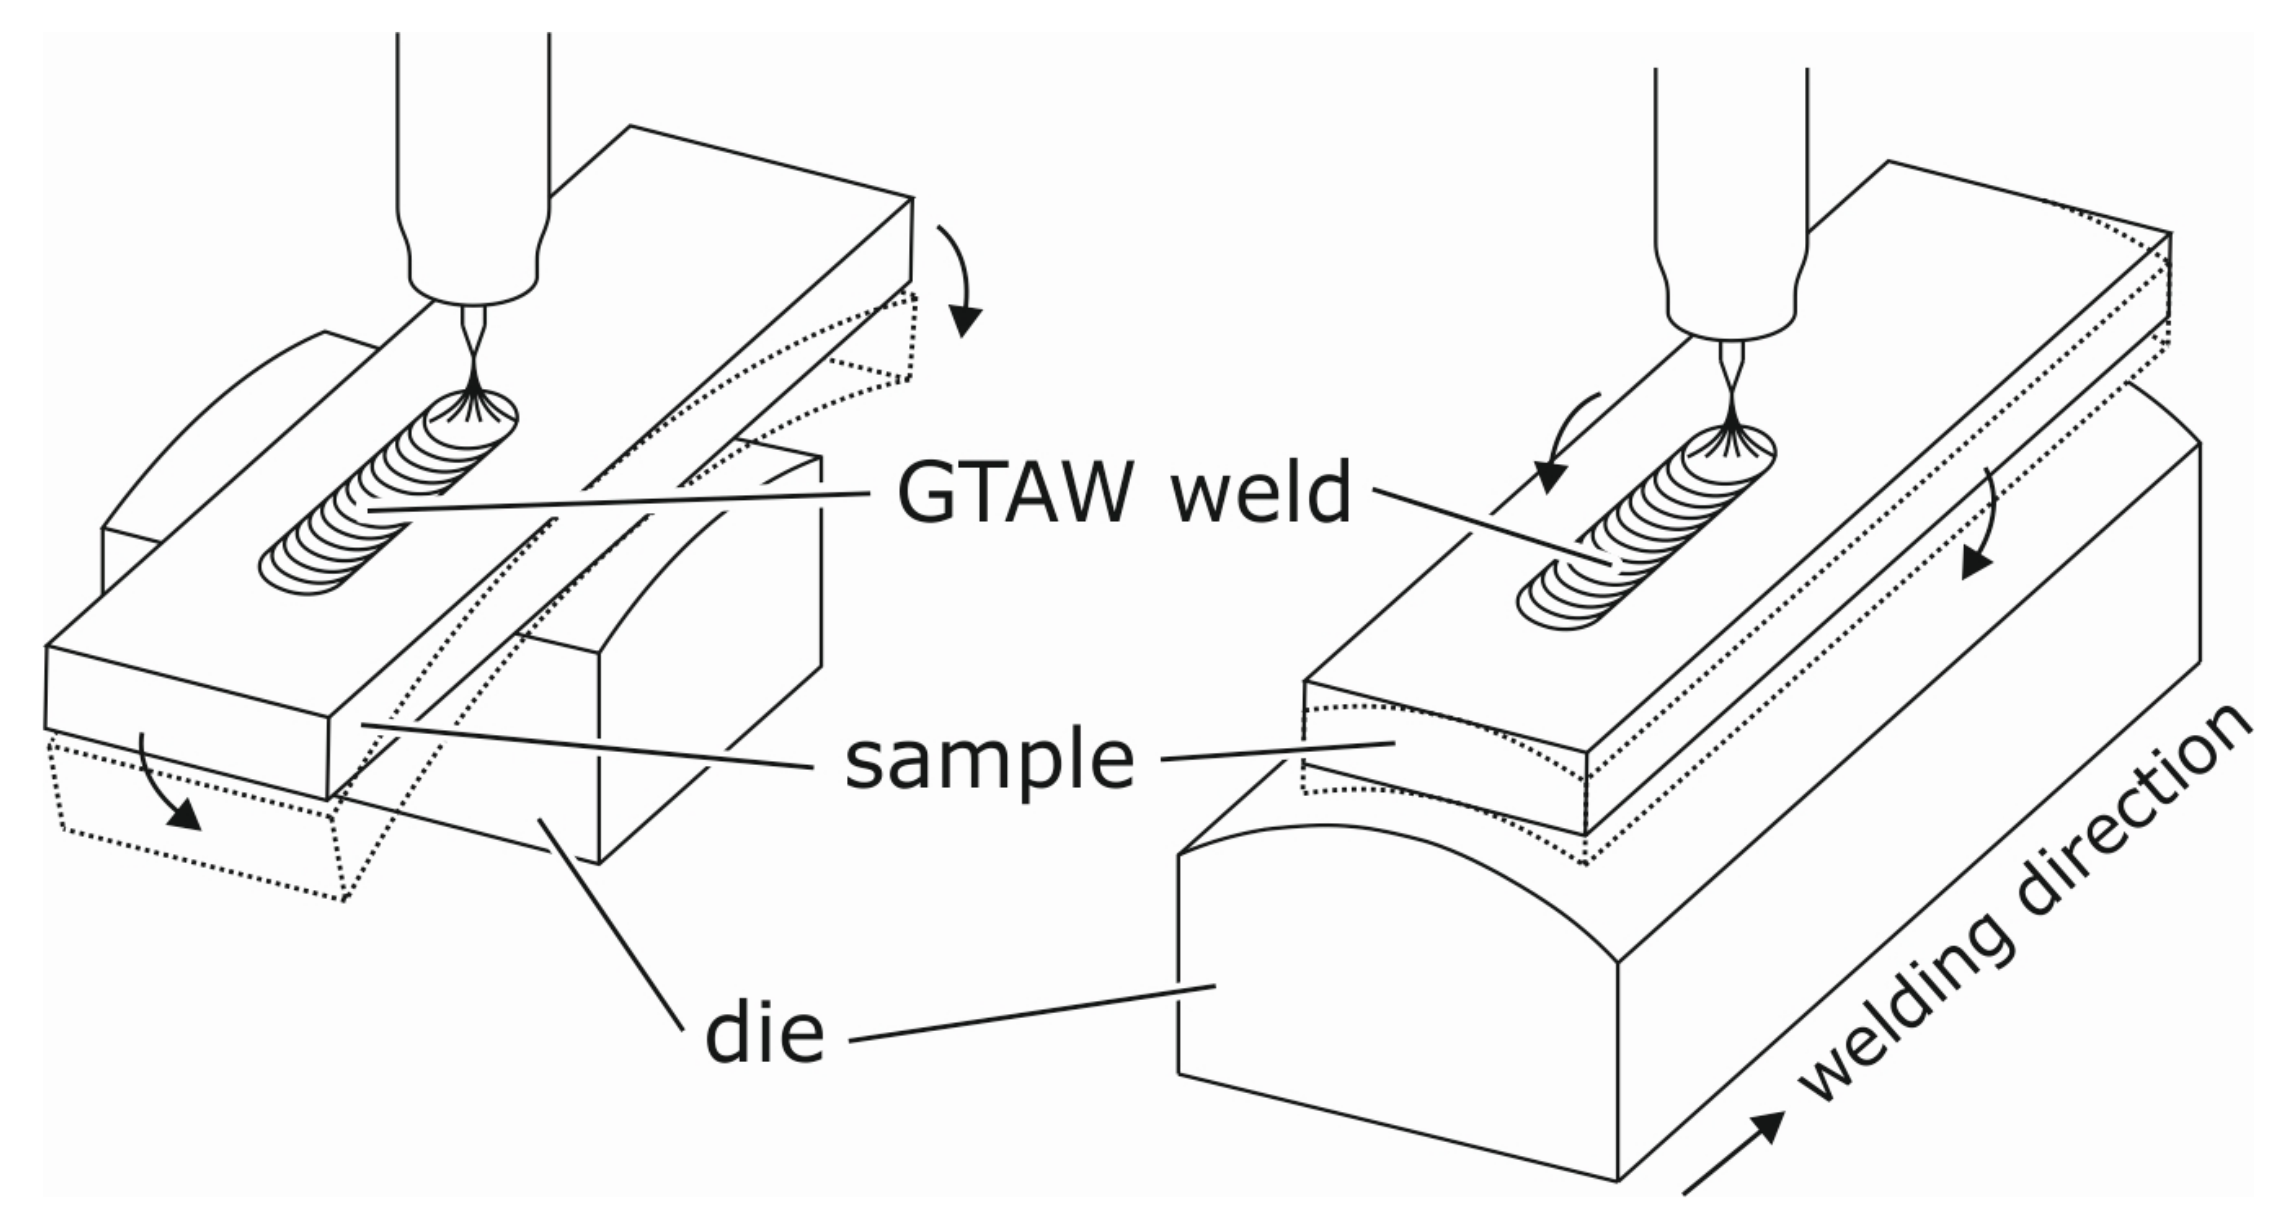
2.2. Modified Varestraint Transvarestraint (MVT) Hot Cracking Test
3. Experimental Method
3.1. Materials and MVT-Testing
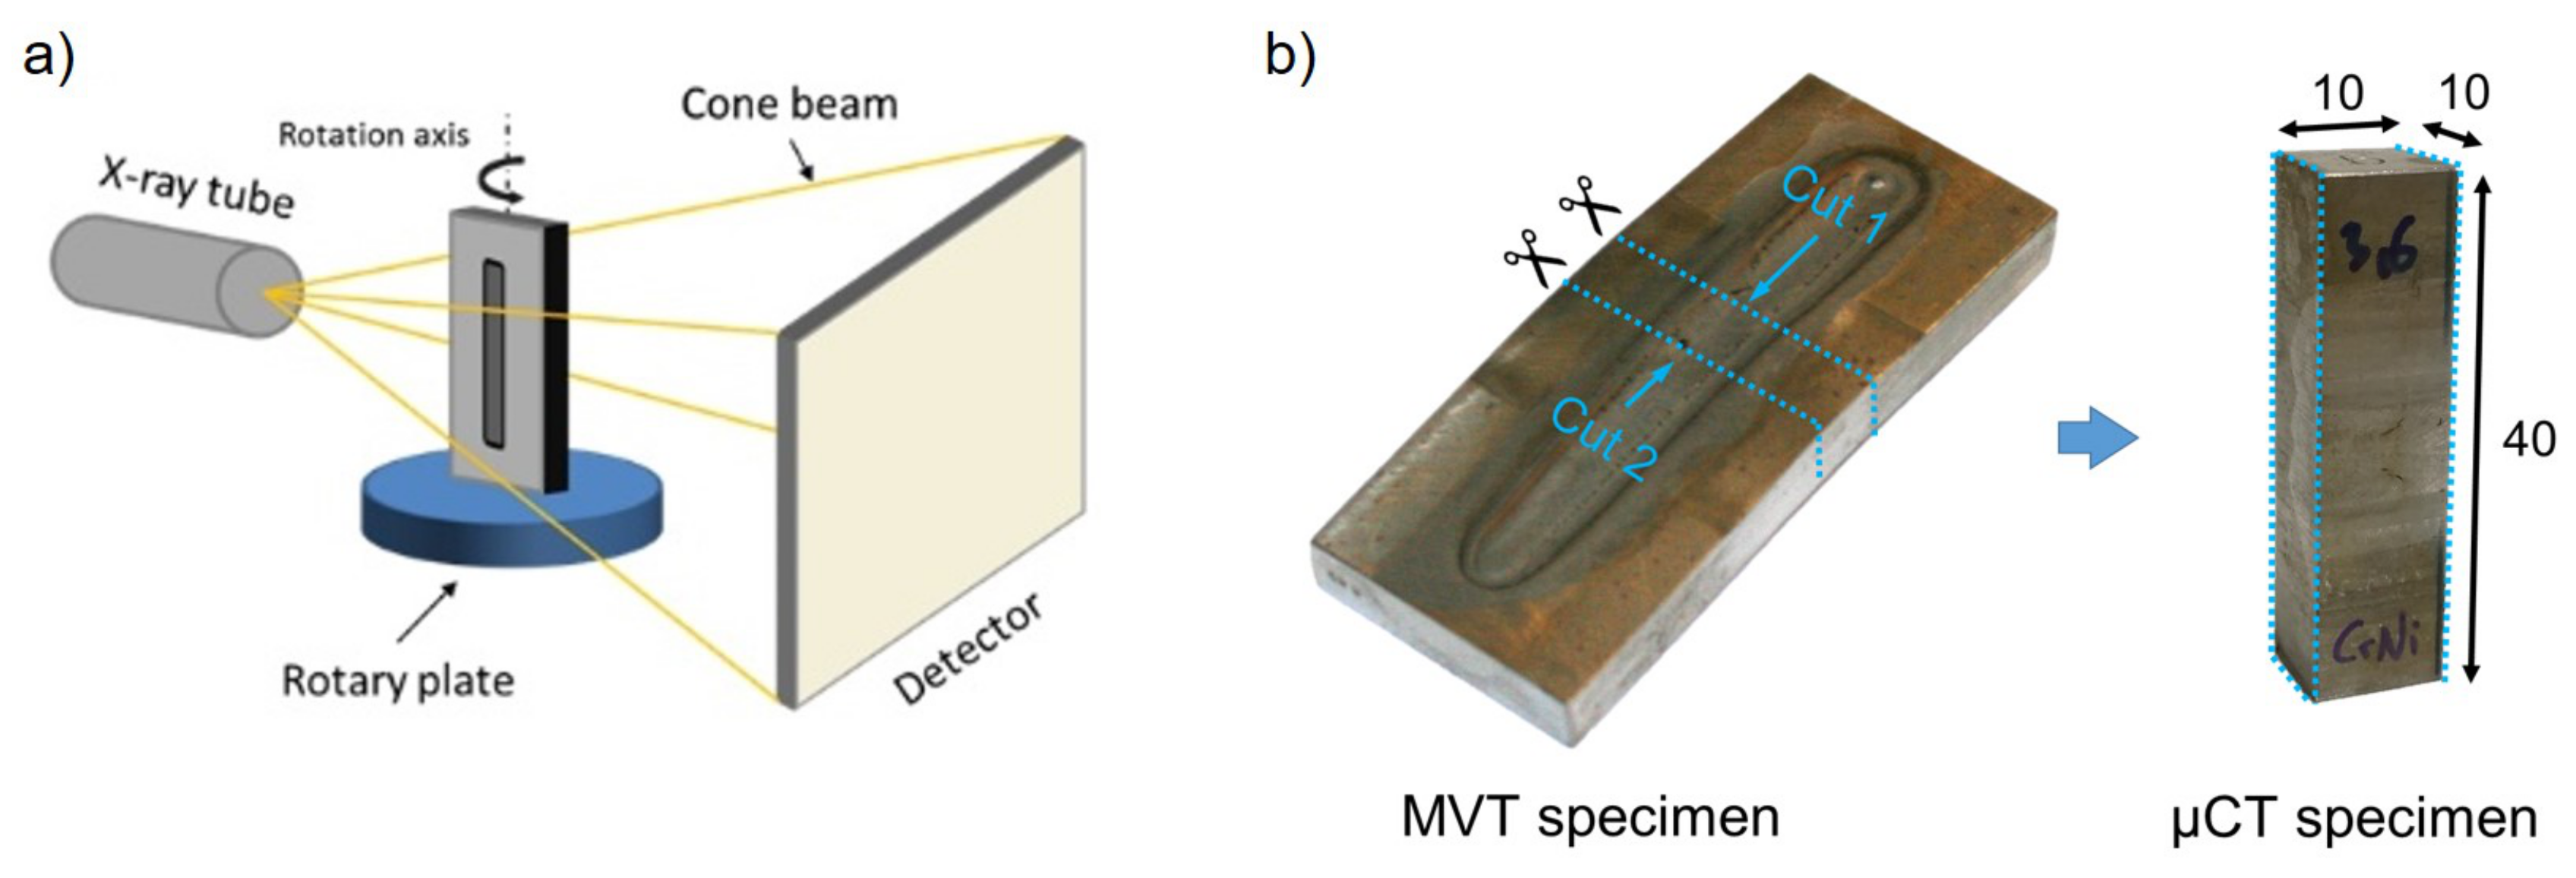
3.2. µCT Analysis
4. Data Analysis and Results
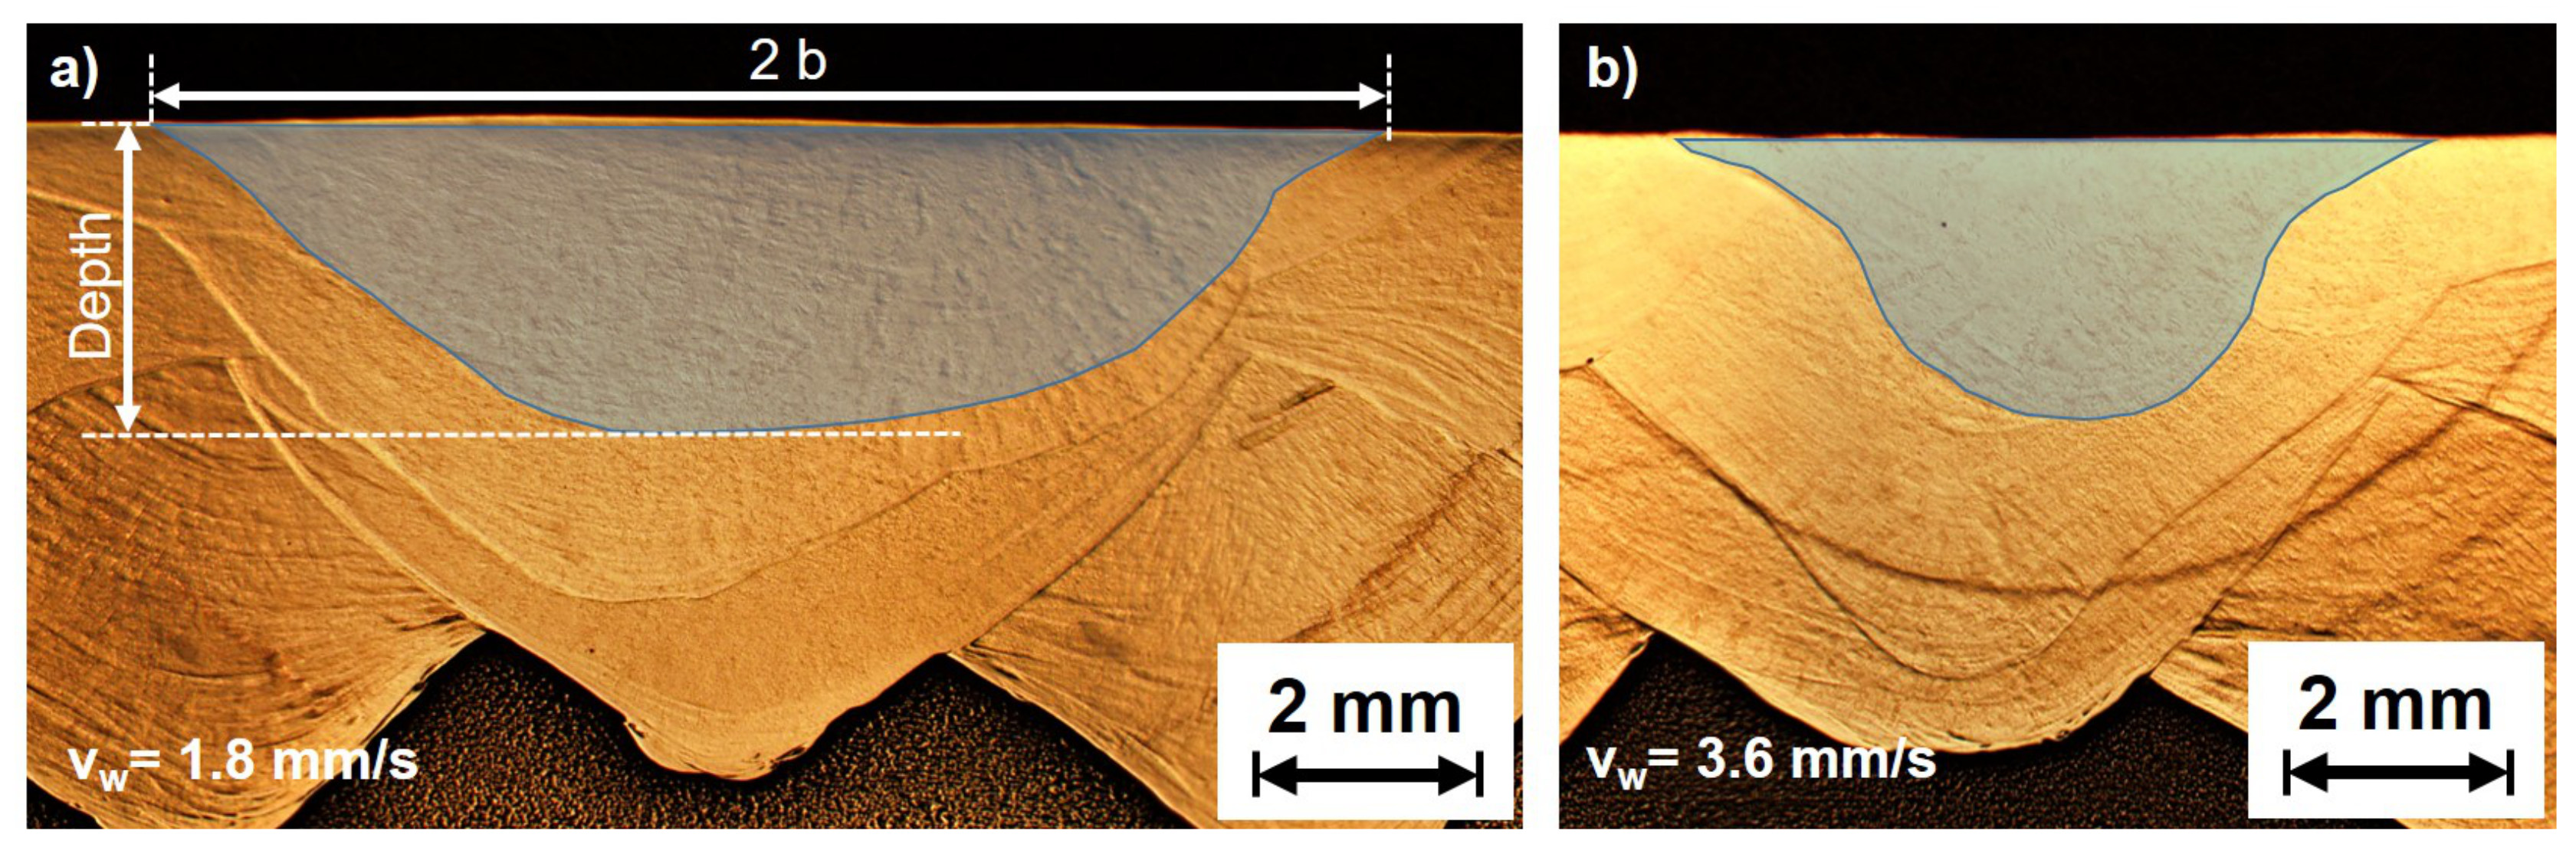
4.1. Weld Pool Reconstruction
4.2. Determination of the Isotherms and
4.3. Application on MVT test
5. Discussion
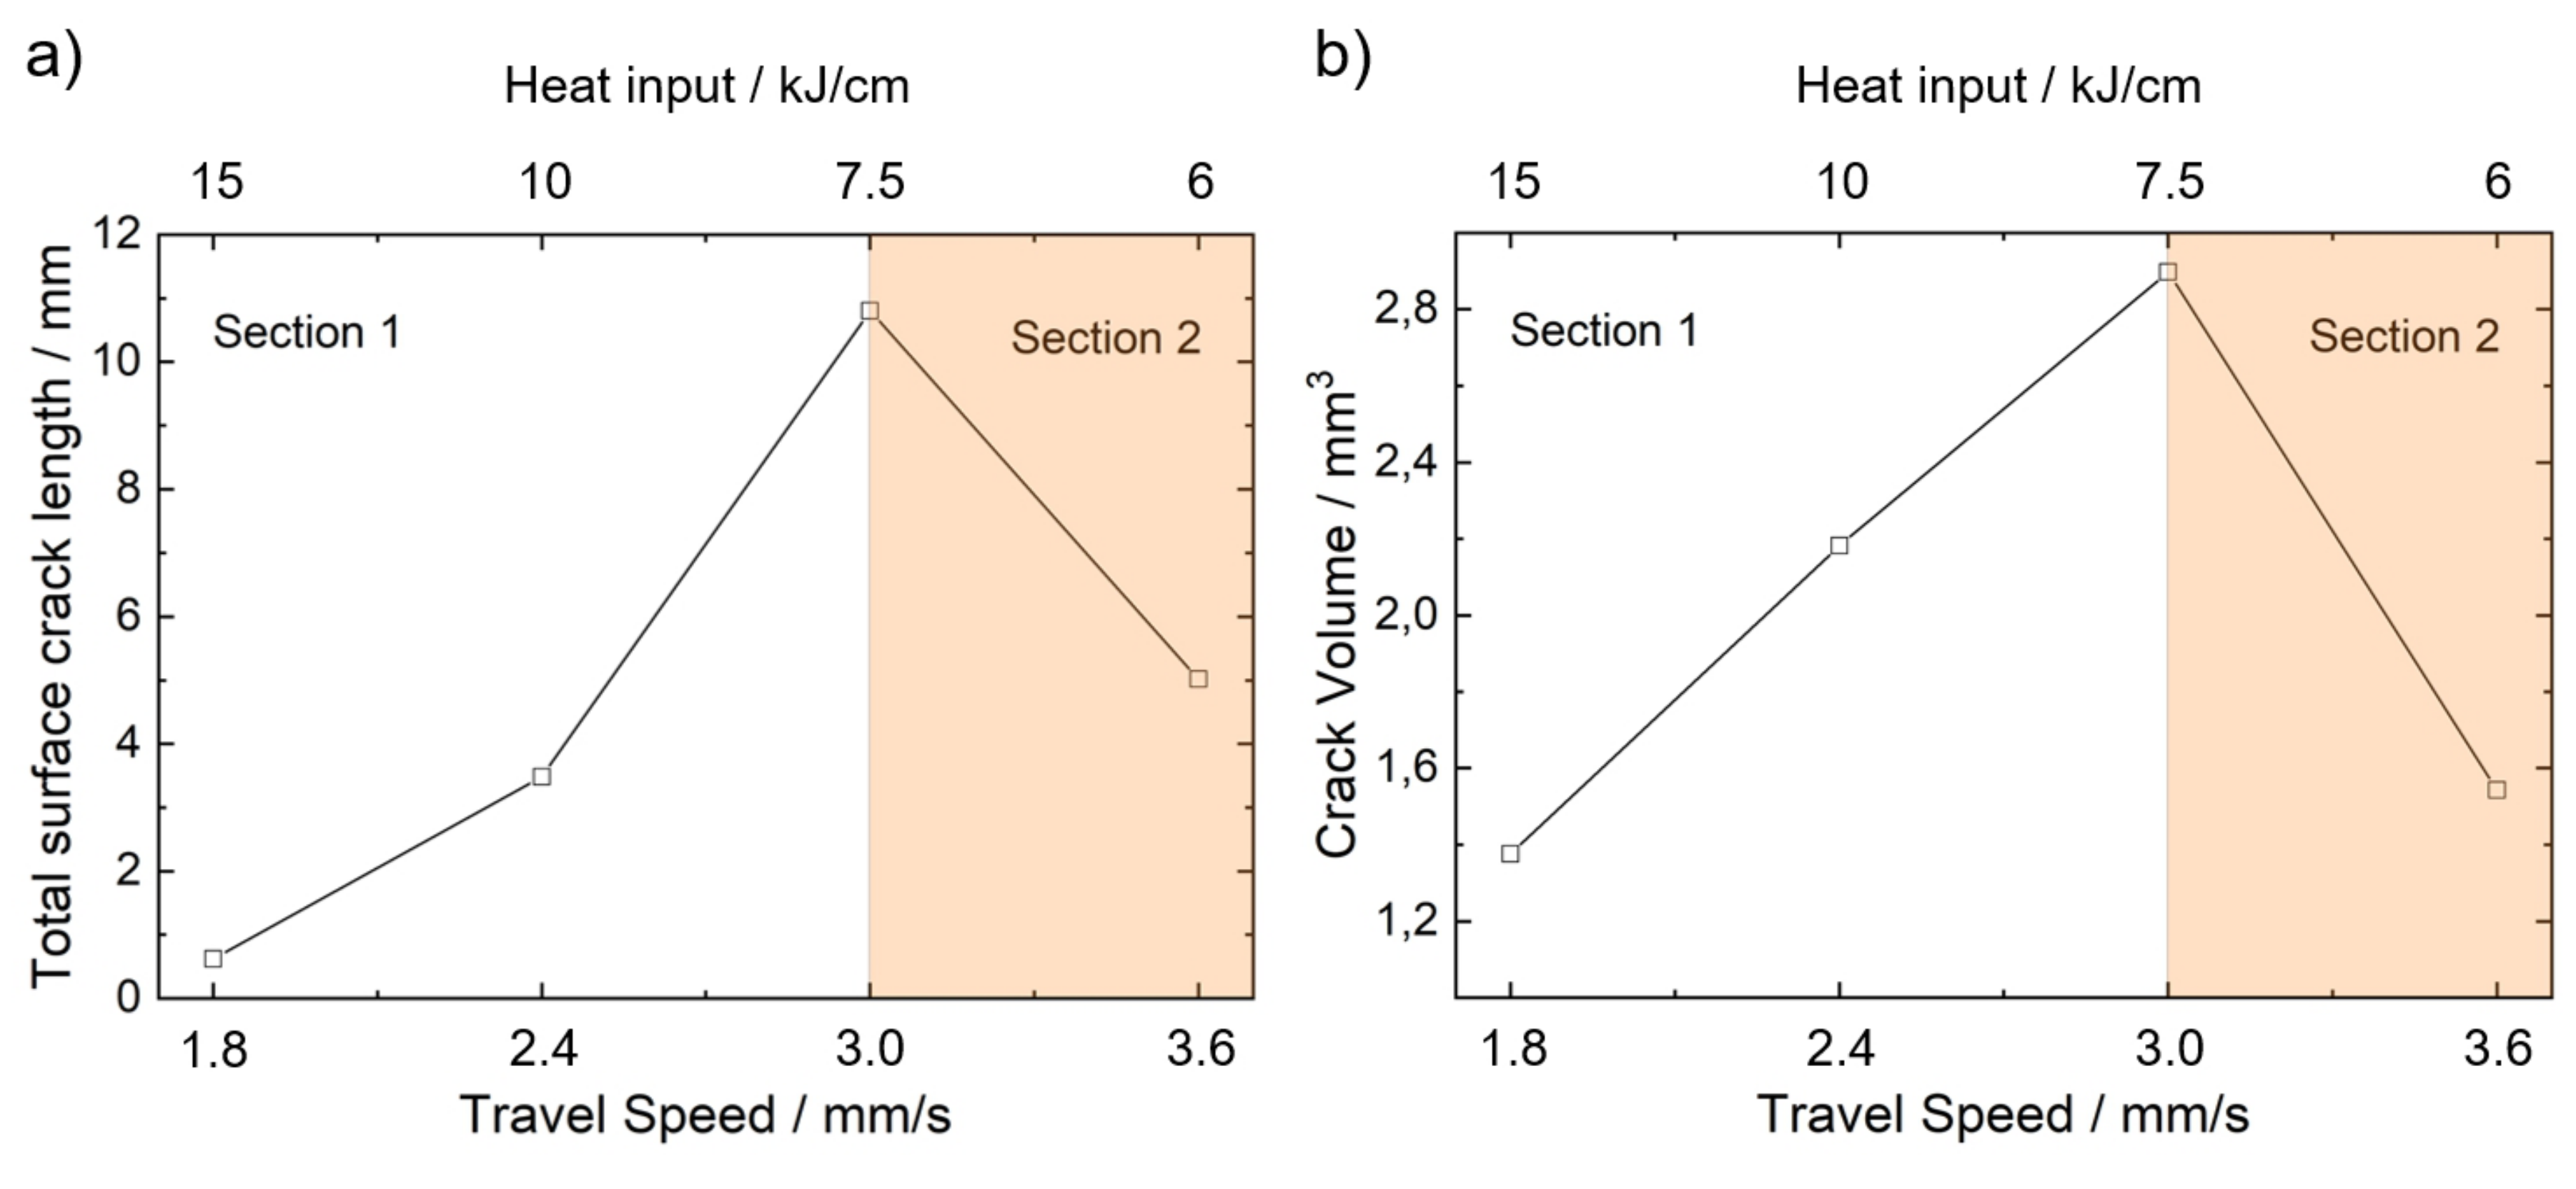
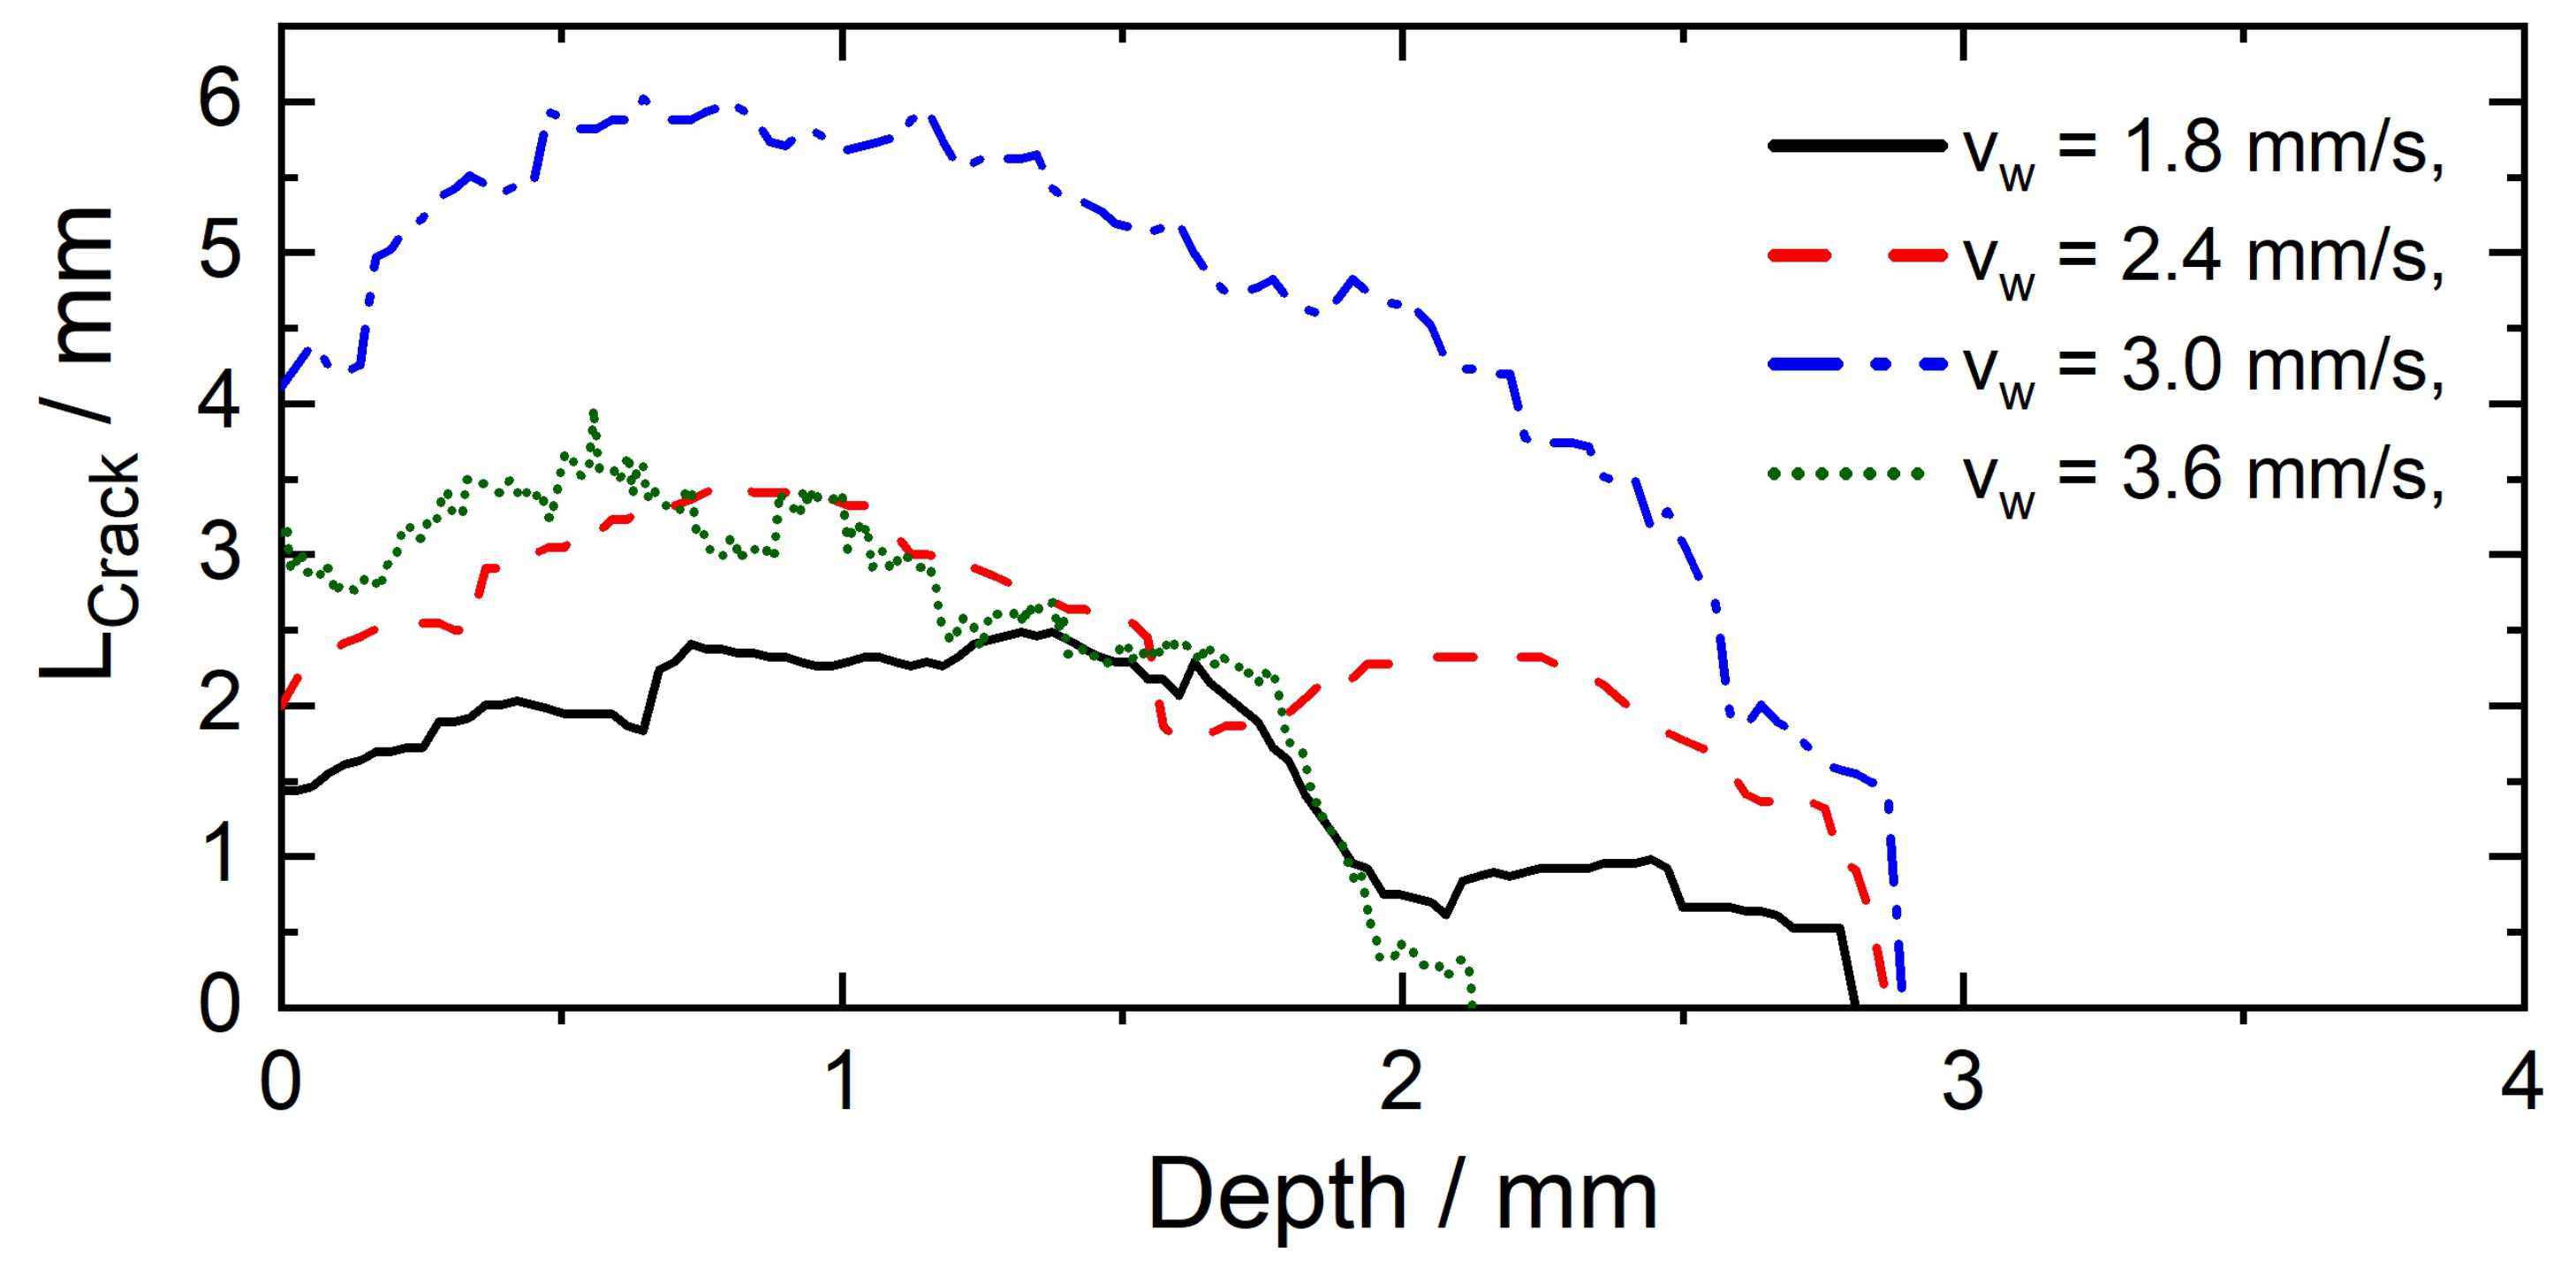
5.1. Crack Length
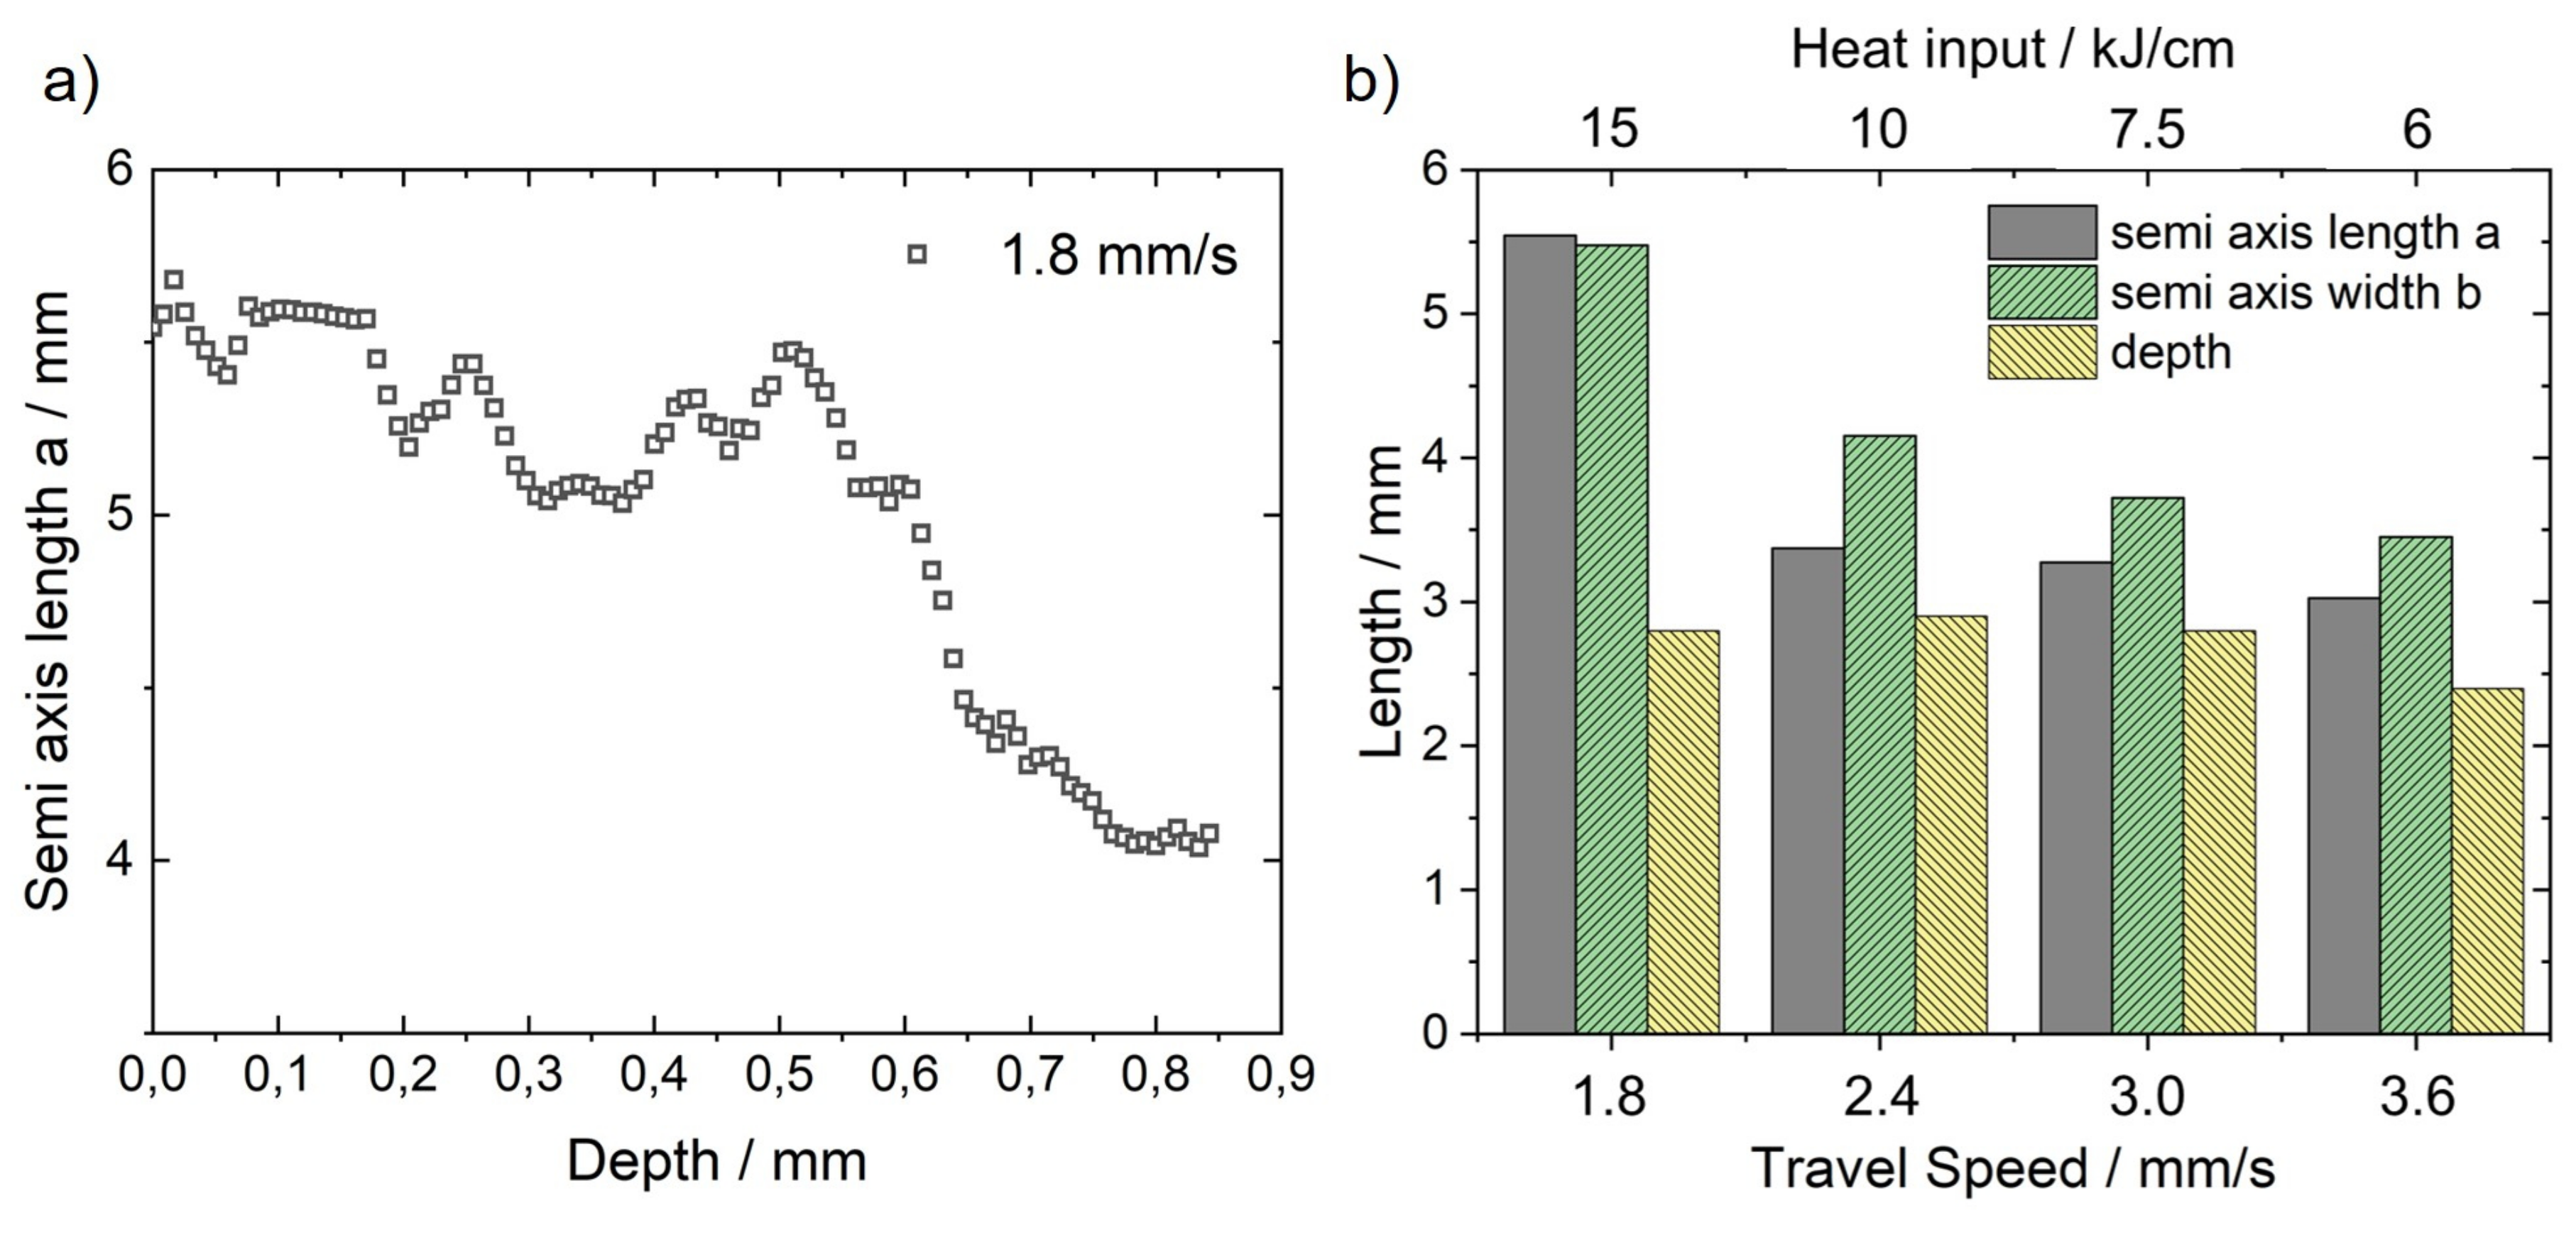
5.2. Crack Depth
5.3. Crack Volume
- Increasing travel speed results in an increasing length because moves during the bending process. Hence, the distance between and increases and longer cracks can arise. However, it seems that the maximum crack length can also be limited by the centreline grain boundary as the loading direction (varestraint) does not favor perpendicular crack formation. If this is the case, further crack growing can no longer occur with increasing travel speed.
- With increasing travel speed the heat input is decreasing. Consequently, because of the lower depth of the temperature field, is limited by .
6. Conclusions
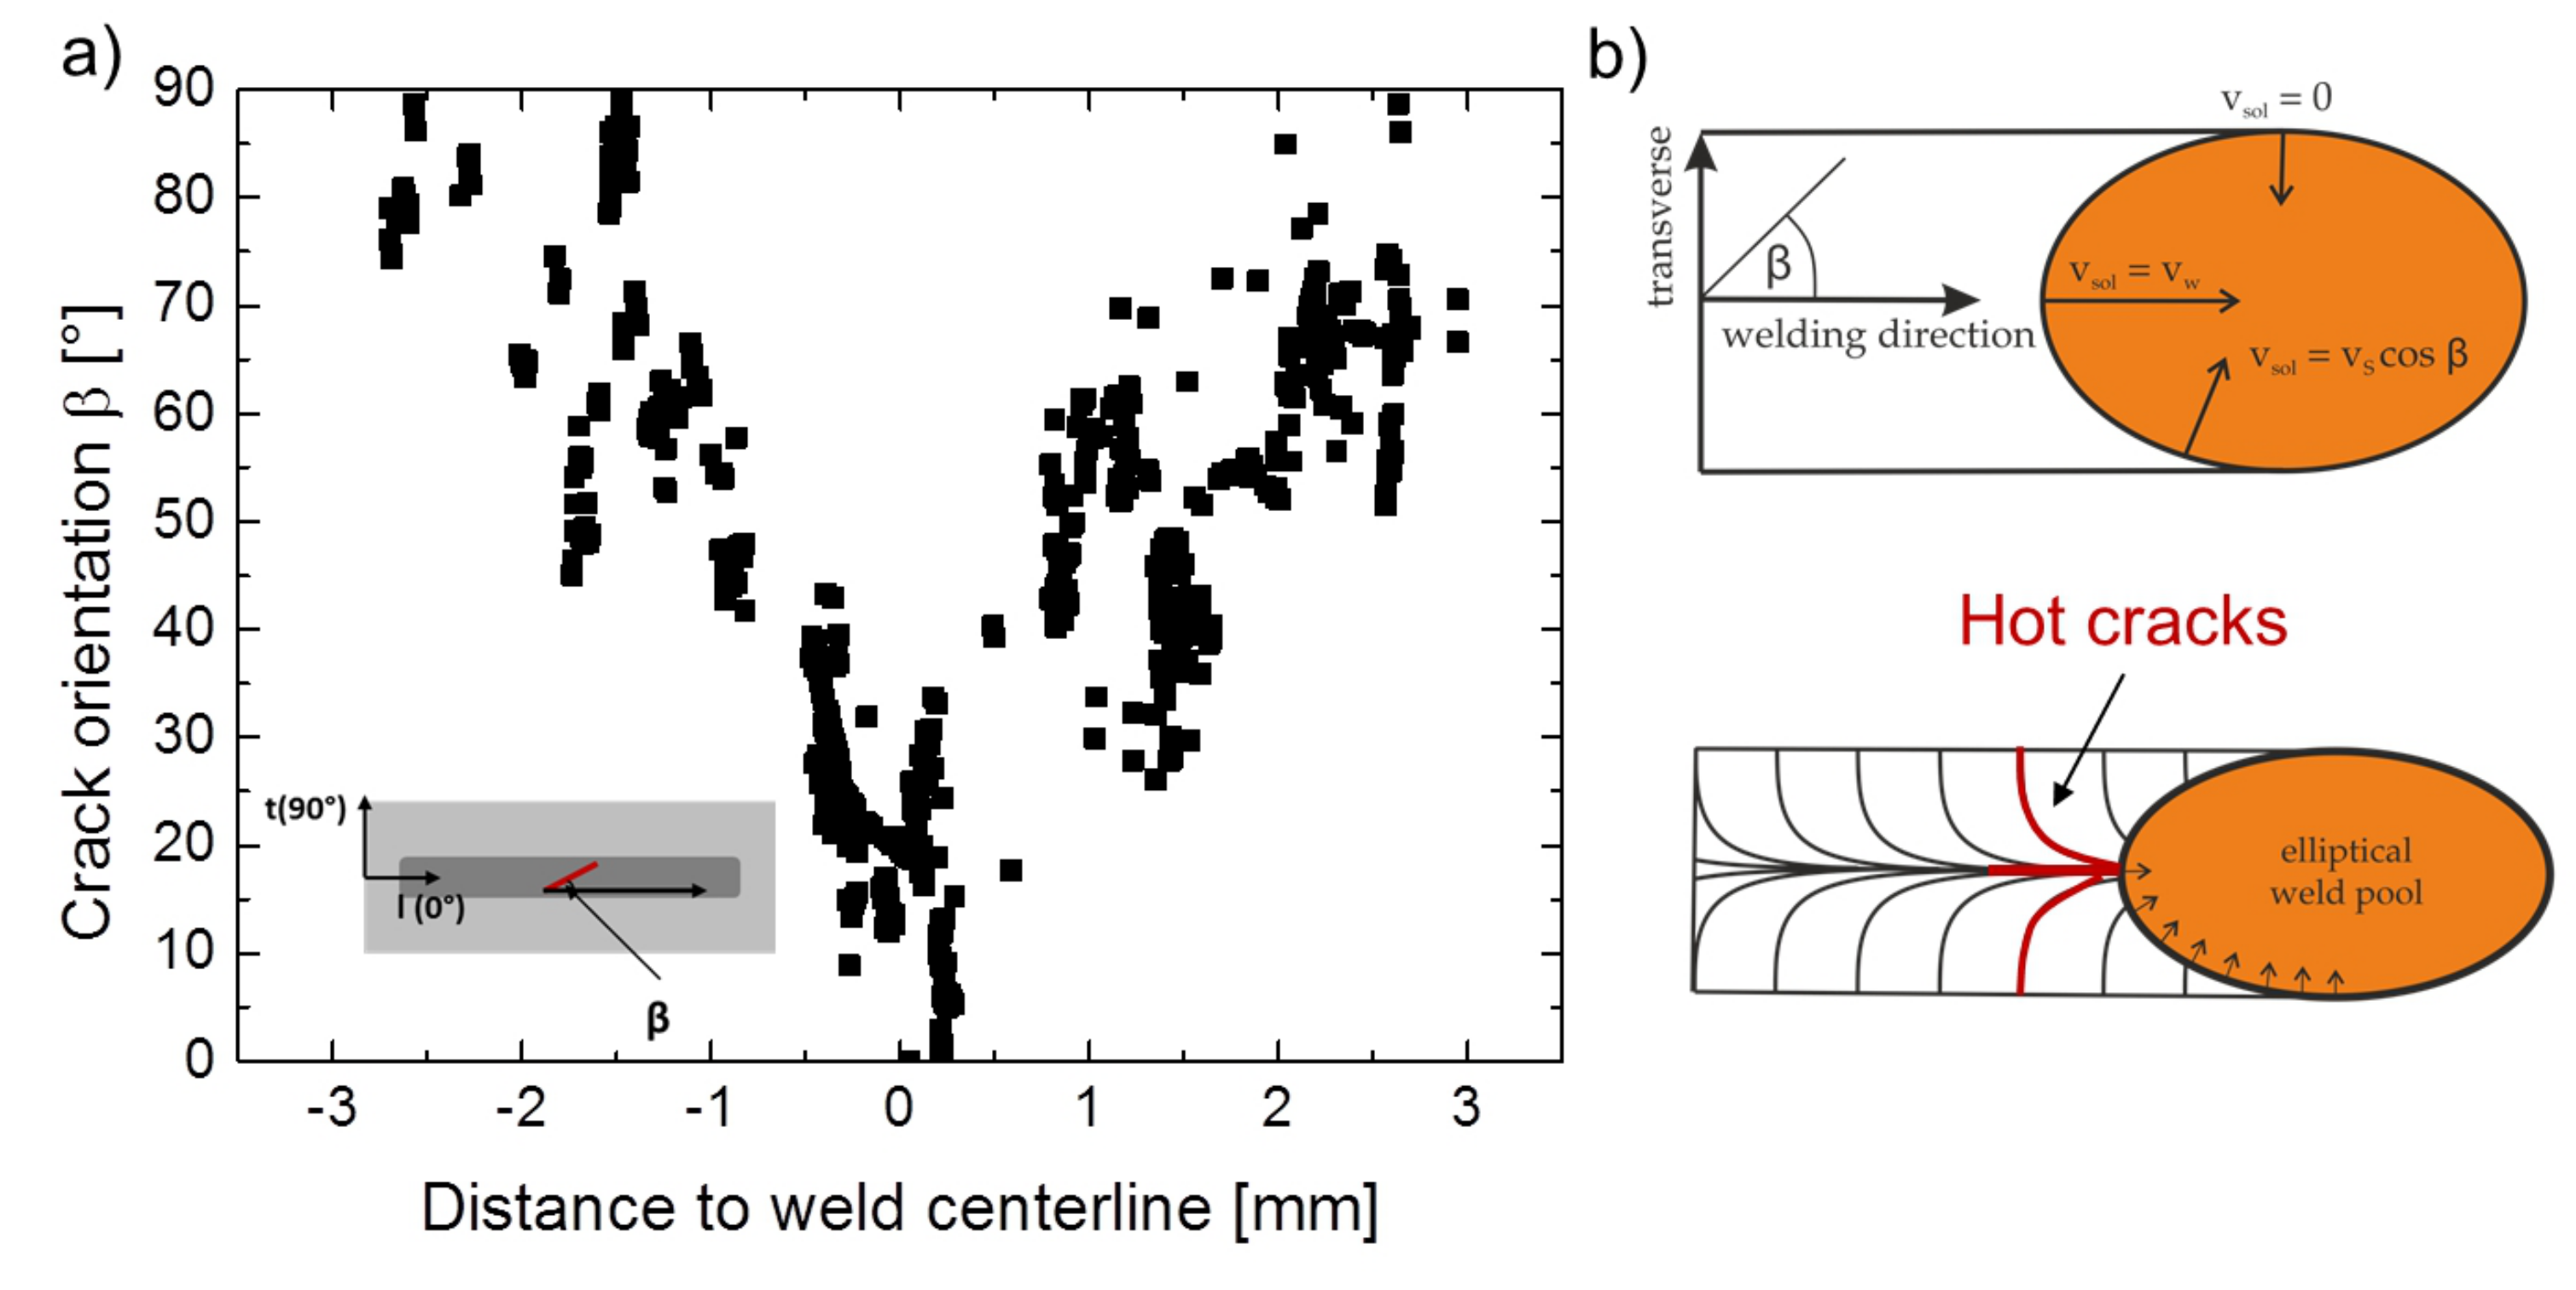
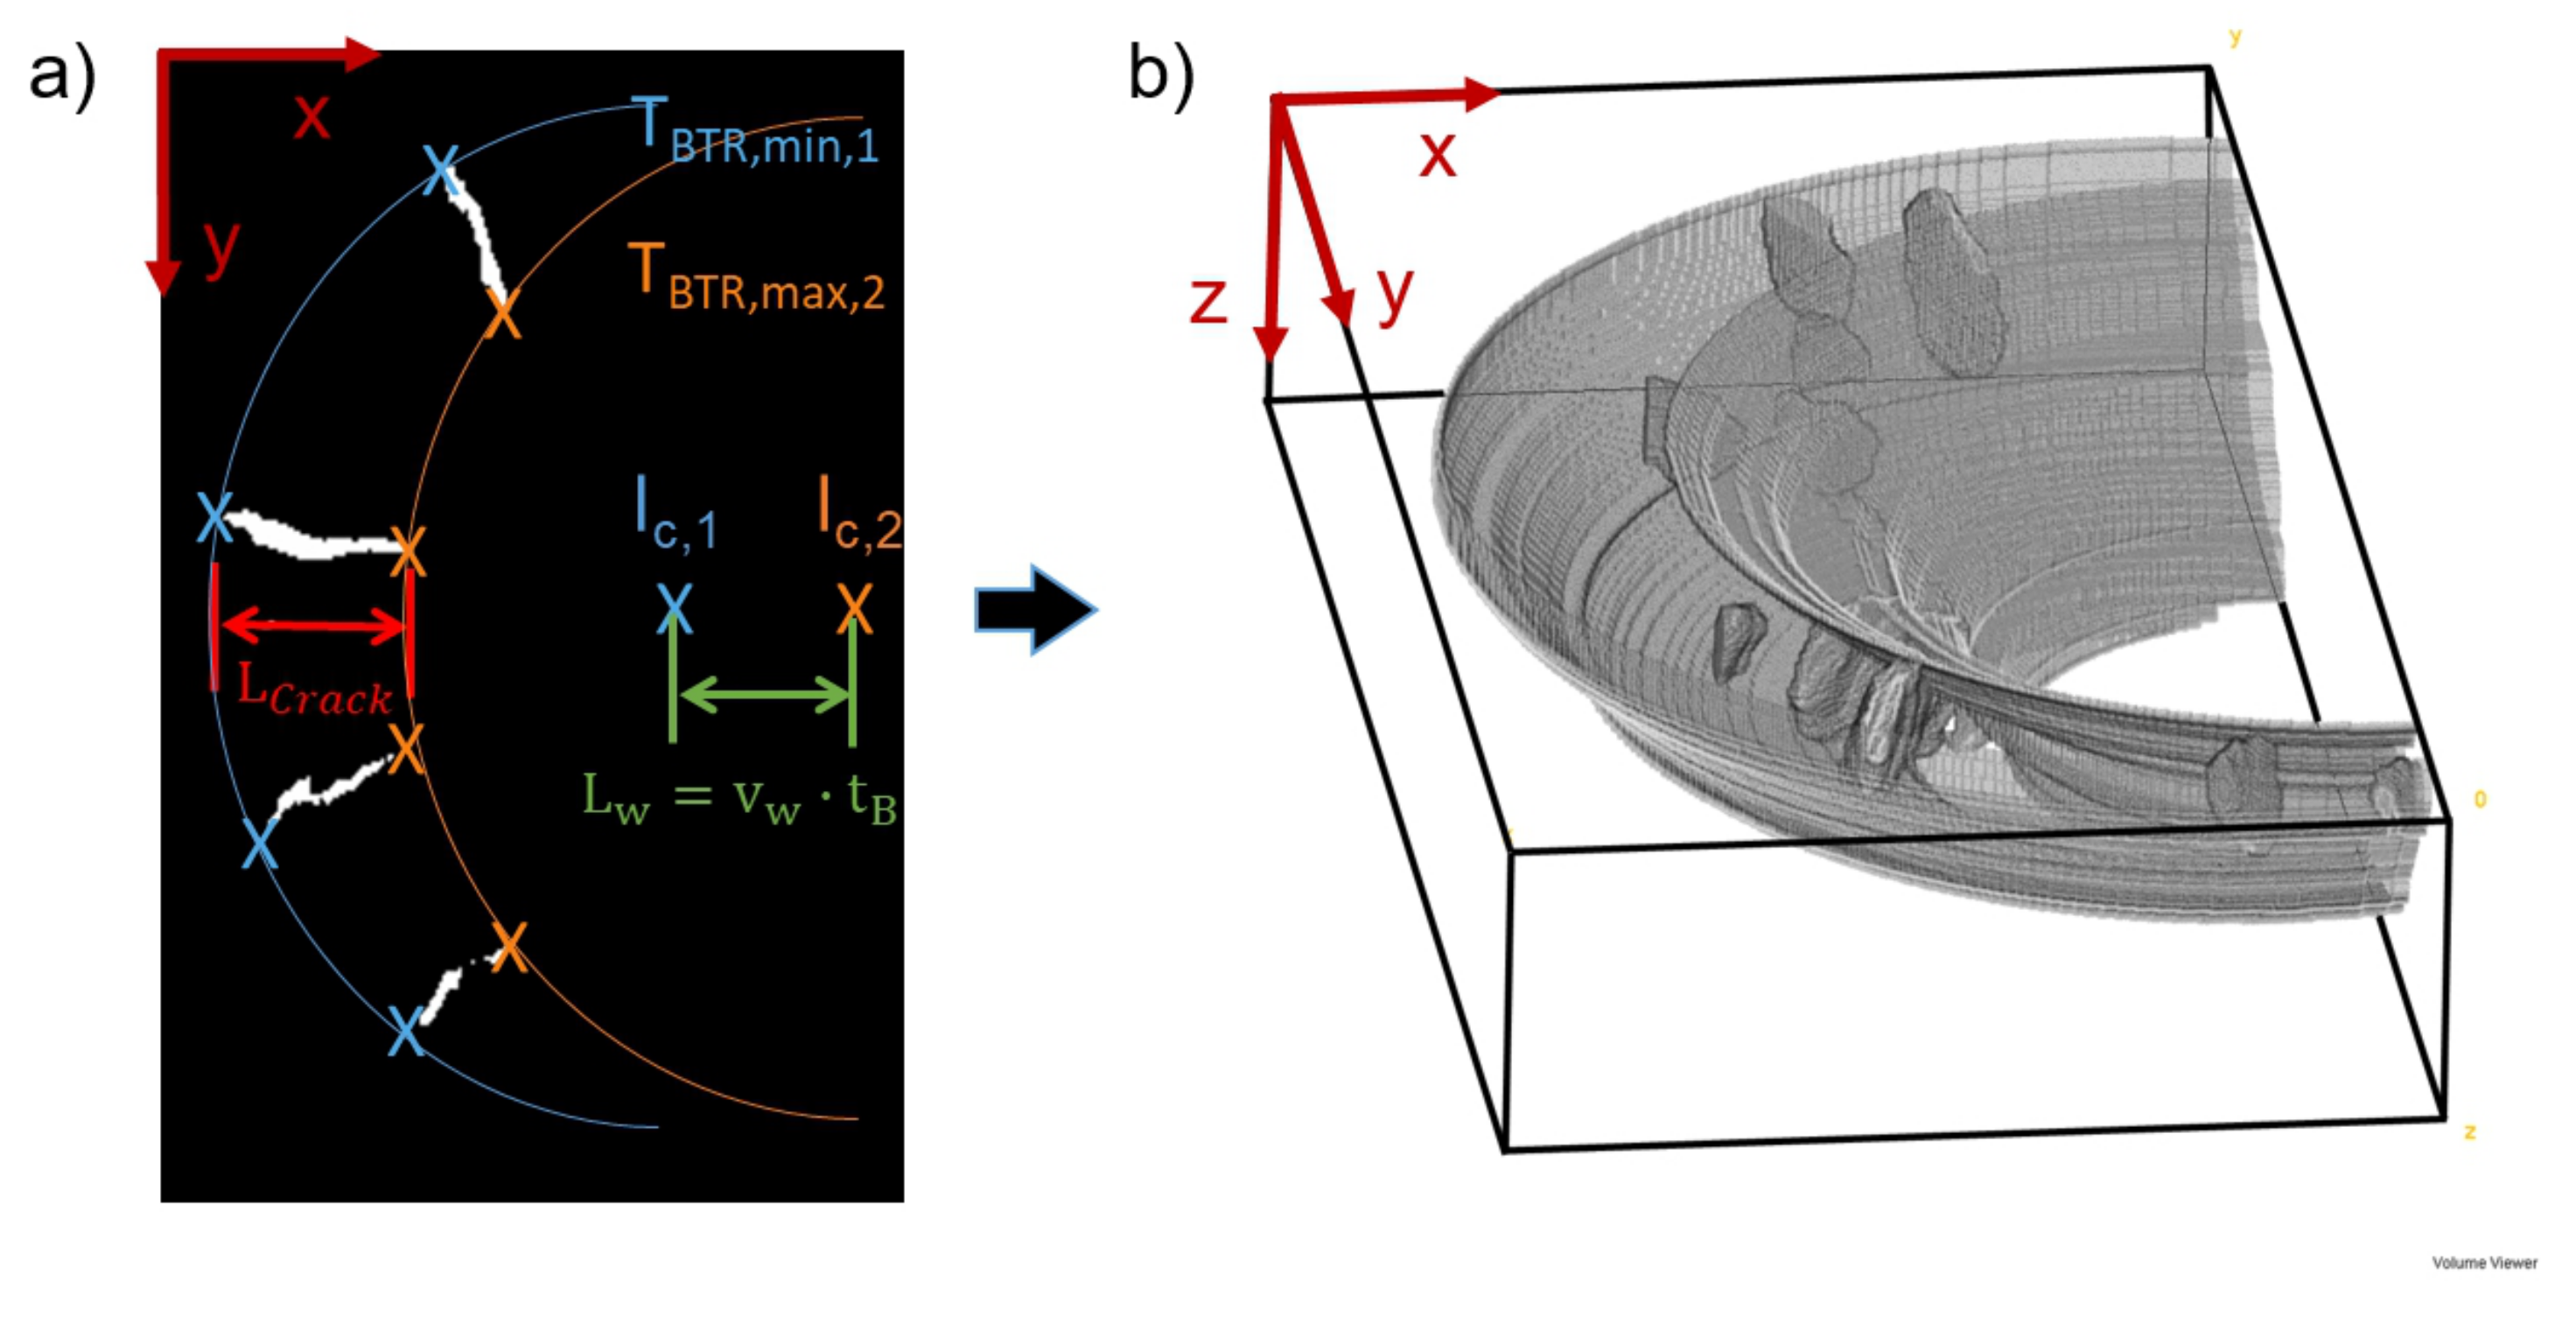
- From the crack orientation determined from the µCT volume information the weld pools can be reconstructed.
- Ellipse fitting of planar sections through the crack network allows for the determination of the isotherms of the maximum temperature and minimum temperature of the Brittleness Temperature Range (BTR) according to the hot cracking model following Prokhorov.
- However, for the ellipse fitting to determine the BTR the movement of the welding torch during bending must be taken into account and its travel speed must be adjusted that the isotherm is certainly the limiting factor for the crack length. If this is not the case, there is a risk that comparing the crack lengths of different weld filler materials leads to erroneous rankings with regard to their hot crack susceptibility.
- Using this new approach, the distance between the isotherms and can be used as a measure for the extent of the BTR, which reflects a new experimental accessible MVT parameter according to the Prokhorov model.
- An additional parameter obtained from the µCT analysis is the maximum crack depth , which can represent a substitute value for the minimum critical strain .
- In this regard, it is important to ensure a sufficiently high heat input and a not too high bending strain that is certainly the limiting factor for . In practice, this could be ensured by a that is smaller than the weld pool depth.
Author Contributions
Funding
Acknowledgments
Conflicts of Interest
References
- Ohta, A.; Suzuki, N.; Maeda, Y. Effective means for improving the fatigue strength of welded structures. Weld World 1996, 37, 84–89. [Google Scholar]
- Kromm, A.; Dixneit, J.; Kannengiesser, T. Residual stress engineering by low transformation temperature alloys-state of the art and recent developments. Weld World 2014, 58, 729–741. [Google Scholar] [CrossRef]
- Chen, X.; Wang, P.; Pan, Q.; Lin, S. The Effect of Martensitic Phase Transformation Dilation on Microstructure, Strain–Stress and Mechanical Properties for Welding of High-Strength Steel. Crystals 2018, 8, 293. [Google Scholar] [CrossRef] [Green Version]
- Di, X.; Geng, D.; Wu, S.; Wang, D.; Zhang, Z.; Li, C. Solidification behaviour and microstructure of welding transition zone using low-transformation-temperature welding consumables. Sci. Technol. Weld. Join. 2019, 24, 148–155. [Google Scholar] [CrossRef]
- Wu, S.; Wang, D.; Zhang, Z.; Li, C.; Liu, X.; Meng, X.; Di, X. Mechanical properties of low-transformation-temperature weld metals after low-temperature postweld heat treatment. Sci. Technol. Weld. Join. 2019, 24, 112–120. [Google Scholar] [CrossRef]
- Harati, E.; Karlsson, L.; Svensson, L.E.; Pirling, T.; Dalaei, K. Neutron Diffraction Evaluation of Near Surface Residual Stresses at Welds in 1300 MPa Yield Strength Steel. Materials 2017, 10, 593. [Google Scholar] [CrossRef] [Green Version]
- Dixneit, J.; Kromm, A.; Hannemann, A.; Friedersdorf, P.; Kannengießer, T.; Gibmeier, J. In-situ load analysis in multi-run welding using LTT filler materials. Weld World 2016, 60, 1159–1168. [Google Scholar] [CrossRef]
- Dai, H.; Francis, J.A.; Stone, H.J.; Bhadeshia, H.K.D.H.; Withers, P.J. Characterizing Phase Transformations and Their Effects on Ferritic Weld Residual Stresses with X-Rays and Neutrons. Metall. Mater. Trans. A 2008, 39A, 3070–3078. [Google Scholar] [CrossRef]
- Ohta, A.; Suzuki, N.; Maeda, Y.; Hiraoka, K.; Nakamura, T. Superior fatigue crack growth properties in newly developed weld metal. Int. J. Fatigue 1999, 21, S113–S118. [Google Scholar] [CrossRef]
- Shiga, C.; Murakawa, H.; Hiraoka, K.; Osawa, N.; Yajima, H.; Tanino, T.; Matsuzaki, T. Elongated bead weld method for improvement of fatigue properties in welded joints of ship hull structures using low transformation temperature welding materials. Weld World 2017, 61, 769–788. [Google Scholar] [CrossRef]
- Harati, E.; Svensson, L.E.; Karlsson, L. Improving fatigue strength of welded 1300 MPa yield strength steel using HFMI treatment or LTT fillers. Eng. Fail. Anal. 2017, 79, 64–74. [Google Scholar] [CrossRef]
- Ooi, S.W.; Garnham, J.E.; Ramjaun, T.I. Review: Low transformation temperature weld filler for tensile residual stress reduction. Mater. Des. 2014, 56, 773–781. [Google Scholar] [CrossRef]
- Wu, S.P.; Wang, D.P.; Di, X.J. Toughening mechanisms of low transformation temperature deposited metals with martensite-austenite dual phases. J. Mater. Sci. 2018, 53, 3720–3734. [Google Scholar] [CrossRef]
- Feng, Z.Y.; Di, X.J.; Wu, S.P.; Zhang, Z.; Liu, X.Q.; Wang, D.P. Comparison of two types of low-transformation-temperature weld metals based on solidification mode. Sci. Technol. Weld. Join. 2018, 23, 241–248. [Google Scholar] [CrossRef]
- Wang, H.; Woo, W.; Kim, D.K.; Em, V.; Lee, S.Y. Effect of chemical dilution and the number of weld layers on residual stresses in a multi-pass low-transformation-temperature weld. Mater. Des. 2018, 160, 384–394. [Google Scholar] [CrossRef]
- Novotný, L.; de Abreu, H.F.G.; de Miranda, H.C.; Béreš, M. Simulations in multipass welds using low transformation temperature filler material. Sci Technol. Weld. Join. 2016, 21, 680–687. [Google Scholar] [CrossRef]
- Dixneit, J.; Kromm, A.; Boin, M.; Wimpory, R.C.; Kannengiesser, T.; Gibmeier, J.; Schroepfer, D. Residual stresses of LTT welds in large-scale components. Weld World 2017, 61, 1089–1097. [Google Scholar] [CrossRef]
- Jiang, W.; Chen, W.; Woo, W.; Tu, S.T.; Zhang, X.C.; Em, V. Effects of low-temperature transformation and transformation-induced plasticity on weld residual stresses: Numerical study and neutron diffraction measurement. Mater. Des. 2018, 147, 65–79. [Google Scholar] [CrossRef]
- Moat, R.J.; Ooi, S.; Shirzadi, A.A.; Dai, H.; Mark, A.F.; Bhadeshia, H.K.D.H.; Withers, P.J. Residual stress control of multipass welds using low transformation temperature fillers. Mater. Sci. Tech. 2018, 34, 519–528. [Google Scholar] [CrossRef]
- Dixneit, J.; Vollert, F.; Kromm, A.; Gibmeier, J.; Hannemann, A.; Fischer, T.; Kannengiesser, T. In situ analysis of the strain evolution during welding using low transformation temperature filler materials. Sci. Technol. Weld. Join. 2019, 24, 243–255. [Google Scholar] [CrossRef] [Green Version]
- Vollert, F.; Dixneit, J.; Gibmeier, J.; Kromm, A.; Buslaps, T.; Kannengiesser, T. In situ EDXRD study of MAG-Welding using LTT weld filler materials under structural restraint. Mat. Sci. Forum. 2017, 905, 107–113. [Google Scholar] [CrossRef]
- Vollert, F.; Gibmeier, J.; Rebelo-Kornmeier, J.; Dixneit, J.; Pirling, T. Two-dimensional residual stress mapping of multilayer LTT weld joints using the contour method. Mater. Perform. Charact. 2018, 7, 545–558. [Google Scholar] [CrossRef]
- Thomas, M.; Vollert, F.; Weidemann, J. Surface- and volume-based investigation on influences of different varestraint testing parameters and chemical compositions on solidification cracking in LTT filler metals. Weld World 2020, 64, 913–923. [Google Scholar] [CrossRef] [Green Version]
- Hemsworth, B.; Boniszewski, T.; Eaton, N.F. Classification and definition of high-temperature welding cracks in alloys. Met. Constr. 1969, 1, 5–16. [Google Scholar]
- Cross, C.E. On the Origin of Weld Solidification Cracking. In Hot Cracking Phenomena in Welds; Boellinghaus, T., Herold, H., Eds.; Springer: Berlin/Heidelberg, Germany, 2005; pp. 3–18. [Google Scholar]
- Rappaz, M.; Drezet, J.M.; Gremaud, M. A new hot-tearing criterion. Metall. Mater. Trans. A 1999, 30, 449–455. [Google Scholar] [CrossRef]
- Ni-s binary phase diagram 0–55 at.% S. Available online: https://materials.springer.com/isp/phase-diagram/docs/c_0905346 (accessed on 23 April 2020).
- Hammar, O.; Svensson, U. Solidification and casting of metals. London Met. Soc. 1979, 3, 401–410. [Google Scholar]
- Lippold, J.C. Centreline cracking in deep penetration electron beam welding in type 304L stainless steel. London Weld. Res. Suppl. 1985, 64, 127–136. [Google Scholar]
- Kurz, W.; Fisher, D.J. Fundamentals of Solidification; Trans Tech Publications: Zurich, Switzerland, 1986. [Google Scholar]
- Hammar, O.; Svensson, U. Hot Cracking. In London: Welding Metallurgy and Weldability; Wiley: Hoboken, NJ, USA, 2015; pp. 84–129. [Google Scholar]
- Feurer, U. Influence of alloy composition and solidification conditions on dendrite arm spacing, feeding and hot tearing properties of aluminium alloys. Qual. Control Eng. Alloys Role Met. Sci. Proc. Int. Symp. 1977, 131–145. [Google Scholar]
- Prokhorov, N.N. The technological strength of metals while crystallising. Weld. Prod. 1962, 4, 1–8. [Google Scholar]
- Prokhorov, N.N.; Jakuschin, B.F.; Prokhorov, N.N. Theorie und Verfahren zum Bestimmen der technologischen Festigkeit von Metallen während des Kristallisationsprozesses beim Schweißen. Schweißtechnik 1968, 18, 8–11. [Google Scholar]
- DIN EN ISO 17641: Destructive Tests Onwelds in Metallic Materials-Hot Cracking Tests for Weldments, Part 1–3—arc Welding Processes. Technical Report. 2005. Available online: https://www.iso.org/standard/39624.html (accessed on 15 June 2020).
- Kannengiesser, T.; Boellinghaus, T. Hot cracking tests-an overview of present technologies and applications. Weld World 2014, 58, 397–421. [Google Scholar] [CrossRef]
- Vollert, F.; Thomas, M.; Kromm, A.; Gibmeier, J. Hot crack assessment of LTT welds using µCT. e-J. Nondestr. Test. 2020, 25. [Google Scholar]
- Raza, T.; Andersson, J.; Svensson, L.-E. Varestraint Testing of Selective Laser Additive Manufactured Alloy 718—Influence of Grain Orientation. Metals 2019, 9, 1113. [Google Scholar] [CrossRef] [Green Version]
- Homberg, G.; Schmidtmann, E. Einfluss der Schweissparameter und der Zusammensetzung von Schweisszusatzwerkstoffen auf die Heissrissneigung im Schweissgut Austenitischer Stähle. EU Publications, Institut für Eisenhüttenkunde: Aachen, Germany, 1979; Volume 25. [Google Scholar]
- Goodwin, G. The effects of heat input and weld process on hot cracking in stainless steel. Weld J. 1988, 67, 88–94. [Google Scholar]
- Ota, A.; Shiga, C.; Maeda, Y.; Suzuki, N.; Watanabe, O.; Kubo, T.; Nishijima, S. Fatigue strength improvement by using newly developed low transformation temperature welding material. Weld World 1999, 43, 38–42. [Google Scholar]
- Bradley, D.; Roth, G. Adaptive thresholding using the integral image. J. Graph. Tools 2007, 12, 13–21. [Google Scholar] [CrossRef]
- Beucher, S.; Lantuejoul, C. Use of watersheds in contour detection. In International Workshop on Image Processing: Real-Time Edge and Motion Detection; CCETT: Rennes, France, 1979. [Google Scholar]
- Vollert, F.; Dixneit, J.; Gibmeier, J. Effect of residual stress relaxation due to sample extraction on the detectability of hot crack networks in LTT welds by means of µCT. In Proceedings of the 9th International Conference on mechanical Stress Evaluation by Neutron and Synchrotron Radiation (MECASENS), Skukuza Rest Camp, Kruger National Park, South Africa, 19–21 September 2017. [Google Scholar]
- Kannengiesser, T.; Rethmeier, M.; Portella, P.D.; Ewert, U.; Redmer, B. Assessment of hot cracking behaviour in welds. Int. J. Mater. Res. 2011, 102, 1001–1006. [Google Scholar] [CrossRef]
- Katayama, S. Solidification phenomena of weld metals (1st report). Characteristic solidification morphologies, microstructures and solidification theory. Weld Int. 2000, 14, 939–951. [Google Scholar] [CrossRef]


| Material | Chemical Composition in wt.% | |||||||
|---|---|---|---|---|---|---|---|---|
| C | Cr | Ni | Si | Mn | Mo | V | Fe | |
| LTT weld (Cr/Ni) | 0.045 | 8.0 | 6.0 | - | 0.5 | - | - | bal. |
| S960Q (base material) | 0.18 | 0.8 | 2.0 | 0.5 | 1.6 | 0.6 | 0.1 | bal. |
| Welding Parameters | ||||
|---|---|---|---|---|
| Voltage/V | 12 | |||
| Current/A | 210 | 200 | 190 | 180 |
| Travel speed/mm/s | 1.8 | 2.4 | 3.0 | 3.6 |
| Heat input/kJ/cm | 15 | 10 | 7.5 | 6.0 |
| MVT Parameters | ||||
| Stroke rate/mm/s | 2 | |||
| Surface strain/% | 4 | |||
| Tubeparameter (Reflection Tube) | |
|---|---|
| Target | Wolfram |
| Voltage | 190 kV |
| Current | 0.3 mA |
| Scanparameter | |
| Number of Projections | 2700 |
| Integration time | 300 ms |
| Travel Speed / mm/s | Heat Input / kJ/cm | / mm | / mm | / mm | / % |
|---|---|---|---|---|---|
| 1.8 | 15 | 2.46 | 0.81 | 2.81 | 1.75 |
| 2.4 | 10 | 3.46 | 1.08 | 2.89 | 1.69 |
| 3.0 | 7.5 | 6.02 | 1.35 | 2.89 | 1.69 |
| 3.6 | 6 | 3.97 | 1.62 | 2.1 | 2.32 |
© 2020 by the authors. Licensee MDPI, Basel, Switzerland. This article is an open access article distributed under the terms and conditions of the Creative Commons Attribution (CC BY) license (http://creativecommons.org/licenses/by/4.0/).
Share and Cite
Vollert, F.; Thomas, M.; Kromm, A.; Gibmeier, J. Solidification Cracking Assessment of LTT Filler Materials by Means of Varestraint Testing and µCT. Materials 2020, 13, 2726. https://doi.org/10.3390/ma13122726
Vollert F, Thomas M, Kromm A, Gibmeier J. Solidification Cracking Assessment of LTT Filler Materials by Means of Varestraint Testing and µCT. Materials. 2020; 13(12):2726. https://doi.org/10.3390/ma13122726
Chicago/Turabian StyleVollert, Florian, Maximilian Thomas, Arne Kromm, and Jens Gibmeier. 2020. "Solidification Cracking Assessment of LTT Filler Materials by Means of Varestraint Testing and µCT" Materials 13, no. 12: 2726. https://doi.org/10.3390/ma13122726