The introduction of hydroxyapatite phase directly into a polymer one allows obtaining bioactive implants that can fulfill specific biomechanical functions. Depending on the form in which the inorganic filler is introduced, it will interact with the polymer matrix to a varying degree. It should be affected by the following factors: Chemical structure of the filler, particle size, crystallinity, surface development (specific surface area), pore size, and surface free energy. For this reason, before discussing the impact of an inorganic filler particle size on the morphology, as well as physico-chemical and mechanical properties of the HAp/PAc composite, it is essential to characterize the powders before blending them with the polymer matrix.
3.1. Characterization of HAp Powders
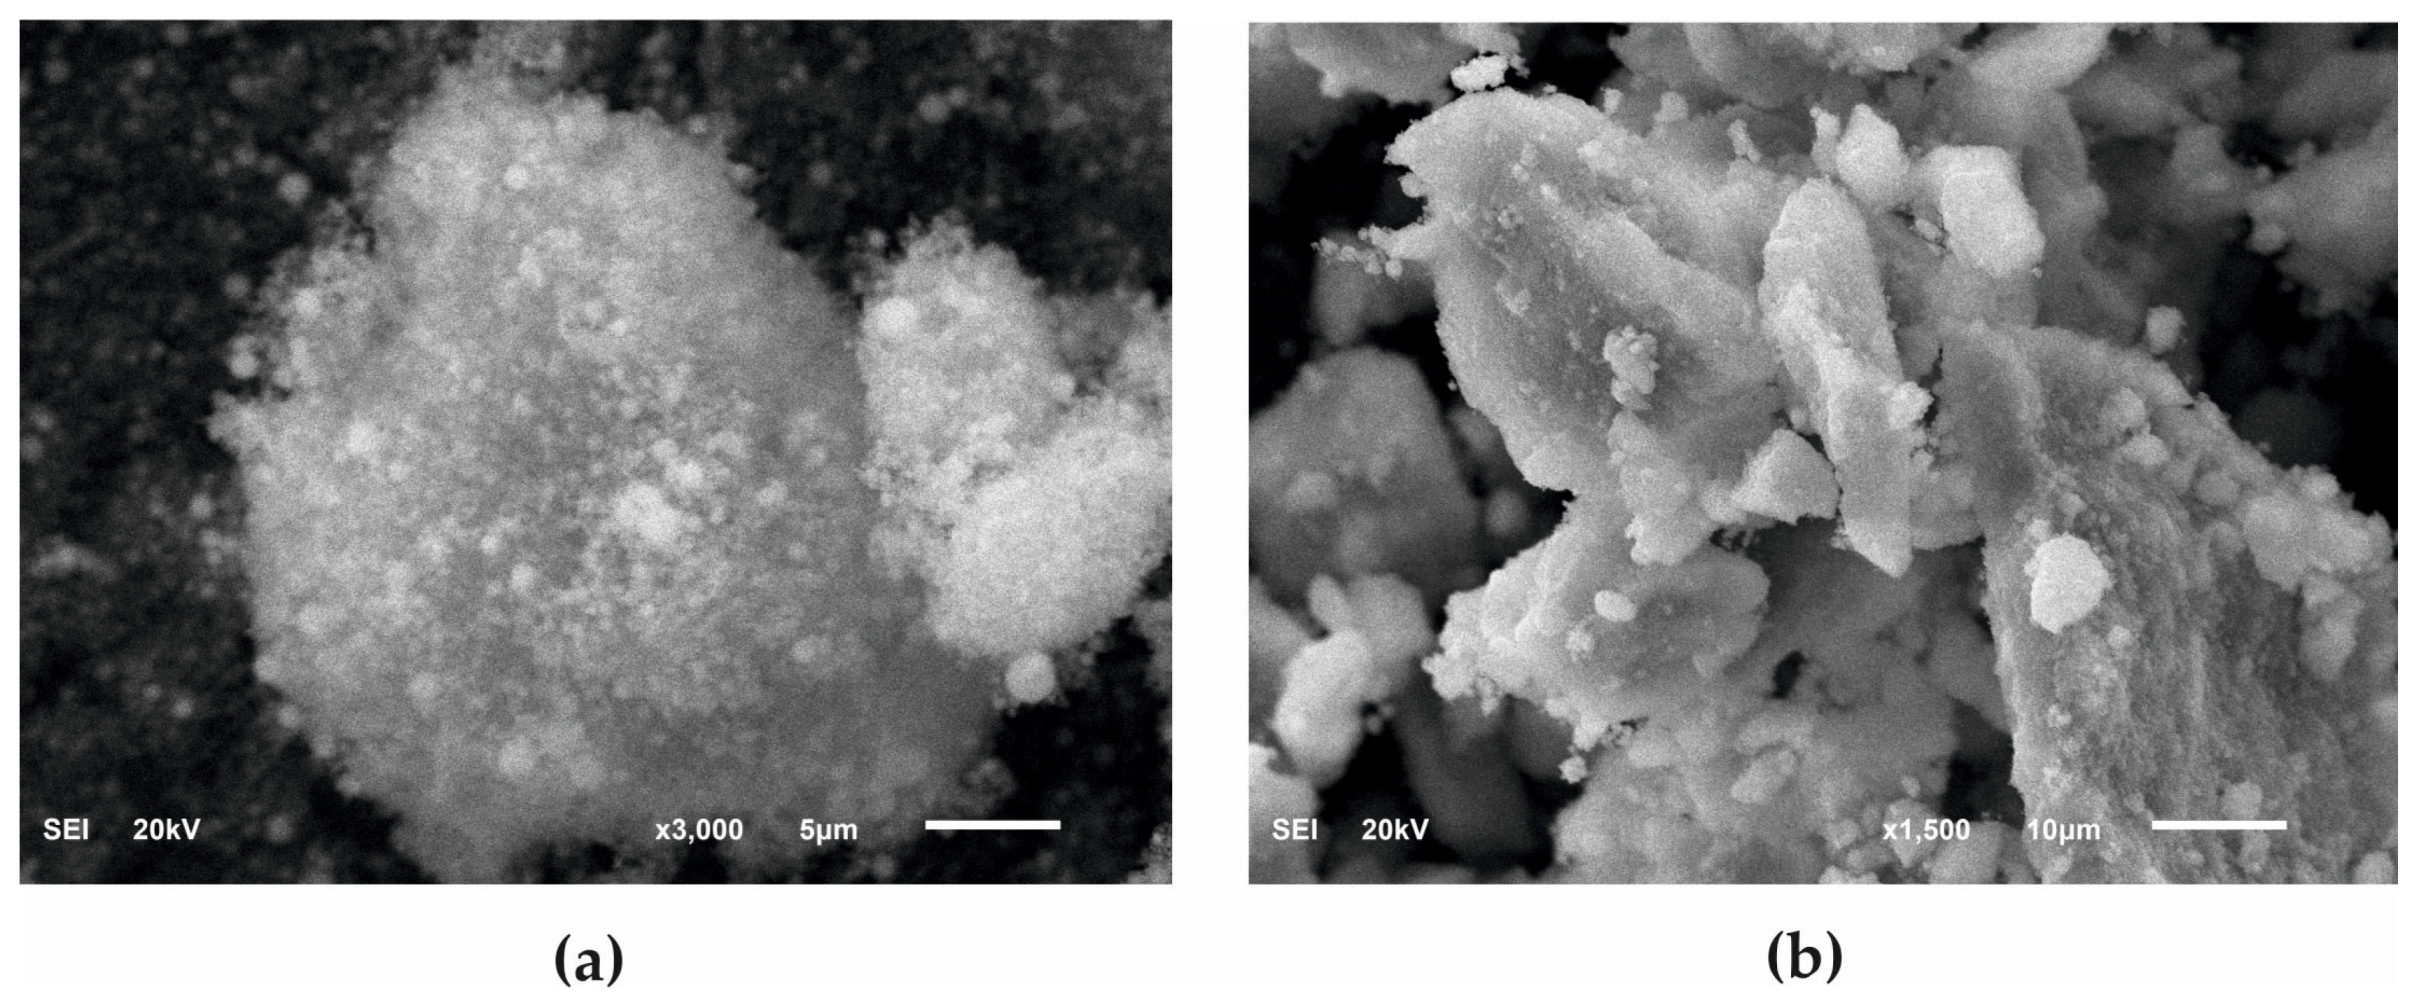
Figure 1 presents a comparison between the surface morphology of commercial powder with nanoscale HAp particles and a powder obtained with the wet method and characterized by micrometer-scale particles (μHAp). For a more accurate assessment of the powder surface condition, the images of powders recorded at two different magnifications, namely 3000× (for nHAp powder) and 1500× (for μHAp powder), are shown. The nHAp sample consisted of either spherical or semicircular particles and it tended to form larger, unstable agglomerates. Their size ranged from 0.02 to 2.33 µm and the average of these measurements equaled 0.24 µm. In contrast, µHAp particles mainly acquired a form of flakes of a very broad size distribution with some smaller particles having the shape of round balls. An image processing procedure demonstrated their size to range between 2.5 µm and 85 µm. However, it should be emphasized that the majority of the particles were small, with their average size amounting to 8.8 µm. This result was over 40 times higher than that of nHAp. In addition, the results of chemical composition measurements performed with the help of EDS microanalysis demonstrated that none of the tested materials contained foreign contaminants. The Ca/P atomic ratio deviated from the stoichiometric one, characteristic for hydroxyapatite. For both powder types it was lower than 1.67—for HAp with nanoscale particles it amounted to 1.62 and for the powder of a micrometer size it was equal to 1.58. This implied a deficiency of calcium with regard to phosphate groups, whereas the preservation of a neutral electrical charge of the entire crystal lattice was possible because of ionic substitution. As a result, an increase in the amount of HPO
42− ions was observed in the so-called B-sites of hydroxyapatite crystals, i.e., those originally occupied by PO
43− ions.
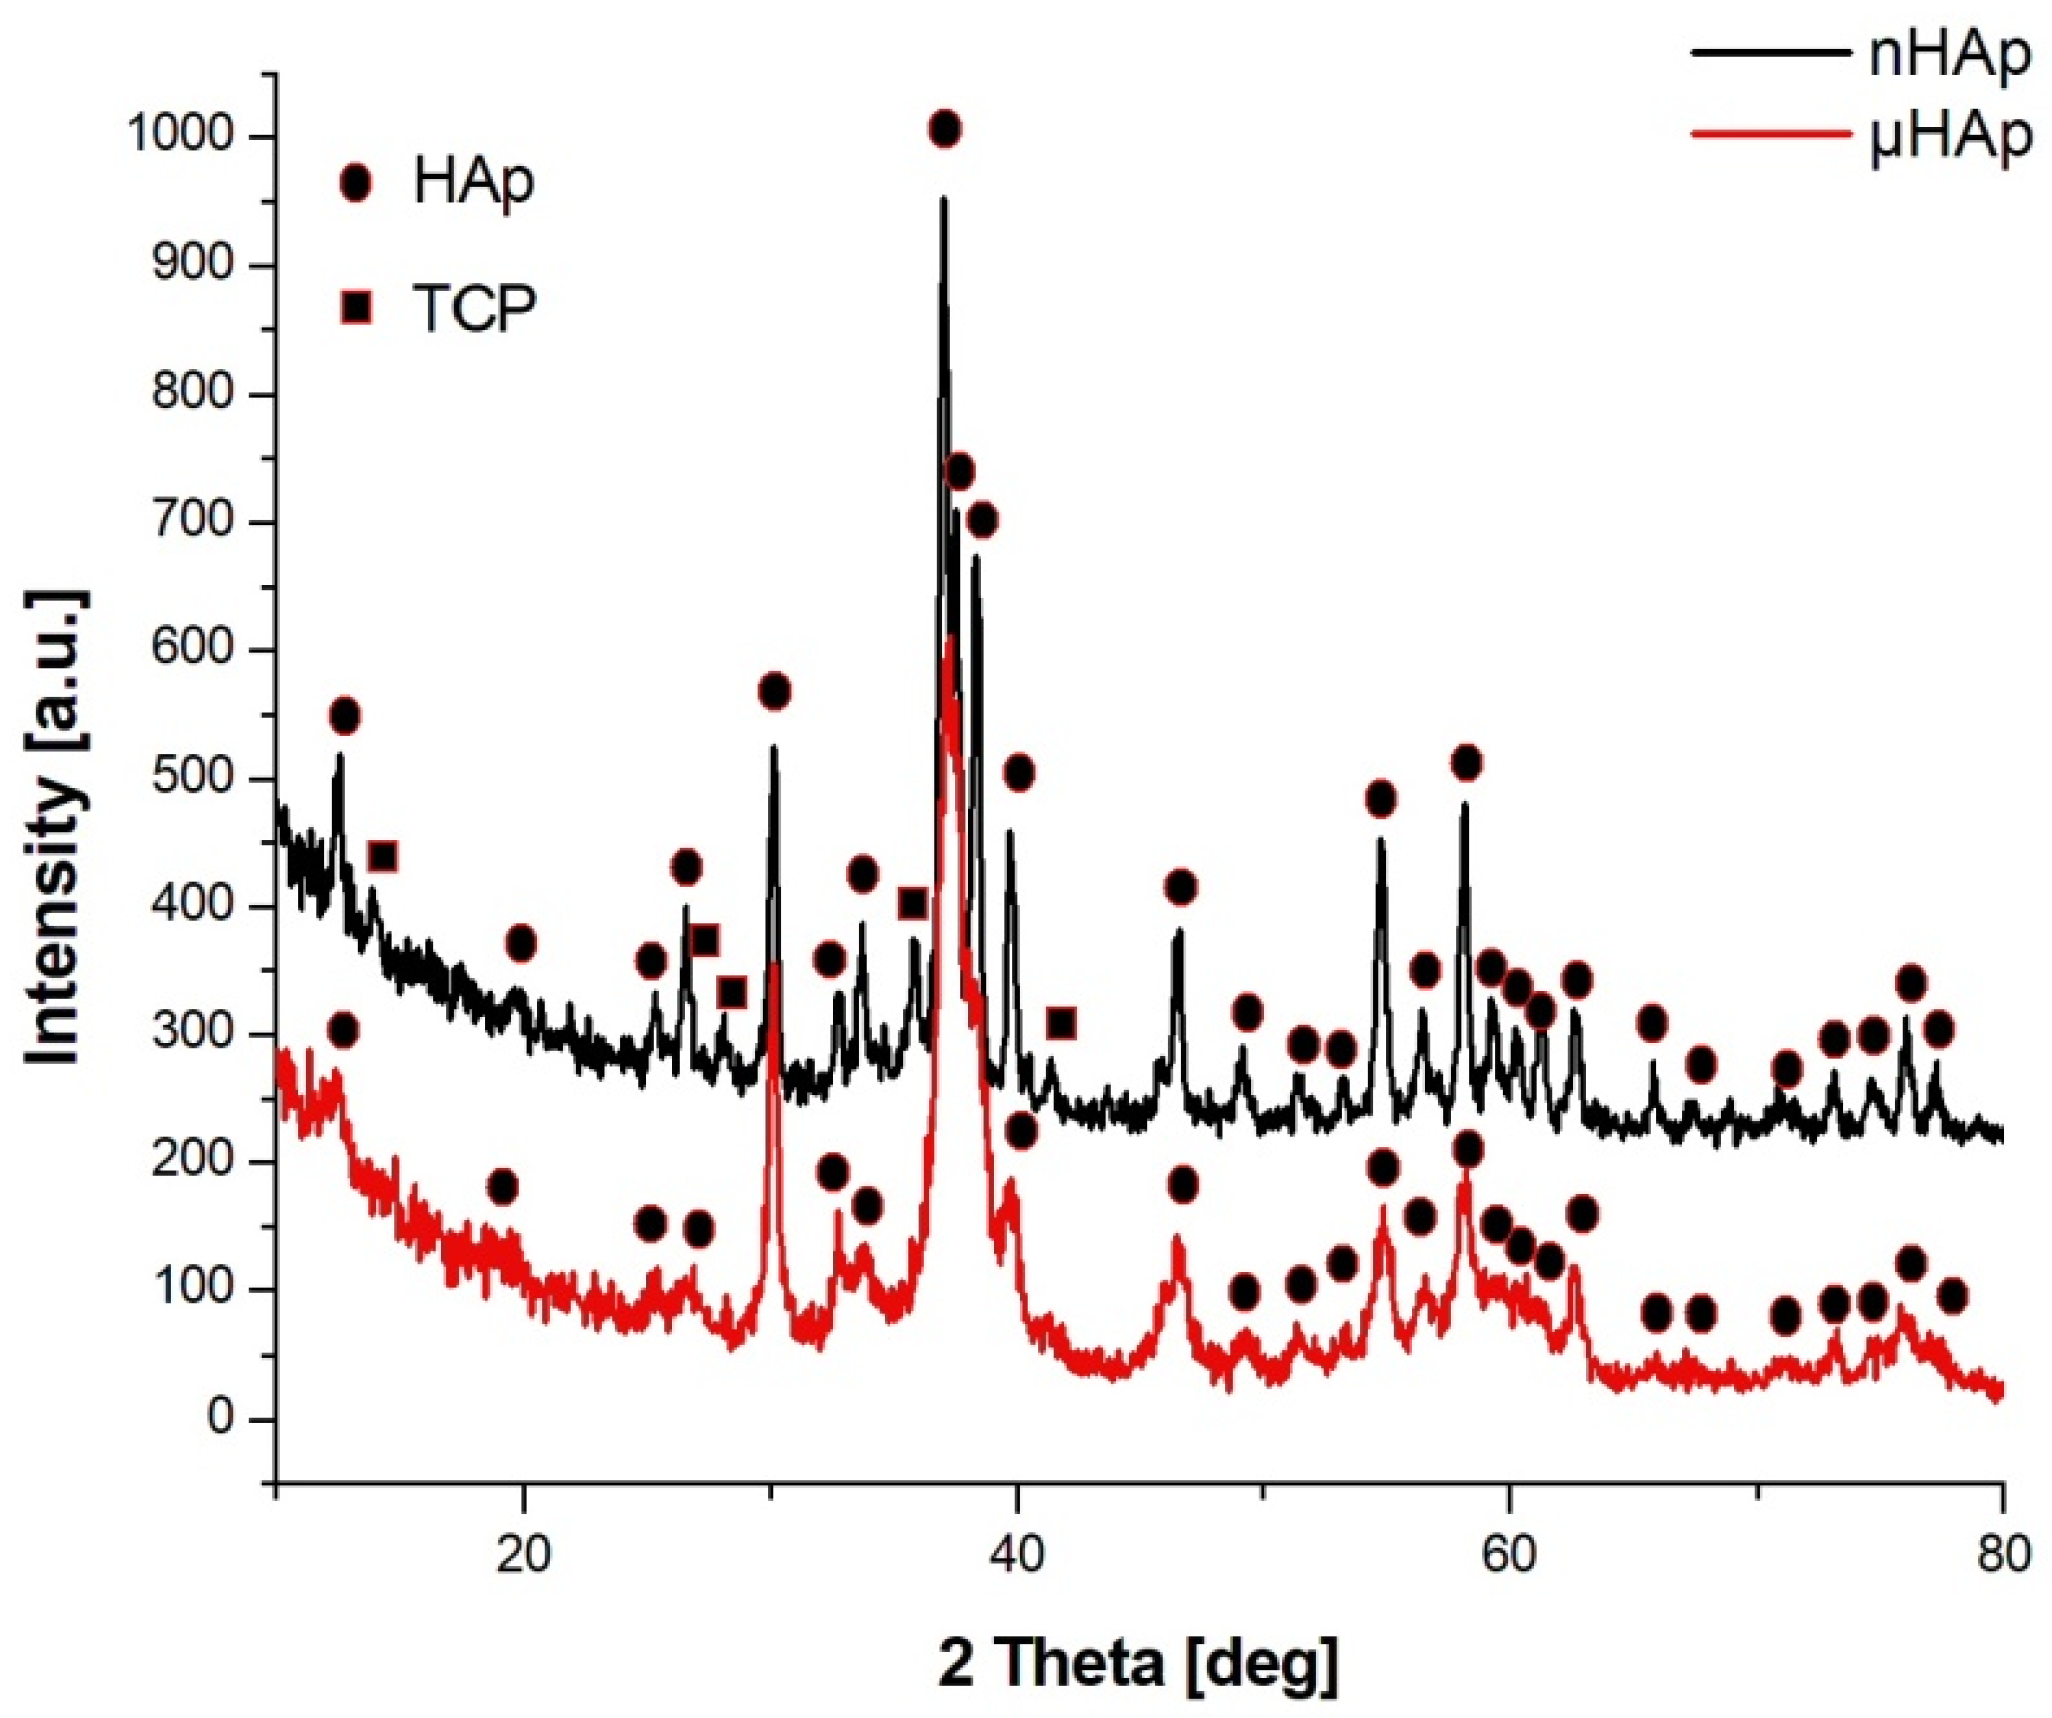
Figure 2 shows the X-ray diffractograms of the two tested powders, with their waveforms similar in both cases. In the case of nHAp powder, the dominant phase was hexagonal HAp, but in that powder’s structure there was also a small amount of triphosphate (TCP) of an orthorhombic order. There were no reflections from TCP in the μHAp powder, with only crystallographic systems characteristic for HAp recorded. According to the International Centre for Diffraction Data (ICDD) card with the reference code of 01-073-6113, the hydroxyapatite unit cell had the following dimensions: a = 9.4320 Å, b = 9.4320 Å, c = 6.8810 Å, while the same dimensions for triphosphate were as follows: a = 15.2200 Å, b = 20.7100 Å, c = 9.1090 Å (a card with the reference code 00-009-0348). A small amount of the amorphous phase was also found in both powders. The fact that hydroxyapatite crystallized in the hexagonal system indicated that its structure was non-stoichiometric, thus becoming similar (in terms of its physico-chemical and biological properties) to natural hydroxyapatite.
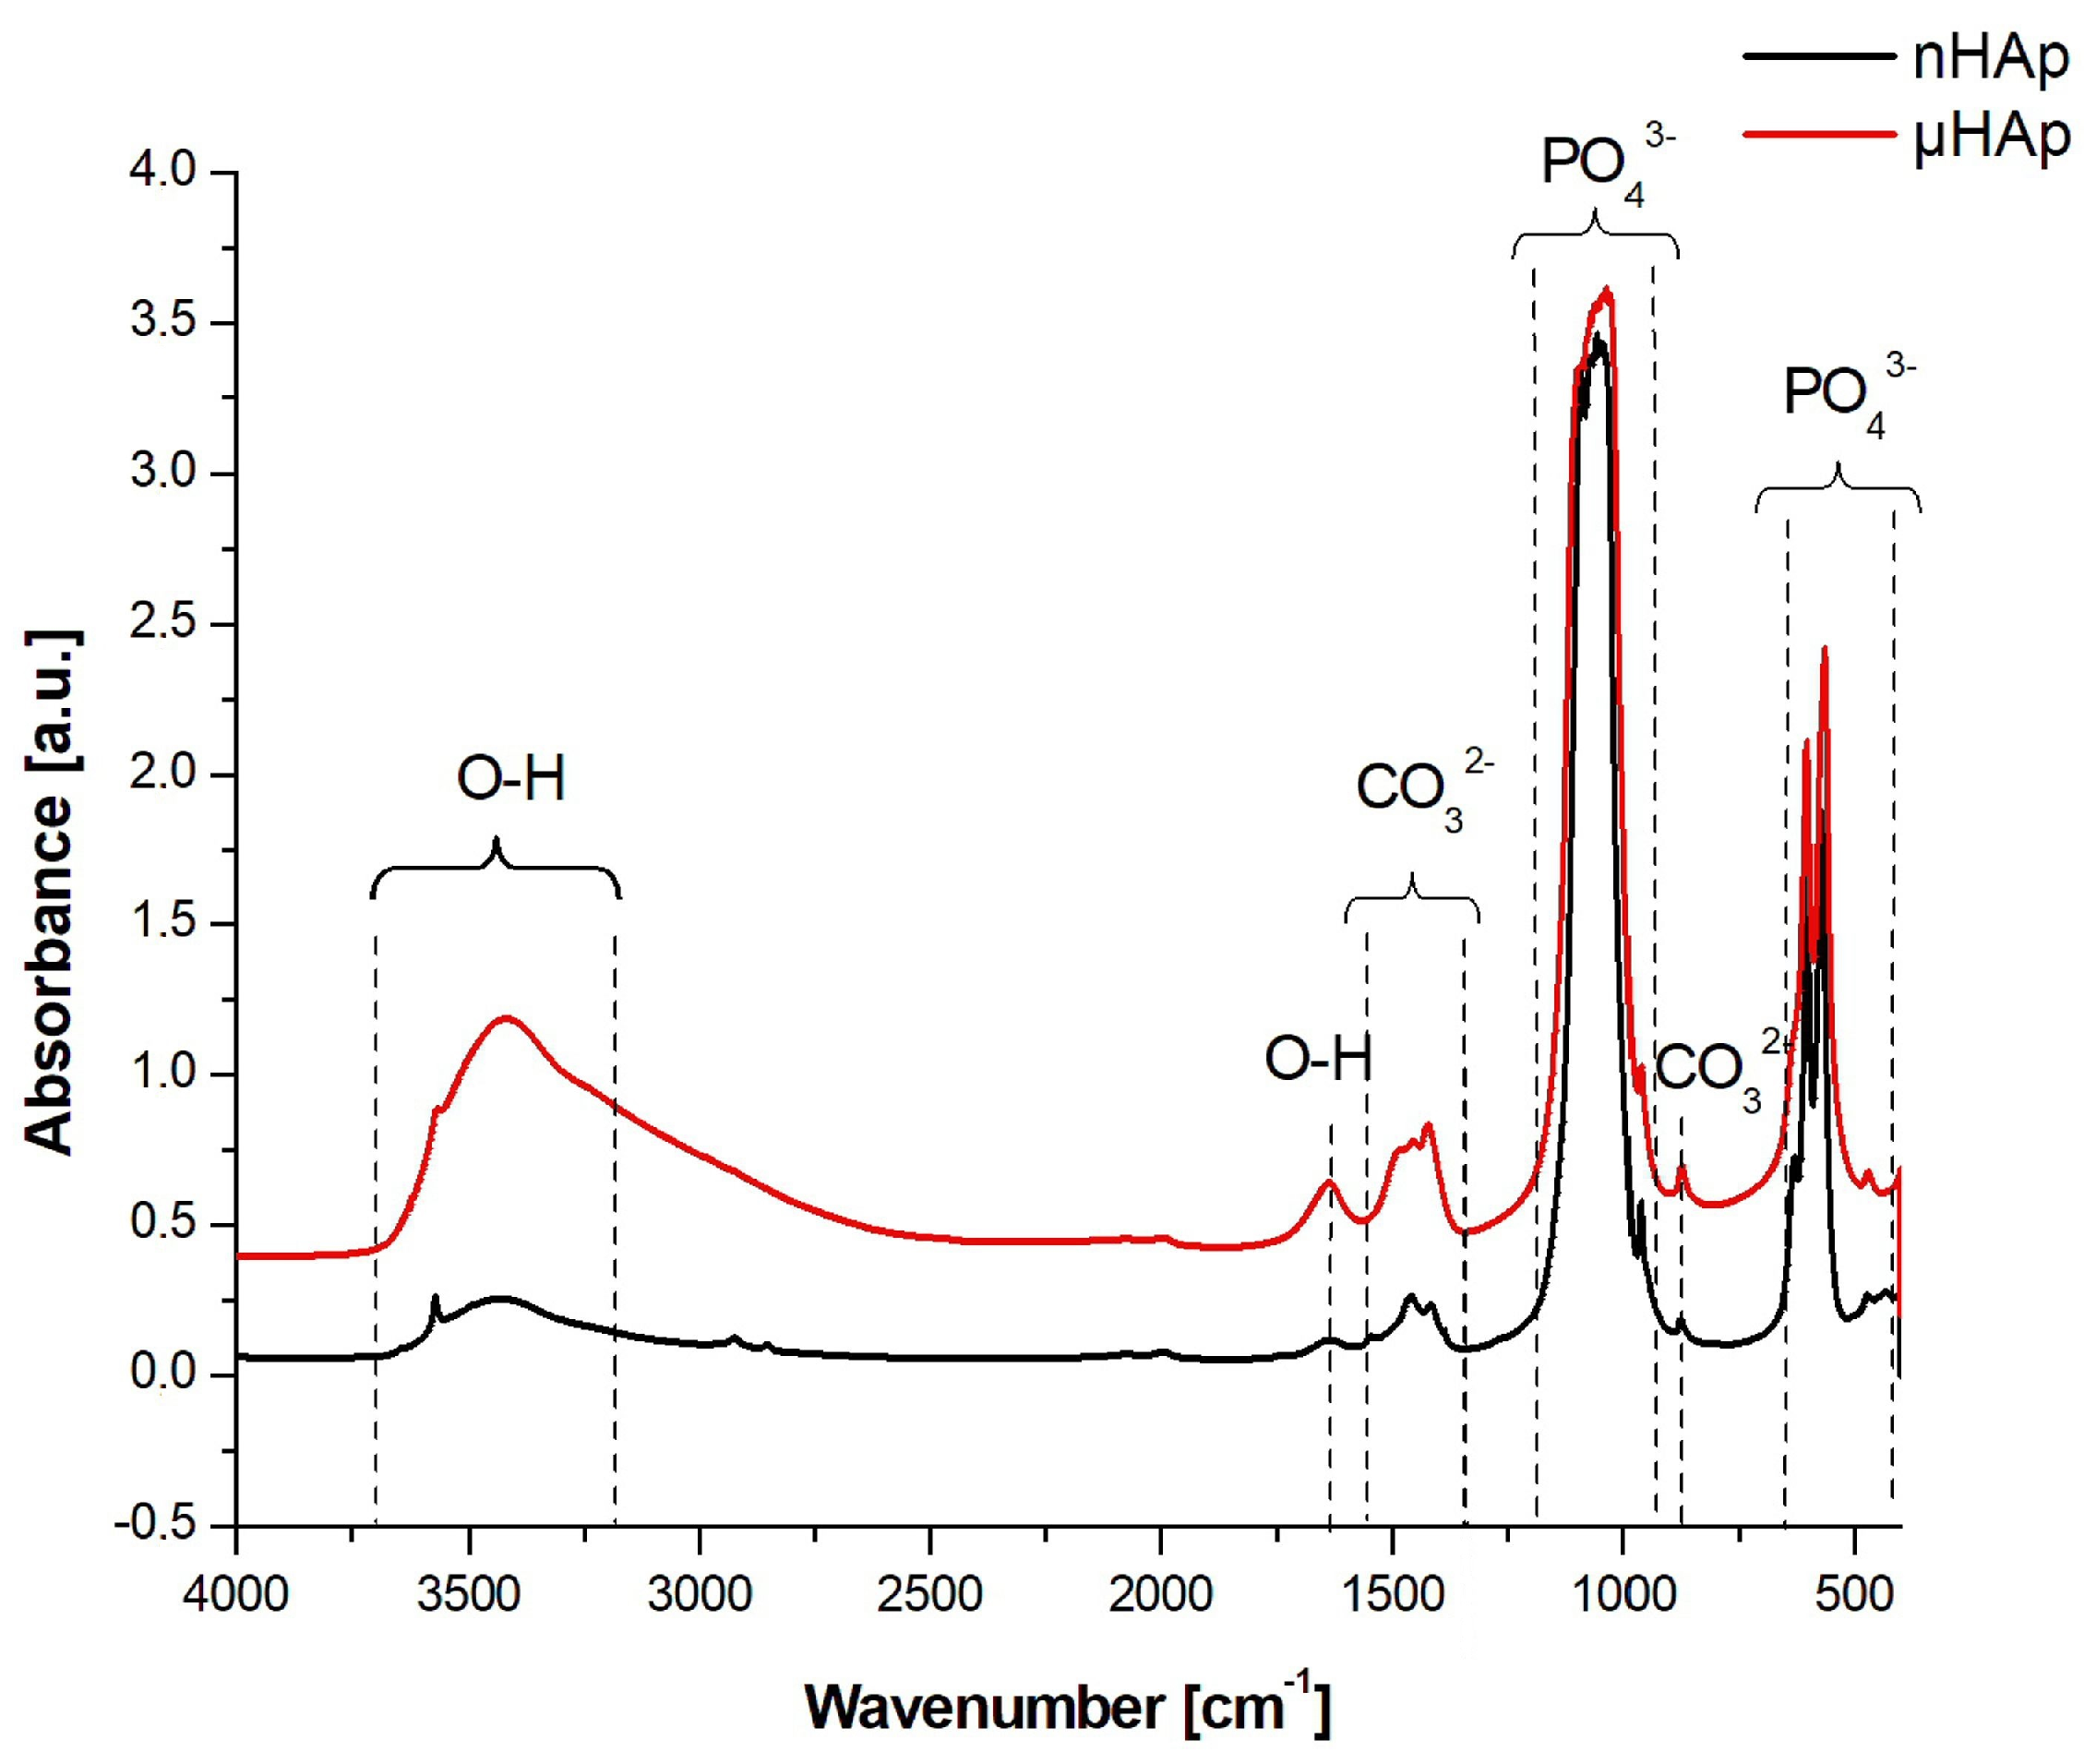
Structural studies of the powders were also carried out using FTIR spectroscopy, with the respective spectra presented in
Figure 3. In the course of these spectra, absorption bands corresponding to the PO
43− phosphate group could be identified, derived from the vibrations of P-O bonds, a symmetric stretching at 476 cm
−1, asymmetric bending at 570 cm
−1 and 603 cm
−1, symmetric stretching at 965 cm
−1, and asymmetric stretching at 1020 cm
−1 and 1085 cm
−1 [
22].
In the spectrum of the nHAp powder a maximum at 1385 cm
−1 was identified, originating from N-O bond vibrations of the NO
3− group, which did not appear in the spectrum of the microscopic particle powder. A wide band having its maximum at a wave number of 1636 cm
−1 and 3200 cm
−1 was associated with the presence of water adsorbed on the surface. Both bands were much stronger in the spectrum of the μHAp powder. The wide band between 3400 cm
−1 and 3200 cm
−1 originated from OH
− groups incorporated into the HAp structure and it was characterized by much higher intensity for self-synthesized hydroxyapatite. A presence of two maxima at 630 and 3573 cm
−1, characteristic for the apatite environment, was also associated with the OH
− groups [
22,
23].
In the spectrum presented in
Figure 3, within the range of 1550–1400 cm
−1 as well as at the wavenumber of 875 cm
−1, the presence of carbonate groups was recognized and identified with the respective stretching and bending vibrations of carbon-oxygen bonds, despite the fact that none of the substrates had carbonate or carboxyl groups in their structure [
24,
25]. These types of bonds are formed naturally in synthetic HAp through the reaction of atmospheric carbon dioxide with the solution used for the HAp synthesis. Carbonates are also found in natural hydroxyapatite in human bones. Their amount ranges from 2 to 8% by weight/volume (w/v) and it is dependent on the type of bone, pathological calcification, or age. As the number of carbonate groups increases, the crystallinity of HAp decreases, thus improving its solubility and leading to the reformation of a bone turnover. The carbonate anion can substitute two anionic HAp structures, thus replacing PO
43− groups (B-type apatite) and OH
− groups located along the crystallographic c-axis (A-type apatite). A presence of both types of apatite was recorded. However, while in natural apatites a content of A-type carbonate fraction is very low, synthetically produced apatites contain a much higher contribution, reaching up to 6% of this component. The presence of both A and B carbonate fractions can be determined in HAp using the FTIR spectroscopy [
24,
25]. Baxter et al. [
26] identified fraction B by assigning asymmetric stretching vibrations of these bonds to the IR absorption bands at the wavenumbers of 1423 and 1456 cm
−1. A weak peak originating from the most stable B carbonate fraction may also be recorded at 1410 cm
−1. When studying HAp that contained only fraction A carbonate, Elliott and Bonel [
27,
28] confirmed its presence by assigning the maxima at the wave numbers of 1530 and 1465 cm
−1. Elliot et al. [
28], in turn, reported that both A and B fractions might be present in the material wherein a peak at 1543 cm
−1 and a strong maximum at 1449 cm
−1 were recorded. When analyzing the spectra shown in
Figure 3, one can conclude that μHAp contained type B carbonate groups substituted in the HAp structure by phosphate groups as evidenced by a presence of the maxima found at the following wave numbers: 873, 1421, and 1480 cm
−1. Furthermore, an additional band at 1480 cm
−1 was known to be present, which was responsible for the existence of labile surface carbonate [
29]. In turn, a presence of fraction B observed in the nHAp powder was also confirmed by the appearance of absorption maxima at the wave numbers of 1414 and 1454 cm
−1. At the same time, the peak at 1414 cm
−1 was associated with the most stable form of B carbonate. In addition, peaks at 1448 and 1546 cm
−1 were also recorded in the spectrum of this material, which suggests that carbonate anions may substitute HAp hydroxyl groups, a feature being associated with the presence of form A. This implies that, in the case of nHAp powder, we dealt with a mixed AB fraction. To summarize, a presence of carbonate groups should not be understood as a contamination since it has been proven that they enhance the bioactivity of hydroxyapatite [
30].
When designing polymer-based composite materials, it is extremely important to know the surface wettability of the phases that will be blended together. The degree of dispersion of the inorganic filler in the polymer matrix is dependent upon it, and this, in turn, will translate into the composite mechanical, physico-chemical, and biological properties. For that purpose, the wettability measurements of both powders as potential fillers for the production of HAp/PAc composites were performed. Based on the results of this measurement performed using two liquids, one polar (methanol) and another nonpolar (heptane), the values of surface free energy (SFE) as well as its polar and dispersion components were calculated. The results are shown below, in
Table 1.
The results presented in
Table 1 indicate that, despite substantial differences in a grain size and identified variations of the chemical structure and phase composition of the tested fillers, no significant effect of these parameters on the SFE value was observed. The resulting value for the powder in the nanoscale was 23.2 mN/m, while that of the microscale material was greater by only 0.3 mN/m. The dispersion component of SFE was similar in both cases, with a minor difference observed for the polar component. A slightly higher value was obtained for the powder with particles on a microscale, which was consistent with the chemical structure results showing a larger content of polar groups in this material.
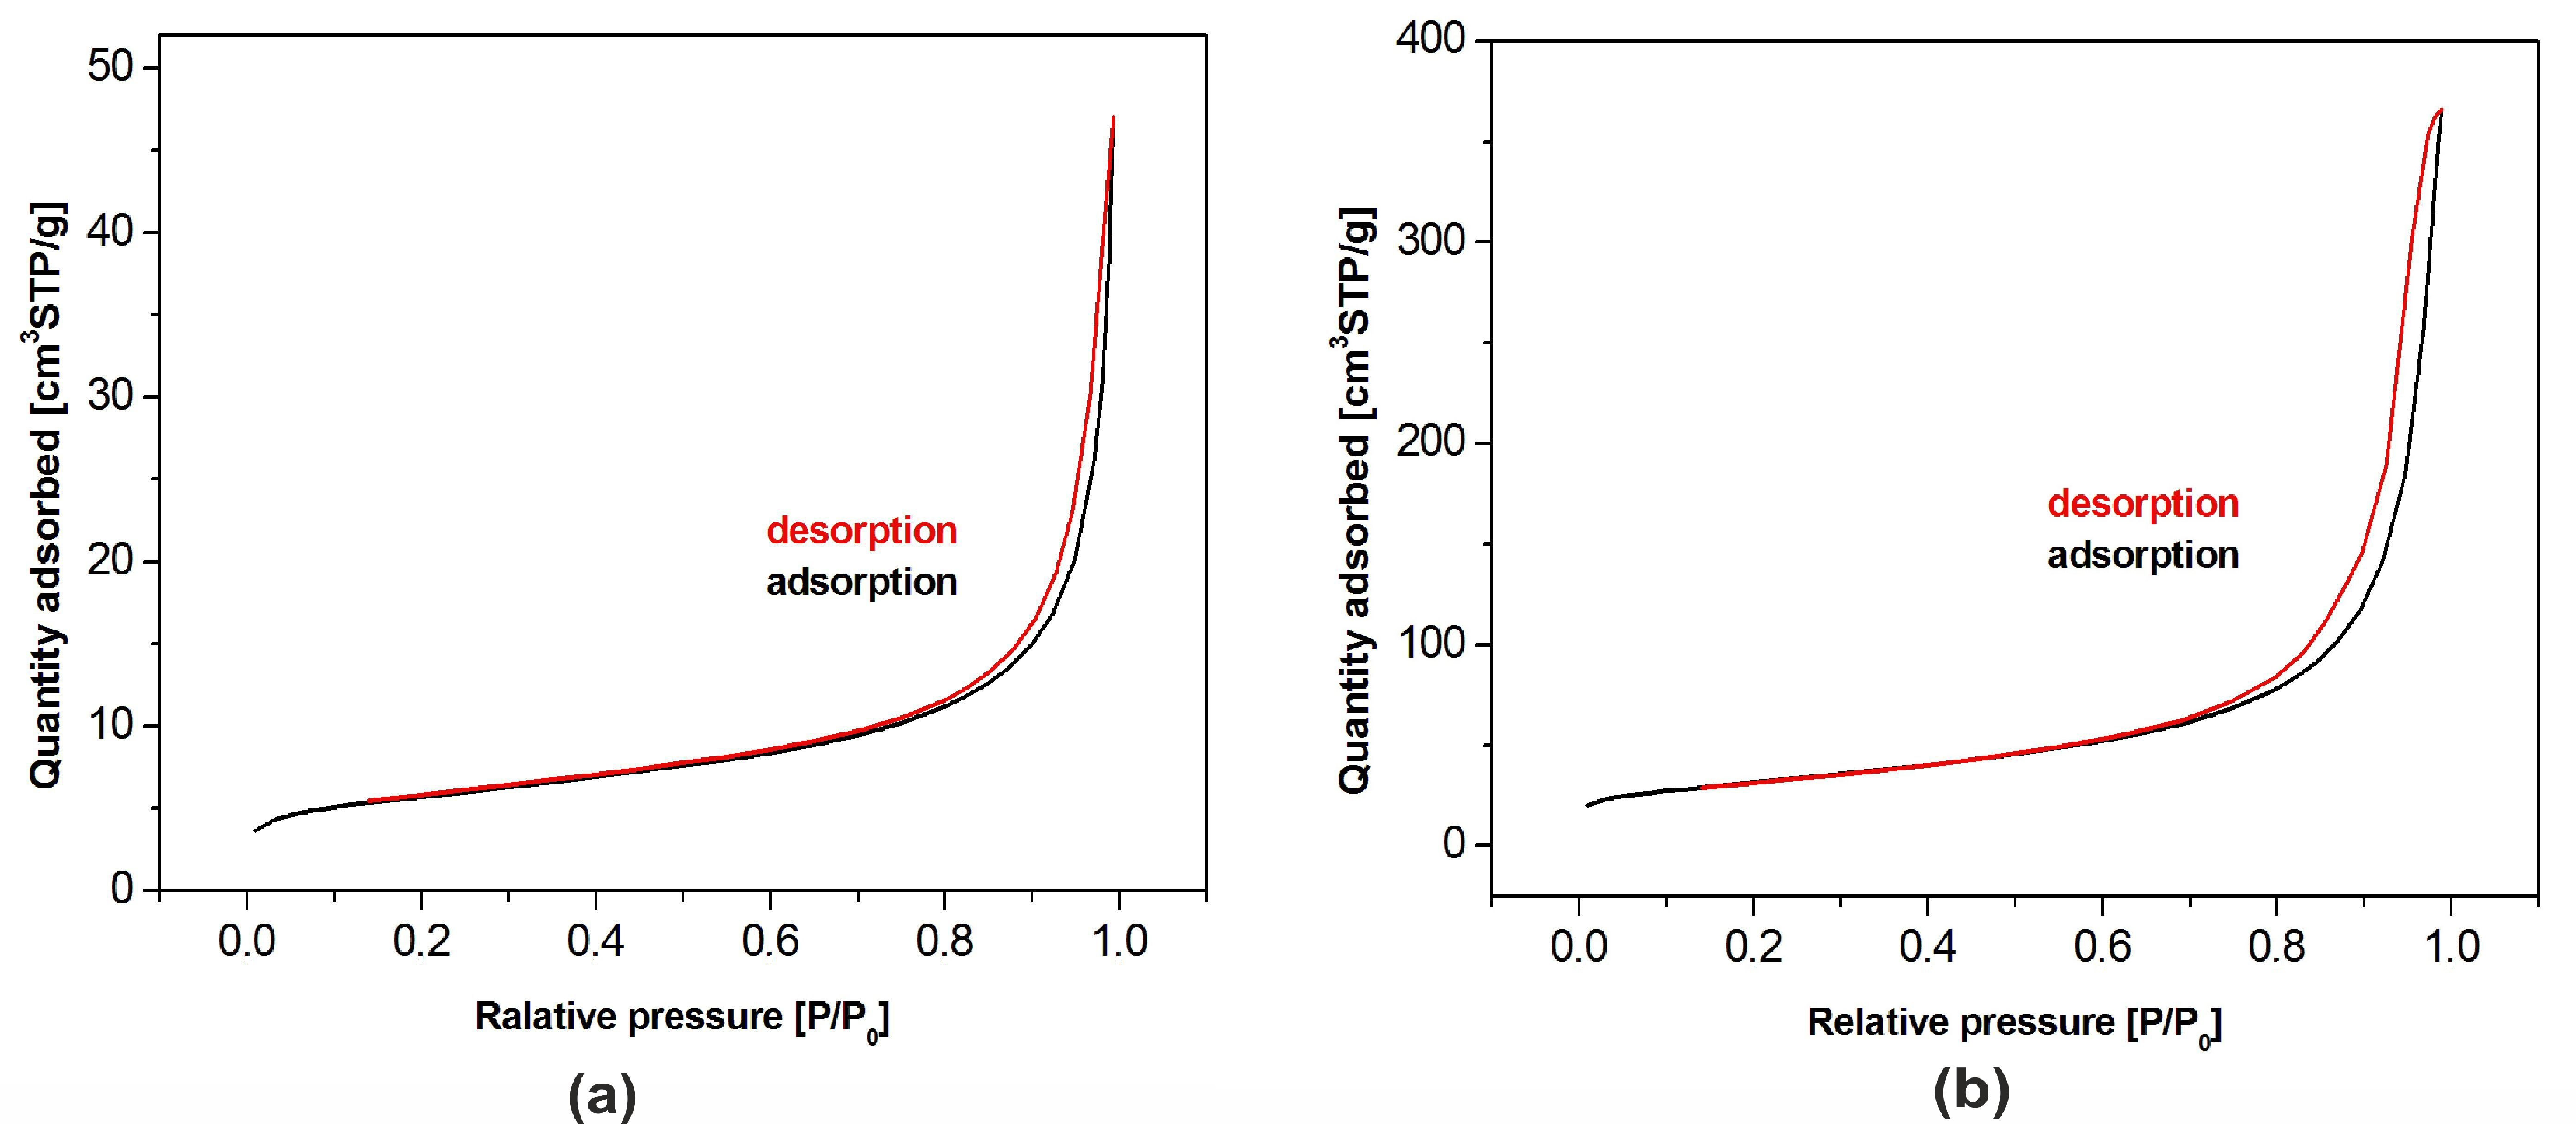
BET adsorption isotherms of both hydroxyapatite powders are shown in
Figure 4. According to the International Union of Pure and Applied Chemistry (IUPAC) classification, they belong to the type IV. This means that the tested samples had, apart from recorded microporosity (pore size lower than 2 nm), also well-developed mesoporosity (pore size in the range of 2–50 nm). The isotherms presented in the figure allowed one to calculate the pore size distribution confirming their classification as the type IV [
31,
32]. Specific surface area of the samples amounted to 19.3 m
2/g and 110.3 m
2/g for nHAp and µHAp, respectively. BET adsorption measurements showed the total volume of the pores with their diameter remaining between 0.85 and 70 nm amounts to 0.07 cm
3/g for nHAp and to 0.56 cm
3/g for µHAp. In general, the above data showed the superiority of the µHap filler in terms of a surface development. Not only was its specific surface area over five times larger, but also its total pore volume exceeded that of nHAp by a factor of seven.
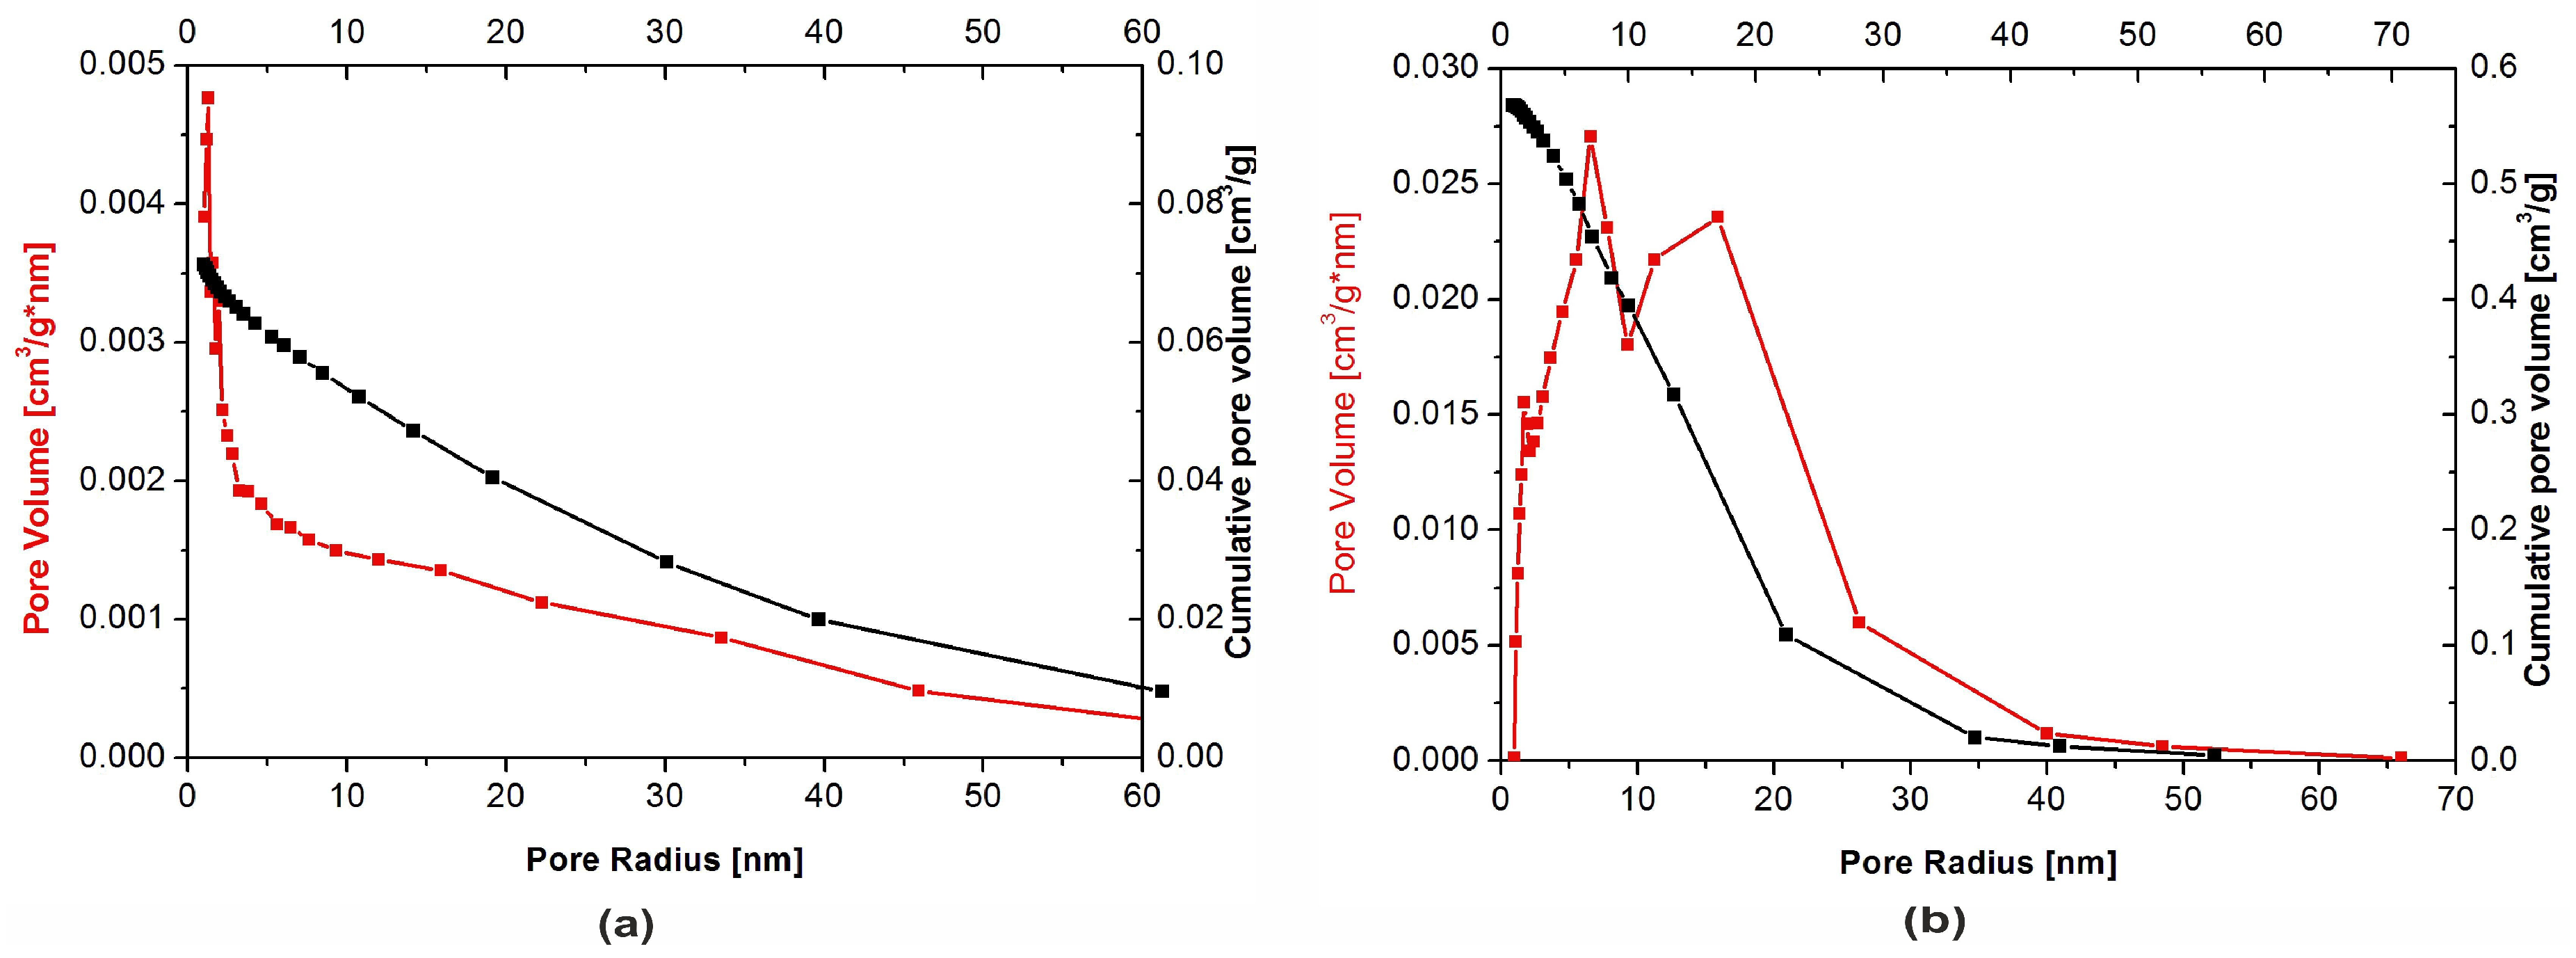
The physical adsorption of gases on microporous solids took place through the formation of a multilayer structure (layer by layer). In the case of mesoporous materials, it followed a volume filling mechanism. For both types of materials, micropore filling occurred at comparatively low values of relative pressure. The formation of an adsorption film on mesoporous surface in that case was followed by the volume filling of the mesopores with a liquid adsorbate. This process is known as a capillary condensation and it occurs at high values of a relative pressure. Dependencies of a pore diameter, determined with the BJH method, on its volume (including the cumulative pore volume) are presented in
Figure 5 below.
Although the presence of micro-, meso- and macropores was recorded in both types of the filler, their distribution was significantly different. In the nHAp sample, macropores with a diameter higher than 50 nm occupied a volume of 9.31 × 10
−5 cm
3/g·nm. A cumulative volume of mesopores (2–50 nm) amounted to 0.024 cm
3/g·nm, whereas for nanopores, with a diameter lower than 2 nm size, the volume was equal to 0.026 cm
3/g·nm. It is also evident from
Figure 5a that, among nanopores, those with a diameter equal to 1.1–1.3 nm were predominant.
Macropores with a diameter higher than 50 nm were also present in the µHAp powder. However, their cumulative volume amounted to 1.3 × 10
−4 cm
3/g·nm, while mesopores (2–50 nm) occupied a volume of 0.23 cm
3/g·nm and nanopores that of 0.066 cm
3/g·nm. As seen in
Figure 5b, the dominant mesopores had a diameter of ca. 8 and 18 nm. It can, therefore, be concluded that the volume of mesopores was more than 10-fold greater as compared to that typical for nHAp. The sample also contained pores with a diameter lower than 10 nm but their contribution to the overall porosity was relatively small. From the above results, it appeared that these particles were exceedingly porous, thus having a well-developed surface, furnished with inequalities, depressions, and deep pores.
Methyl methacrylate was used as a monomer for the preparation of polymer composite samples. The molecular size of this compound is about 0.97 nm and, thus, it falls within the range of mesopores. However, the pore volume, considering the monomer adsorption capacity, in nHAp powder is negligible.
3.2. Characterization of HAp/PMMA Composites
It is common knowledge that a supplement of HAp, as well as other inorganic materials including such contrast media as ZrO2 or BaSO4, may lead to both a drop of cross-linking temperature and an increase of setting time of acrylate-based bone cements. Additionally, these parameters are also affected by the size and molecular weight of the acrylate polymer being another component of the bone cement powder. In order to directly assess the effect of HAp on these parameters, the addition of the contrast media was purposefully omitted. In the present work, all the samples were prepared on the basis of the same acrylate copolymer, namely PMMA/PMA, with the variables being a type and concentration of the HAp additive. In both cases, namely those of micro- and nanoscale powders, the HAp concentration varied between 3 and 21 weight percent.
The results of a maximum cross-linking temperature and setting time measurements, including the time to reach the maximum hardness, are presented in
Table 2 below. Combining the liquid and powder components of bone cement resulted in the formation of free radicals, which break the double C=C bond in methyl metacrylate and initiated its addition free-radical polymerization reaction leading to the material cross-linking. This reaction was strongly exothermic—under present experimental conditions and for a pure acrylate powder, its temperature amounted to 87.4 °C. The addition of the nanoscale HAp, independent of its concentration, did not cause any substantial changes of that temperature. Dissimilar was the situation for the microHAp additive, where the significant effect of the filler concentration on the reaction temperature was observed. For a composite containing 6 weight % of that additive, this temperature was approximately the same as that for the pure acrylate. The increase of the μHAp concentration to 12 weight % and then to 21 weight % resulted in a drop of the reaction temperature by the component of 20 °C and 42 °C, respectively. The effect of lowering that temperature was beneficial since high temperatures may have resulted in a local tissue necrosis, thus leading to the destruction of a neural ending. From the point of view of safe temperature levels, the most valuable bone cement samples seemed to be those of the highest μHAp concentrations. The results observed indicated that lowering reaction temperature cannot be simply associated with the filler playing the role of a heat accumulator, since it was shown that this temperature was affected by the size of its particles. The larger they are and the higher are their specific surface areas, the more likely it is that they will influence on the cross-linking temperature. This effect may be associated with the lower availability of monomer molecules trapped in μHAp mesopores. Lower availability did not mean different reaction efficiency—the reaction simply needed more time to be completed. Comparable mechanical properties of the samples (see Figure 11) proved the correctness of the above assumption. The differences observed resulted rather from varied filler concentrations than from different mechanism of polymerization. A similar outcome was observed in the case of measurements of time required to attain the maximum reaction temperature. Up to a certain level of concentrations, amounting to approximately 12 weight %, the addition of nHAp did not bring about any prolongation of the time needed to complete the polymer exothermic cross-linking reaction. Only at the concentration of 18 weight %, that time was prolonged by one minute with a similar extension being observed for the sample containing 21 weight % of the filler. Simultaneously performed hardness tests showed that the time required to attain its maximum value was independent of the nHAp concentration and it amounted to ca. 11 min. As opposed to that, the addition of microscale hydroxyapatite filler substantially affected the temperature of an exothermic cross-linking reaction and the time of its attainment. A drop of the maximum reaction temperature by 50 °C and nearly a two-fold extension of the time to reach that maximum were observed as a result of changing the µHAp concentration from 3 to 21 weight %. As far as the time necessary to attain the maximum hardness values was concerned, that for the lowest µHAp concentrations of 3 and 6 weight % did not differ much from the values recorded for the nHAp filler. However, in the case of the higher µHAp content, it began to extend to finally reach the value of 27 min and 29 s for the sample containing 18 weight % of µHAp. This meant that the use of the microscale hydroxyapatite filler substantially reduced the availability of monomer molecules, thus impeding the cross-linking reaction.
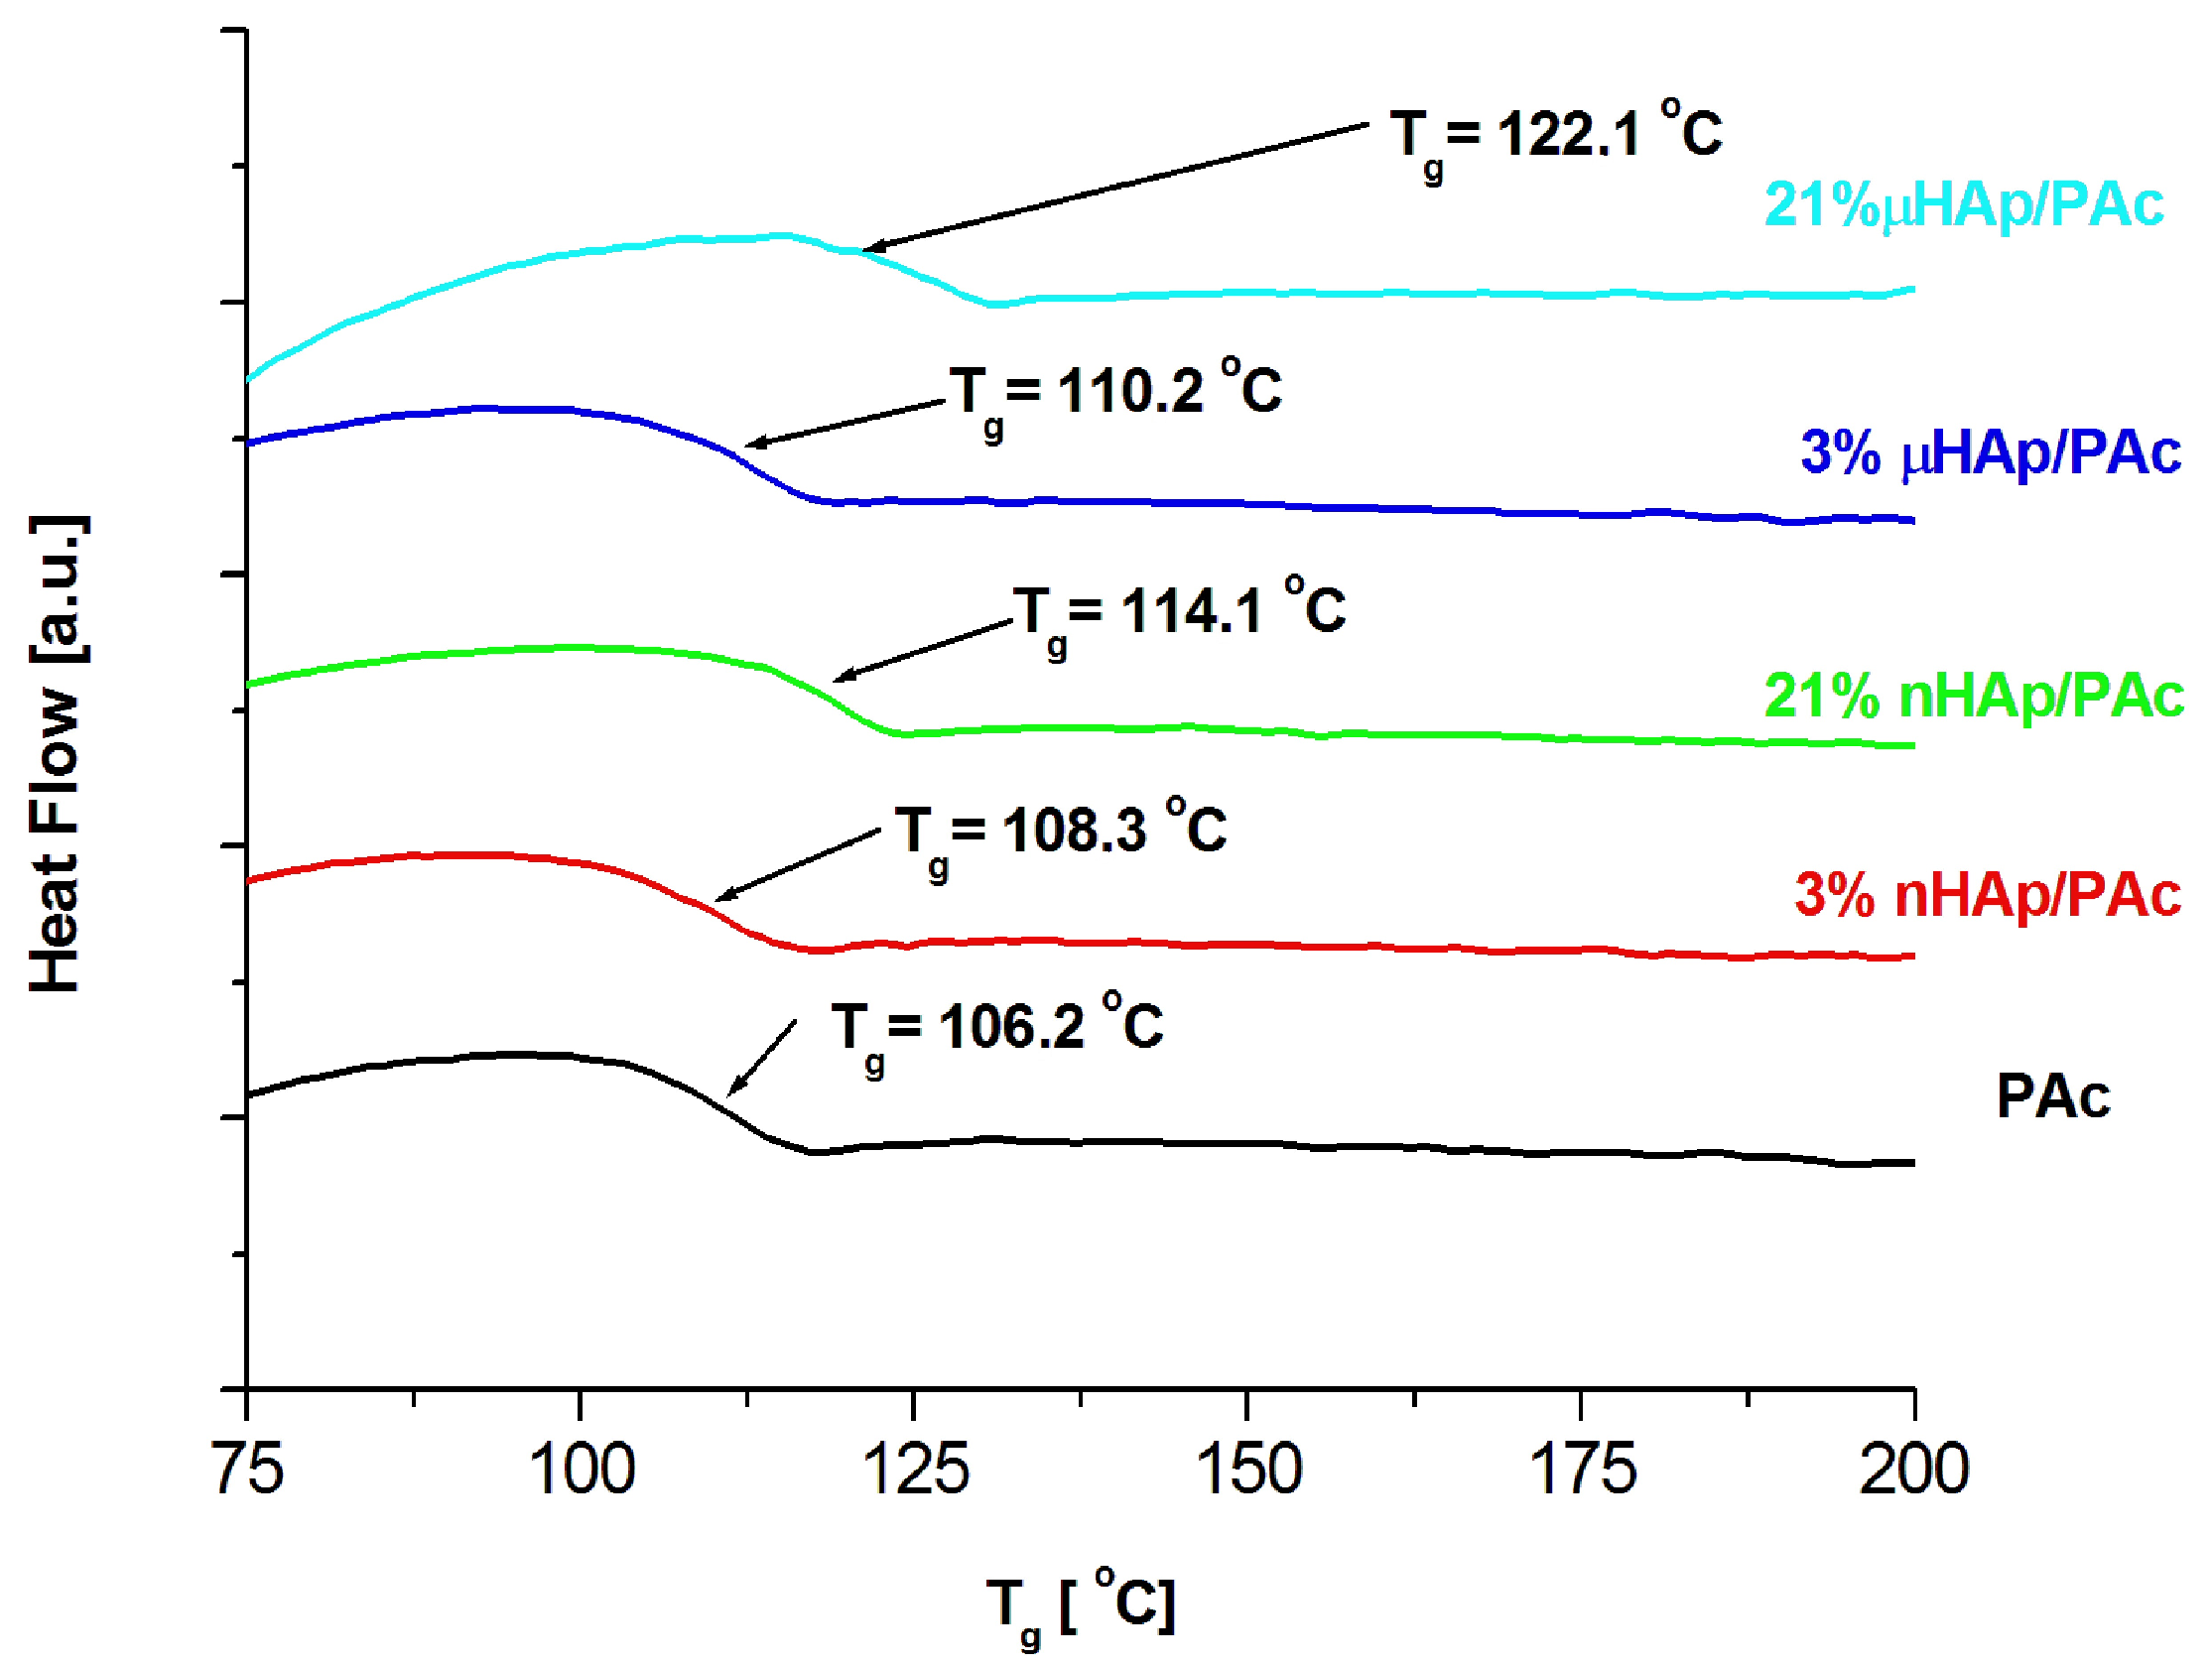
Examples of DSC thermograms for a nonmodified bone cement as well as those modified with the nano- and microscale hydroxyapatite filler at the concentrations of 3 and 21 weight % are shown in
Figure 6 below, while
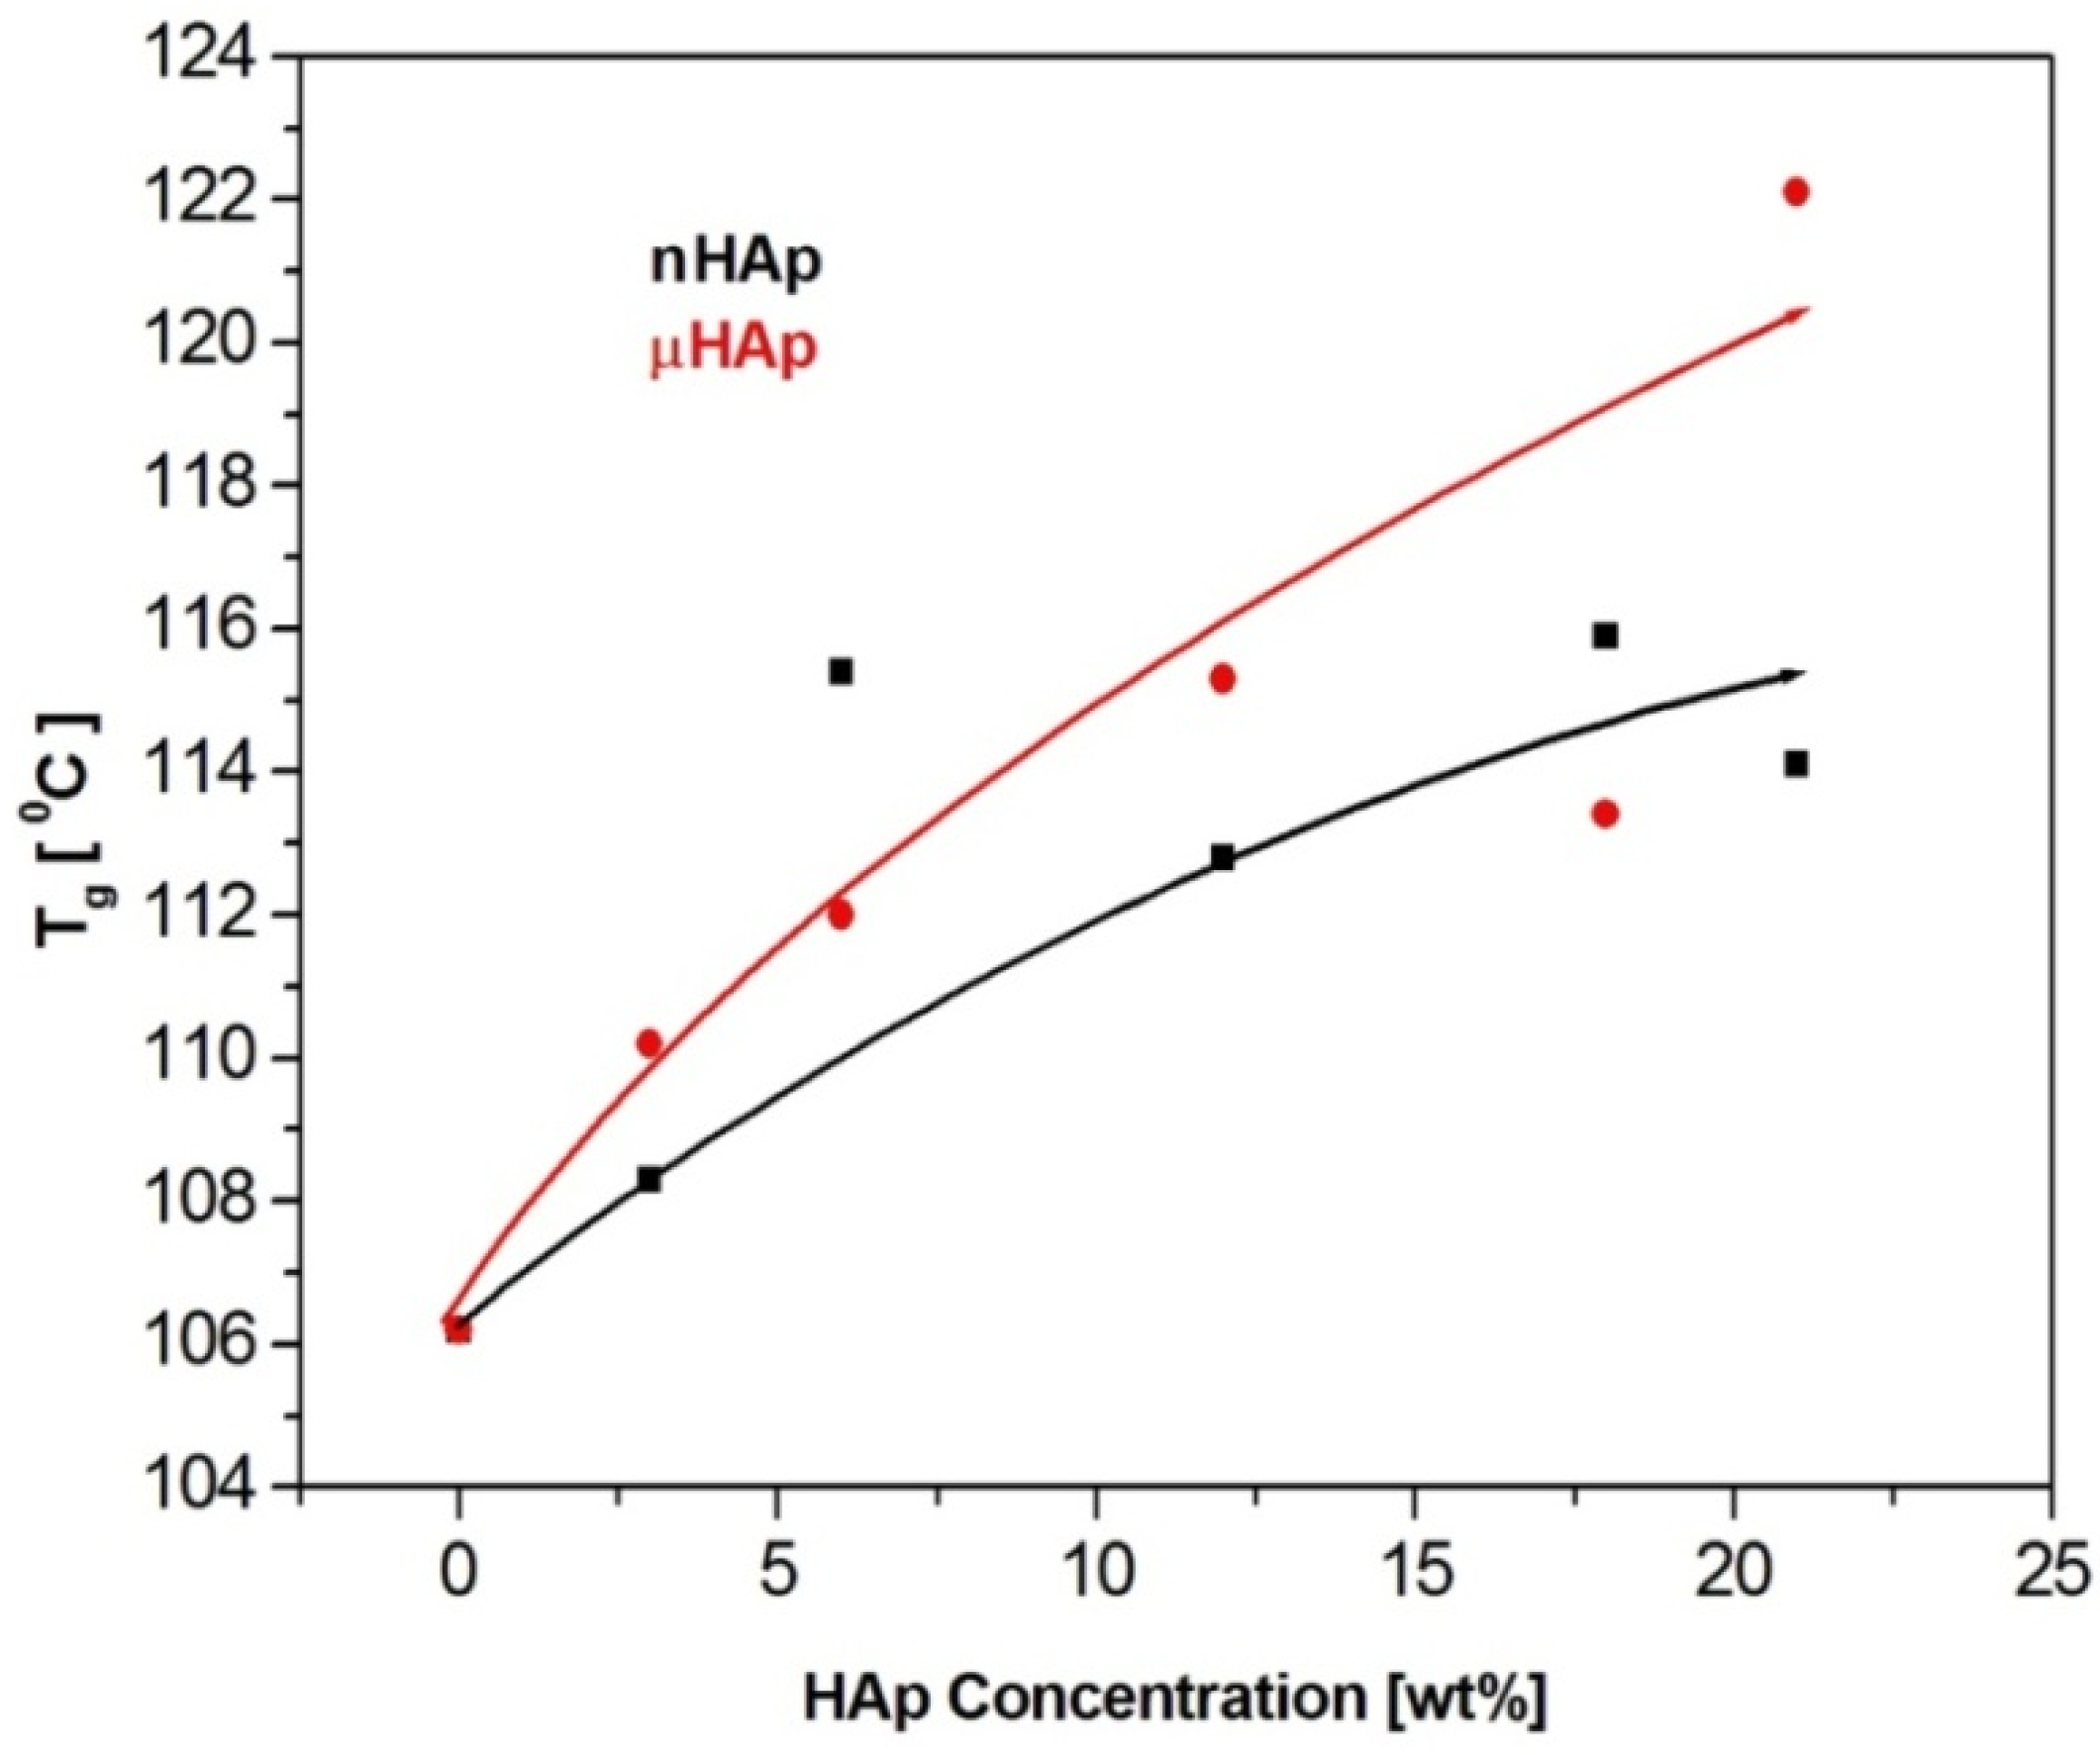
Figure 7 presents the values of glass transition temperature of all investigated samples.
The results presented above show a substantial influence of the hydroxyapatite filler on the glass transition temperature of the obtained composites. It is worth noting that the same amount of the additive may affect the T
g value differently, depending on the HAp particle size. At the highest filler concentration, the nanoscale filler increased T
g by the magnitude of 6 °C, while the microHAp additive made it grow by 16 grades. A similar behavior was observed in the case of PMMA filled with silicon dioxide [
33]. The observed tendency pointed to a strong interaction between monomer molecules and filler particles at the stage of sample preparation. Very likely, this interaction had a polar character. Strong polar interactions between the filler particle and the macromolecule of the polymer severely limited the mobility (elasticity) of the latter, thus increasing its glass transition temperature. As revealed by the BET adsorption data, specific surface areas of the fillers applied substantially differed from one another. The same measurements showed differences in a pore number and size.
The BET results remained in a good agreement with the DSC data. The lower specific surface area of the nHAp filler, as well as its lower pore number and size, affected the filler-monomer interactions to a lesser extent. In contrast to that, the interactions with the monomer of the microsize filler were much stronger. As it was shown by the FTIR analysis, microsize hydroxyapatite contained considerably more polar groups than nHAp. In addition, these groups were less accessible in the case of nHAp since it had a large content of the A fraction of carbonate anions in its structure, substantially lowering the accessibility of hydroxyl moieties. This is a reason why the presence of the microsize filler at the highest concentration of 21 weight % shifted the glass transition temperature of the composite as far up as by 16 degrees.
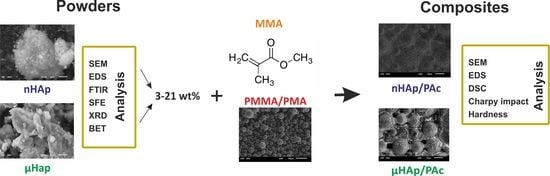
Figure 8 presents a SEM micrograph of an initial acrylate copolymer powder (a) and that of polymerized cross-linked bone cement without any addition of hydroxyapatite (b). The size distribution of particles shown in the
Figure 8a varied between 2.5 µm and 65.7 µm with the average diameter amounting to 17.5 µm. Following the cross-linking process, one obtained a rather smooth surface with the densely packed, small globules originating from the initial copolymer.
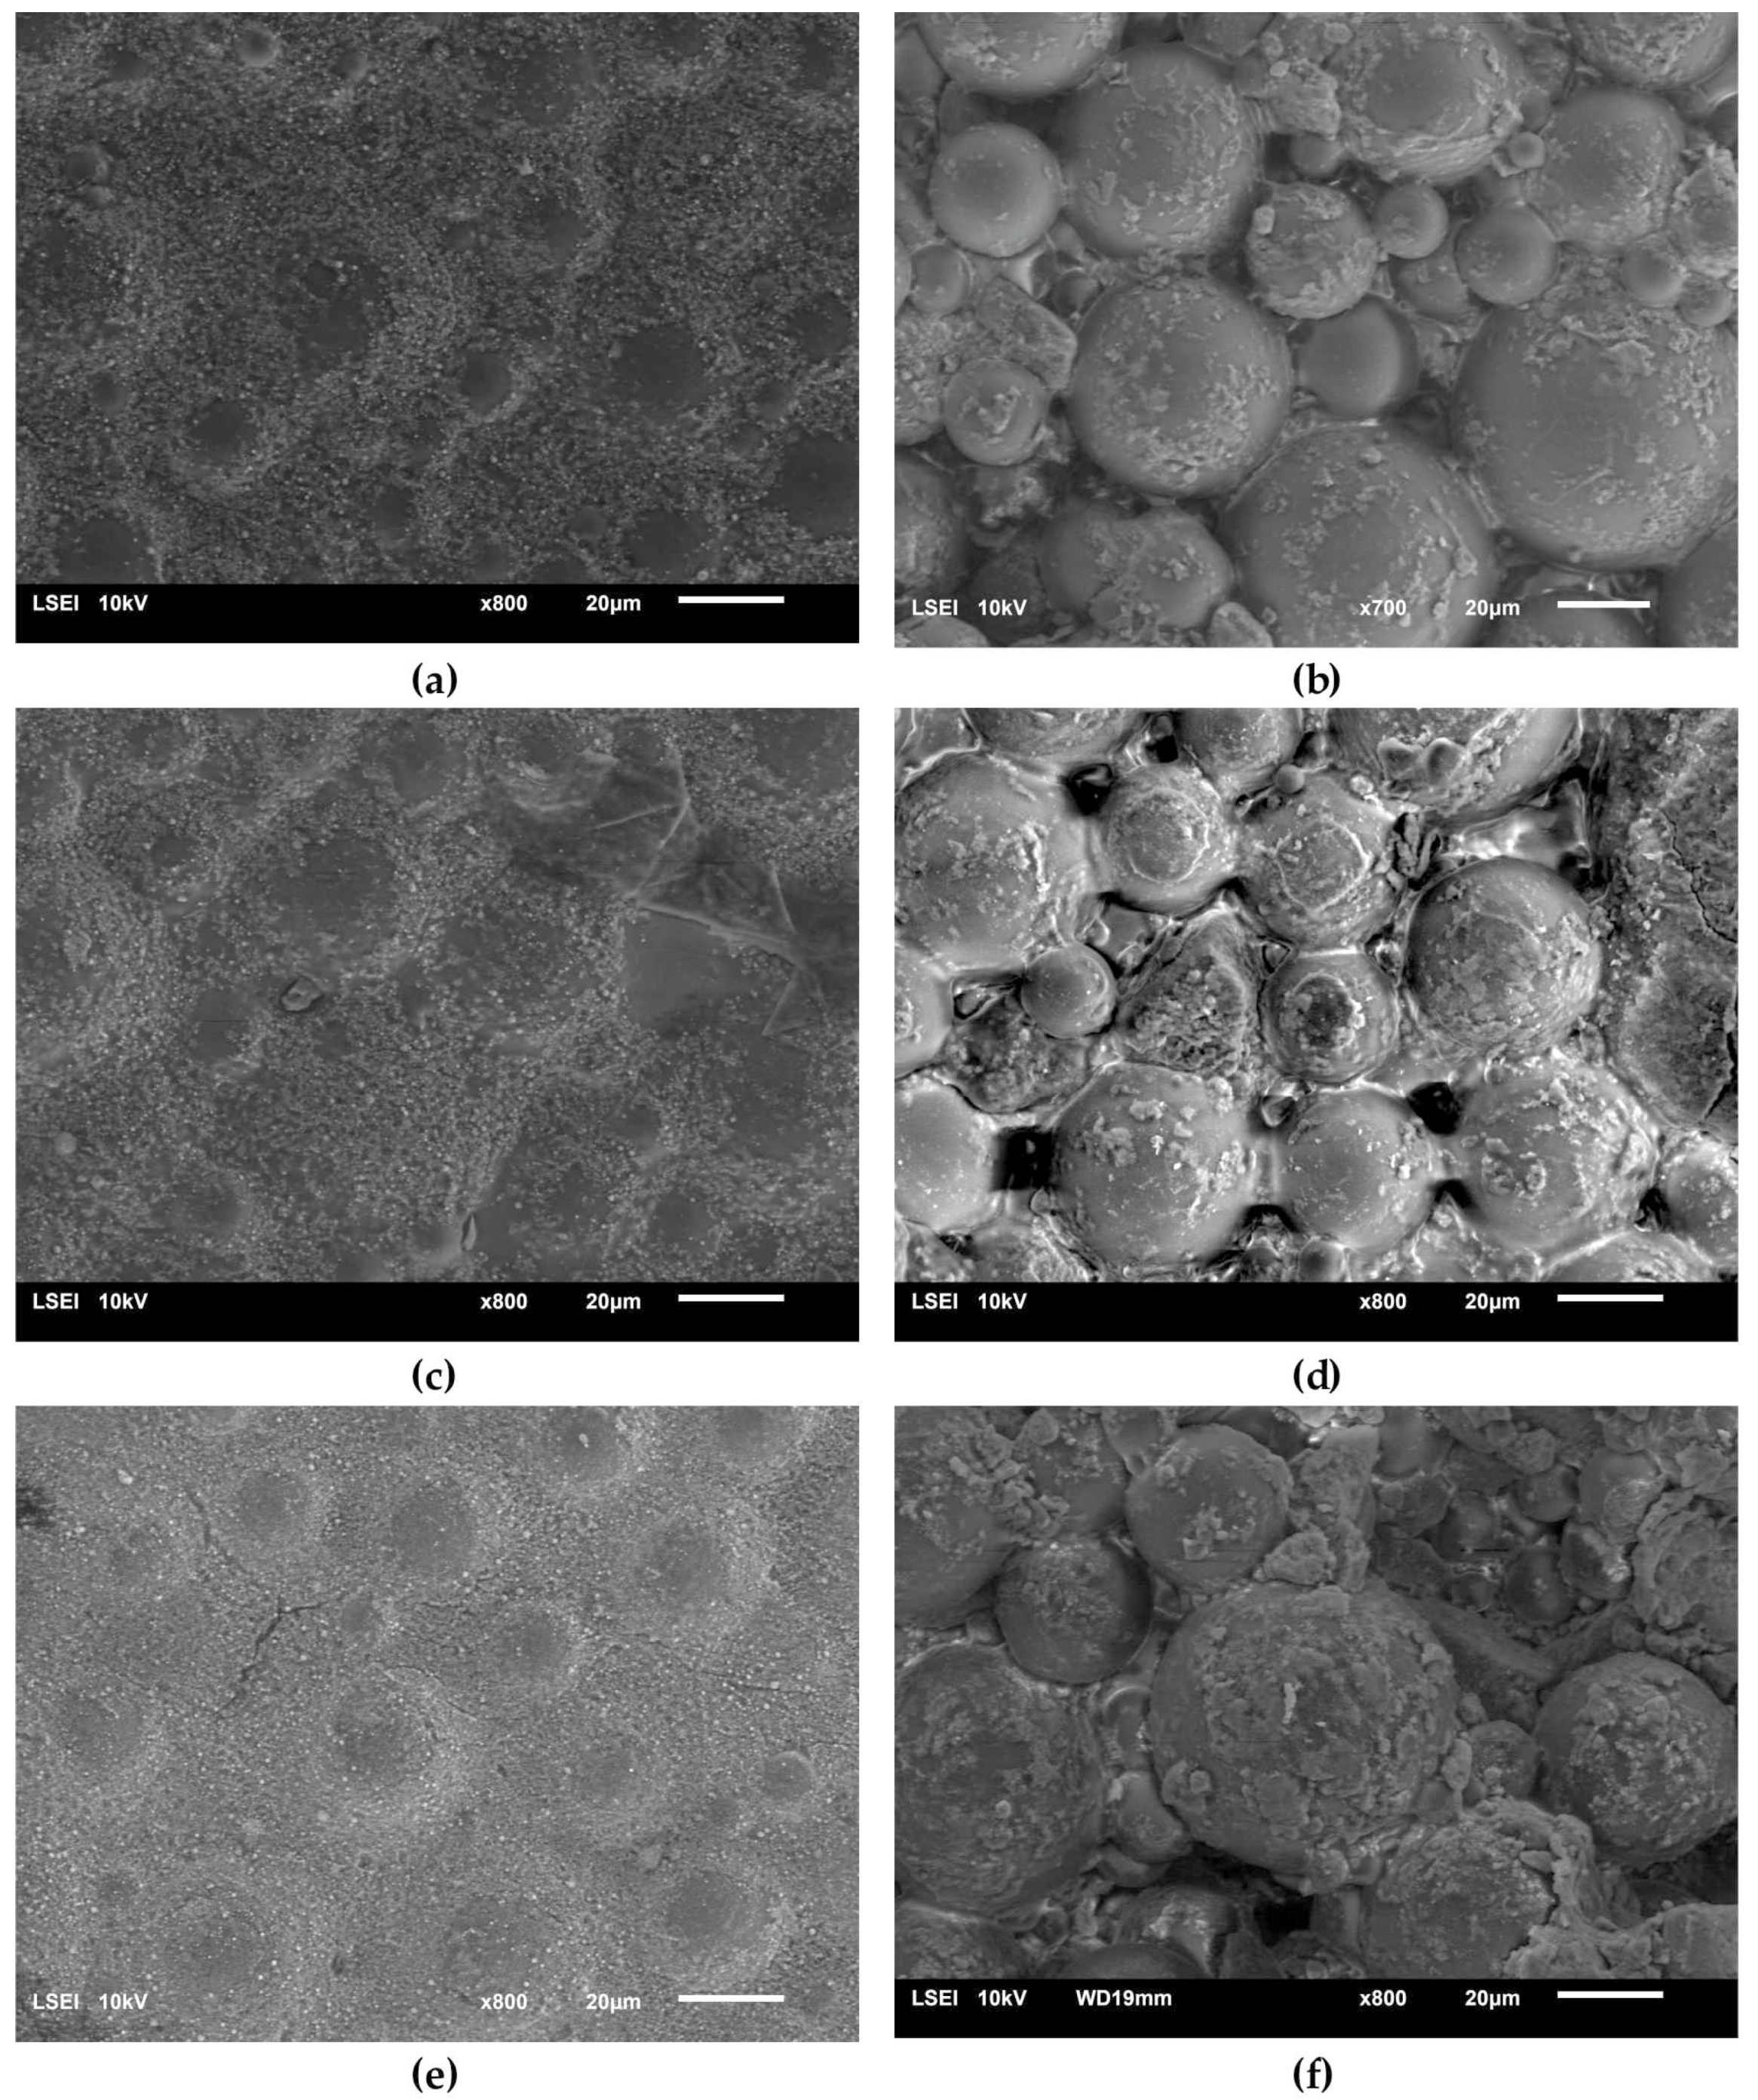
Figure 9 presents the surface micrographs of composites produced with an addition of the hydroxyapatite filler, either nHAp or μHAp. The surface of nHAp-filled composites was similar to that of the nonmodified copolymer. In the material containing 21 weight % of nHAp, a decreased degree of packing of matrix globules was observed with flat areas emerging between the hills. The addition of μHAp brought about larger modifications of a surface morphology, even at low filler concentrations. Clear boundaries between separated globules began to appear, with their size (remaining in the 5–30 μm range) and packing degree independent of the amount of admixed HAp. It is evident from the above micrographs that the form of the HAp filler had a significant influence on the morphology of the acrylate polymer-based composite materials, which was not only related to the size of the filler grains, but also depended on their specific surface area and the size of the surface pores. The surface of µHAp-enriched composite looked like that of the unmodified copolymer. This was the consequence of the fact that the µHAp filler was characterized by more than twice the specific surface area with a large number of mesopores. Being trapped in these macropores, a substantial fraction of monomer molecules was not available for the cross-linking reactions with the resulting formation of cross-linking chains of lower degree of polymerization. In the course of the reaction, however, the growing macromolecules left the filler pores and began to react with the monomer. This process resulted in the formation of a shell around each globule, whose volume increased with the increasing amount of admixed µHAp. A presence of such elements as (hydroxyapatite originating) calcium and phosphorus in the shell material was confirmed with the help of the EDS analysis.
An opposite situation was encountered in the case of nHAp filler, whose structure and low specific surface area determined the unobstructed availability of the monomer, thus making the cross-linking reaction follow the same mechanism as took place in a nonmodified acrylate bone cement.
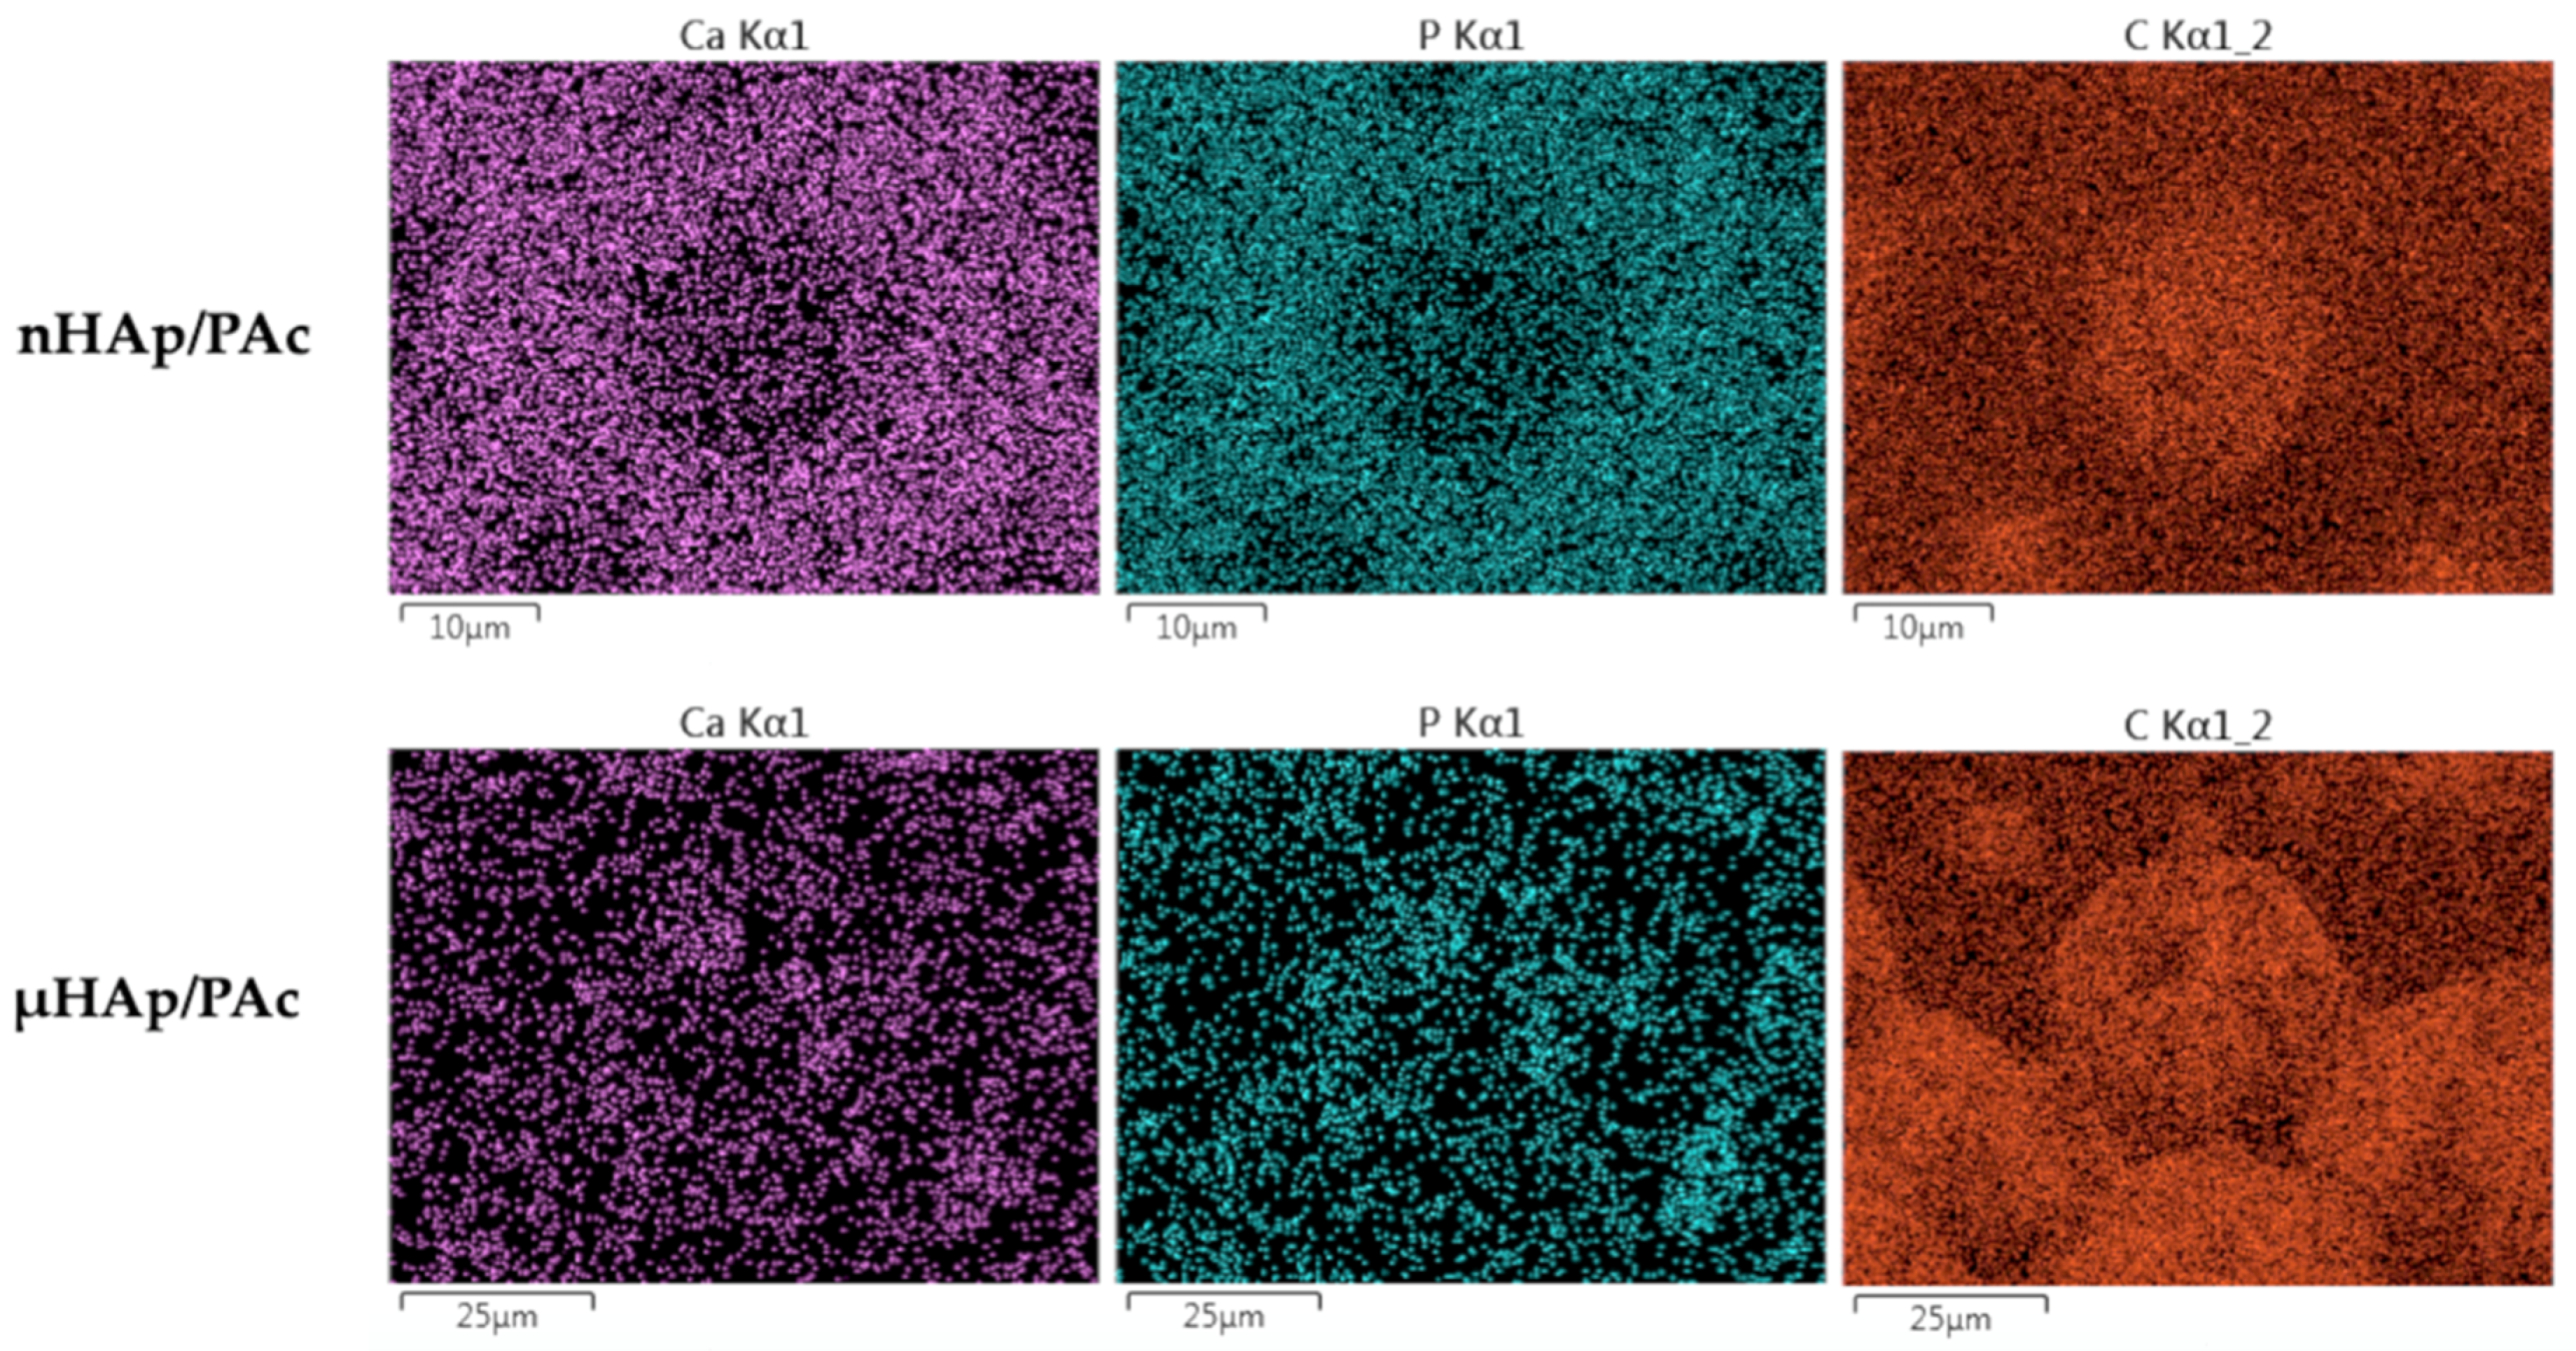
In order to assess the degree of dispersion of the hydroxyapatite filler in a polymer matrix, the surface EDS mapping of the particular composite elements (carbon, calcium, and phosphorus) was performed.
Figure 10 presents examples of that mapping for the nHAp/PAc and μHAp/Pac composites with the filler concentration amounting to 21 weight %.
From the above micrographs it appears that the nHAp powder was mainly localized on the globule boundaries. Due to the small diameters of their particles and low specific surface area, in the cross-linking process the powder was pushed down to the newly formed flat part of the polymer matrix. A situation slightly differed for the μHAp/Pac composite, where the degree of a powder dispersion was high. In that case, the filler could be found both on the surface of the globules and on the deeper polymer fractions. This was the result of the powder surface development leading to better distribution between original, globular fragments of the polymer matrix and those formed in the cross-linking process. It should be stressed here that, at the above mentioned sites, both nano- and microparticles showed no tendency to form large aggregates. This was a likely result of the solvatation of nHAp nanoparticles with the molecules of such a polar monomer as methyl methacrylate. Interactions between polar C=O bonds of the monomer and the phosphate groups in nHAp contributed to the better dispersion of the solid particles. In addition, the growing polymer macromolecules surrounded nHAp particles, thus preventing the interaction between these particles. Both effects contributed to the constraint of the aggregation process. The degree of dispersion was slightly higher in the case of composites filled with nHAp, which was a straightforward consequence of the particle size.
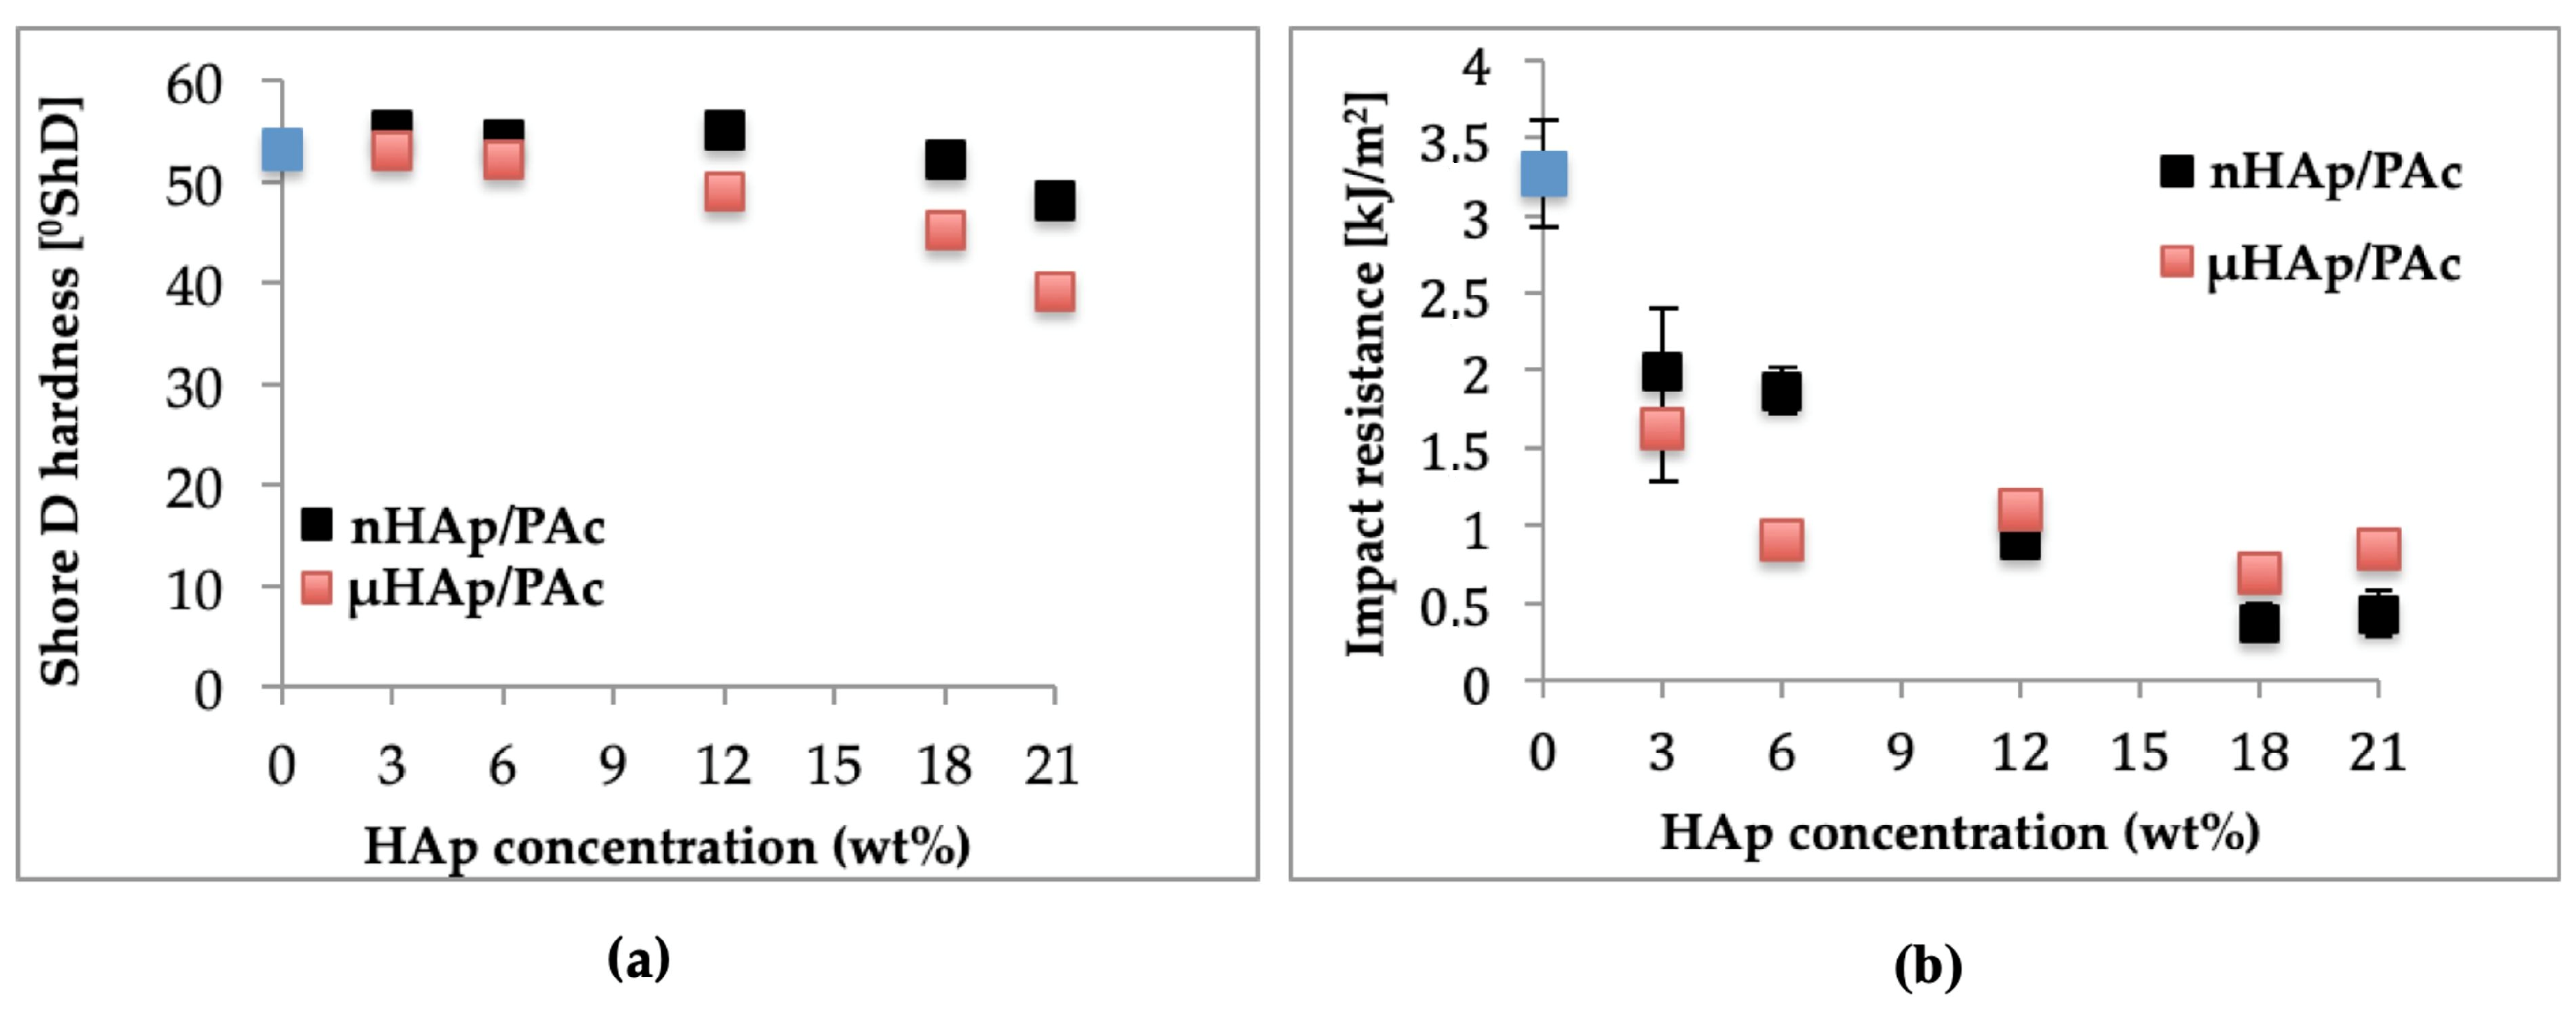
Among utility characteristics of bone cements, the most essential are such mechanical properties as hardness and impact resistance. The magnitudes of these parameters as a function of the HAp additive type and its content in acrylate composites are shown in
Figure 11, below.
Figure 11a presents the respective results of the Shore D hardness (ShD) test. Hardness of the nonmodified acrylate copolymer cement amounted to 53.2 °ShD. The addition of nHAp at 3, 6, and 12 weight % resulted in its slight increase of about 1 °ShD. A rise of the nHAp content to 18 weight % made this parameter decrease to value of 52 °ShD, while its increase by another 3 weight % resulted in further Shore D hardness dropping down to 48 °ShD. All these minor differences were prompted by changes of both surface topography and cross-linking time. To summarize, in the case of the nHAp filler the hardness changes were insignificant from the point of view of the utility properties of acrylate bone cements. Quite different relationships were observed for composites supplemented with microscale HAp. In a way similar to the nanoscale filler, an addition of µHAp at 3, 6, and 12 weight % resulted in hardness figures close to that of a nonmodified cement. Simultaneously, the time of cross-linking reaction was comparable to that of a nonmodified cement. The largest change of hardness (by approximately 15 °ShD) was recorded for the composite containing 21 weight % of the µHAp filler, for which the cross-linking time was nearly twice as long as in the case of the pure acrylate cement. Very likely, these differences were due to a lower degree of polymerization of the cross-linkages resulting from monomer molecules’ adsorption in mesopores and, thus, reducing their availability.
Outcome of the dynamic impact test of manufactured composite materials is shown in
Figure 11b. Impact resistance for a nonmodified bone cement amounted to 3.27 kJ/m
2. Following the addition of 3 and 6 weight % of nHAp, it dropped down to approximately 2 kJ/m
2 and at 12 weight % it amounted to 0.9 kJ/m
2, whereas for the highest concentration (21 weight %) it decreased to the magnitude of 0.4 kJ/m
2. In the case of composites filled with microscale HAp, a larger drop of impact strength was observed at lower filler concentrations attained. Above 12 weight % of the filler, the respective values remained in the range of 1.1 to 0.7 kJ/m
2.
As seen above, the introduction of filler particles to polymer matrix substantially lowered impact strength of the resulting composites. This effect was connected with insufficient adhesion at the phase boundaries and the size of the interphase area. As was shown earlier in this work, specific surface area of microscale hydroxyapatite was more than five times larger than that of nHAp. This difference resulted in lowering the rate of cross-linking reaction and following the deterioration of the composite mechanical properties. A lower reaction rate signified a decrease of both hardness and impact strength.

 ,
, 


