Figure 1.
Apparatus for grouting and direct shear test: (a) schematic diagram and (b) photograph of the test setup.
Figure 1.
Apparatus for grouting and direct shear test: (a) schematic diagram and (b) photograph of the test setup.
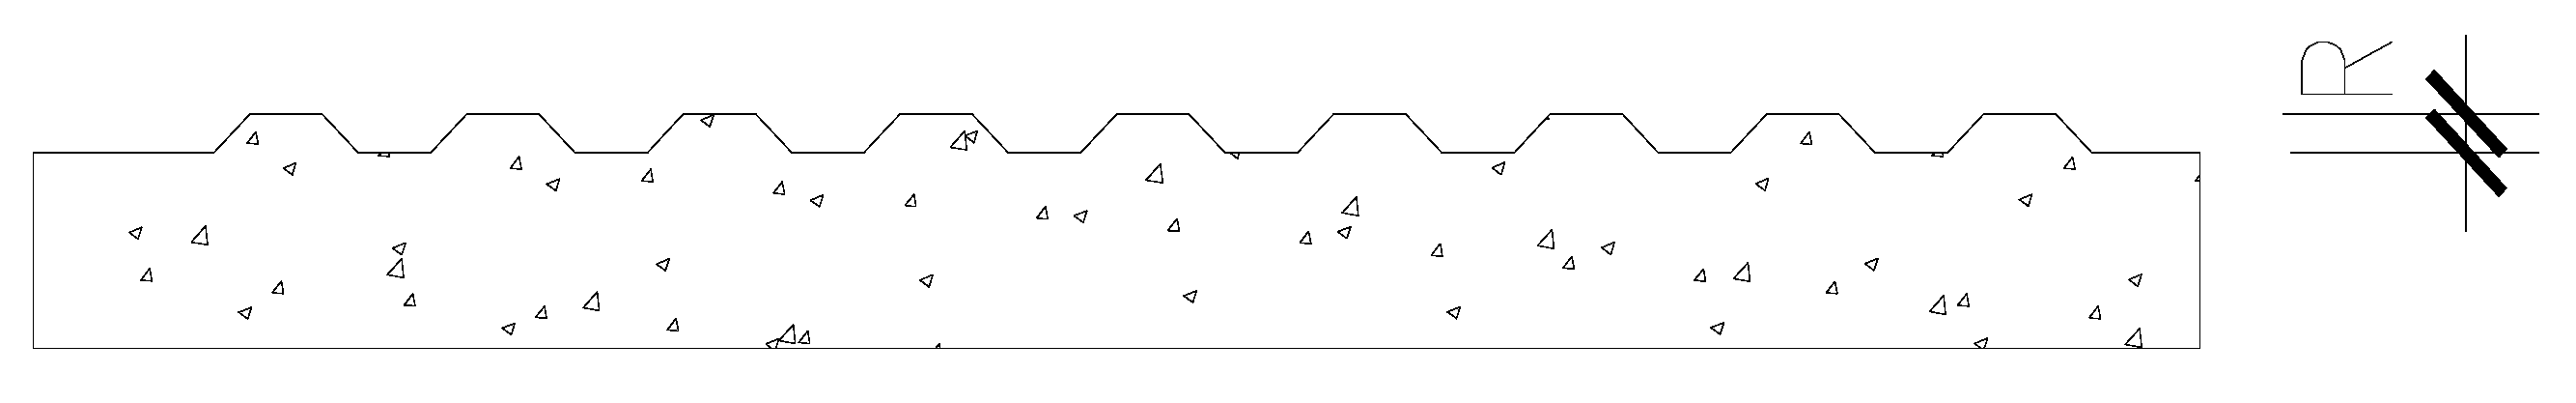
Figure 2.
Roughness definition.
Figure 2.
Roughness definition.
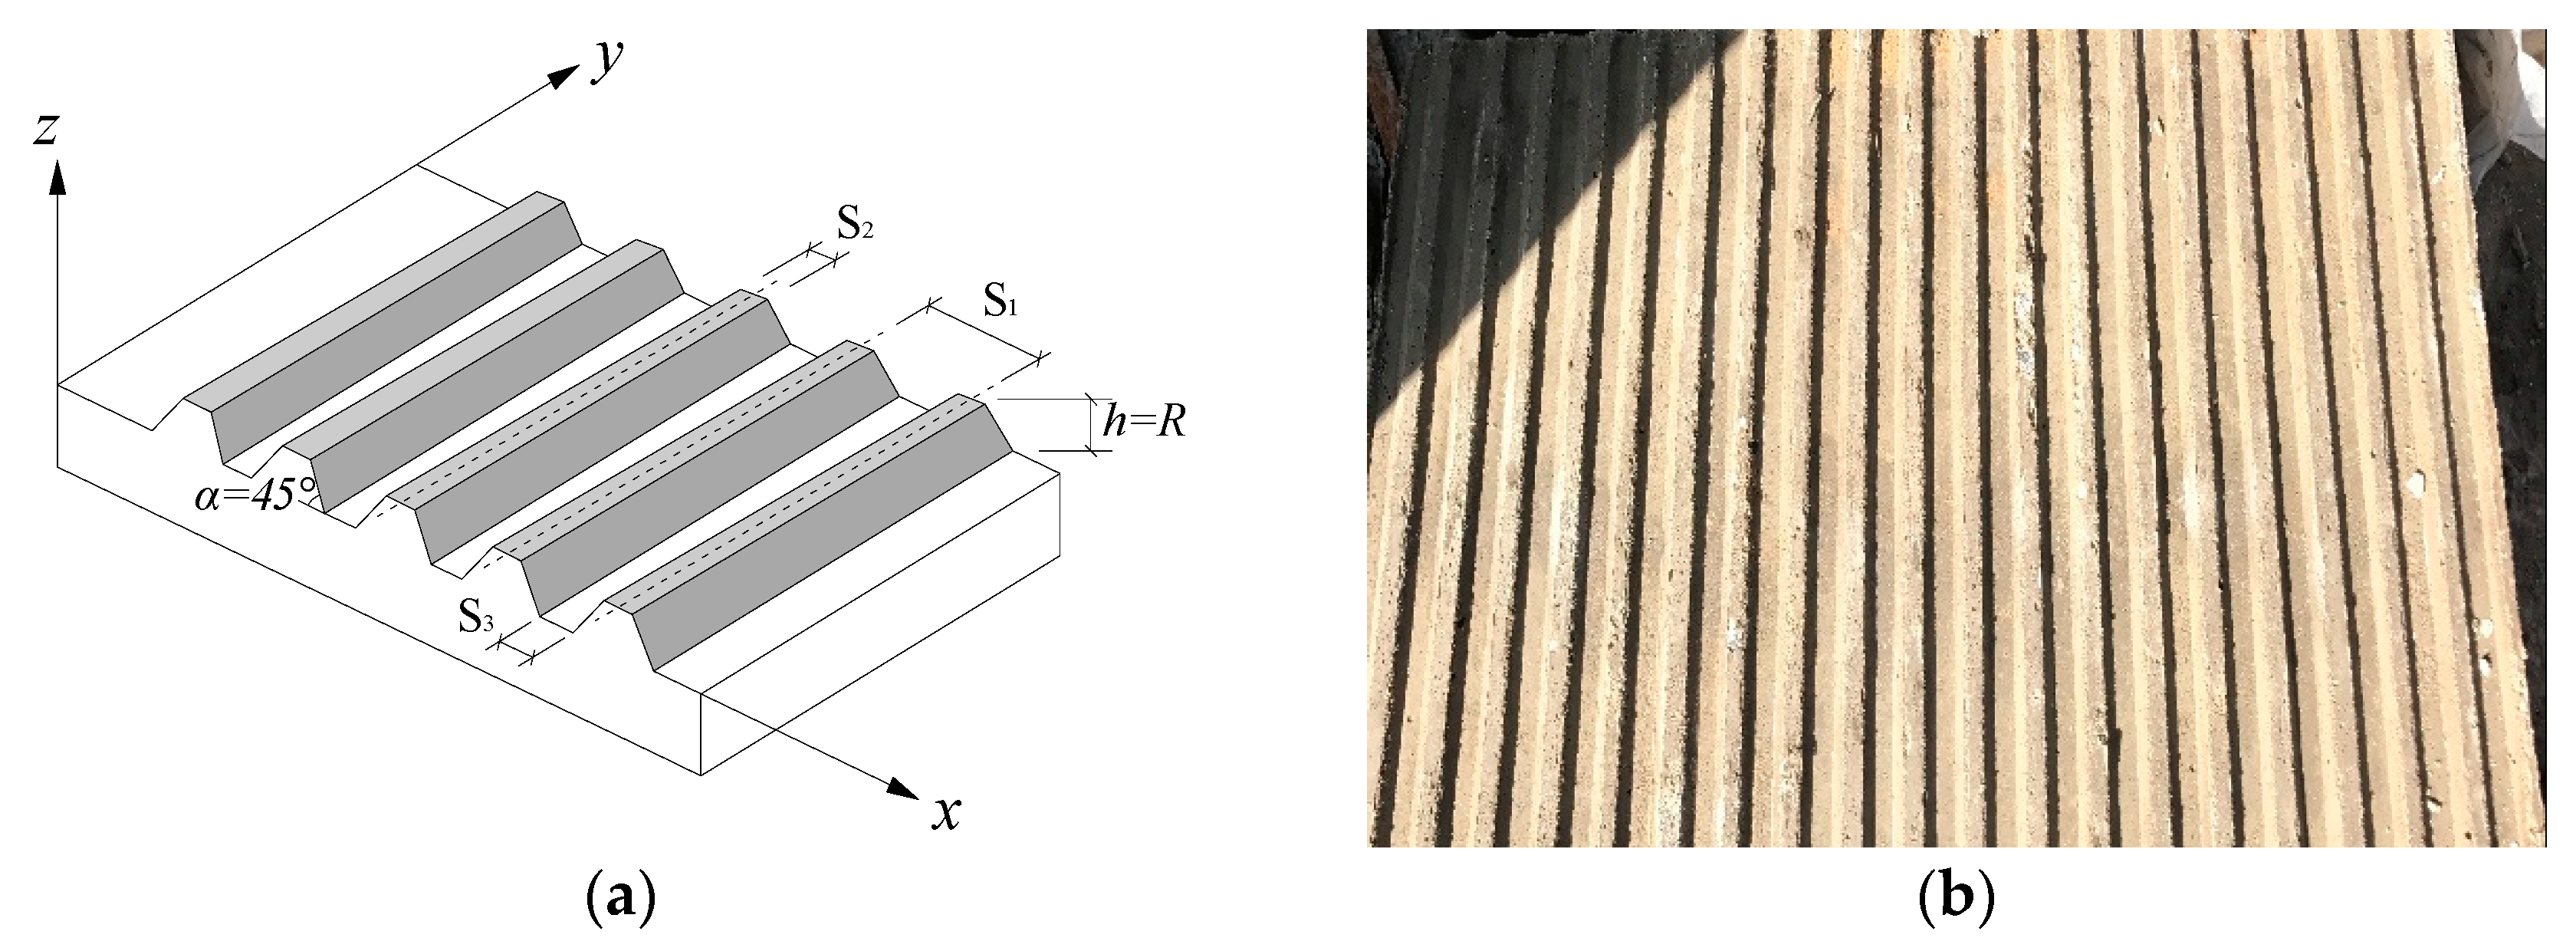
Figure 3.
Schematic diagram and photograph of the concrete plate: (a) schematic diagram; (b) photograph of the concrete plate.
Figure 3.
Schematic diagram and photograph of the concrete plate: (a) schematic diagram; (b) photograph of the concrete plate.
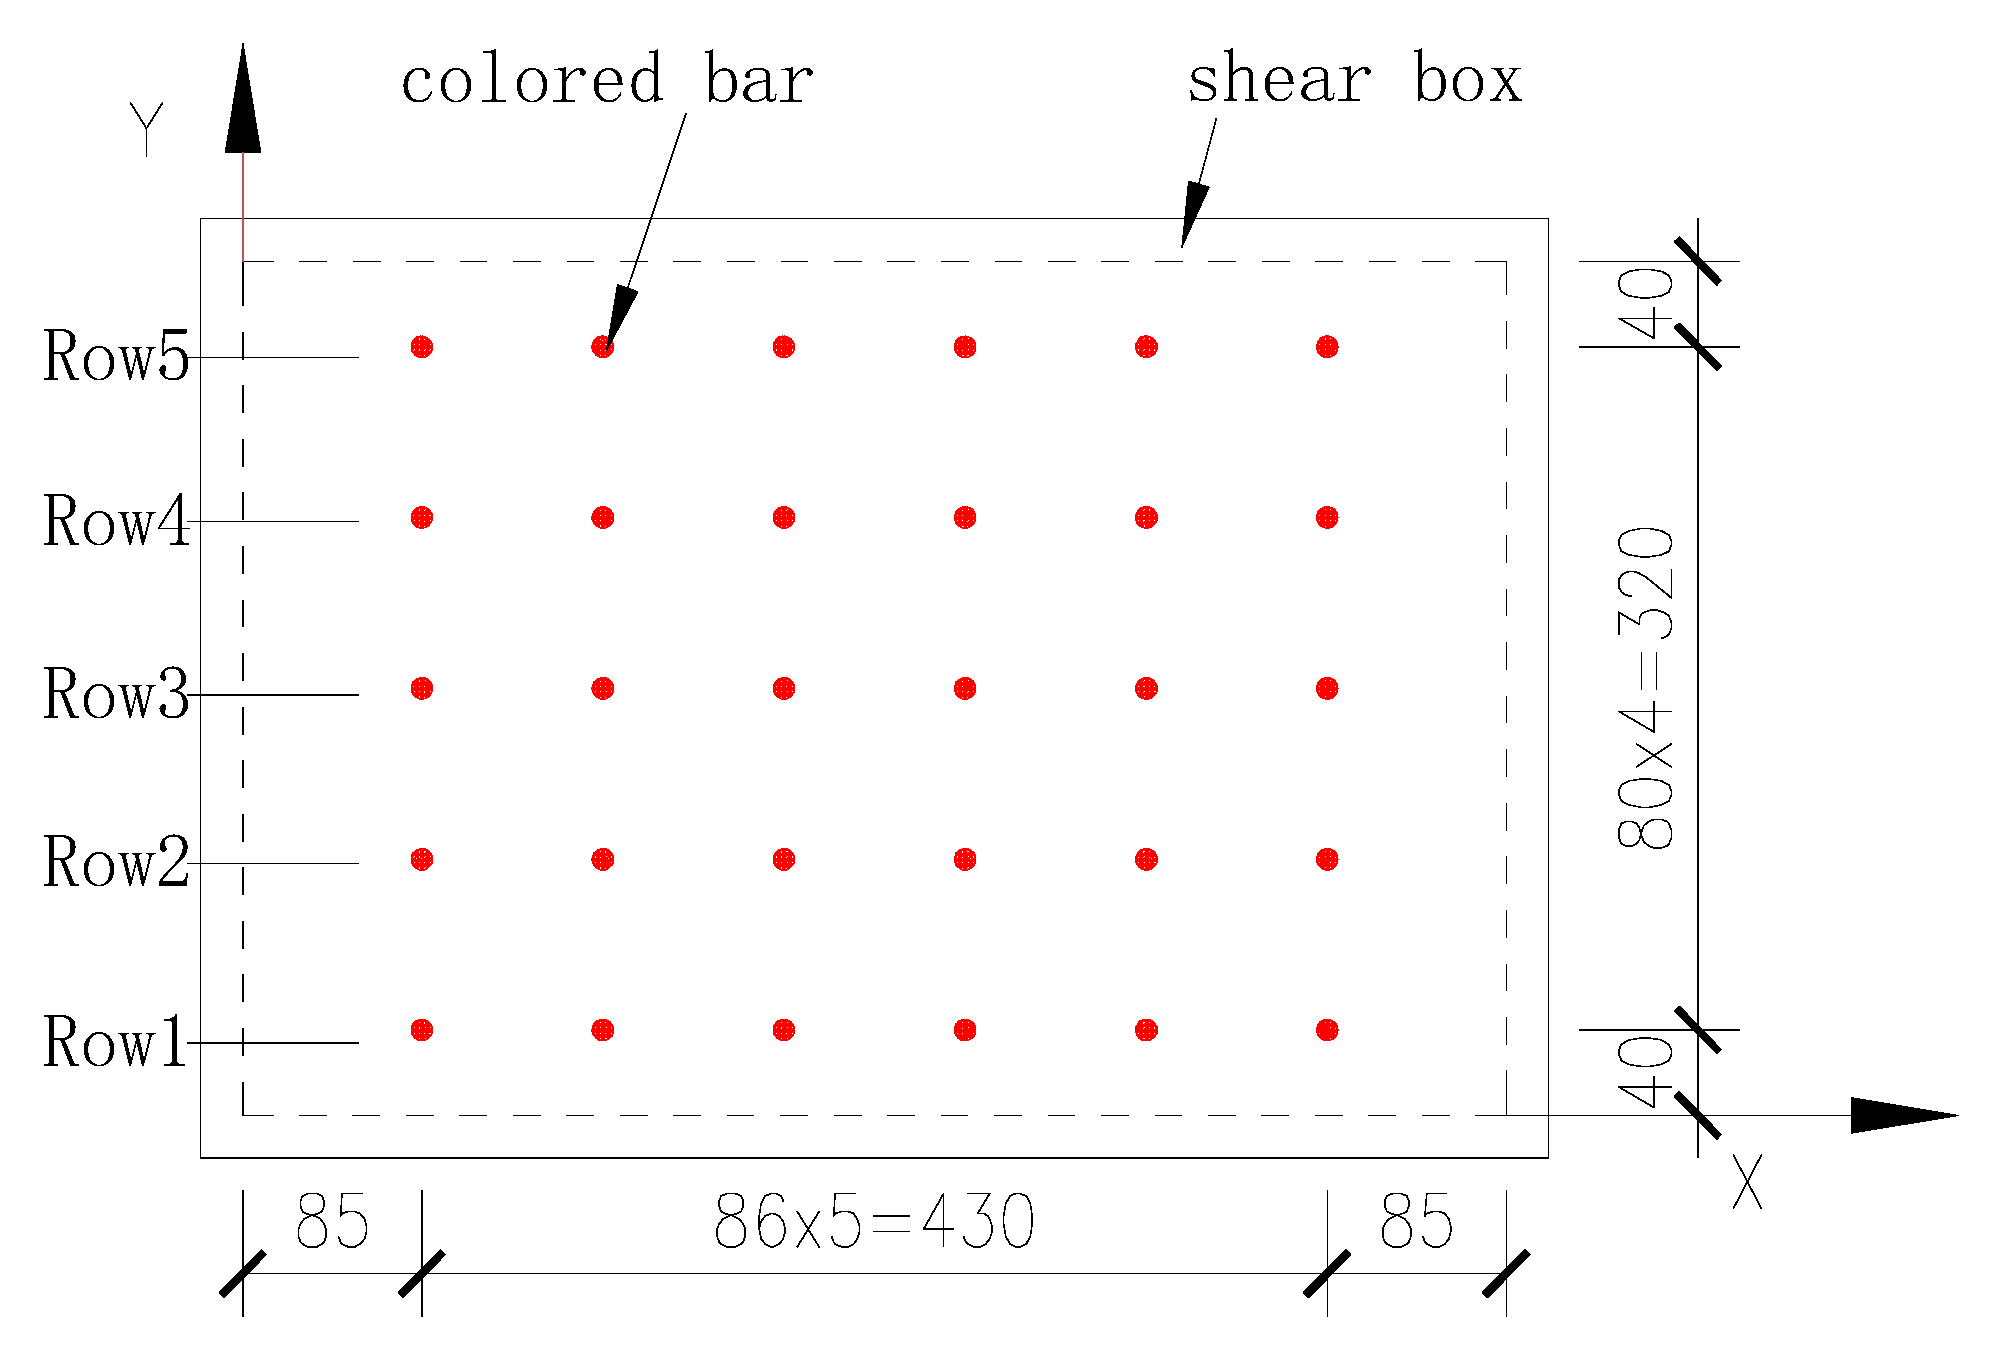
Figure 4.
Distribution of colored bars in the upper shear box soil (units: mm).
Figure 4.
Distribution of colored bars in the upper shear box soil (units: mm).
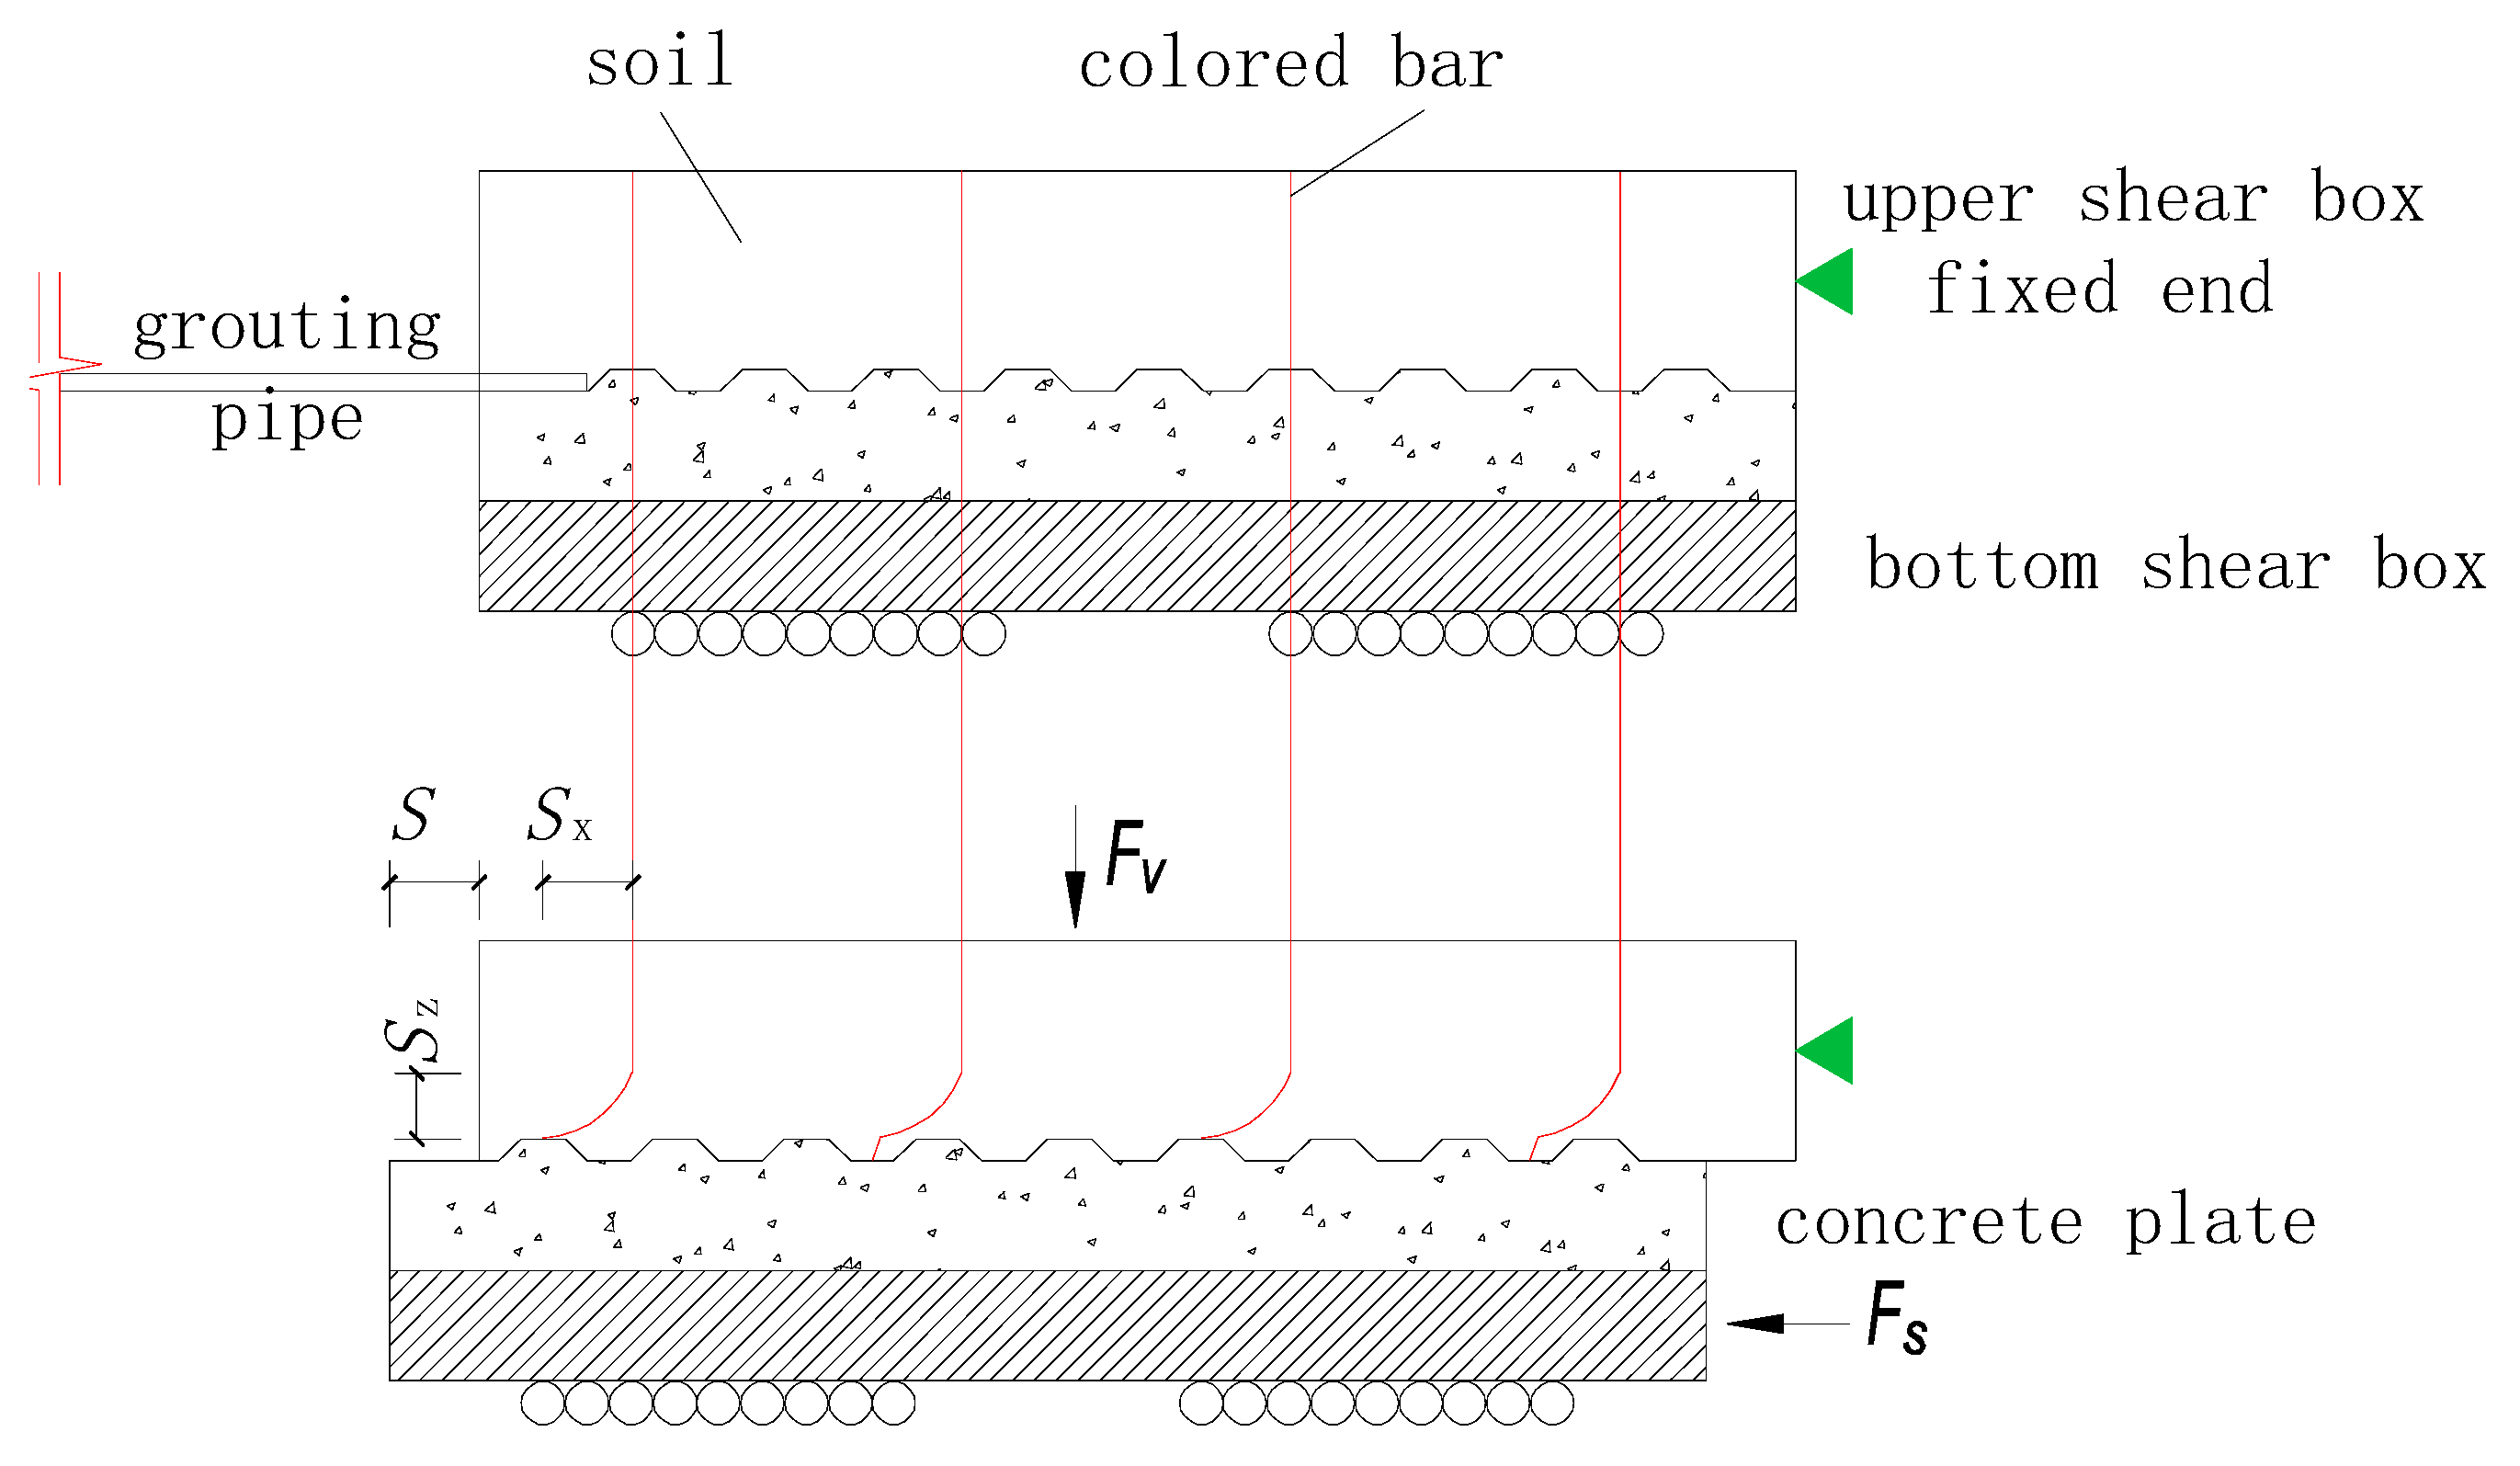
Figure 5.
Schematic diagram of the shearing process and formation of the shear band.
Figure 5.
Schematic diagram of the shearing process and formation of the shear band.
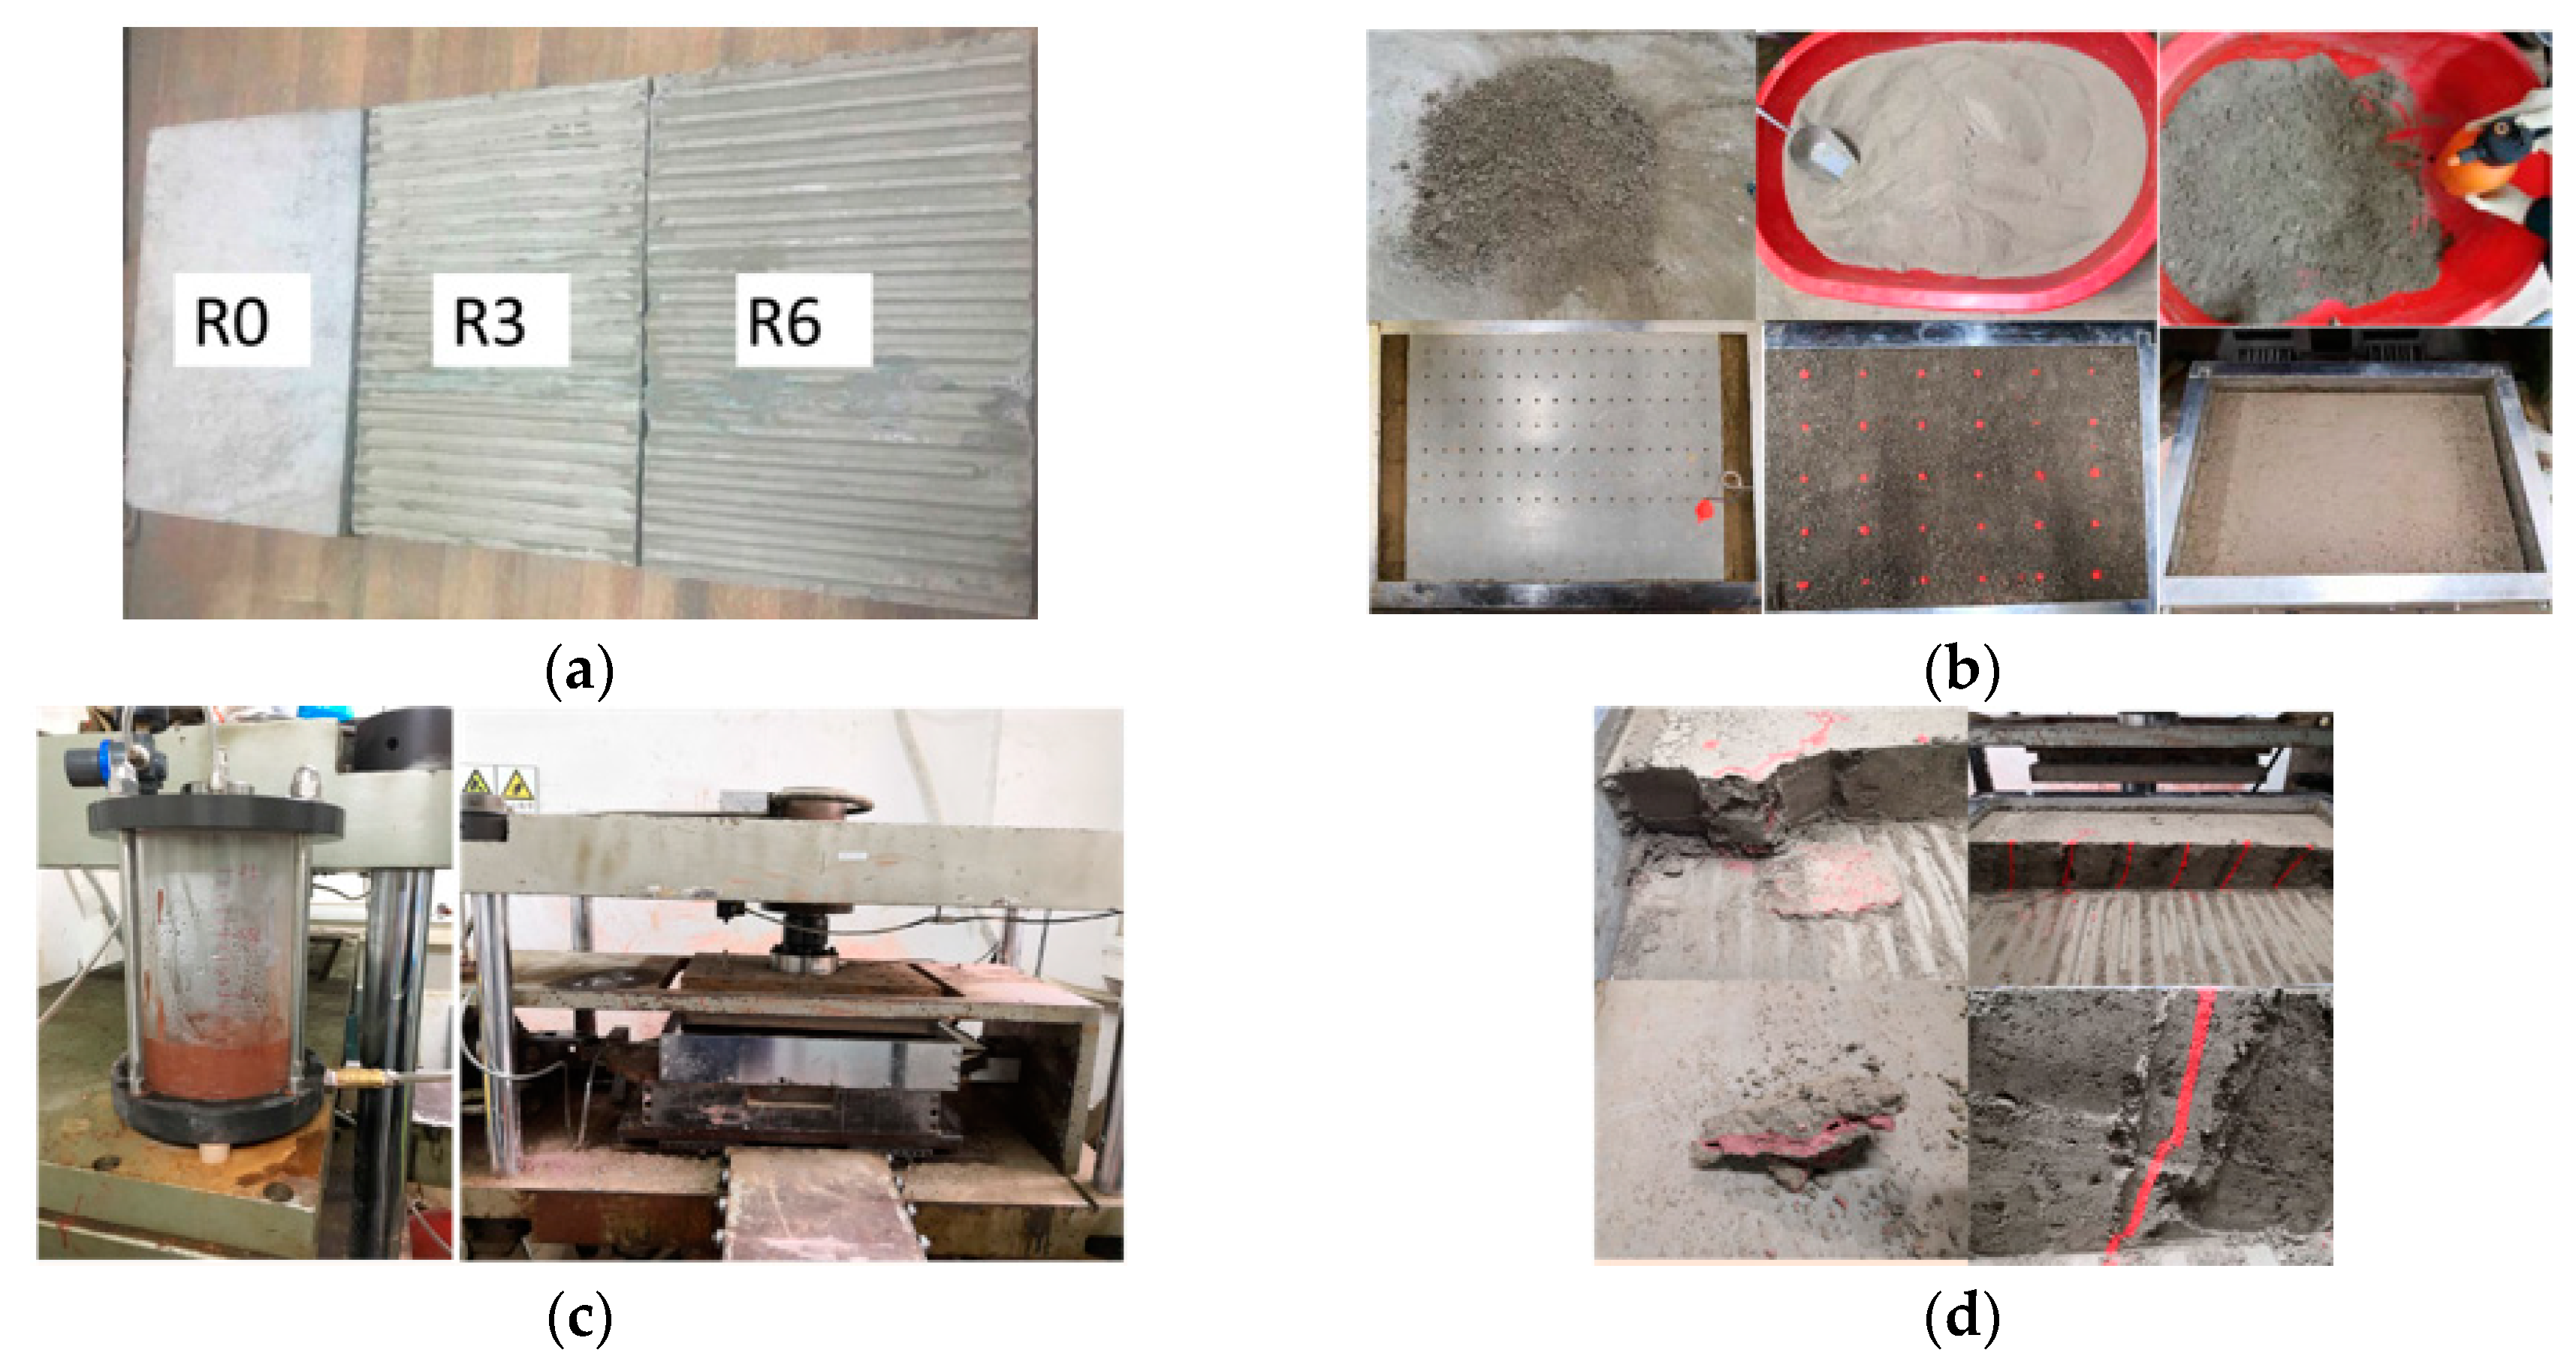
Figure 6.
Main test procedures. (a) Concrete plate, (b) Soil, punching, colored bar, (c) Loading, consolidation, grouting, curing, and shearing, (d) Cutting, observation, and measurement.
Figure 6.
Main test procedures. (a) Concrete plate, (b) Soil, punching, colored bar, (c) Loading, consolidation, grouting, curing, and shearing, (d) Cutting, observation, and measurement.
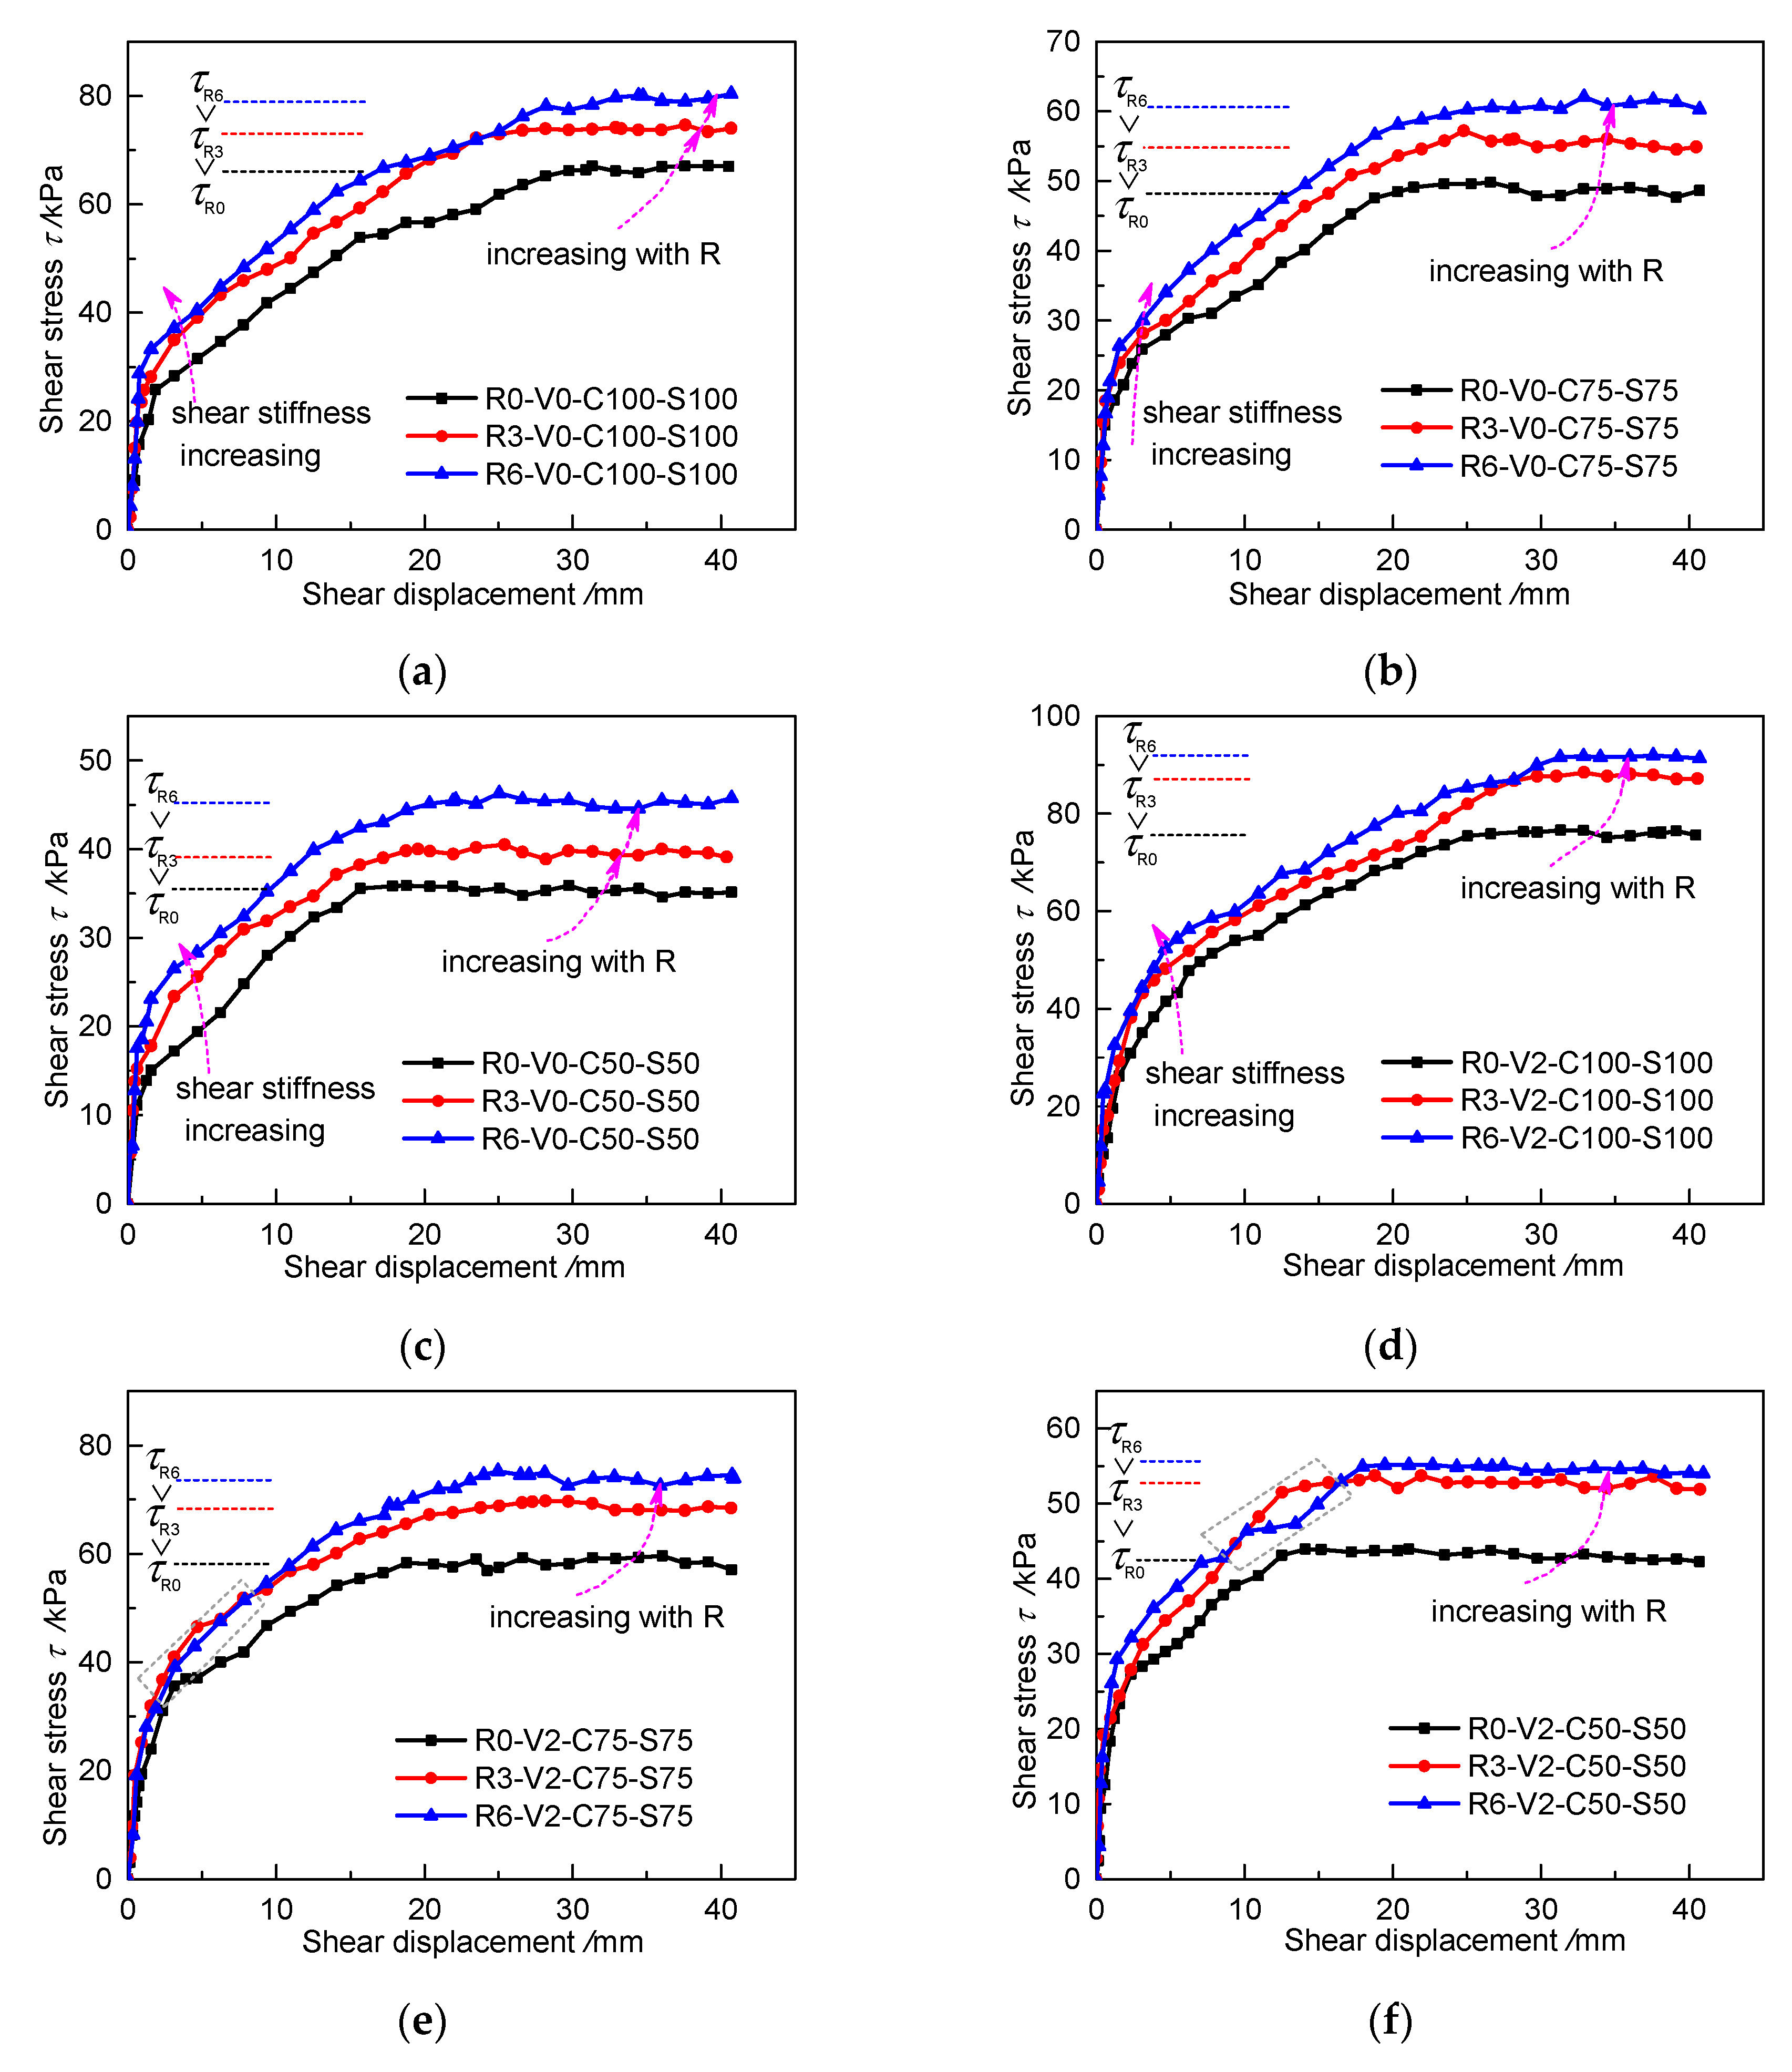
Figure 7.
Shear stress–displacement curves (τ–s curves) for specimens with different roughness values in different cases: (a) V0, C100 and S100; (b) V0, C75 and S75; (c) V0, C50 and S50; (d) V2, C100 and S100; (e) V2, C75 and S75; (f) V2, C50 and S50.
Figure 7.
Shear stress–displacement curves (τ–s curves) for specimens with different roughness values in different cases: (a) V0, C100 and S100; (b) V0, C75 and S75; (c) V0, C50 and S50; (d) V2, C100 and S100; (e) V2, C75 and S75; (f) V2, C50 and S50.
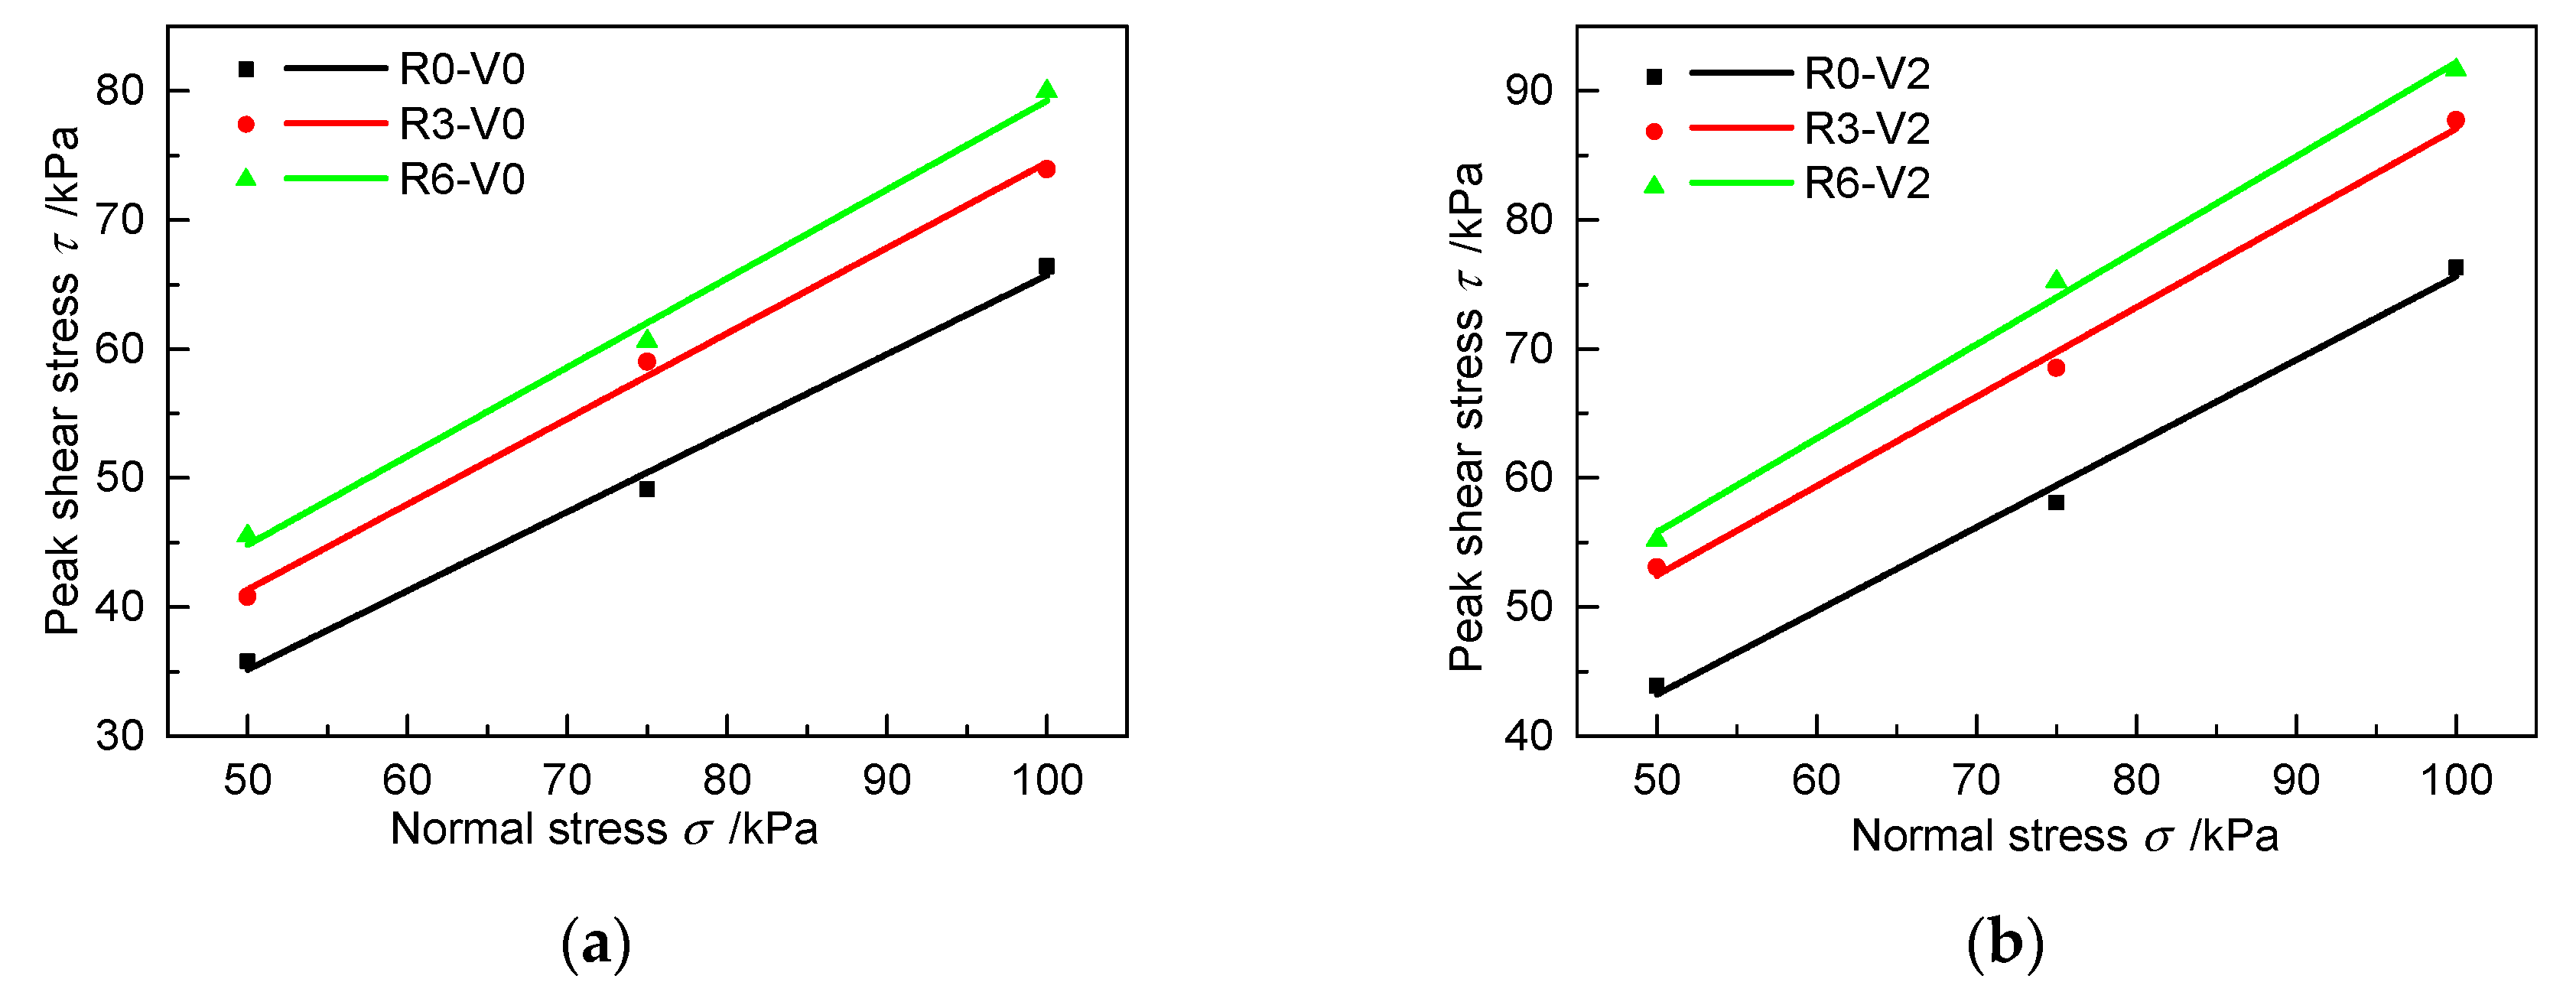
Figure 8.
Fitted curves between peak shear stress and normal stress with different roughness values in different grouting cases: (a) V0 and (b) V2.
Figure 8.
Fitted curves between peak shear stress and normal stress with different roughness values in different grouting cases: (a) V0 and (b) V2.
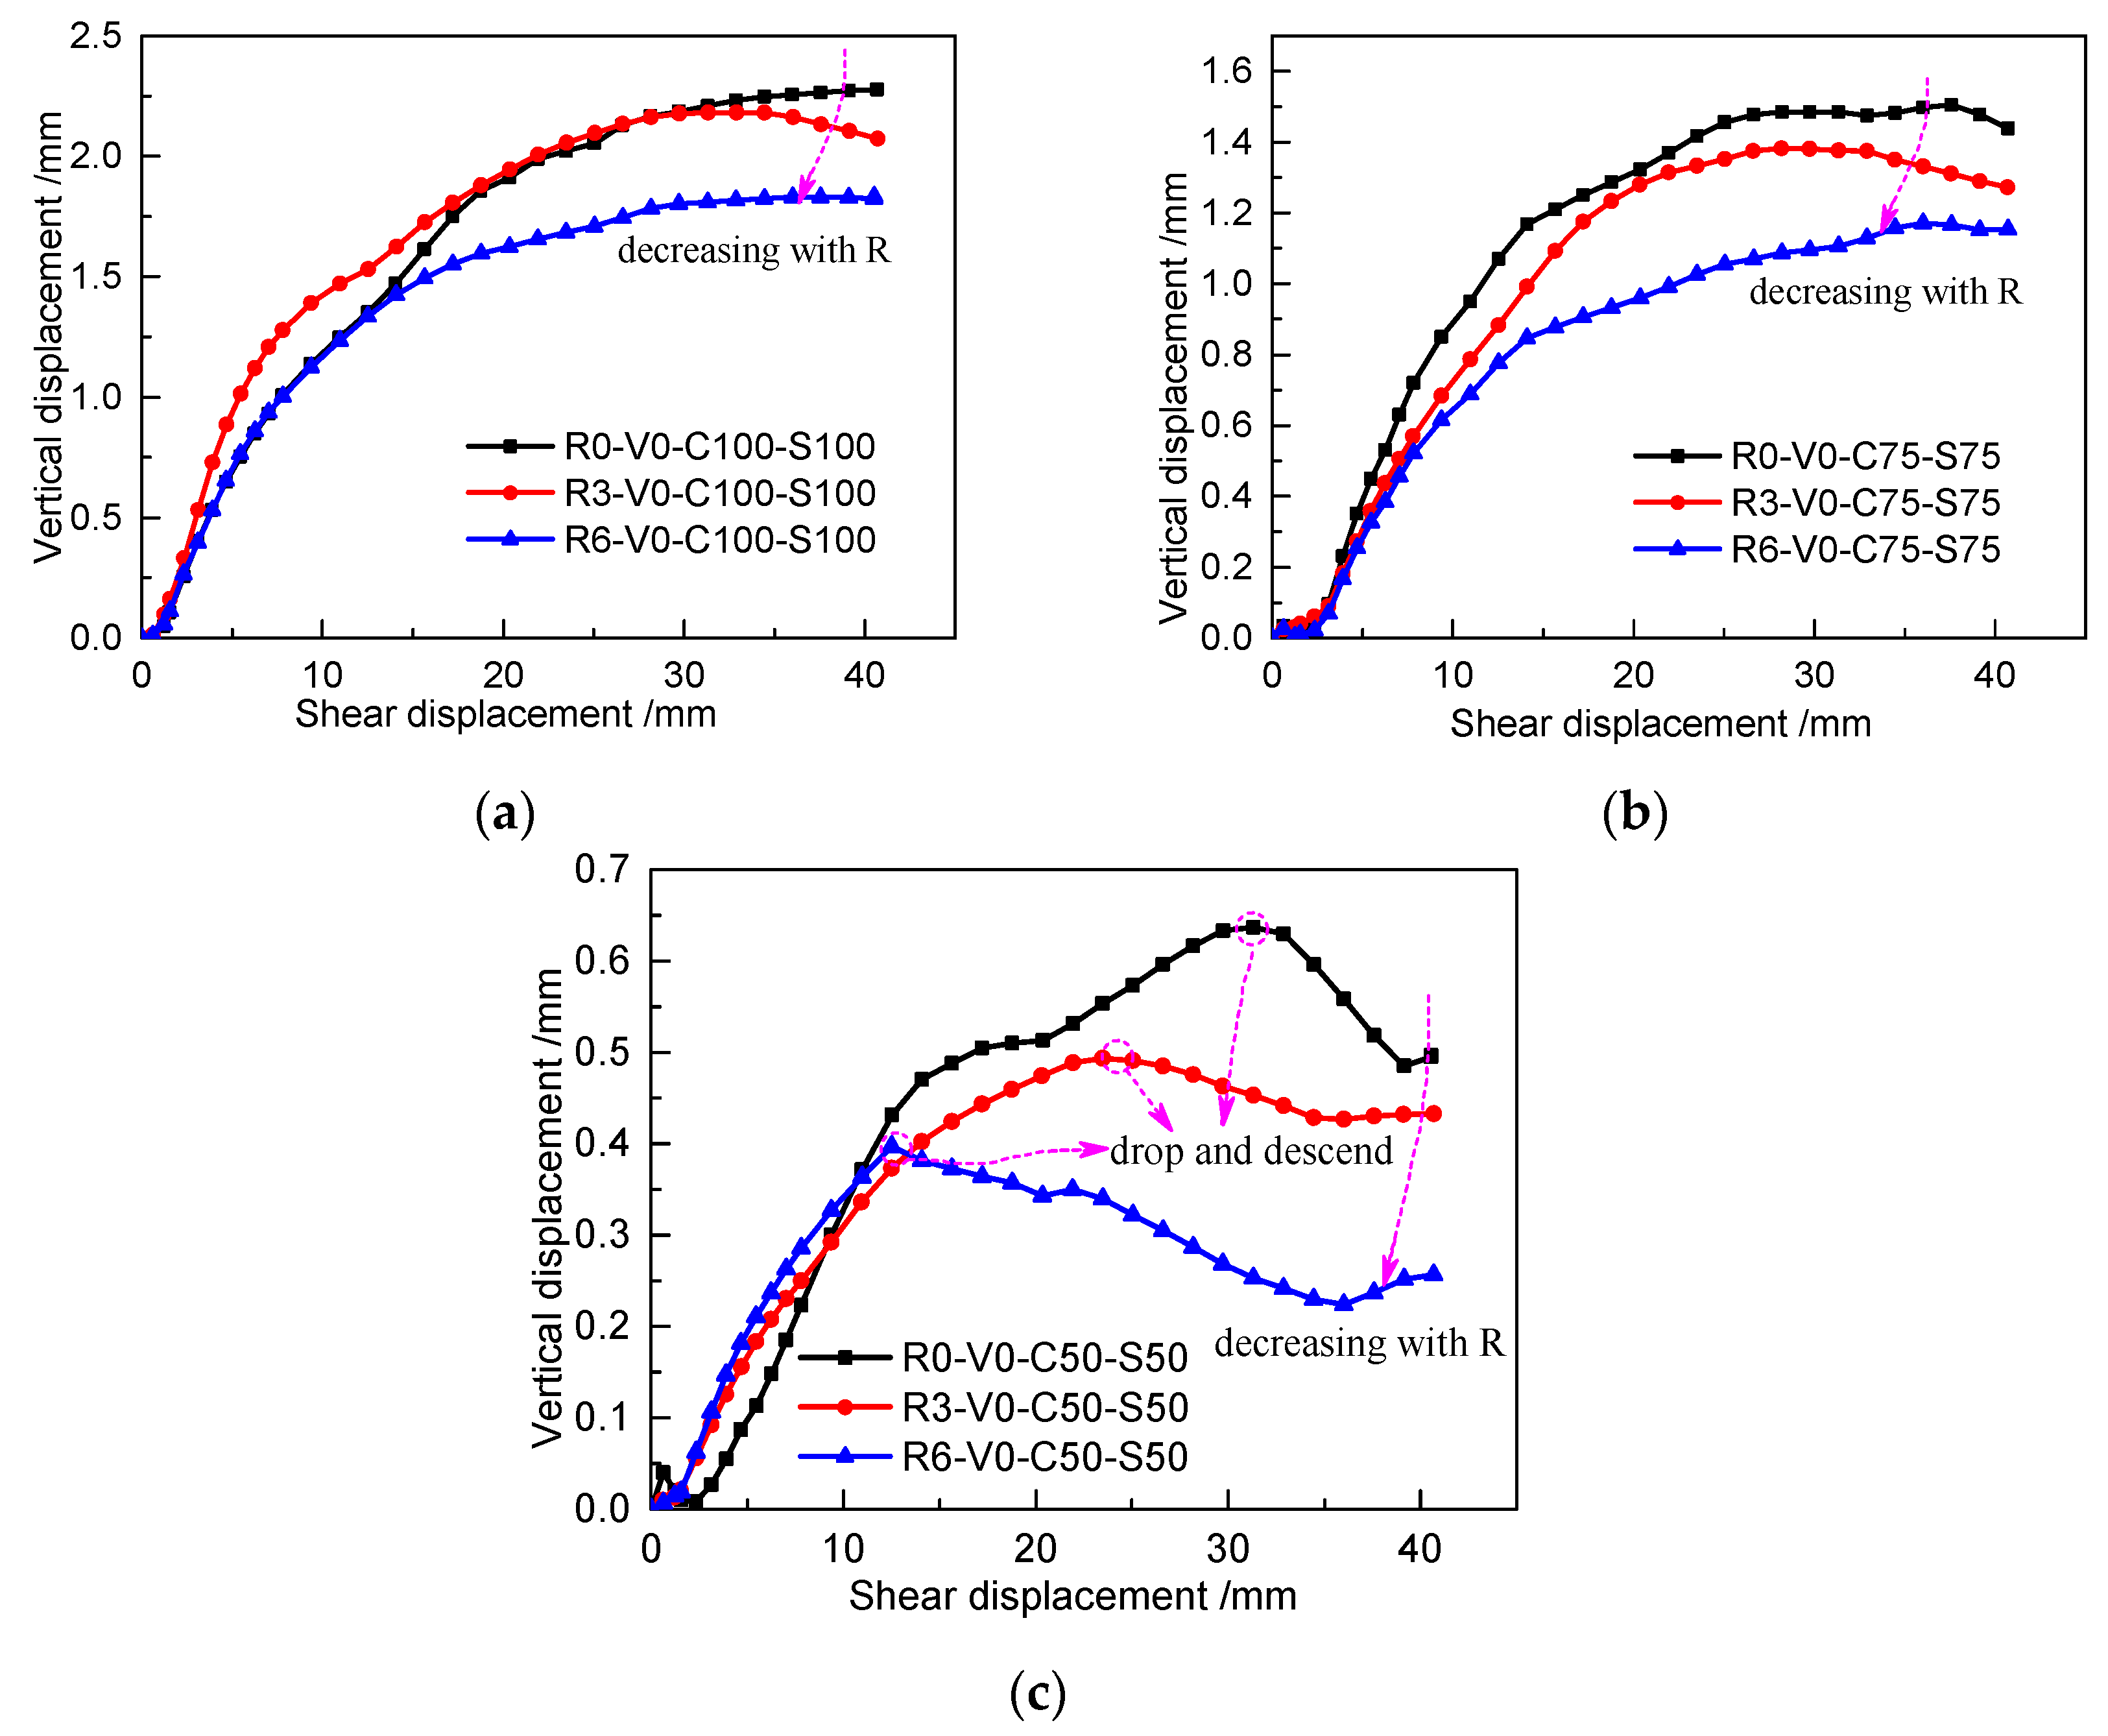
Figure 9.
Dilation/shrinkage varying with different roughness values in different loading cases: (a) C100 and S100, (b) C75 and S75, and (c) C50 and S50.
Figure 9.
Dilation/shrinkage varying with different roughness values in different loading cases: (a) C100 and S100, (b) C75 and S75, and (c) C50 and S50.
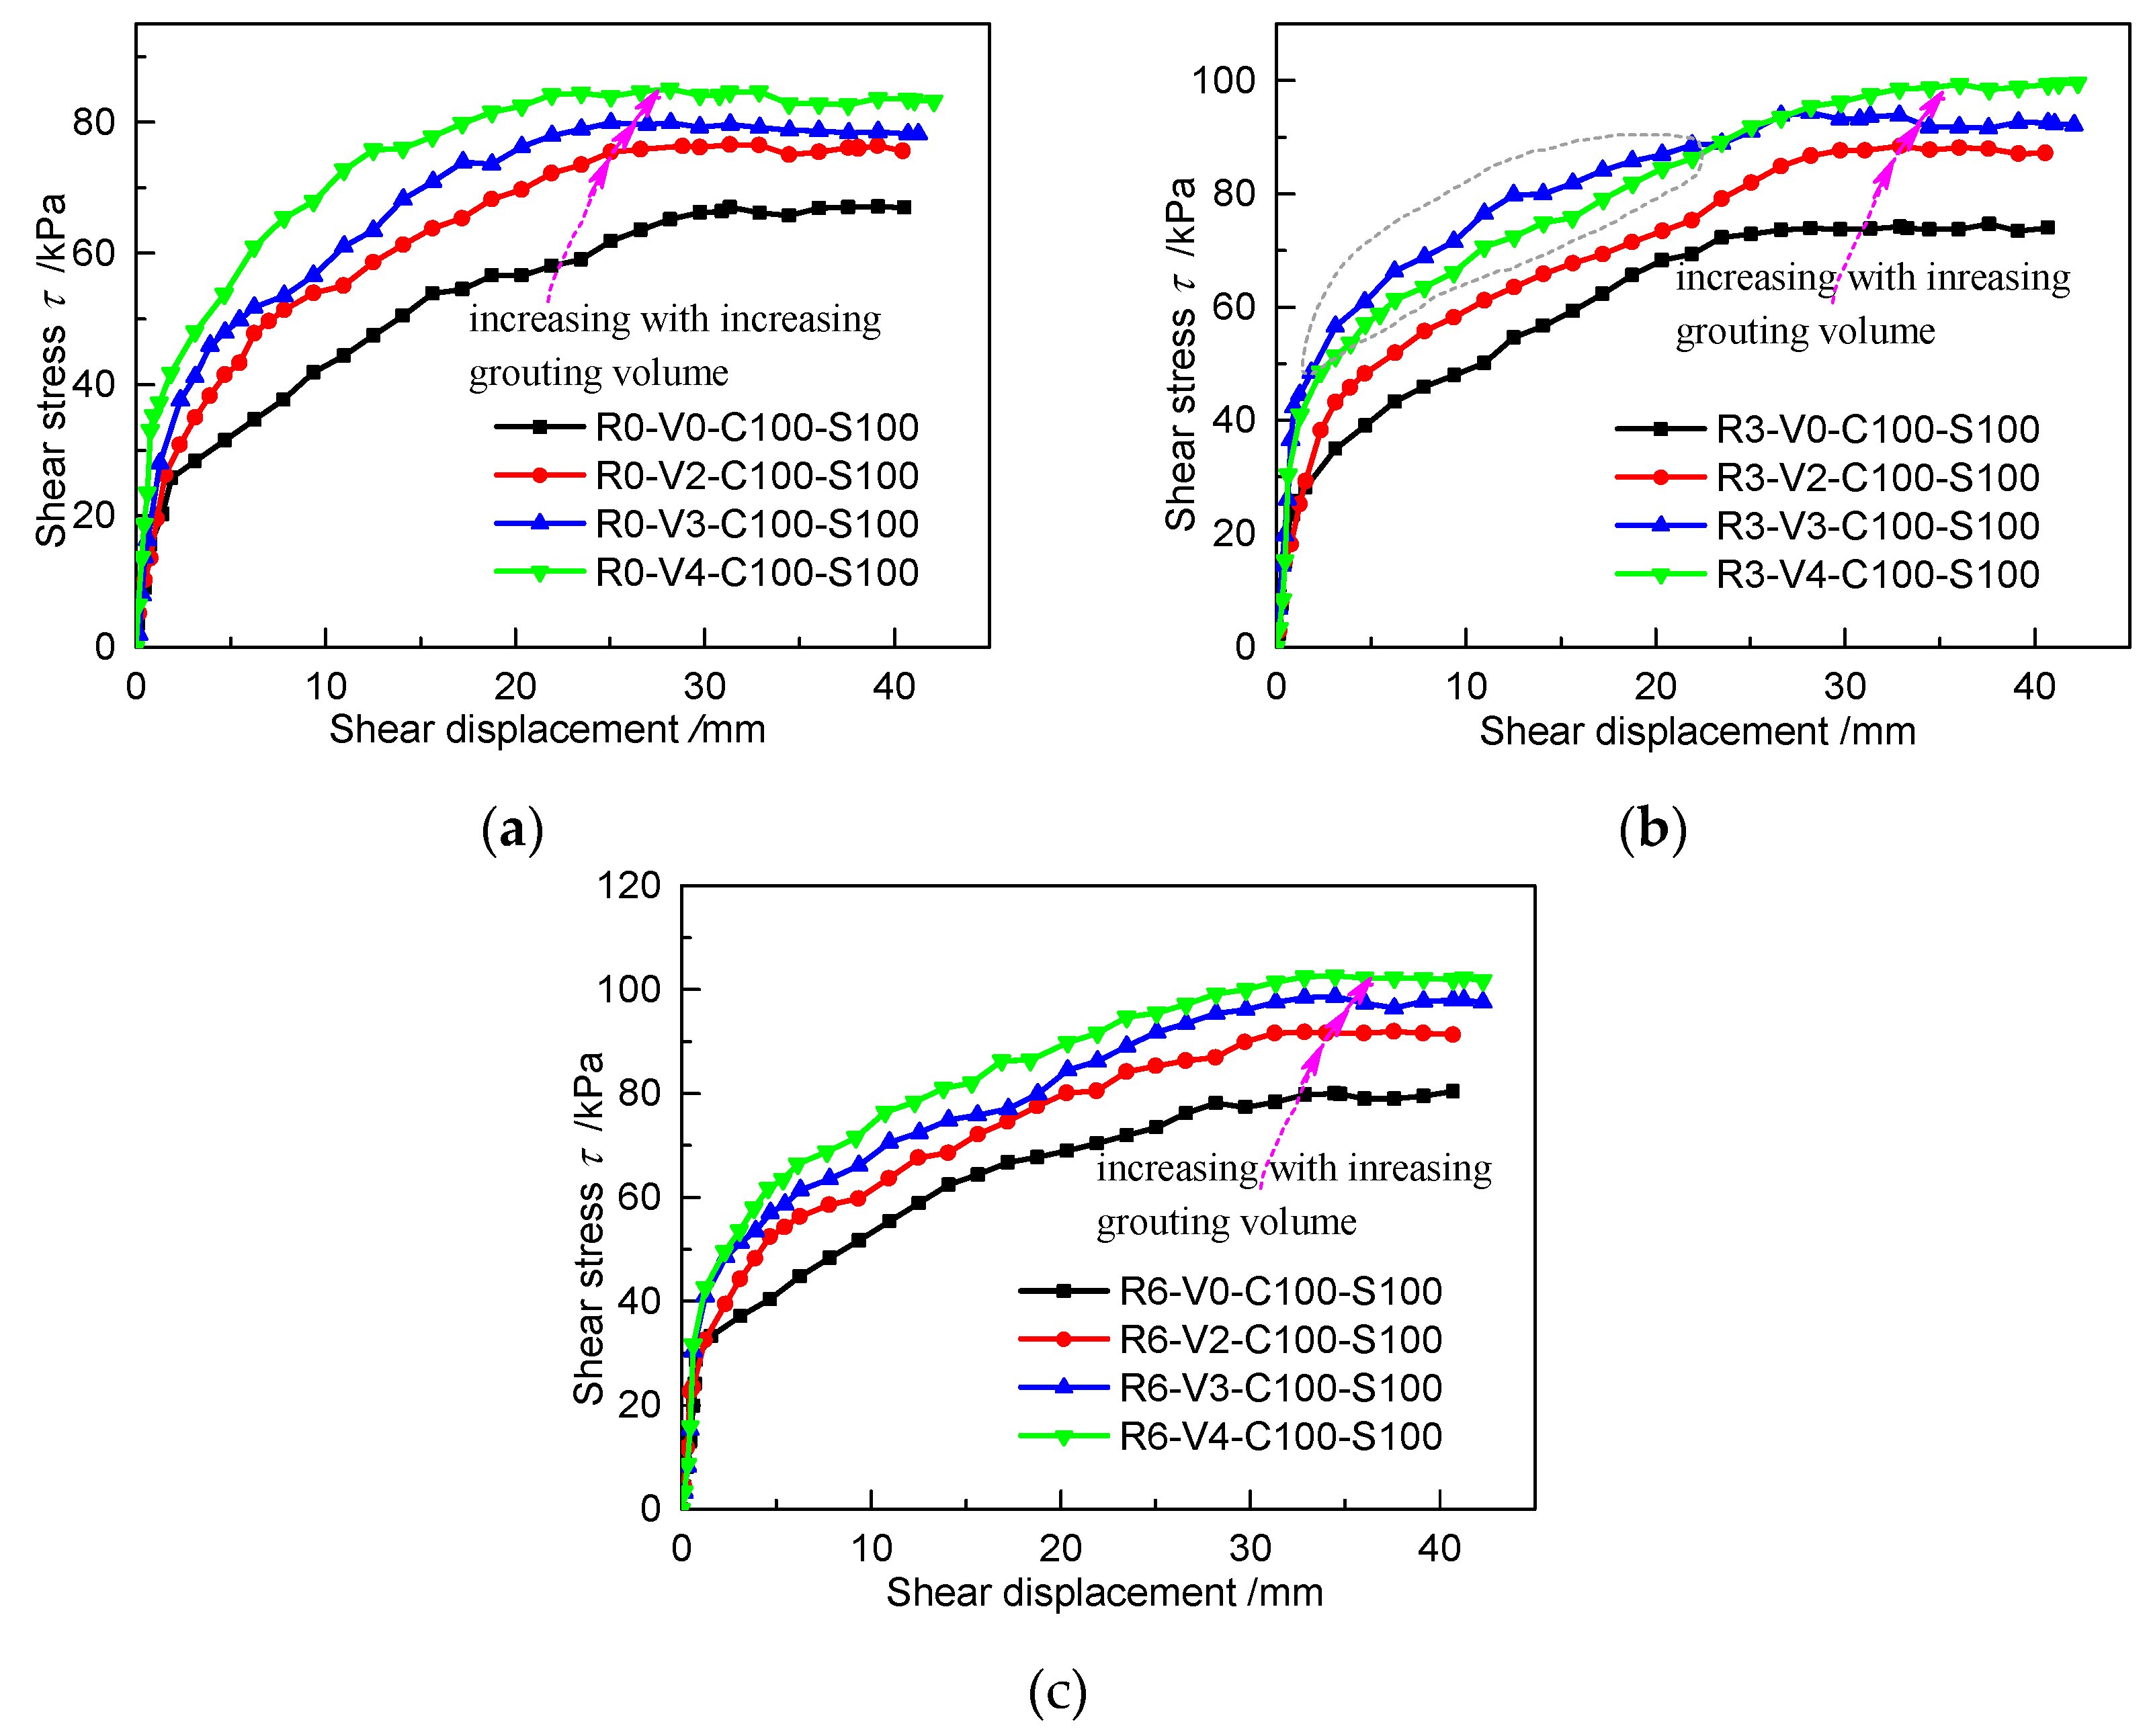
Figure 10.
Shear stress–displacement curves (τ–s curves) for specimens with different grouting volumes: (a) R0, C100 and S100; (b) R3, C100 and S100; (c) R6, C100 and S100.
Figure 10.
Shear stress–displacement curves (τ–s curves) for specimens with different grouting volumes: (a) R0, C100 and S100; (b) R3, C100 and S100; (c) R6, C100 and S100.
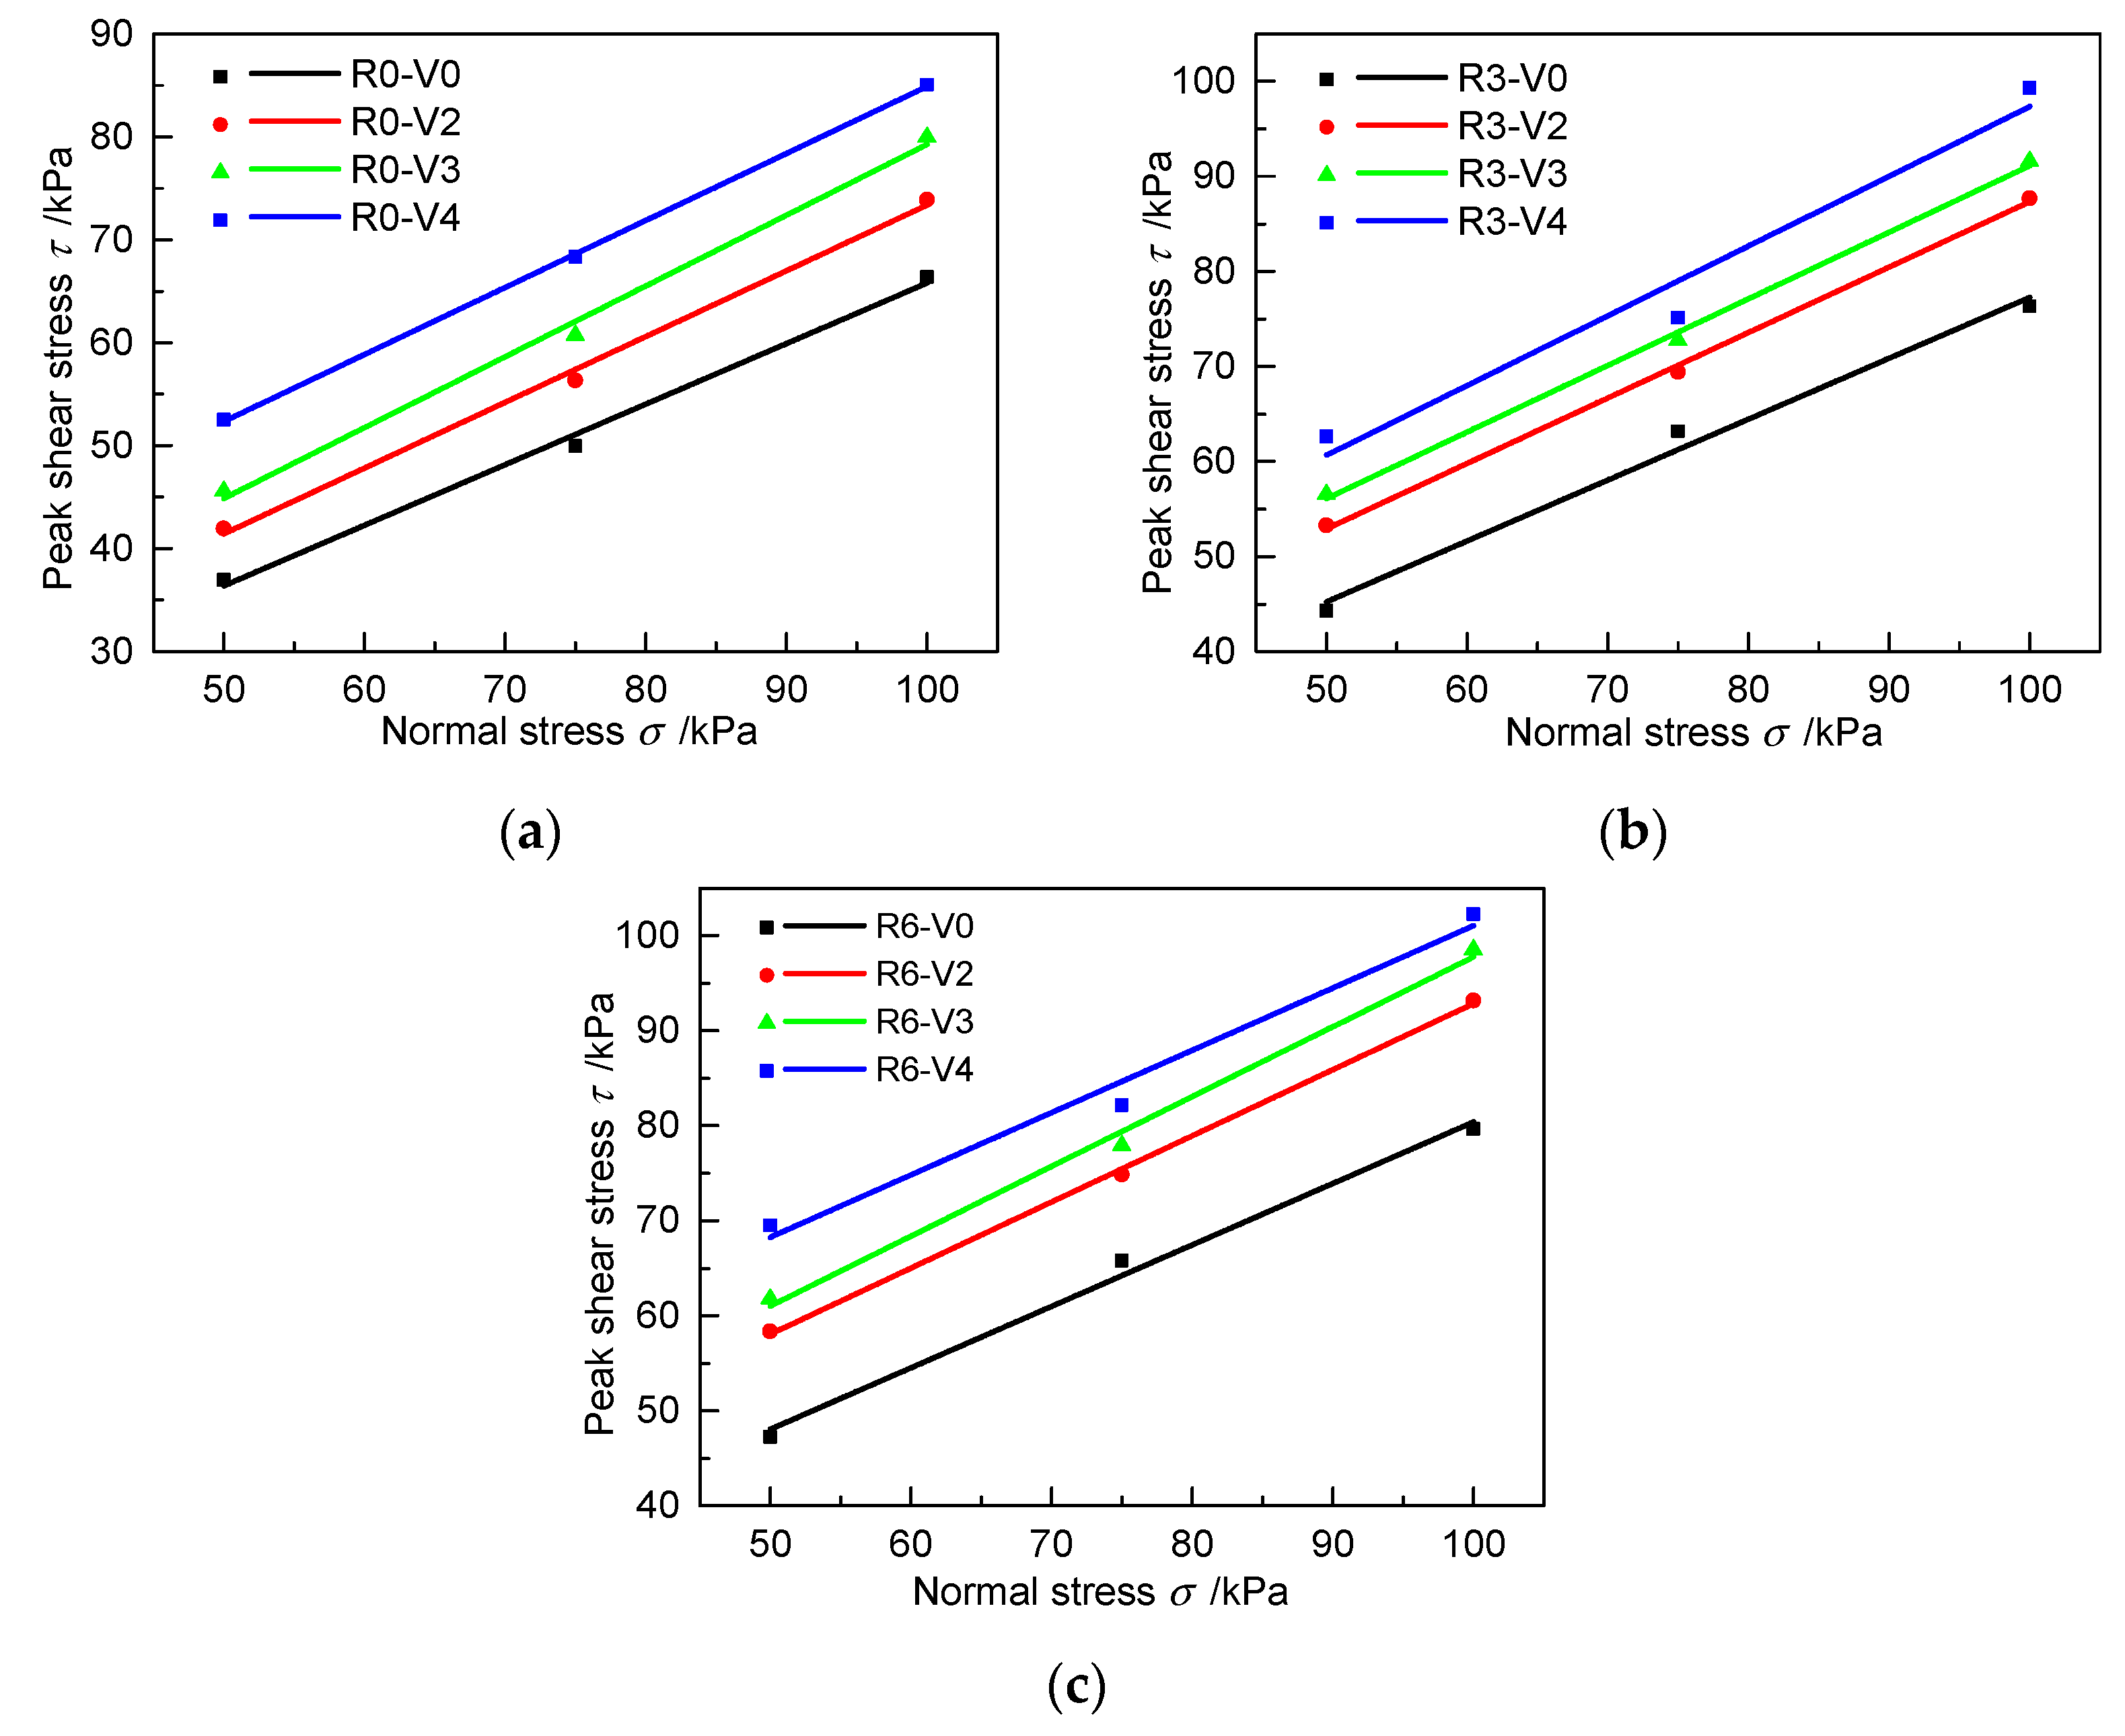
Figure 11.
Fitted curves between peak shear stress and normal stress with different grouting volumes for different roughness values: (a) R0, (b) R3, and (c) R6.
Figure 11.
Fitted curves between peak shear stress and normal stress with different grouting volumes for different roughness values: (a) R0, (b) R3, and (c) R6.
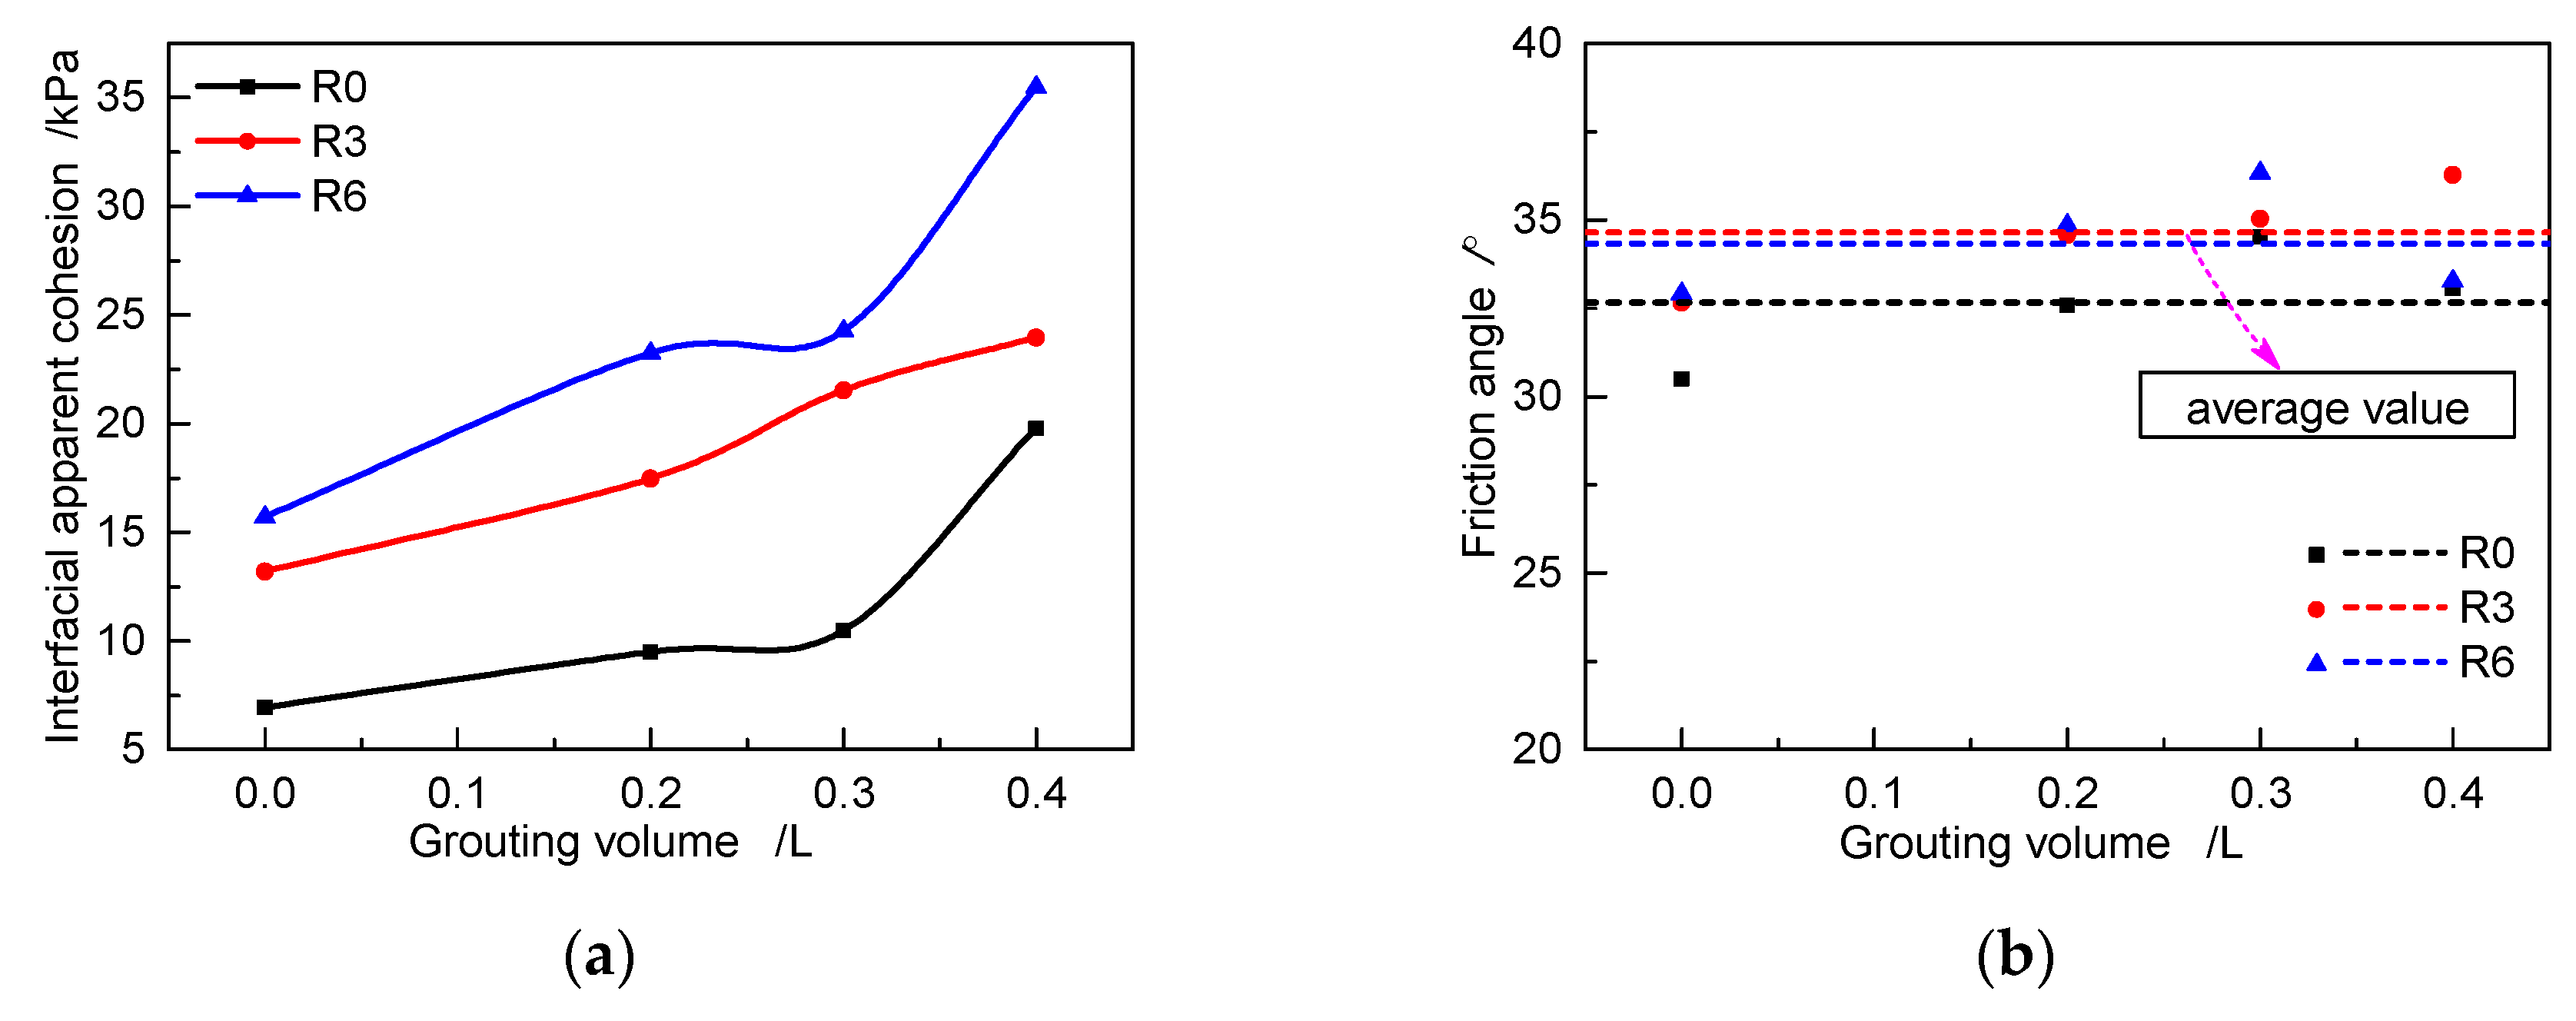
Figure 12.
Relationship of interfacial apparent cohesion and friction angle with respect to the grouting volume for specimens with different roughness values under unloading conditions: (a) Interfacial apparent cohesion variation with grouting volume; (b) Friction angle variation with grouting volume.
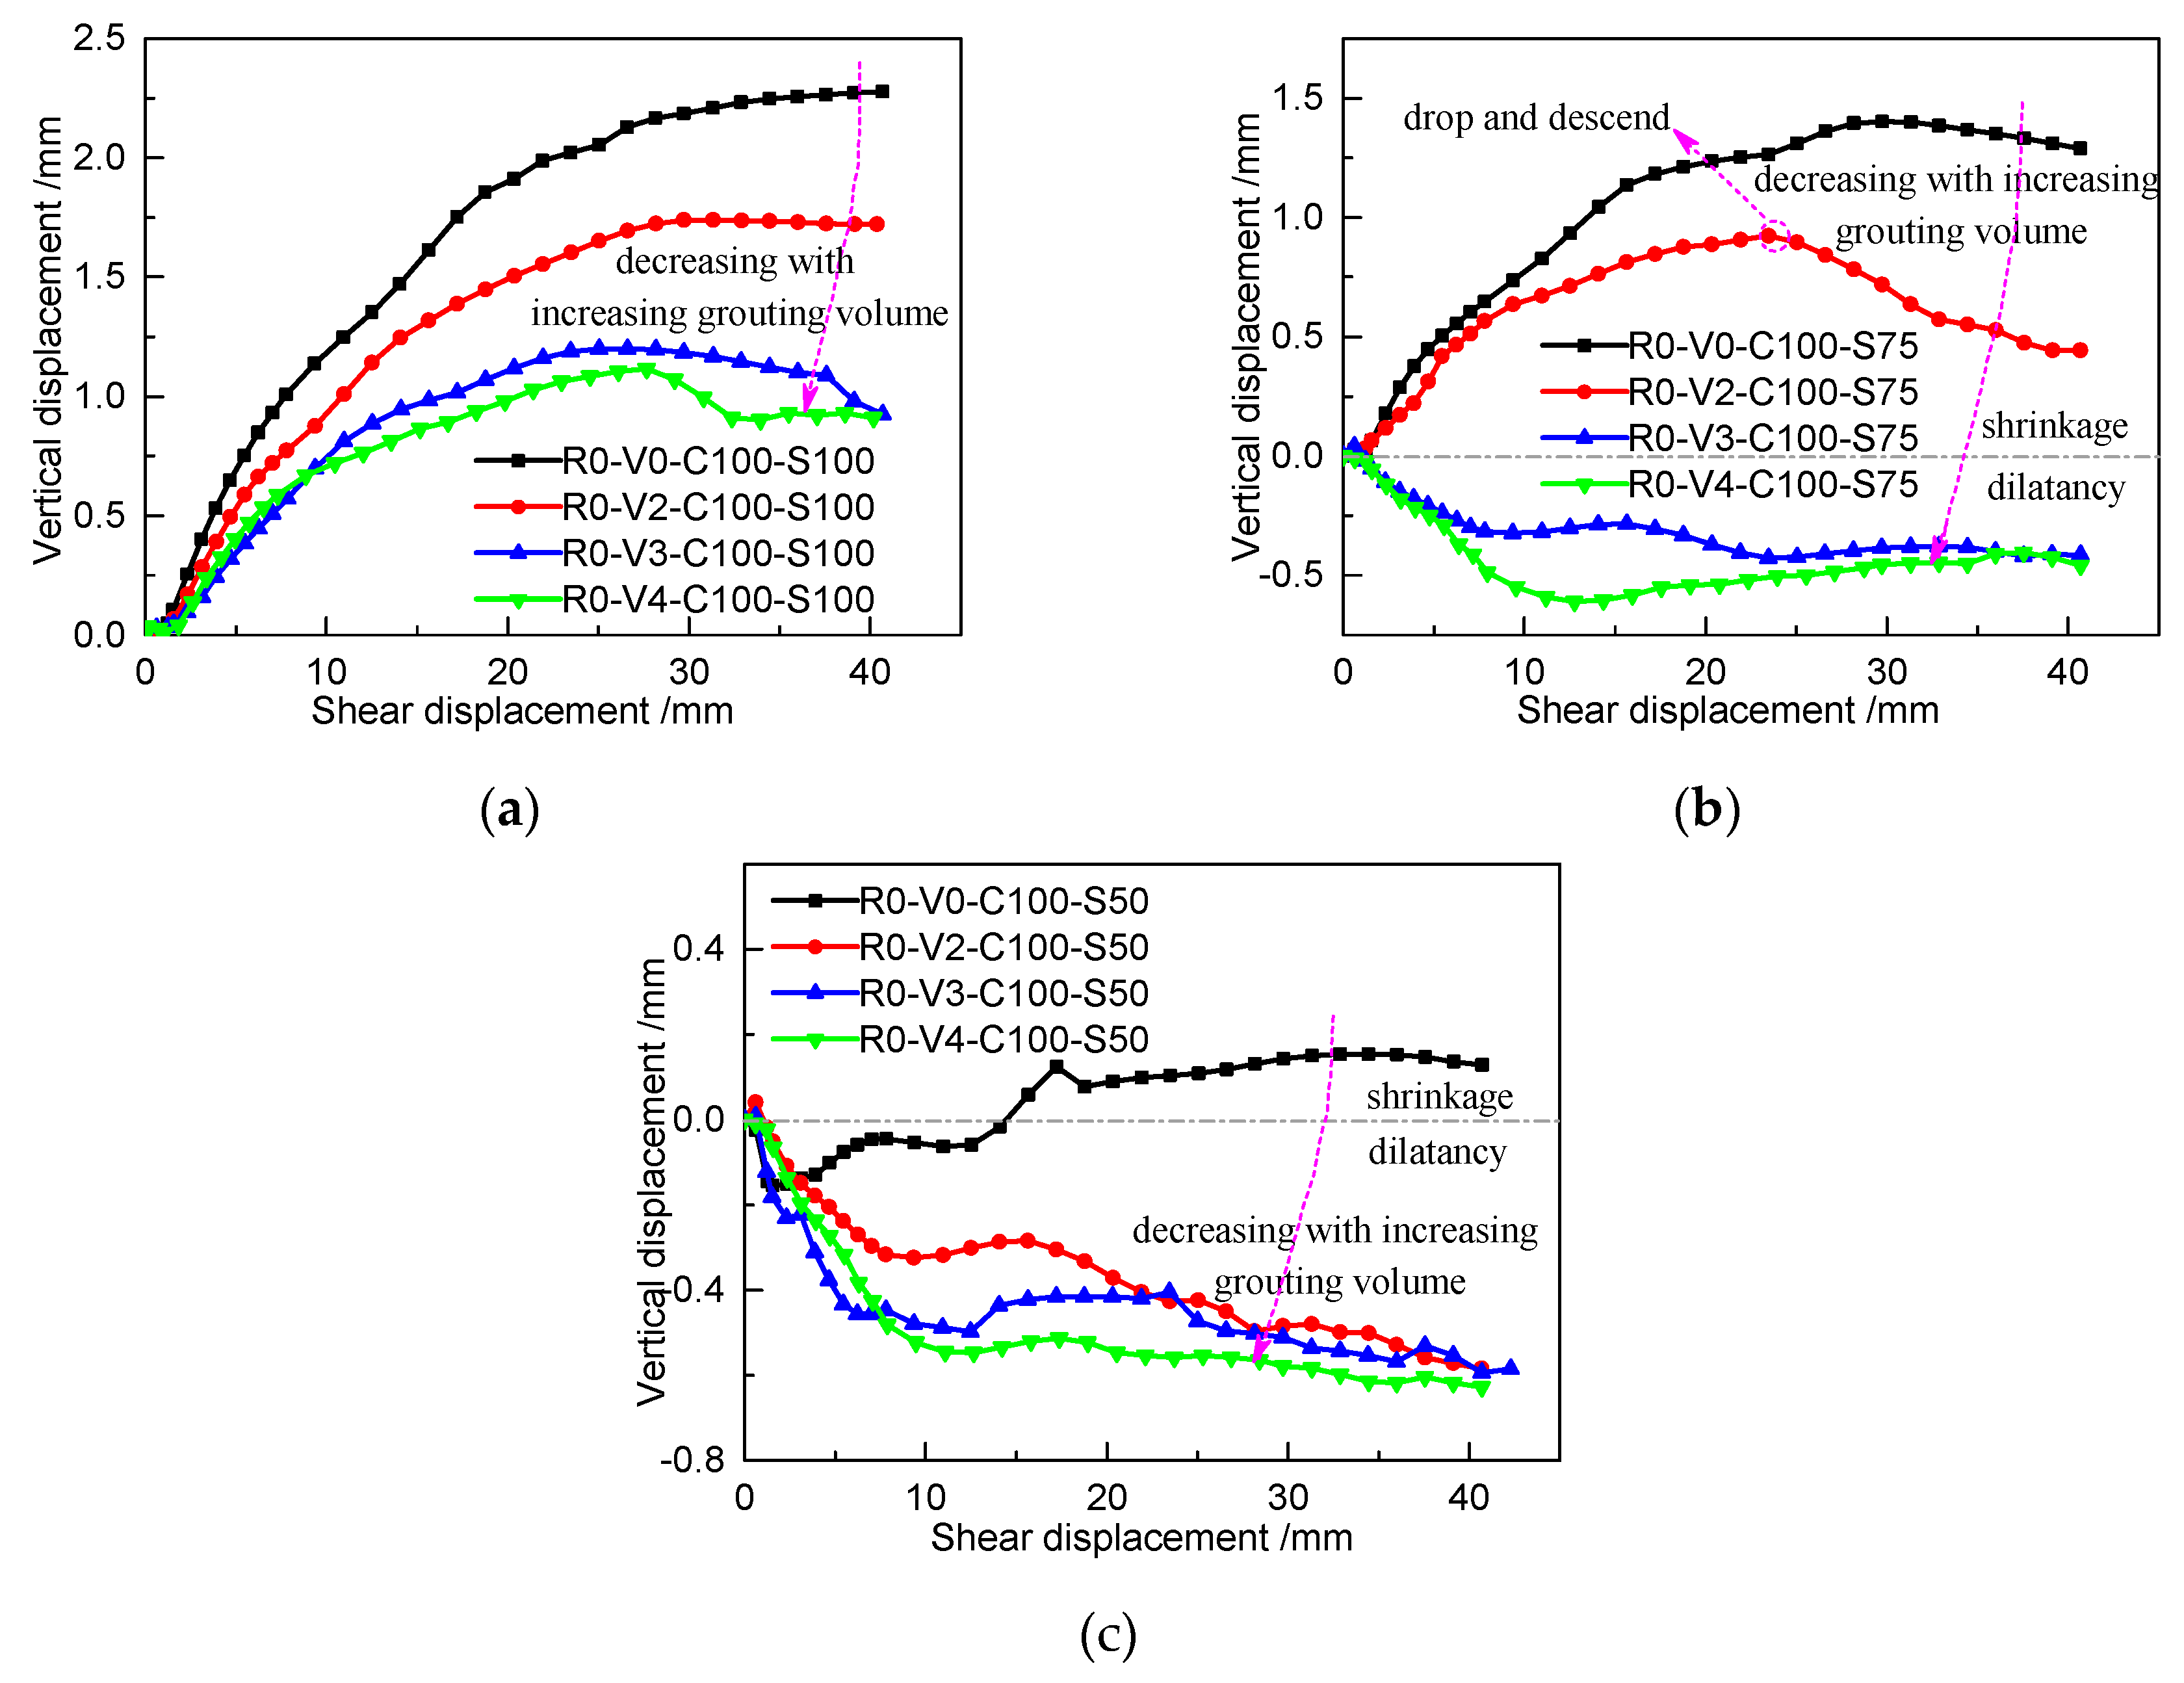
Figure 13.
Dilation/shrinkage varying with increasing grouting volume for specimens with R0 in different loading cases: (a) C100-S100, (b) C100-S75, and (c) C100-S50.
Figure 13.
Dilation/shrinkage varying with increasing grouting volume for specimens with R0 in different loading cases: (a) C100-S100, (b) C100-S75, and (c) C100-S50.
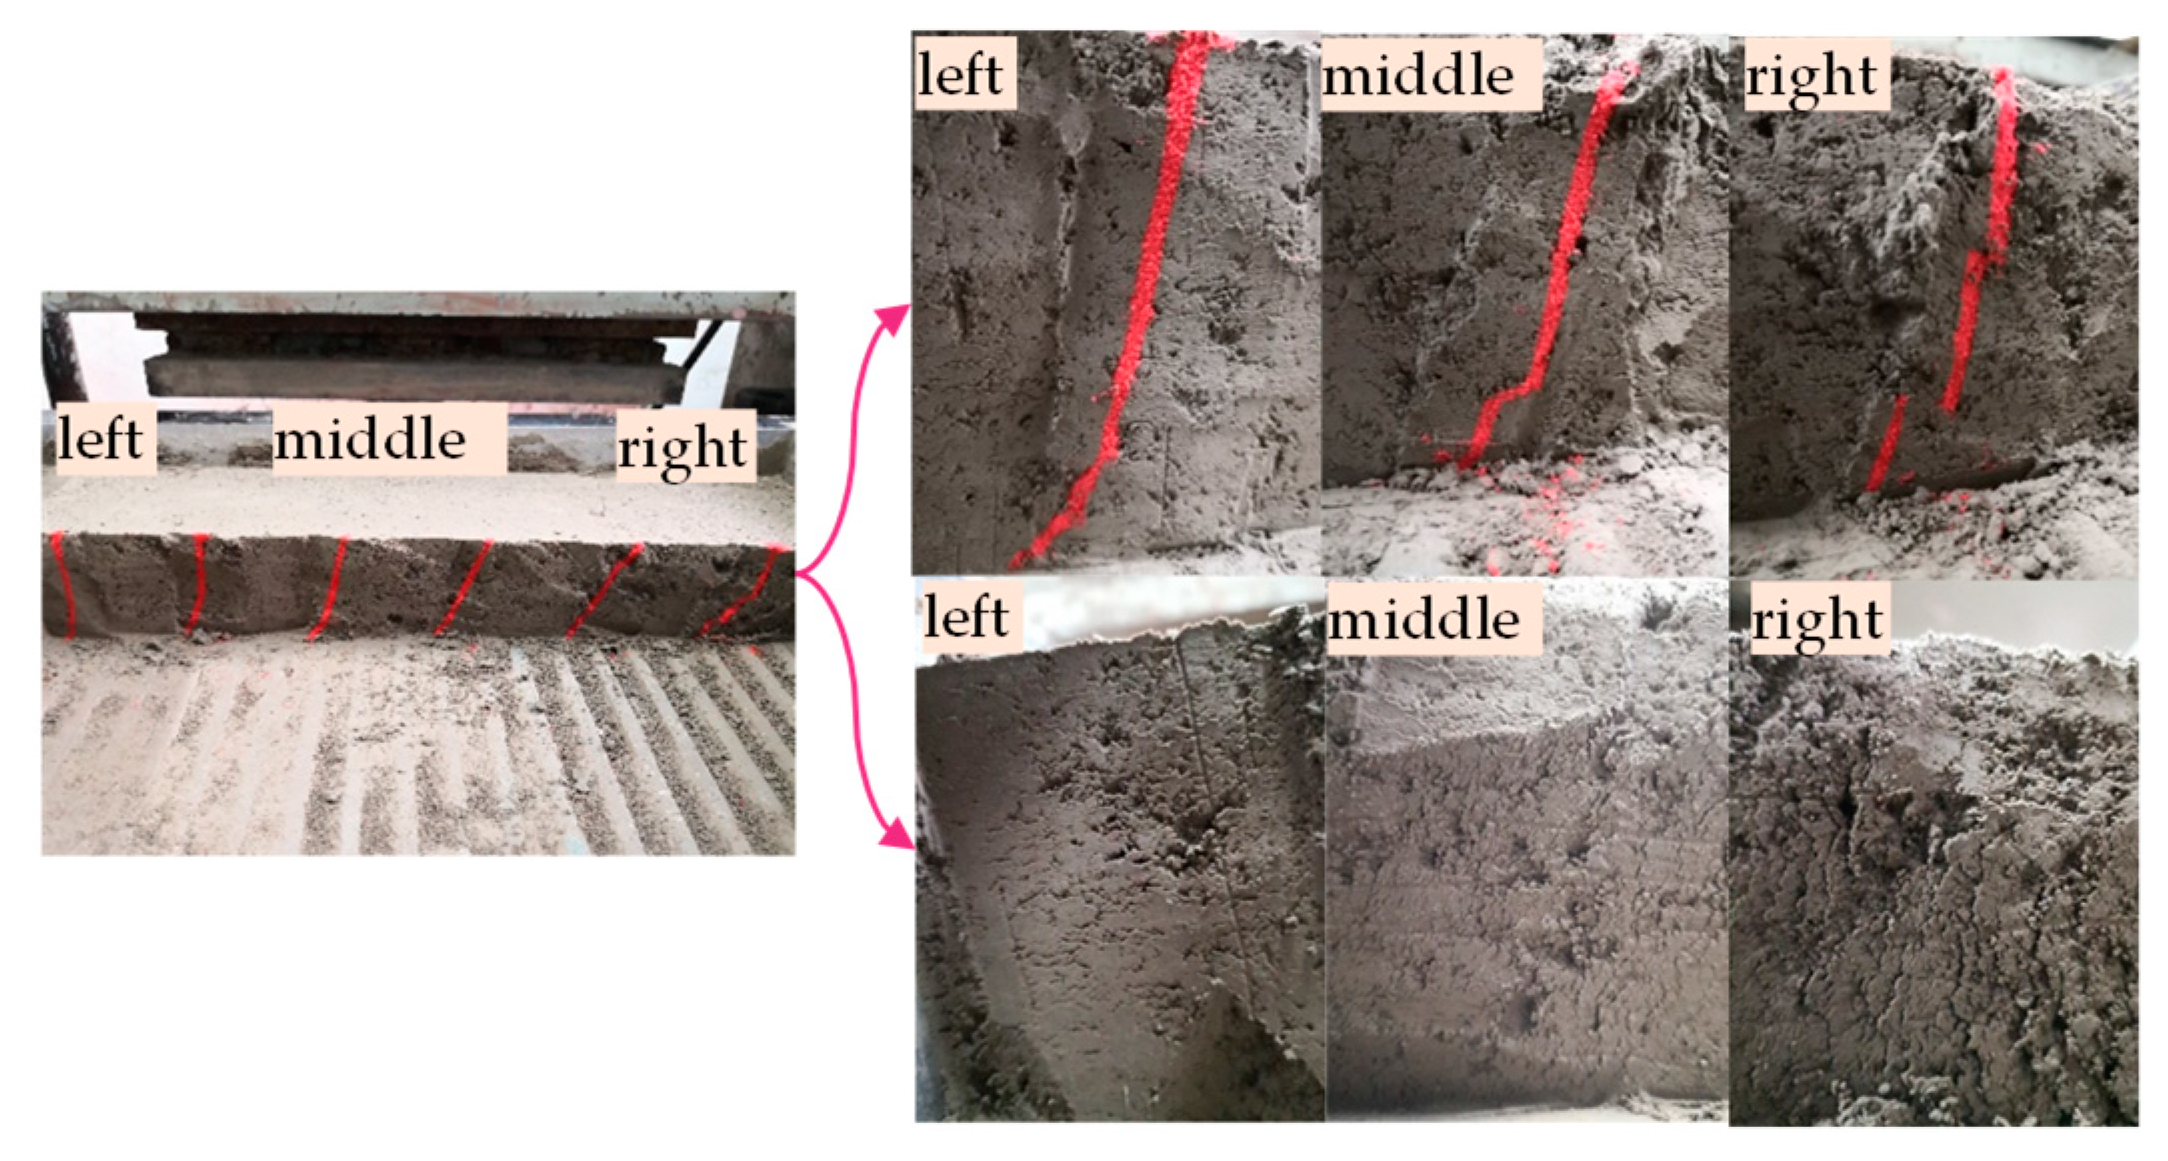
Figure 14.
Variations in the shear band and apparent soil characteristics along the shearing direction.
Figure 14.
Variations in the shear band and apparent soil characteristics along the shearing direction.
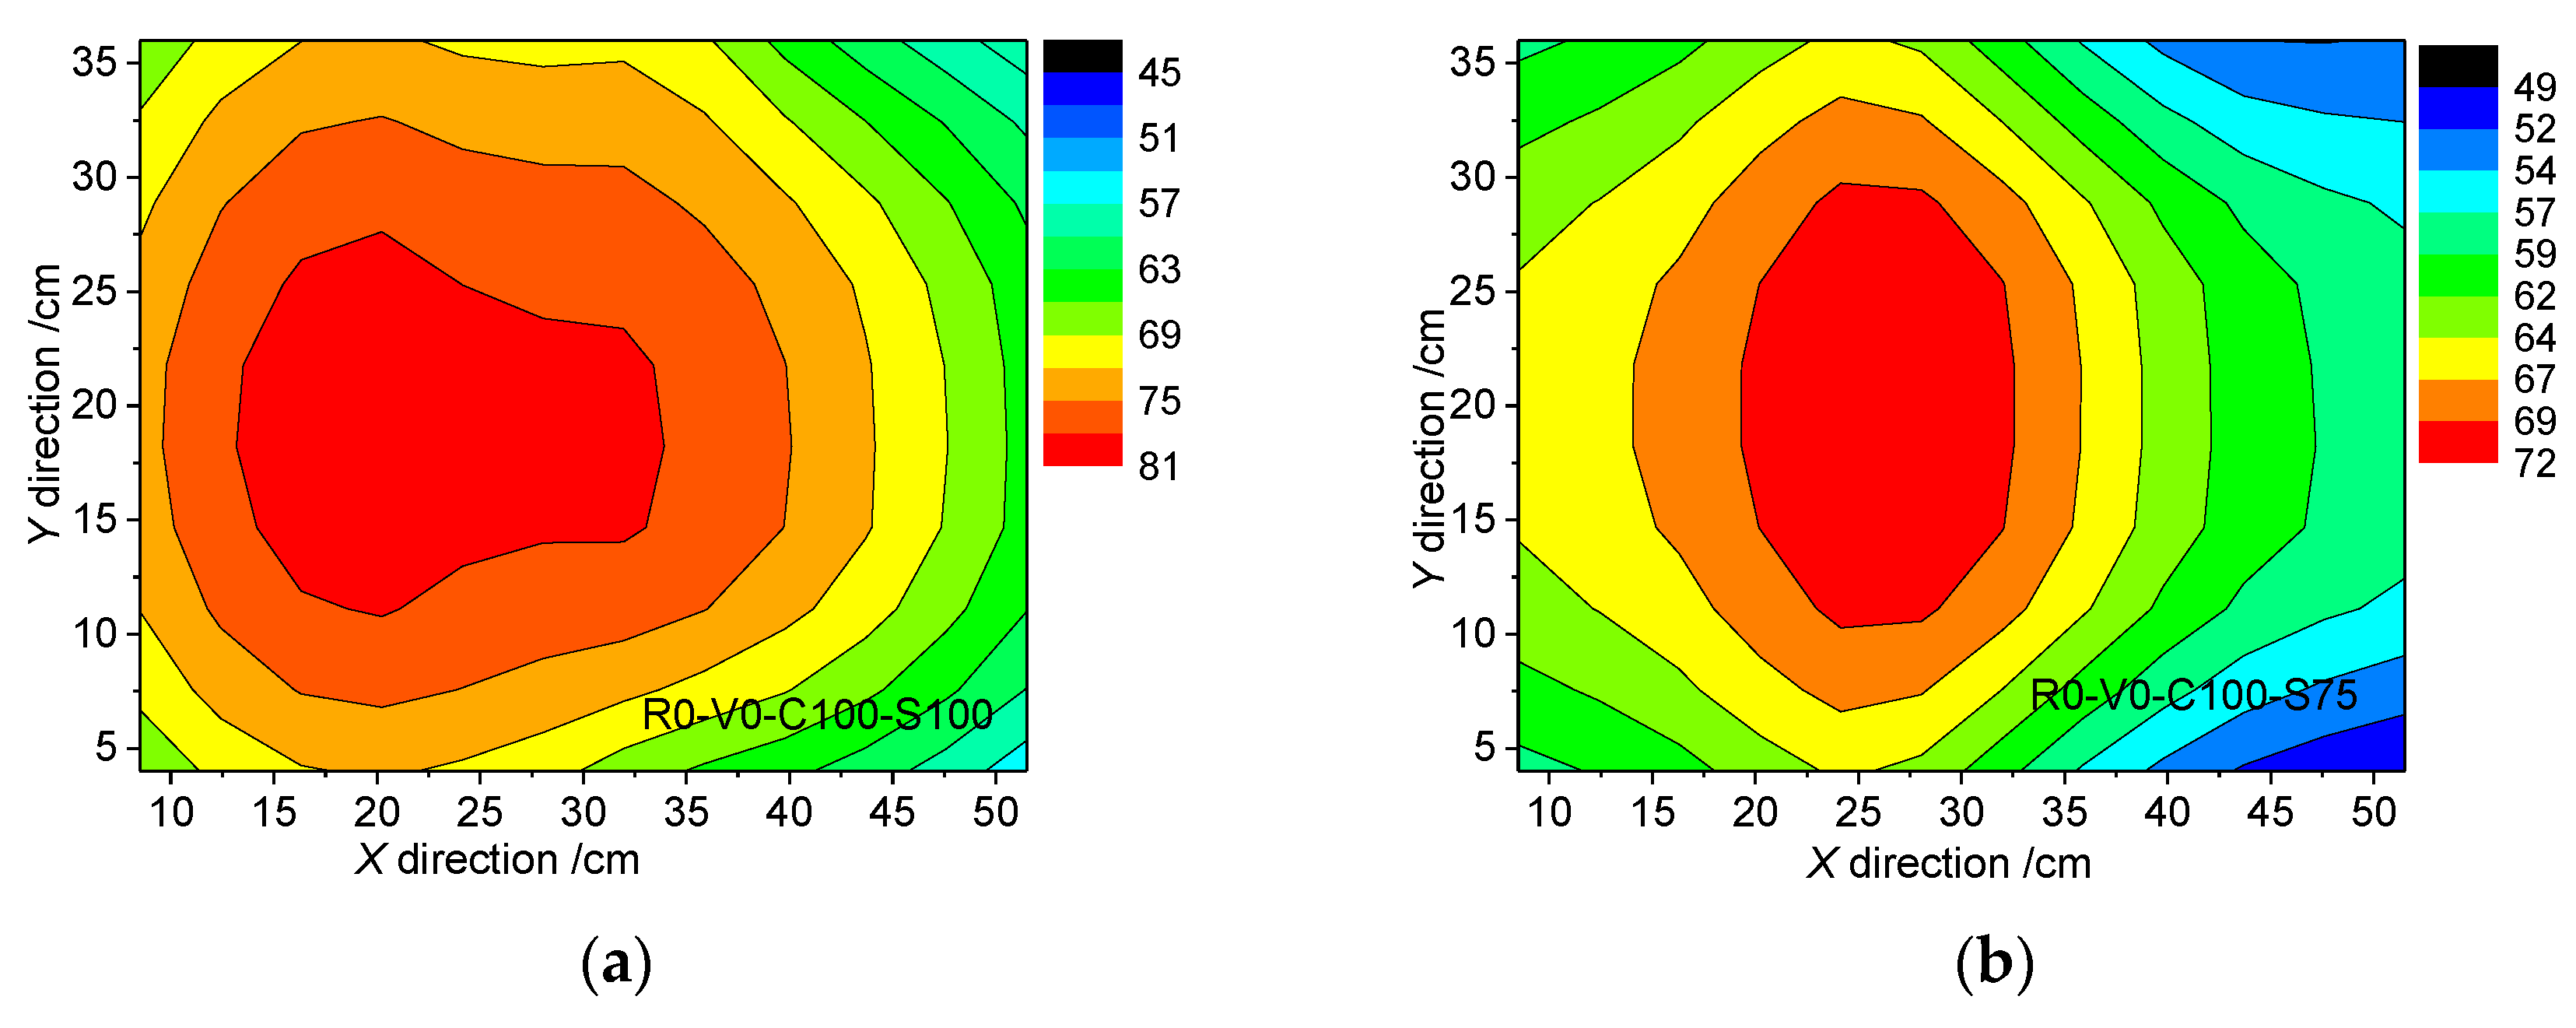
Figure 15.
Distribution contour of shear band thickness projected to the horizontal plane: (a) R0-V0-C100-S100; (b) R0-V0-C100-S75.
Figure 15.
Distribution contour of shear band thickness projected to the horizontal plane: (a) R0-V0-C100-S100; (b) R0-V0-C100-S75.
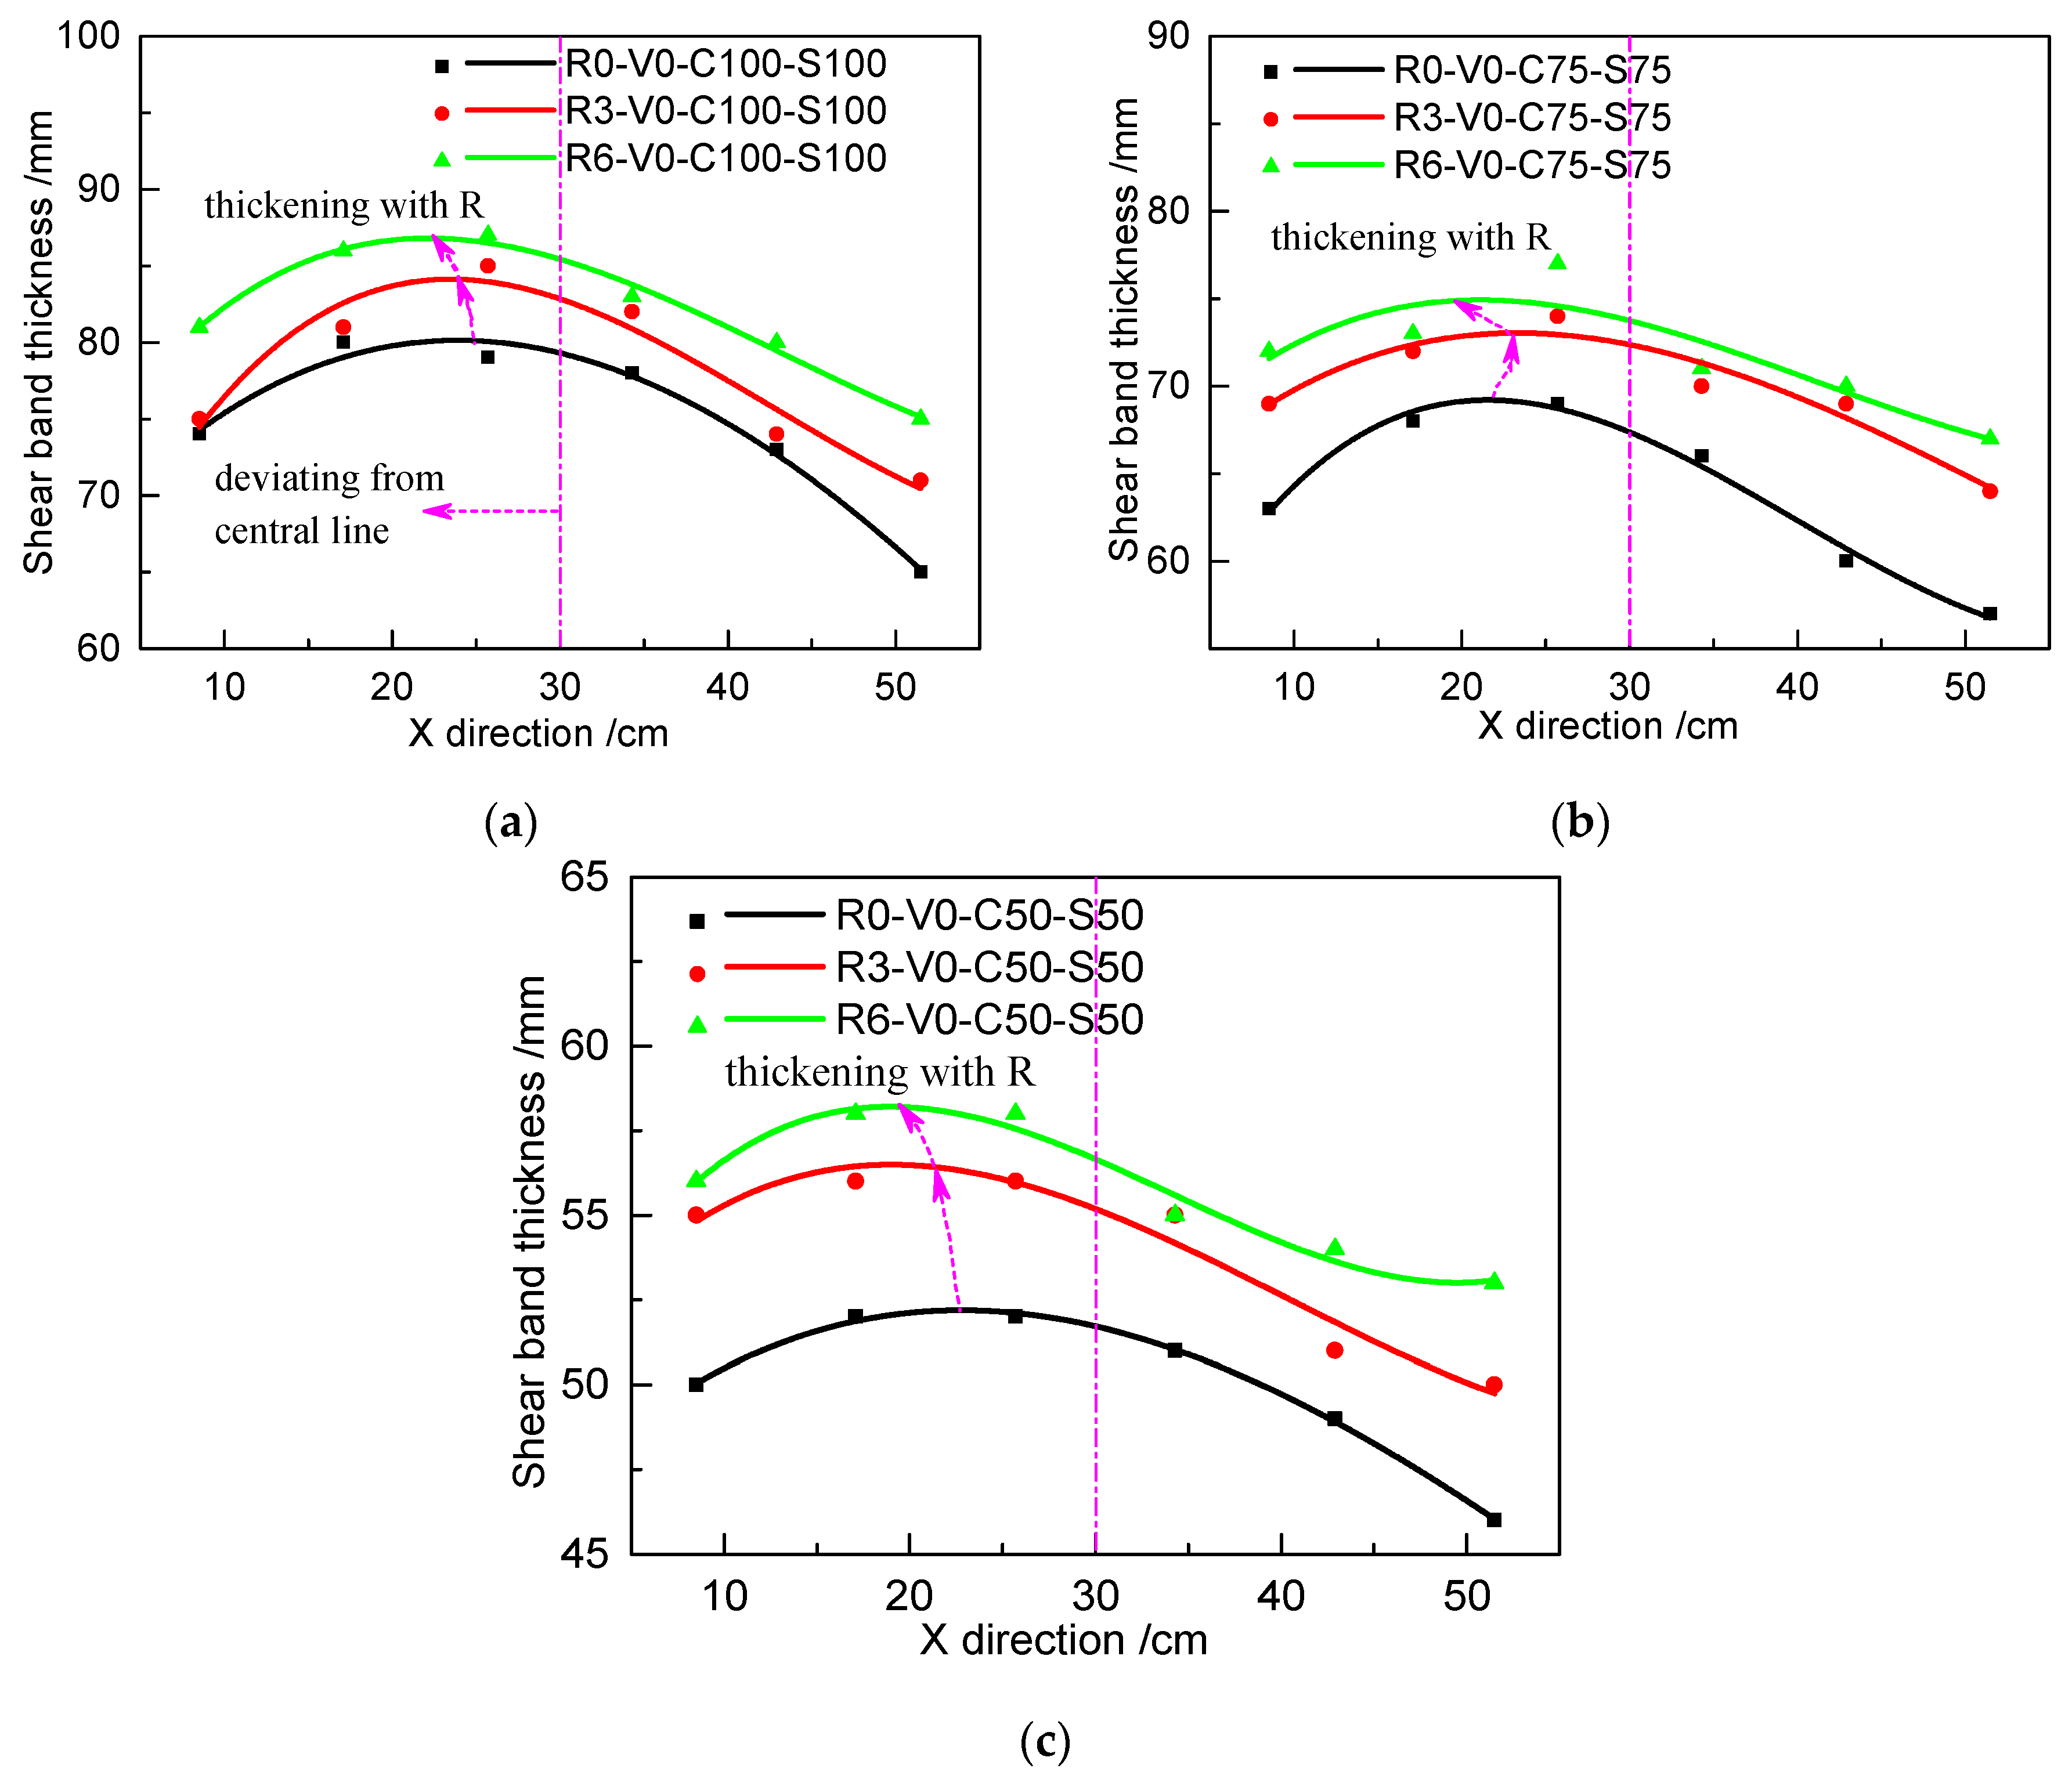
Figure 16.
Relationship of the distribution and thickness of the shear band with different roughness values in different loading cases: (a) C100 and S100; (b) C75 and S75; and (c) C50 and S50.
Figure 16.
Relationship of the distribution and thickness of the shear band with different roughness values in different loading cases: (a) C100 and S100; (b) C75 and S75; and (c) C50 and S50.
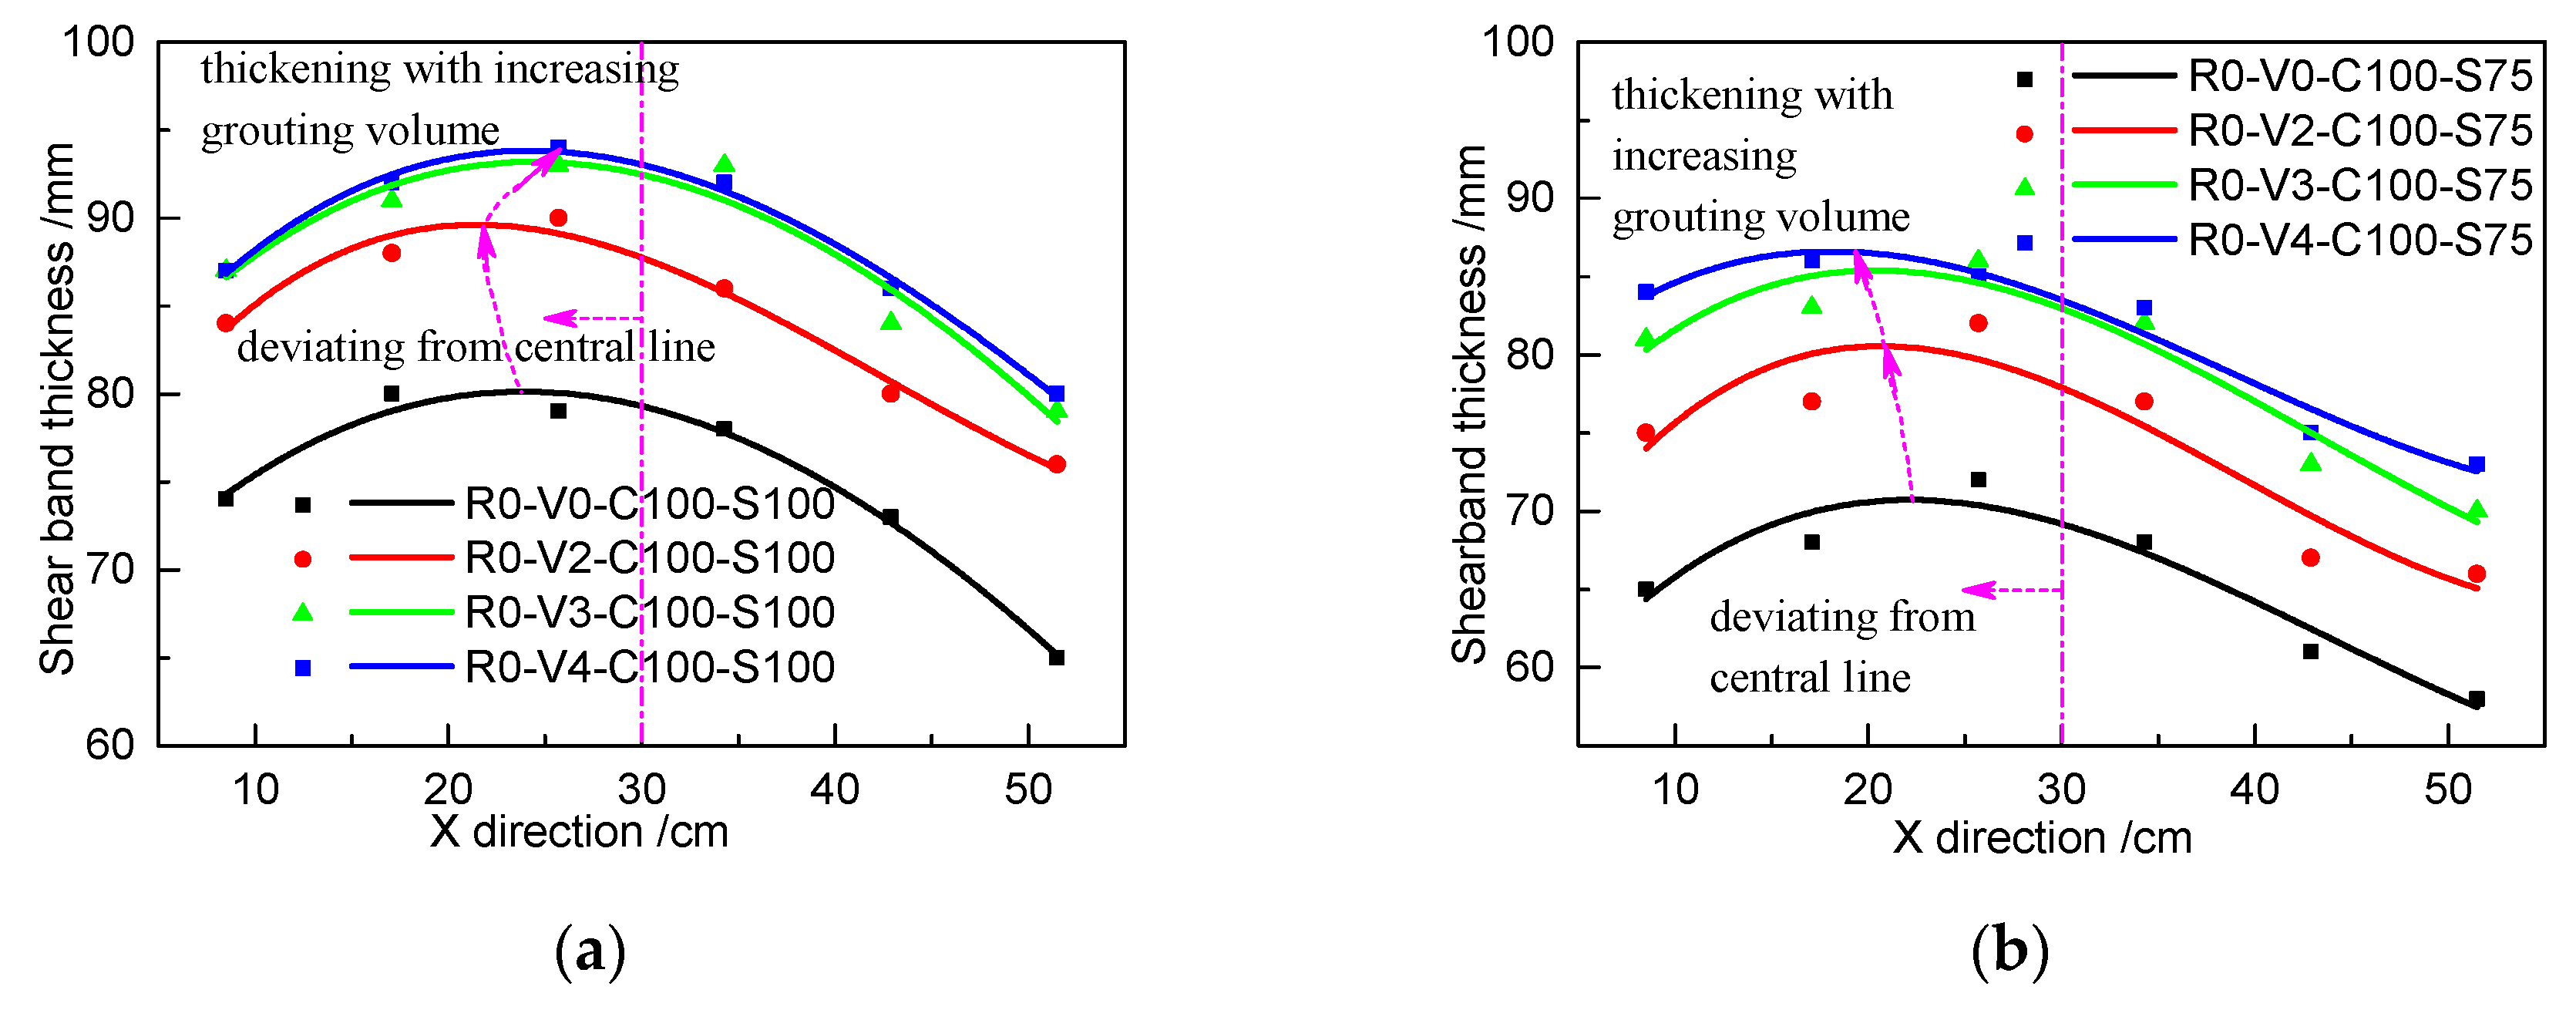
Figure 17.
Relationship of the distribution and thickness of the shear band with different grouting volumes in different loading cases: (a) C100 and S100 and (b) C100 and S75.
Figure 17.
Relationship of the distribution and thickness of the shear band with different grouting volumes in different loading cases: (a) C100 and S100 and (b) C100 and S75.
Table 1.
Parameters of the SJW-200 direct shear apparatus
Table 1.
Parameters of the SJW-200 direct shear apparatus
| Shear Box Size (mm) | Range (kN) | Velocity (mm/min) | Maximum Displacement (mm) | Accuracy (%) |
|---|
| Normal | Horizontal | Normal | Horizontal |
|---|
| 600 × 400 × 200 | 200 | 200 | 0.1–50 | 0.1–50 | 150 | 0.5 |
Table 2.
Soil sample parameters
Table 2.
Soil sample parameters
| Water Content (%) | Liquid Limit (%) | Plastic Limit (%) | Cohesion (kPa) | Friction Angle (°) | Dry Density (kg/m3) |
|---|
| 25.0 | 35.8 | 21.0 | 18.52 | 33.10 | 1630 |
Table 3.
Cement parameters.
Table 3.
Cement parameters.
| Constituent | SiO2 | Al2O3 | Fe2O3 | CaO | MgO | SO3 | Specific Surface Area (m2/kg) |
|---|
| Content | 21.50 | 5.88 | 3.67 | 60.2 | 1.82 | 2.46 | 378 |
Table 4.
Details of test specimens with roughness R0
Table 4.
Details of test specimens with roughness R0
| Specimen | Grouting Volume (dm3) | Normal Consolidation Stress (kPa) | Normal Stress When Shearing (kPa) |
|---|
| R0-V0-C100-S100 | 0 | 100 | 100 |
| R0-V2-C100-S100 | 0.2 | 100 | 100 |
| R0-V3-C100-S100 | 0.3 | 100 | 100 |
| R0-V4-C100-S100 | 0.4 | 100 | 100 |
| R0-V0-C100-S75 | 0 | 100 | 75 |
| R0-V2-C100-S75 | 0.2 | 100 | 75 |
| R0-V3-C100-S75 | 0.3 | 100 | 75 |
| R0-V4-C100-S75 | 0.4 | 100 | 75 |
| R0-V0-C100-S50 | 0 | 100 | 50 |
| R0-V2-C100-S50 | 0.2 | 100 | 50 |
| R0-V3-C100-S50 | 0.3 | 100 | 50 |
| R0-V4-C100-S50 | 0.4 | 100 | 50 |
| R0-V0-C75-S75 | 0 | 75 | 75 |
| R0-V2-C75-S75 | 0.2 | 75 | 75 |
| R0-V0-C50-S50 | 0 | 50 | 50 |
| R0-V2-C50-S50 | 0.2 | 50 | 50 |
Table 5.
Fitted curve parameters (interfacial apparent cohesion and friction angle) conforming to Mohr–Coulomb shear criterion for specimens with different roughness values
Table 5.
Fitted curve parameters (interfacial apparent cohesion and friction angle) conforming to Mohr–Coulomb shear criterion for specimens with different roughness values
| Grouting Volume | Roughness | Apparent Cohesion ce (kPa) | Friction Angle φe (°) | Correlation Coefficient R2 |
|---|
| V0 | R0 | 4.61 | 31.42 | 0.989 |
| R3 | 8.26 | 33.50 | 0.993 |
| R6 | 10.4 | 34.52 | 0.990 |
| V2 | R0 | 10.83 | 32.94 | 0.989 |
| R3 | 17.86 | 34.68 | 0.992 |
| R6 | 19.39 | 36.05 | 0.993 |
Table 6.
Final dilation/shrinkage for specimens with different roughness values in loading conditions without grouting.
Table 6.
Final dilation/shrinkage for specimens with different roughness values in loading conditions without grouting.
| Grouting Volume | Loading Conditions | Roughness | Dilation/Shrinkage (mm) | Variation (%) |
|---|
| V0 | C100-S100 | R0 | 2.277 | - |
| R3 | 2.073 | −9.0 |
| R6 | 1.823 | −12.1 |
| C75-S75 | R0 | 1.438 | - |
| R3 | 1.272 | −11.5 |
| R6 | 1.154 | −9.3 |
| C50-S50 | R0 | 0.497 | - |
| R3 | 0.433 | −12.9 |
| R6 | 0.257 | −40.6 |
Table 7.
Final dilation/shrinkage for specimens with R0 and different grouting volumes under unloading conditions
Table 7.
Final dilation/shrinkage for specimens with R0 and different grouting volumes under unloading conditions
| Roughness | Loading Conditions | Grouting Volume | Dilation/Shrinkage (mm) | Relative Variation (%) |
|---|
| R0 | C100-S100 | V0 | 2.277 | - |
| V2 | 1.722 | −24.4 |
| V3 | 0.924 | −46.3 |
| V4 | 0.910 | −1.5 |
| C100-S75 | V0 | 1.288 | - |
| V2 | 0.443 | −65.6 |
| V3 | −0.414 | −193.6 |
| V4 | −0.458 | −10.6 |
| C100-S50 | V0 | 0.128 | - |
| V2 | −0.584 | −556.3 |
| V3 | −0.594 | −1.7 |
| V4 | −0.627 | −5.6 |
Table 8.
Average shear band thickness for specimens with different roughness values and no grouting
Table 8.
Average shear band thickness for specimens with different roughness values and no grouting
| Loading Conditions | Roughness | Average Shear Band Thickness (mm) | Relative Variation (%) |
|---|
| C100-S100 | R0 | 74.8 | - |
| R3 | 78.0 | 4.3 |
| R6 | 82.0 | 5.1 |
| C75-S75 | R0 | 63.8 | - |
| R3 | 69.7 | 9.2 |
| R6 | 71.7 | 2.9 |
| C50-S50 | R0 | 50.0 | - |
| R3 | 53.8 | 7.6 |
| R6 | 55.6 | 3.3 |
Table 9.
Average shear band thickness for specimens with R0 under different grouting conditions
Table 9.
Average shear band thickness for specimens with R0 under different grouting conditions
| Loading Conditions | Grouting Volume | Average Shear Band Thickness (mm) | Relative Variation (%) |
|---|
| C100-S100 | V0 | 74.8 | - |
| V2 | 84.0 | 12.3 |
| V3 | 87.7 | 4.4 |
| V4 | 88.5 | 0.9 |
| C100-S75 | V0 | 65.3 | - |
| V2 | 74.0 | 13.3 |
| V3 | 79.2 | 7.0 |
| V4 | 81.0 | 2.3 |


