3.1. Microstructure, Chemical and Phase Analysis
Microstructures of coatings after laser alloying are shown in
Figure 3. Intensive heating by laser beam and subsequent cooling of the steel and coating containing modifying chemical elements allows to obtain finely crystalline, highly supersaturated solutions. Laser alloying gives possibility to obtain microstructure composed of chemical phases which are difficult to form under normal conditions close to the thermodynamic equilibrium. After laser alloying of pre-coat produced on steel, three zones were observed. First was the remelted zone enriched with modifying chemical element, second was the heat affected zone with martensite and finally third zone of toughened steel substrate. Dimensions of produced laser tracks presented in
Table 3 are the result of average from 10 measurements.
It can be seen that in this study the type of pre-coat used had an influence on the laser track depth. Parameters such as heat capacity, thermal conductivity and melting point of pre-coat material are particularly important. The overall microstructure of coating produced using laser alloying of molybdenum pre-coat (Mo-coating) is presented in
Figure 3a, while the enlarged area of the remelted zone is shown in
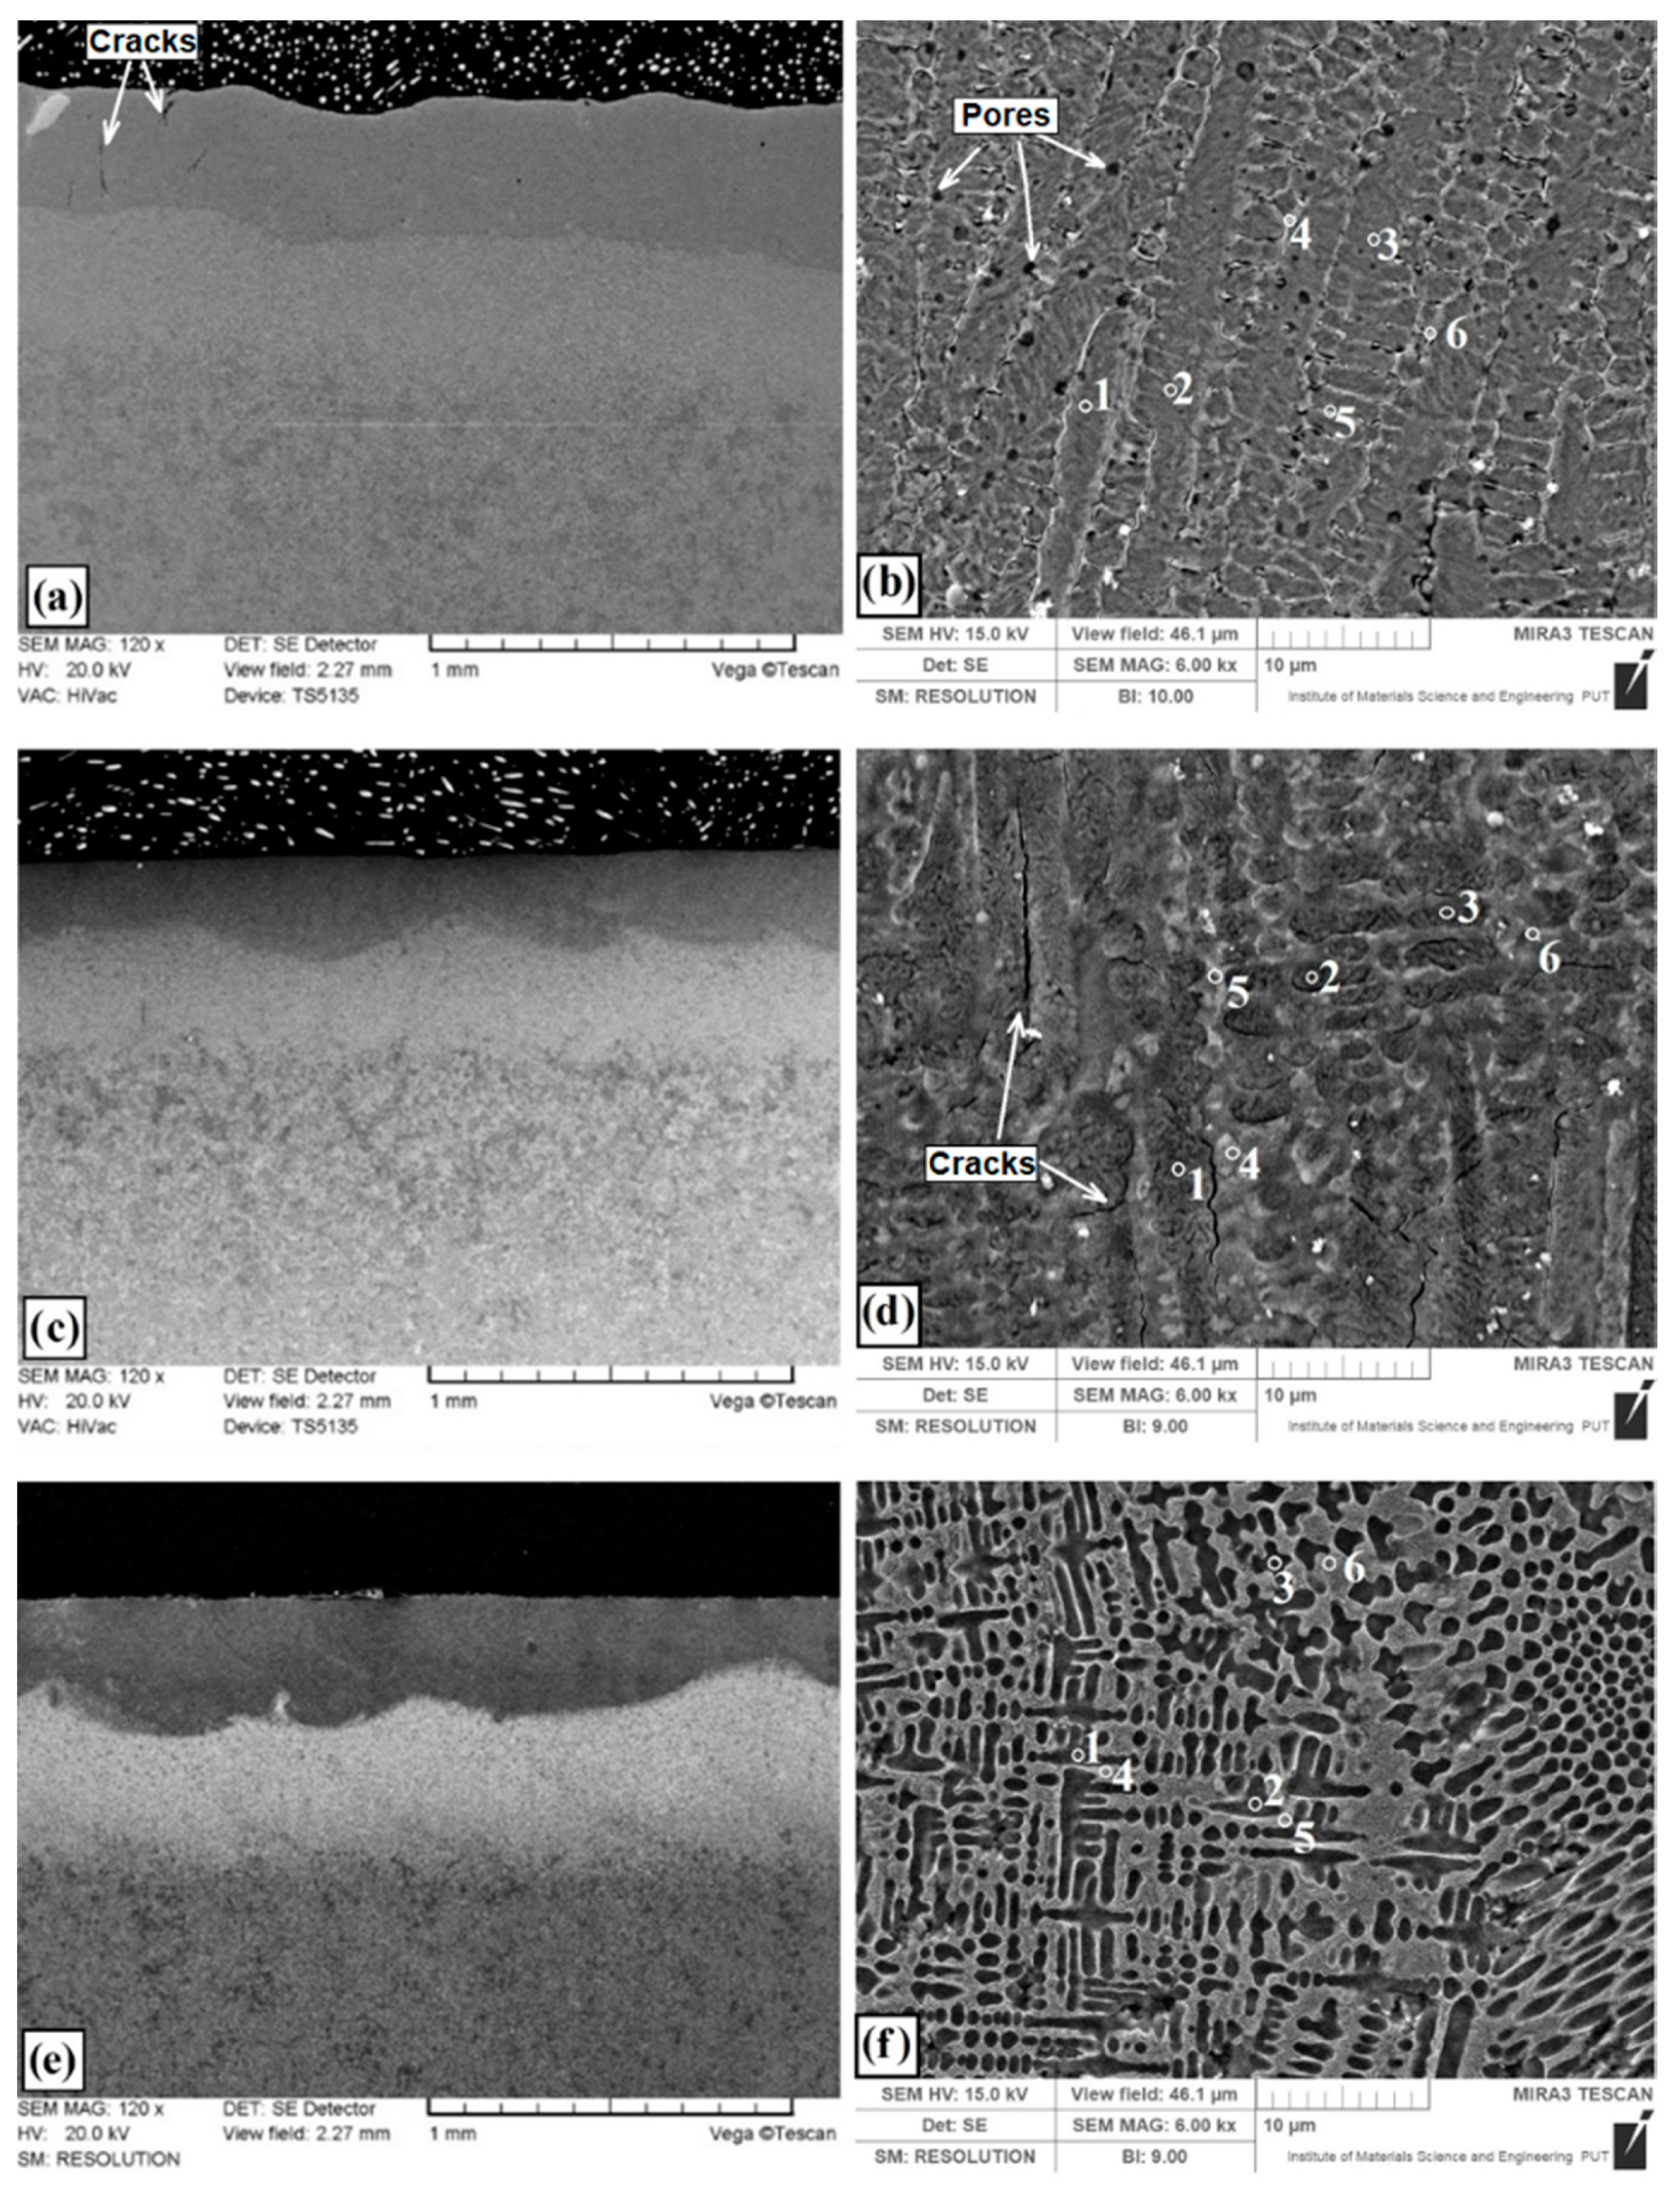
Figure 3b. The remelted zone was composed of supersaturated solution of molybdenum in iron where dendrites with long primary axes was visible and their secondary axes in the transverse section had the form of slightly elongated hexagonal cells.
The coating thickness is almost the same throughout the entire specimen area. Under the remelted zone, the heat-affected zone with a martensite microstructure was situated, and even deeper the sorbitic substrate was identified. Single cracks in the remelted zone of the produced coating were visible, which, however, did not cause it to fall off or peel (marked with arrows in
Figure 3a). The authors of the paper [
20] stated also that the Mo coating was characterized by the presence of a few vertical cracks, mainly from the inside of the coating, which spread towards the surface. In the remelted zone enriched with molybdenum a porosity ranging from 250 nm to 700 nm was identified (marked with arrows in
Figure 3b). These porosities are mainly found at the boundaries of solid solution of Mo in Fe. The depth of the remelted zone was from 370 µm to 390 µm. The depth of the entire laser tracks together with the heat affected zone ranged from 840 µm to 855 µm. Notable porosity in the Mo coating was observed in an investigation using heat spraying [
14]. It was also found that the use of additional heat treatment reduces pore formations.
Figure 3c presents the microstructure of coating produced by laser alloying of pre-coat containing boron (B-coating). Magnification of the remelted zone is shown in
Figure 3d where the presence of borides eutectic with martensite can be found. The arms of the boride eutectic are clearly visible. At high magnifications of microstructure, cracks along the long dendrites can be seen. These cracks were not visible under the optical microscope. The laser tracks have a characteristic parabolic fusion shape, which clearly separates from the heat affected zone (
Figure 3c). The depth of the remelted zone of B-coating ranged from 258 μm to 274 μm, while the total tracks depth was from 607–615 μm.
Figure 3e presents the microstructure of coating produced using laser alloying of pre-coat containing both boron and molybdenum (Mo-B-coating). The enlarged area of remelted zone containing a mixture of boron and molybdenum is shown in
Figure 3f. The zone includes an iron and molybdenum boride eutectic with martensite. The obtained eutectic was more closely packed and the amount of arms formed during solidification was much larger than in the case of only boron pre-coat. The eutectic formed and the martensite needles were finer, which proves faster heat transfer into the material. The obtained laser tracks have good features of both elements introduced (Mo and B). Boron contributes to the fragmented microstructure and ensures high hardness, while molybdenum due to good thermal conductivity contributes to obtaining deeper laser tracks and hence a thicker coating. The depth of the remelted zone ranged from 335 µm to 355 µm, while the total tracks depth was from 765 µm to 780 µm. Within the microstructure (
Figure 3e), the separated areas of the remelted zone and heat affected zone are clearly visible. In heat affected zone of Mo-B-coating smaller grain than in the same area of B-coating was visible. It should be noted that Mo-B-coating microstructure was characterized by lack of cracks. At the same time, no porosity was seen at high magnifications in contrast to Mo-coating.
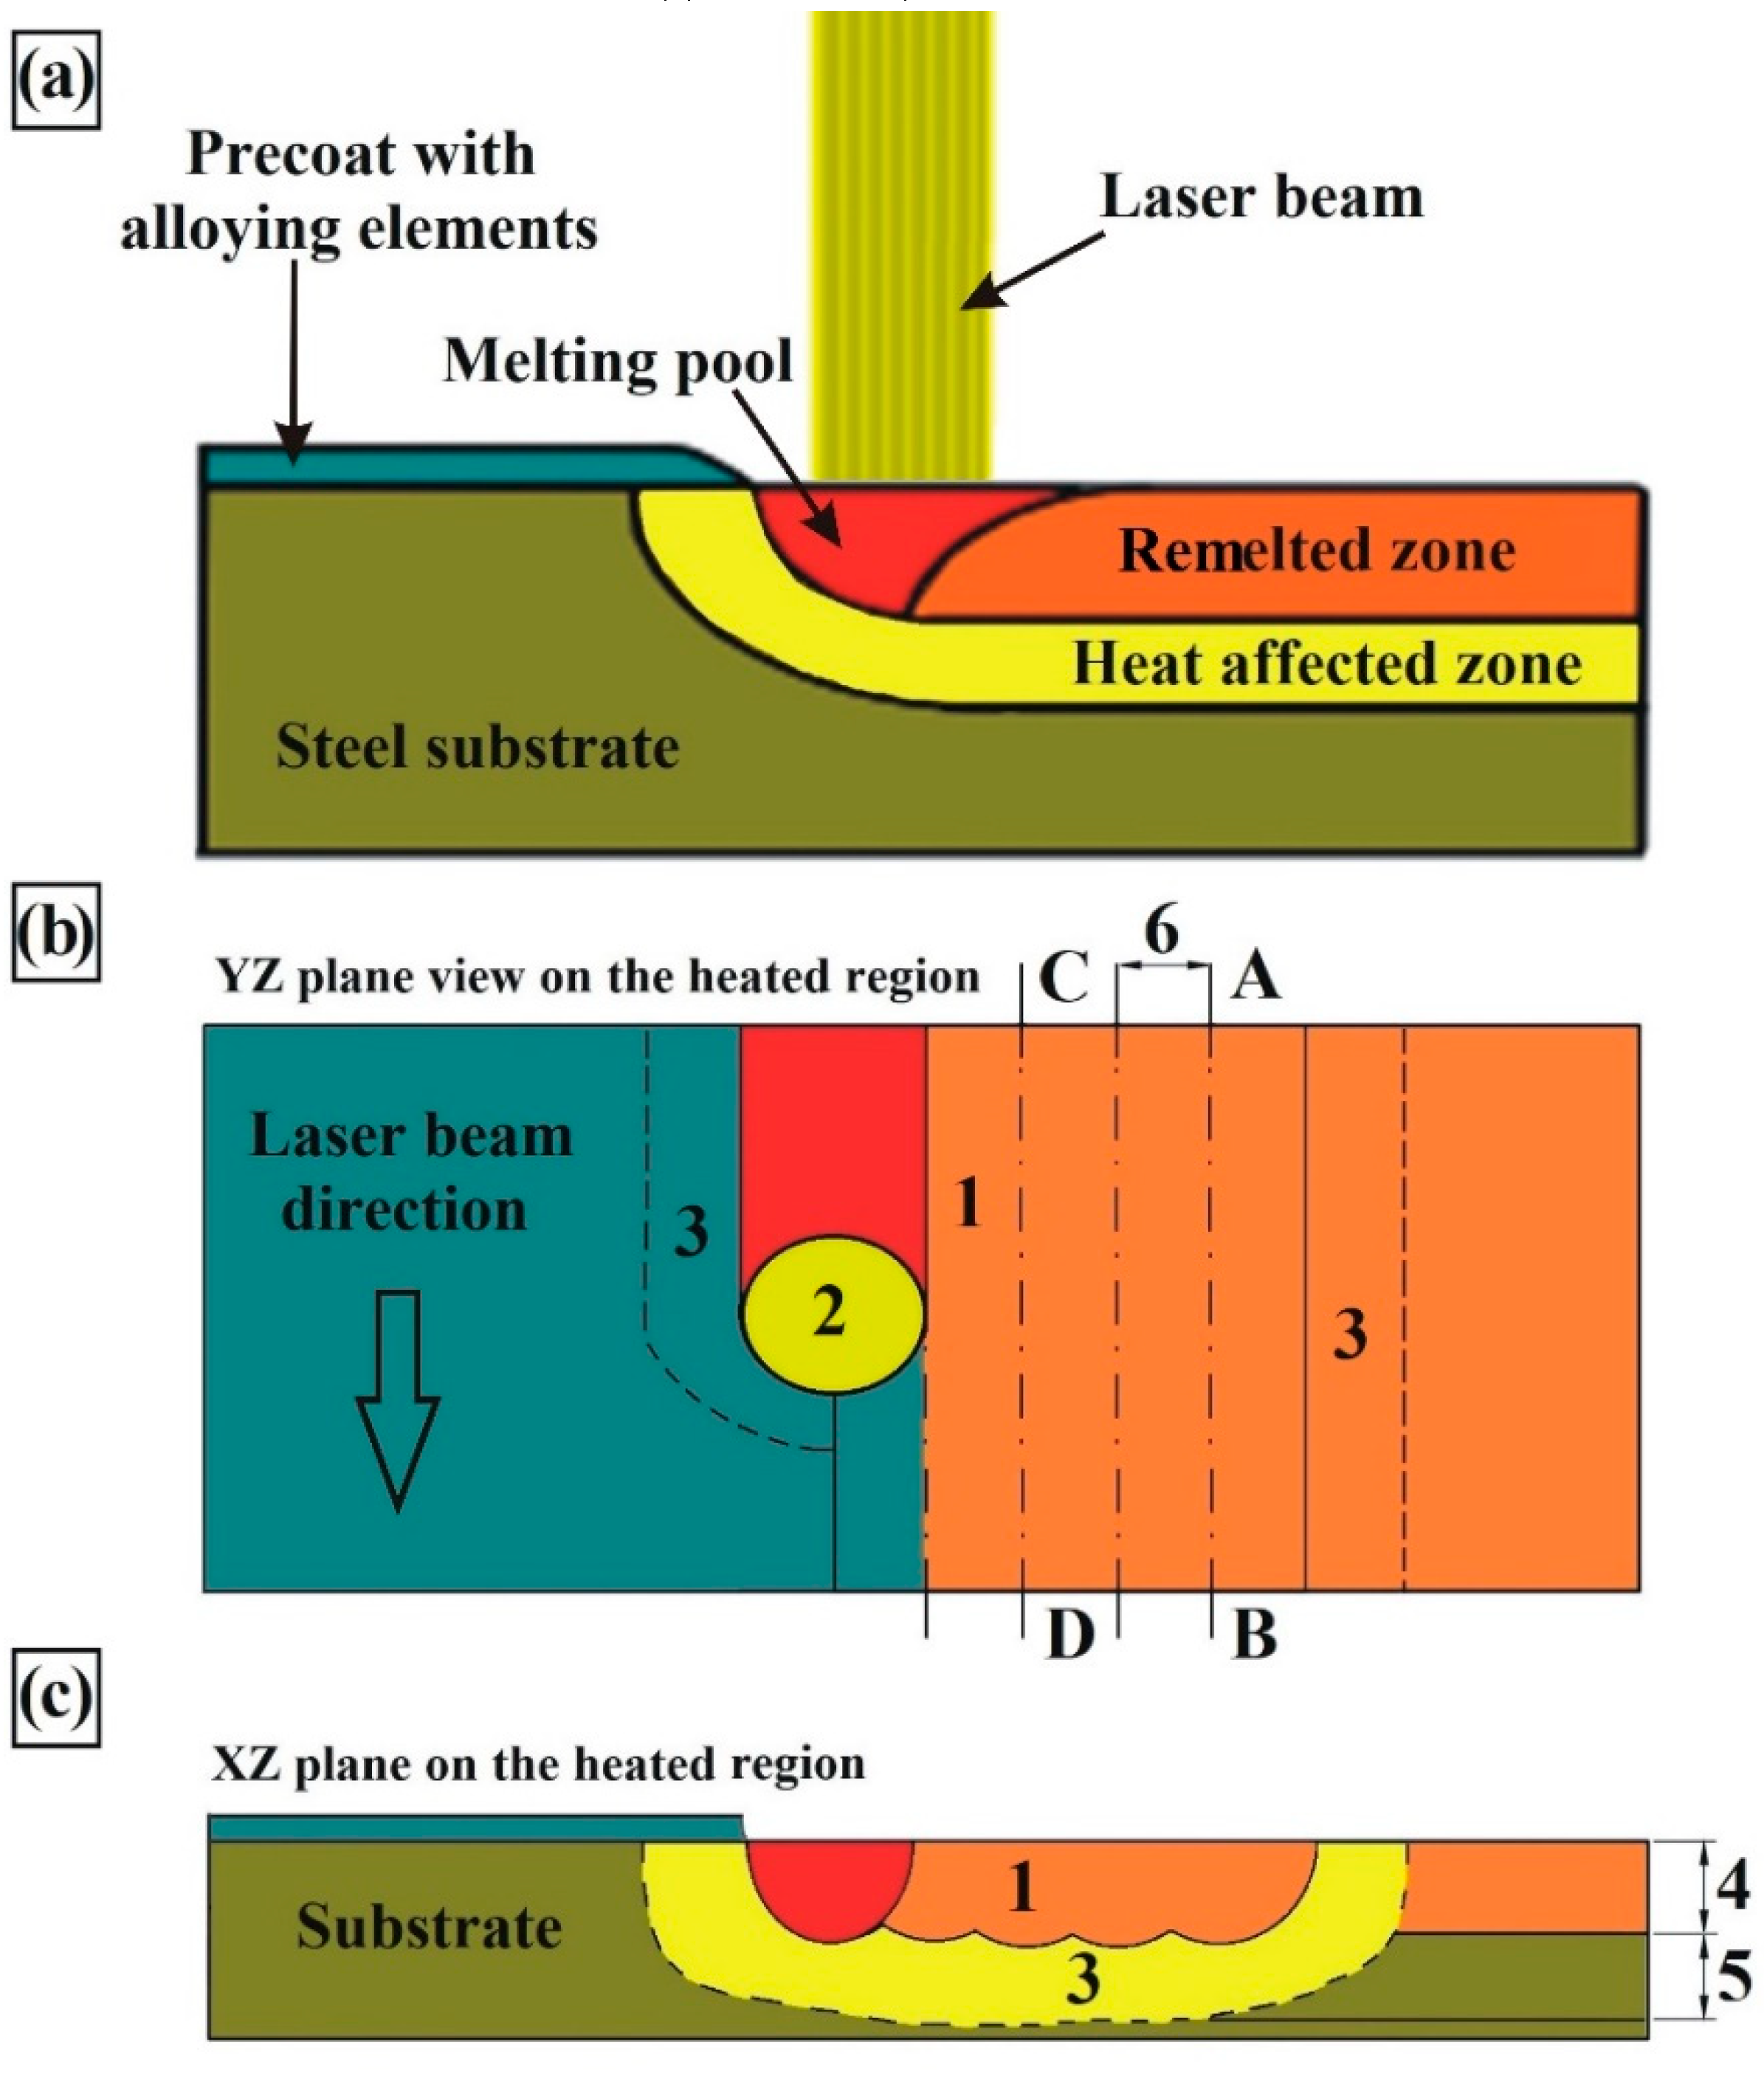
Several important phenomena occur during the laser alloying process. First, the laser beam hits the pre-coat and induces surface melting. After the pre-coat is completely melted, the substrate partially melts. Then diffusion occurs in melting pool. When the laser beam stops heating the material, the coating solidifies. This process begins from substrate and spreads in the molten pool, forming a coating. In the liquid state, convective movements caused increase of the diffusion in melting pool. This phenomenon results from the existence of three forces: gravity, viscosity and surface tension gradients. In fact, in the melting zone, the temperature is not uniform, and viscosity and surface tension depend on temperature. These gradients induce mass transport (Marangoni effect). The dendrites forming direction in the liquid pool is variable. Convective movements cause the disturbed of solidification process. The dark areas of the melted zone (
Figure 3e) indicate the existence of convective movements in this zone. Faulty laser processing conditions causes cracks (B coating—
Figure 3d) or porosity (Mo coating—
Figure 3b). Enrichment of the surface layer with Mo and B caused decrease of dendritic microstructure size. In this case, microstructure defects were not observed (
Figure 3f).
In order to identify the phase composition of the coatings tested, analyses using EDS and XRD methods were carried out. The EDS method is not good enough for determining the amount of boron because it has a relatively weak peak-to-background ratio, and in addition, boron peaks often coincide with carbon peaks. However, there are available papers in which the authors used the EDS method to indicate the boron quantity or its approximate content [
22,
23]. Some authors obtain a higher boron content in the produced coatings [
19], however, it should be noted that in the paper cited the carbon content in the coating was completely omitted.
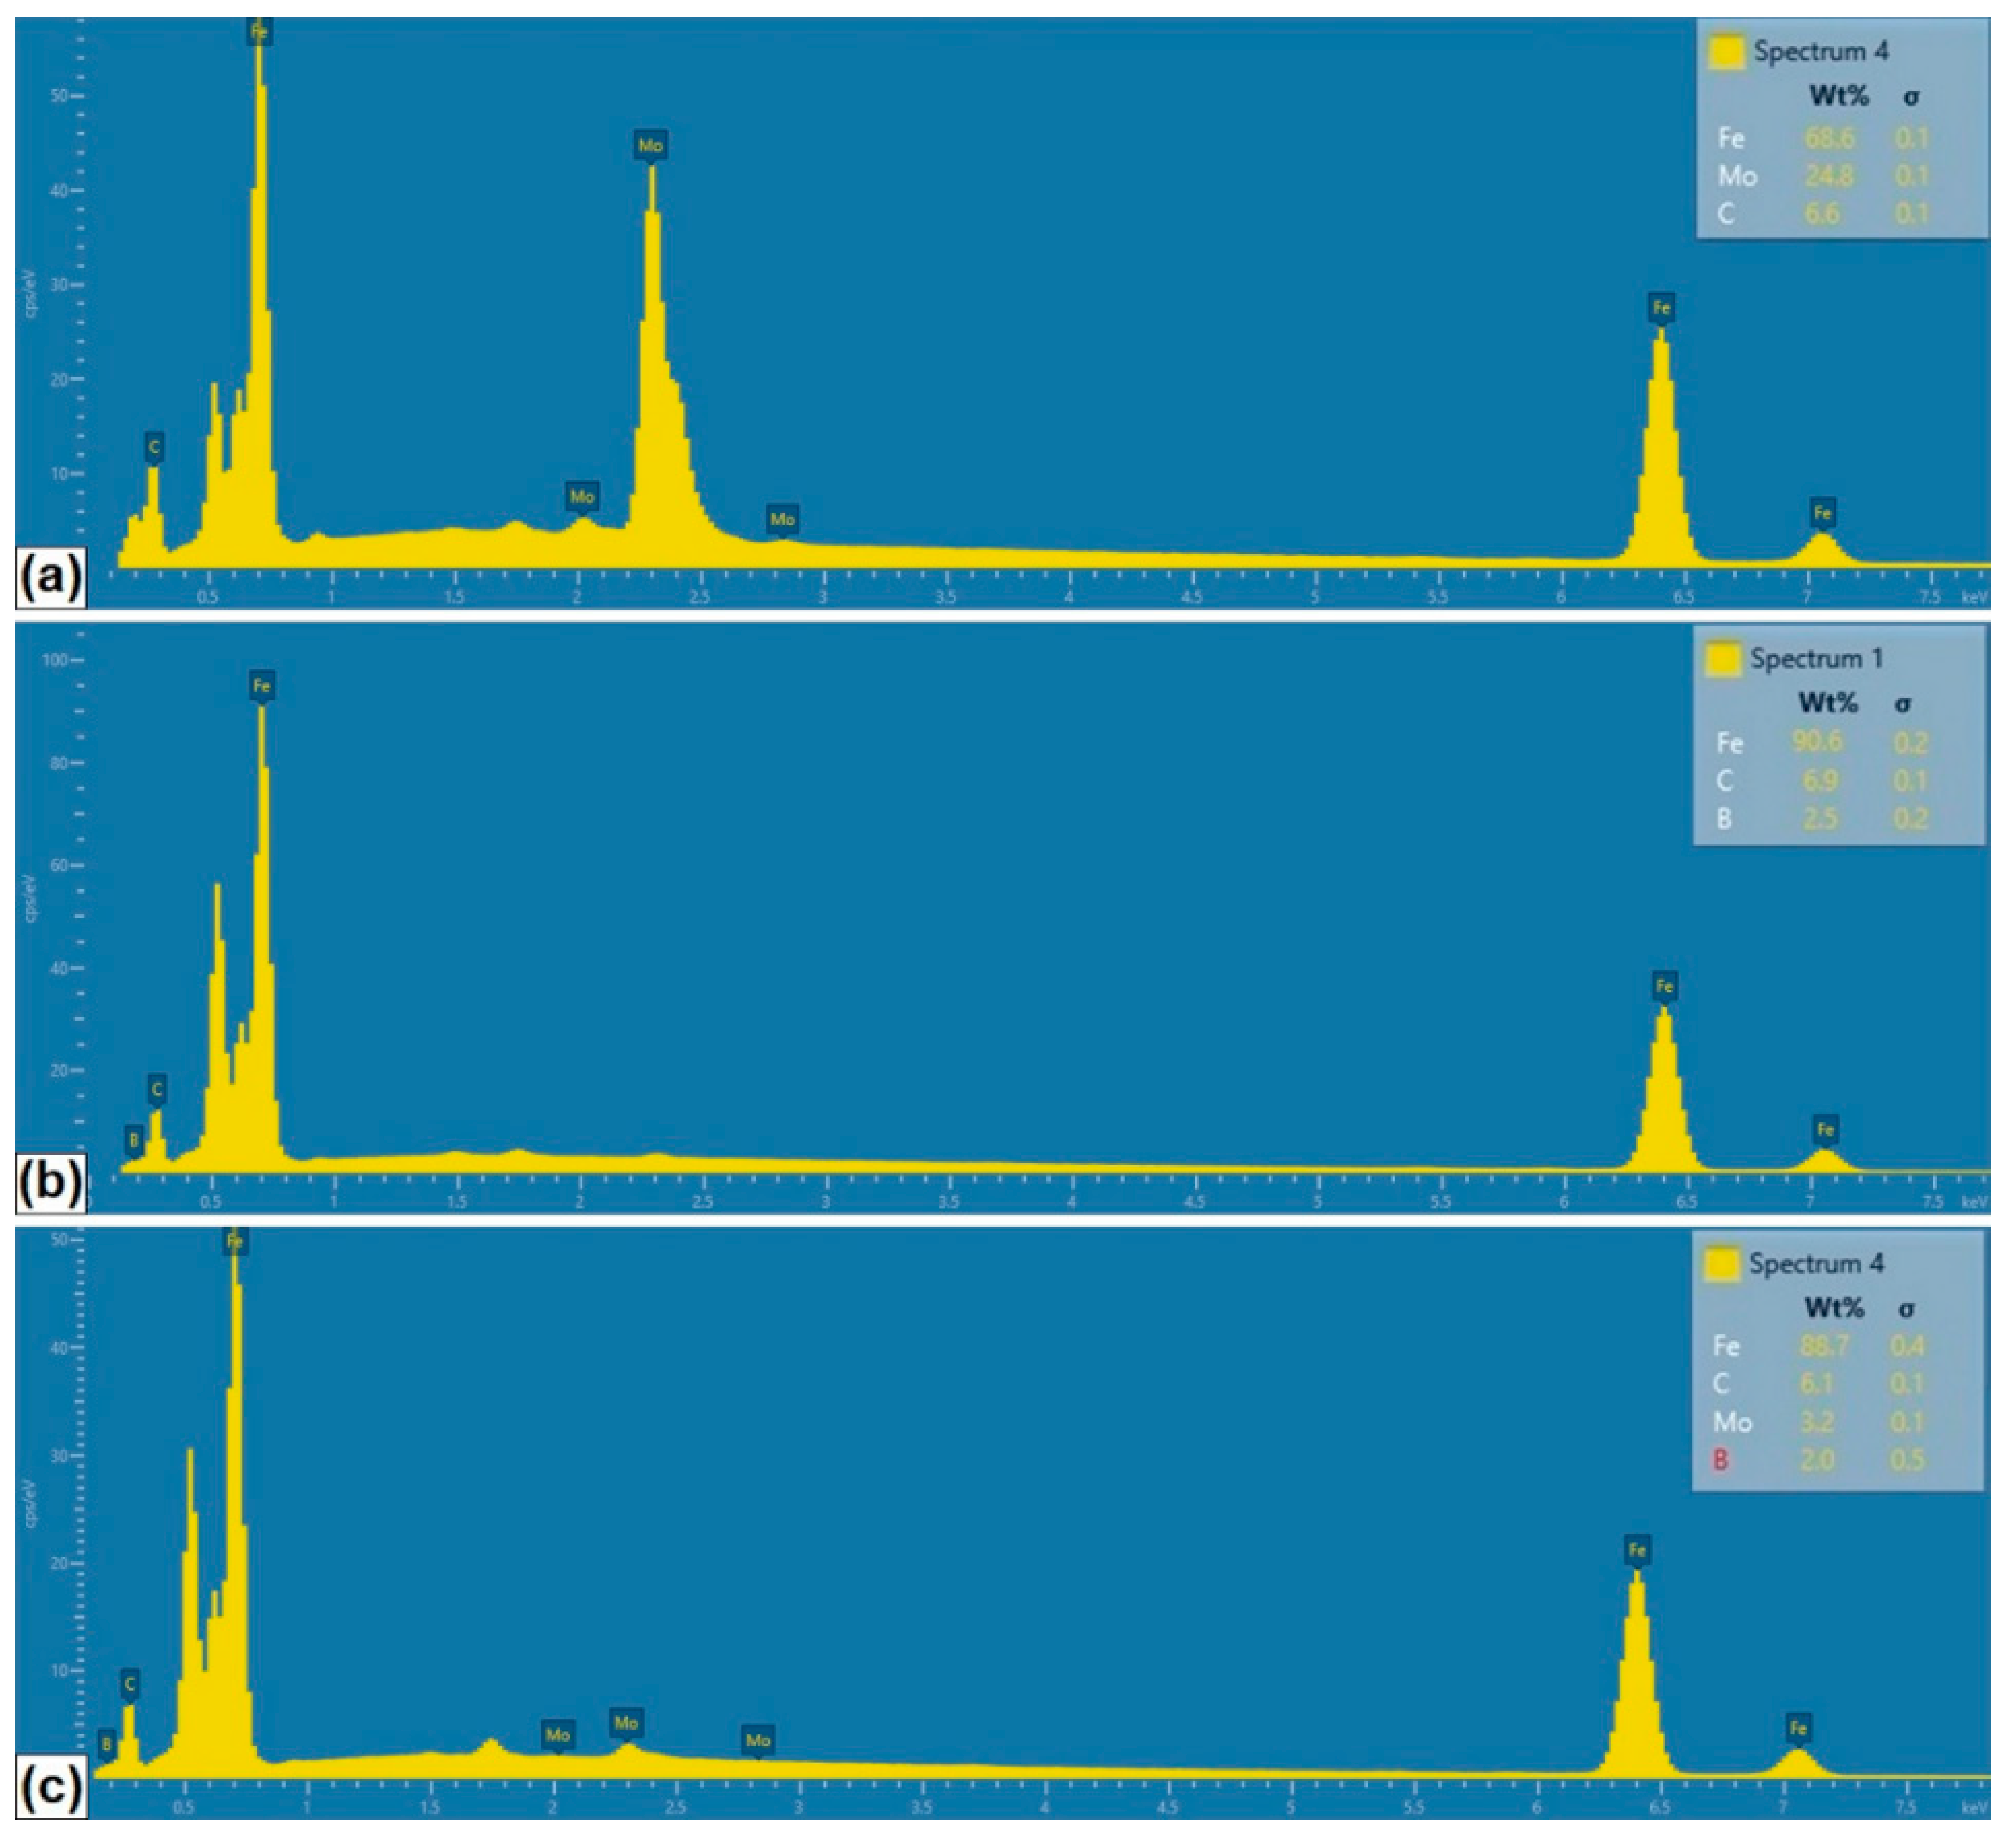
Figure 3b,d,f show the measurement points of significant chemical elements occurring in the produced coatings. The measured values are shown in
Table 4, and example spectra for the selected coatings are presented in
Figure 4.
In the case of the Mo coating (
Figure 3b), the EDS method was limited to three chemical elements that have a significant share in the coating, i.e., iron, molybdenum and carbon. An increased molybdenum content exceeding 10 wt.% in the dendritic skeletal areas was found (
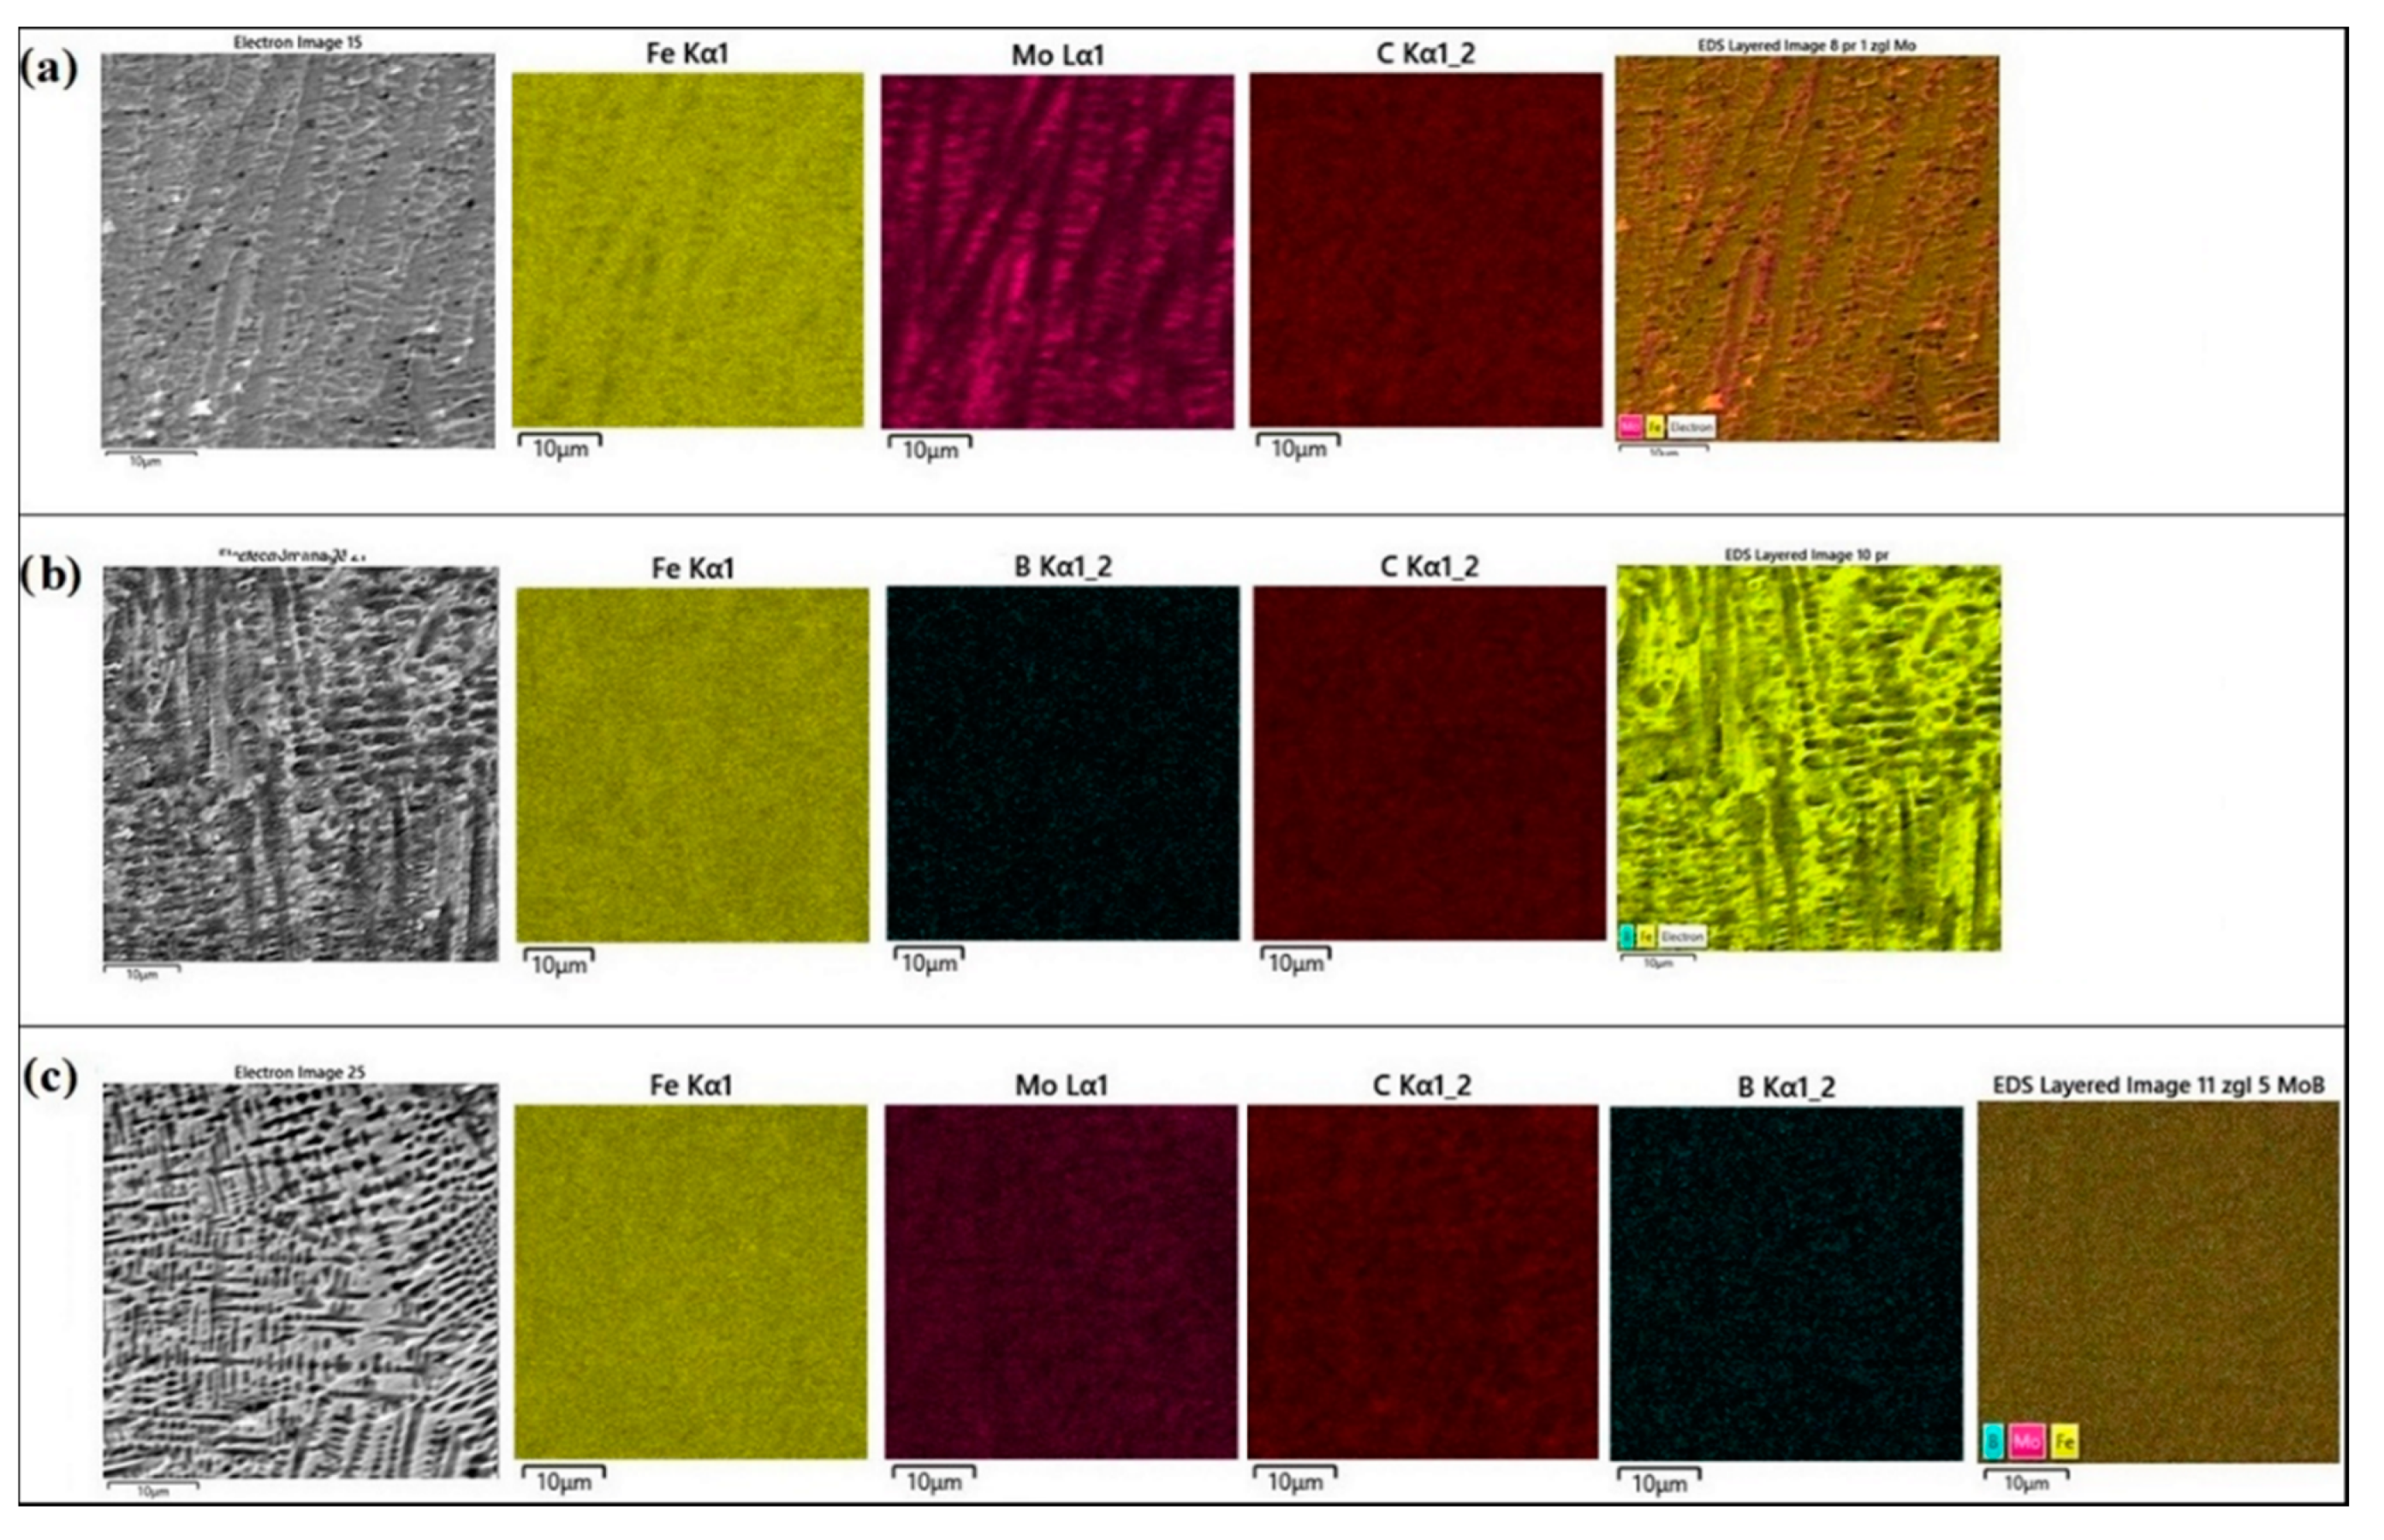
Figure 3a), while in interdendritic spaces its content oscillated in the range of 7 wt.%. Also, EDS mapping made for the Mo coating confirmed the increased molybdenum content in the resulting dendritic skeletal microstructure. As can be seen in
Figure 5a, an increased molybdenum content can be seen on dendrites, which is also confirmed by EDS point analysis.
In
Figure 3d the places of point EDS analysis for the boron coating are marked. As in the previous specimens, the measurement points were located in the area of dendrites occurrence and in the interdendritic spaces of the boride-martensitic eutectic. The results are summarized in
Table 4, and in
Figure 4b an example spectrum is shown. In this case, to assess the approximate share of chemical elements in the coating, iron, carbon and boron were taken into account. Due to the fact that boron is a light element, and its content is distorted by the carbon peaks, these EDS results are only approximate results. It can be assumed that complex phases are formed. It is most likely boron cementite Fe
3(C, B), where part of the carbon is replaced with boron atoms, which is confirmed by the results of X-ray diffraction analysis (
Figure 6). The EDS mapping of the boron coating shows an even distribution of iron, boron and carbon (
Figure 5b).
In
Figure 3f the places of EDS point analysis for the Mo-B coating in dendritic and interdendritic areas are marked. An increased content of boron and molybdenum was found in the area of dendrites occurrence. In contrast, in interdendritic spaces, the iron amount increases. This happens at the expense of boron and molybdenum, which is confirmed by EDS mapping of this area (
Figure 5c). The carbon content for the Mo-B coating presented in
Table 3 indicates the overlapping of boron and carbon peaks (
Figure 4c). Based on the results obtained, it can be assumed that complex phases Mo
1-xFe
xB are formed, which may correspond to (Fe, Mo)
2B or Fe
3(C, B, Mo) phases.
In previous studies [
7] where a layer with modifying element was remelted a by laser beam on a steel substrate, the X-ray microanalysis revealed that modifying elements only occurred in the remelted zone, and there was no increase in their content in the heat-affected zone. It was found that the microstructure can be of various shapes, i.e., branched, round or angular [
6,
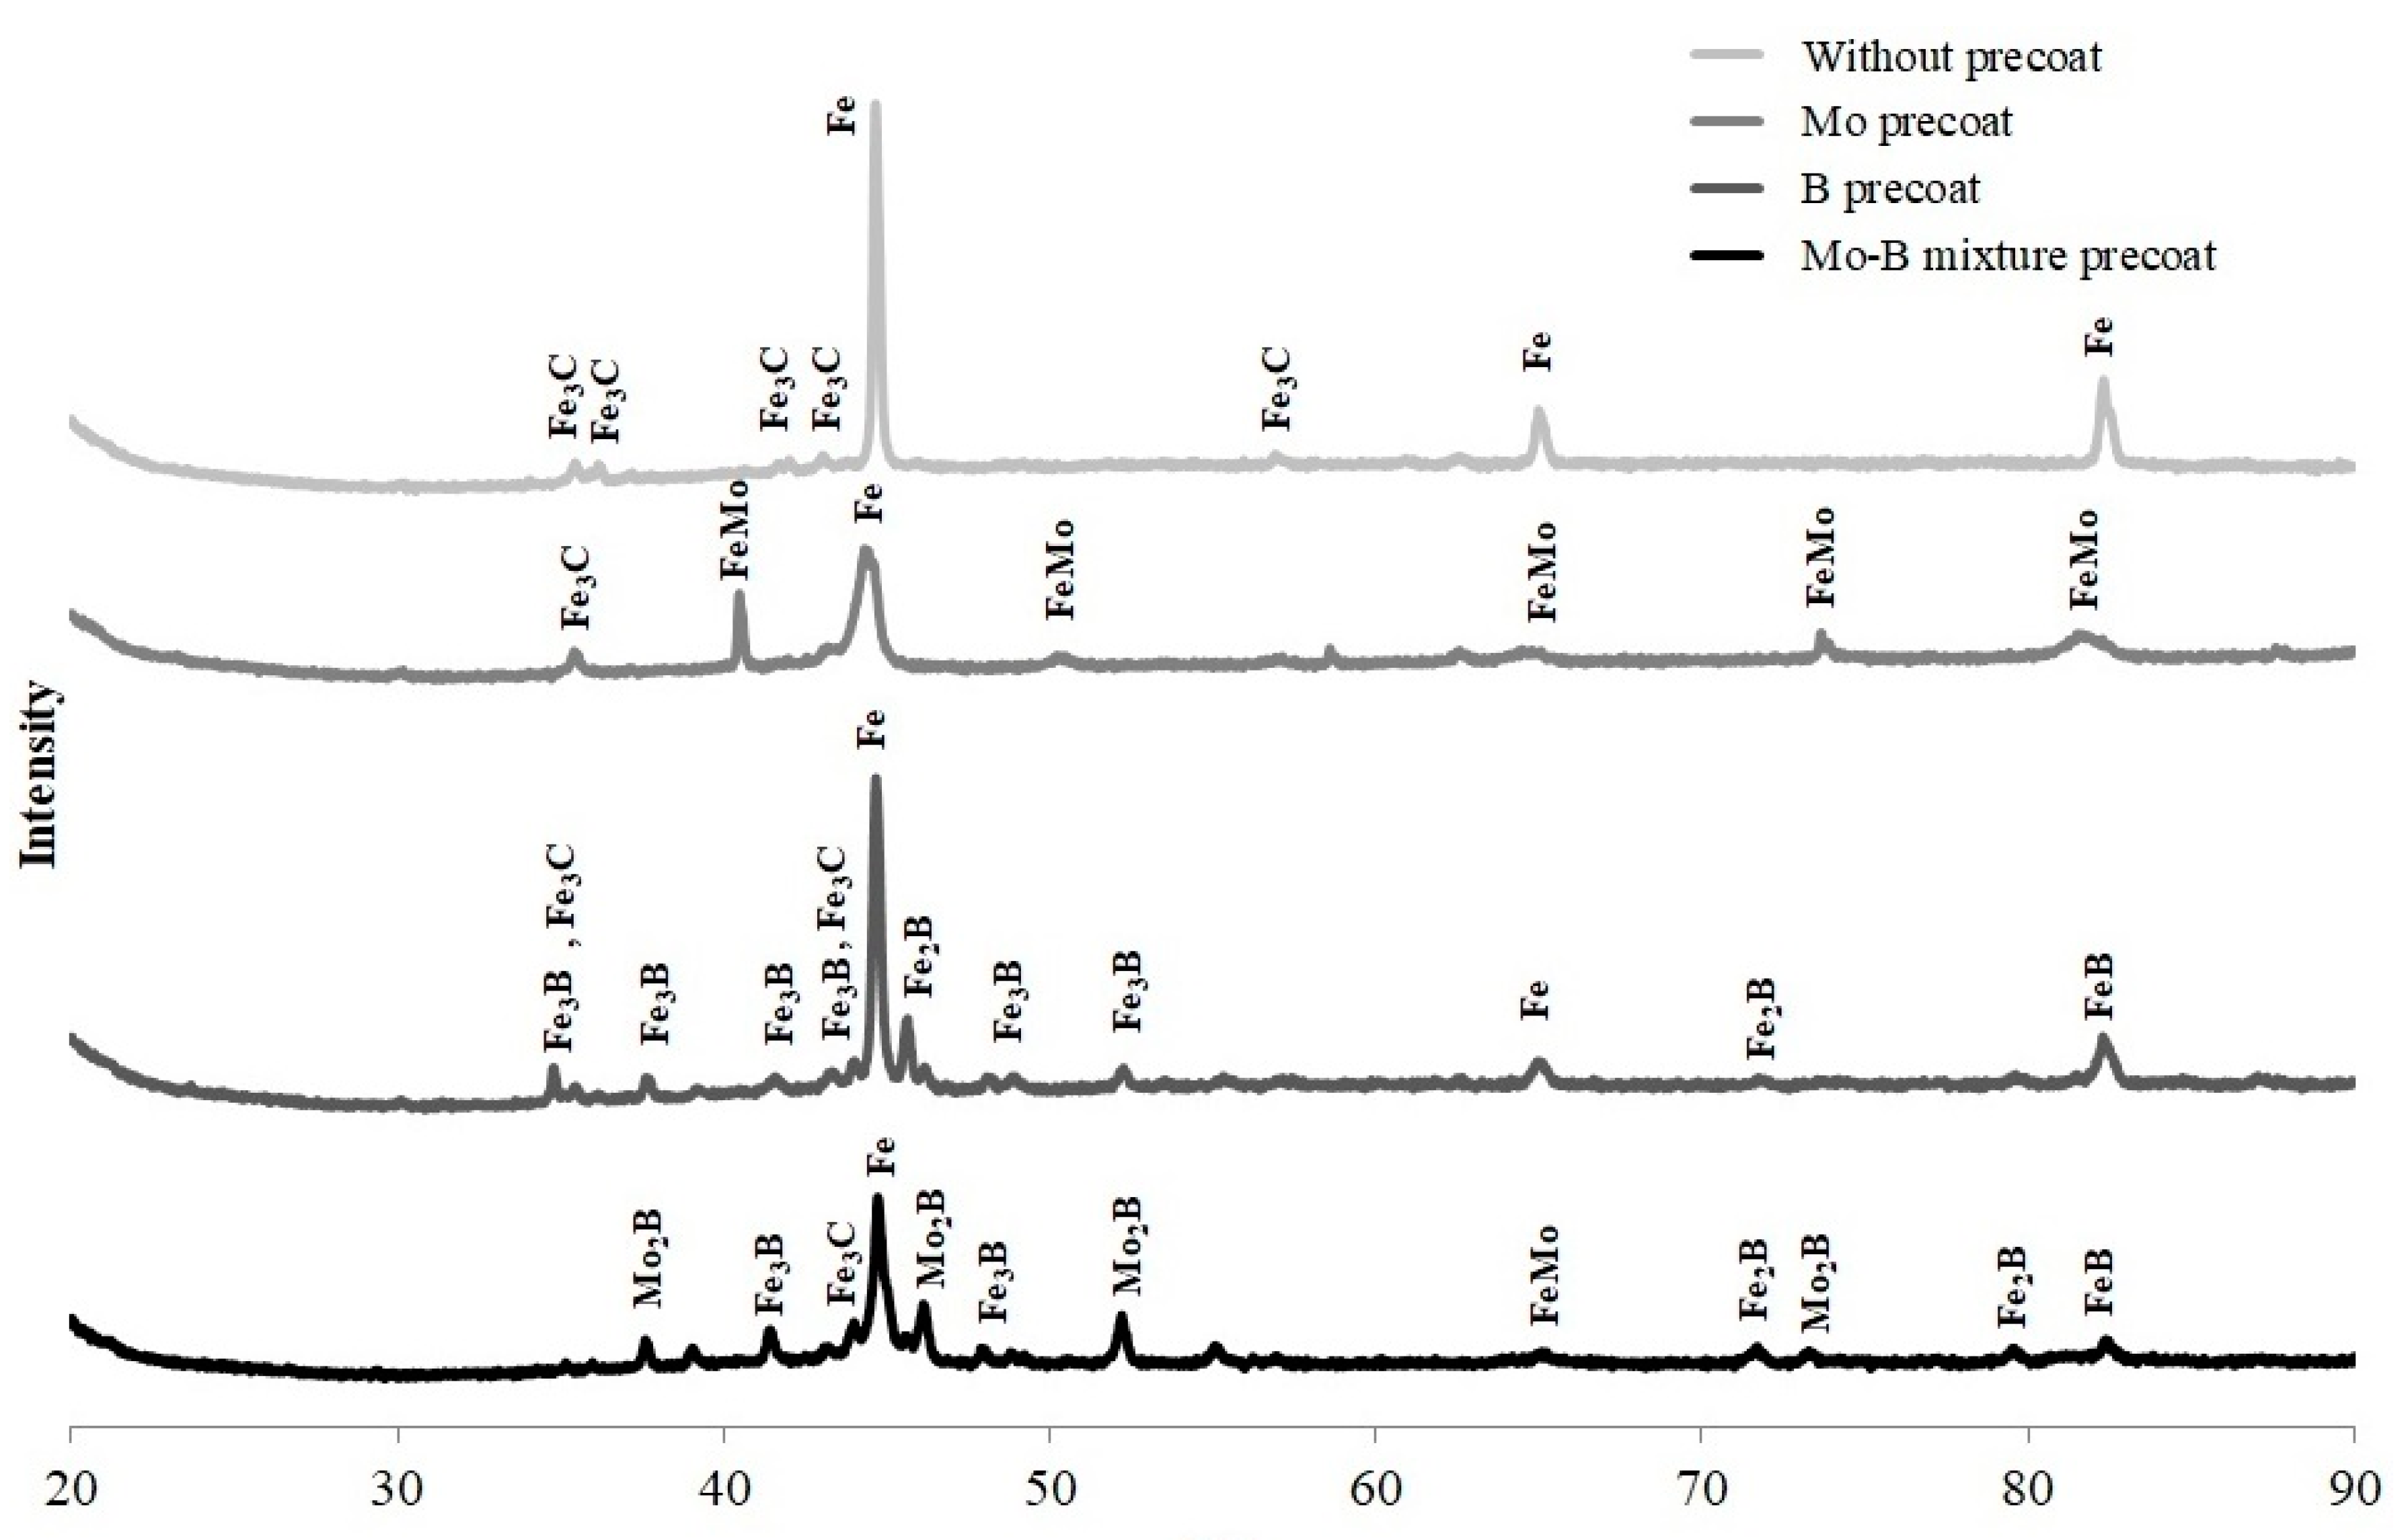
7]. As a result of laser processing, the increase of alloying elements from pre-coat (Mo, B) content in remelted zone was observed. It should be noted that the laser processing parameters affect both microstructure and phase composition, and thus the properties of newly formed coatings. The phase composition resulting from laser alloying of pre-coat contained Mo and B was analyzed and the results are shown in
Figure 6.
In Mo-coating the presence of FeMo martensite as well as Fe3C and Fe peaks were found. In B-coating produced by laser on steel the equilibrium of iron boride phases FeB and Fe2B, nonequilibrium of iron boride phase Fe3B, and also Fe and Fe3C peaks were identified.
In Mo-B-coating the equilibrium phases such as molybdenum boride Mo
2B and iron borides Fe
2B and FeB as well as nonequilibrium phases such as iron boride Fe
3B and also Fe and FeMo peaks were detected, whereas in the CT90 steel after laser alloying the peaks of Fe
3C and Fe phases were present only. On all three XRD spectra, the peak from Fe was the most intense, which indicates its highest content. In papers [
4,
11,
15,
20], the authors confirmed peaks from simple and complex phases corresponding to iron borides and molybdenum borides. These phases were consistent with the B-Mo-Fe ternary equilibrium diagram [
24].
3.2. Microhardness Profiles
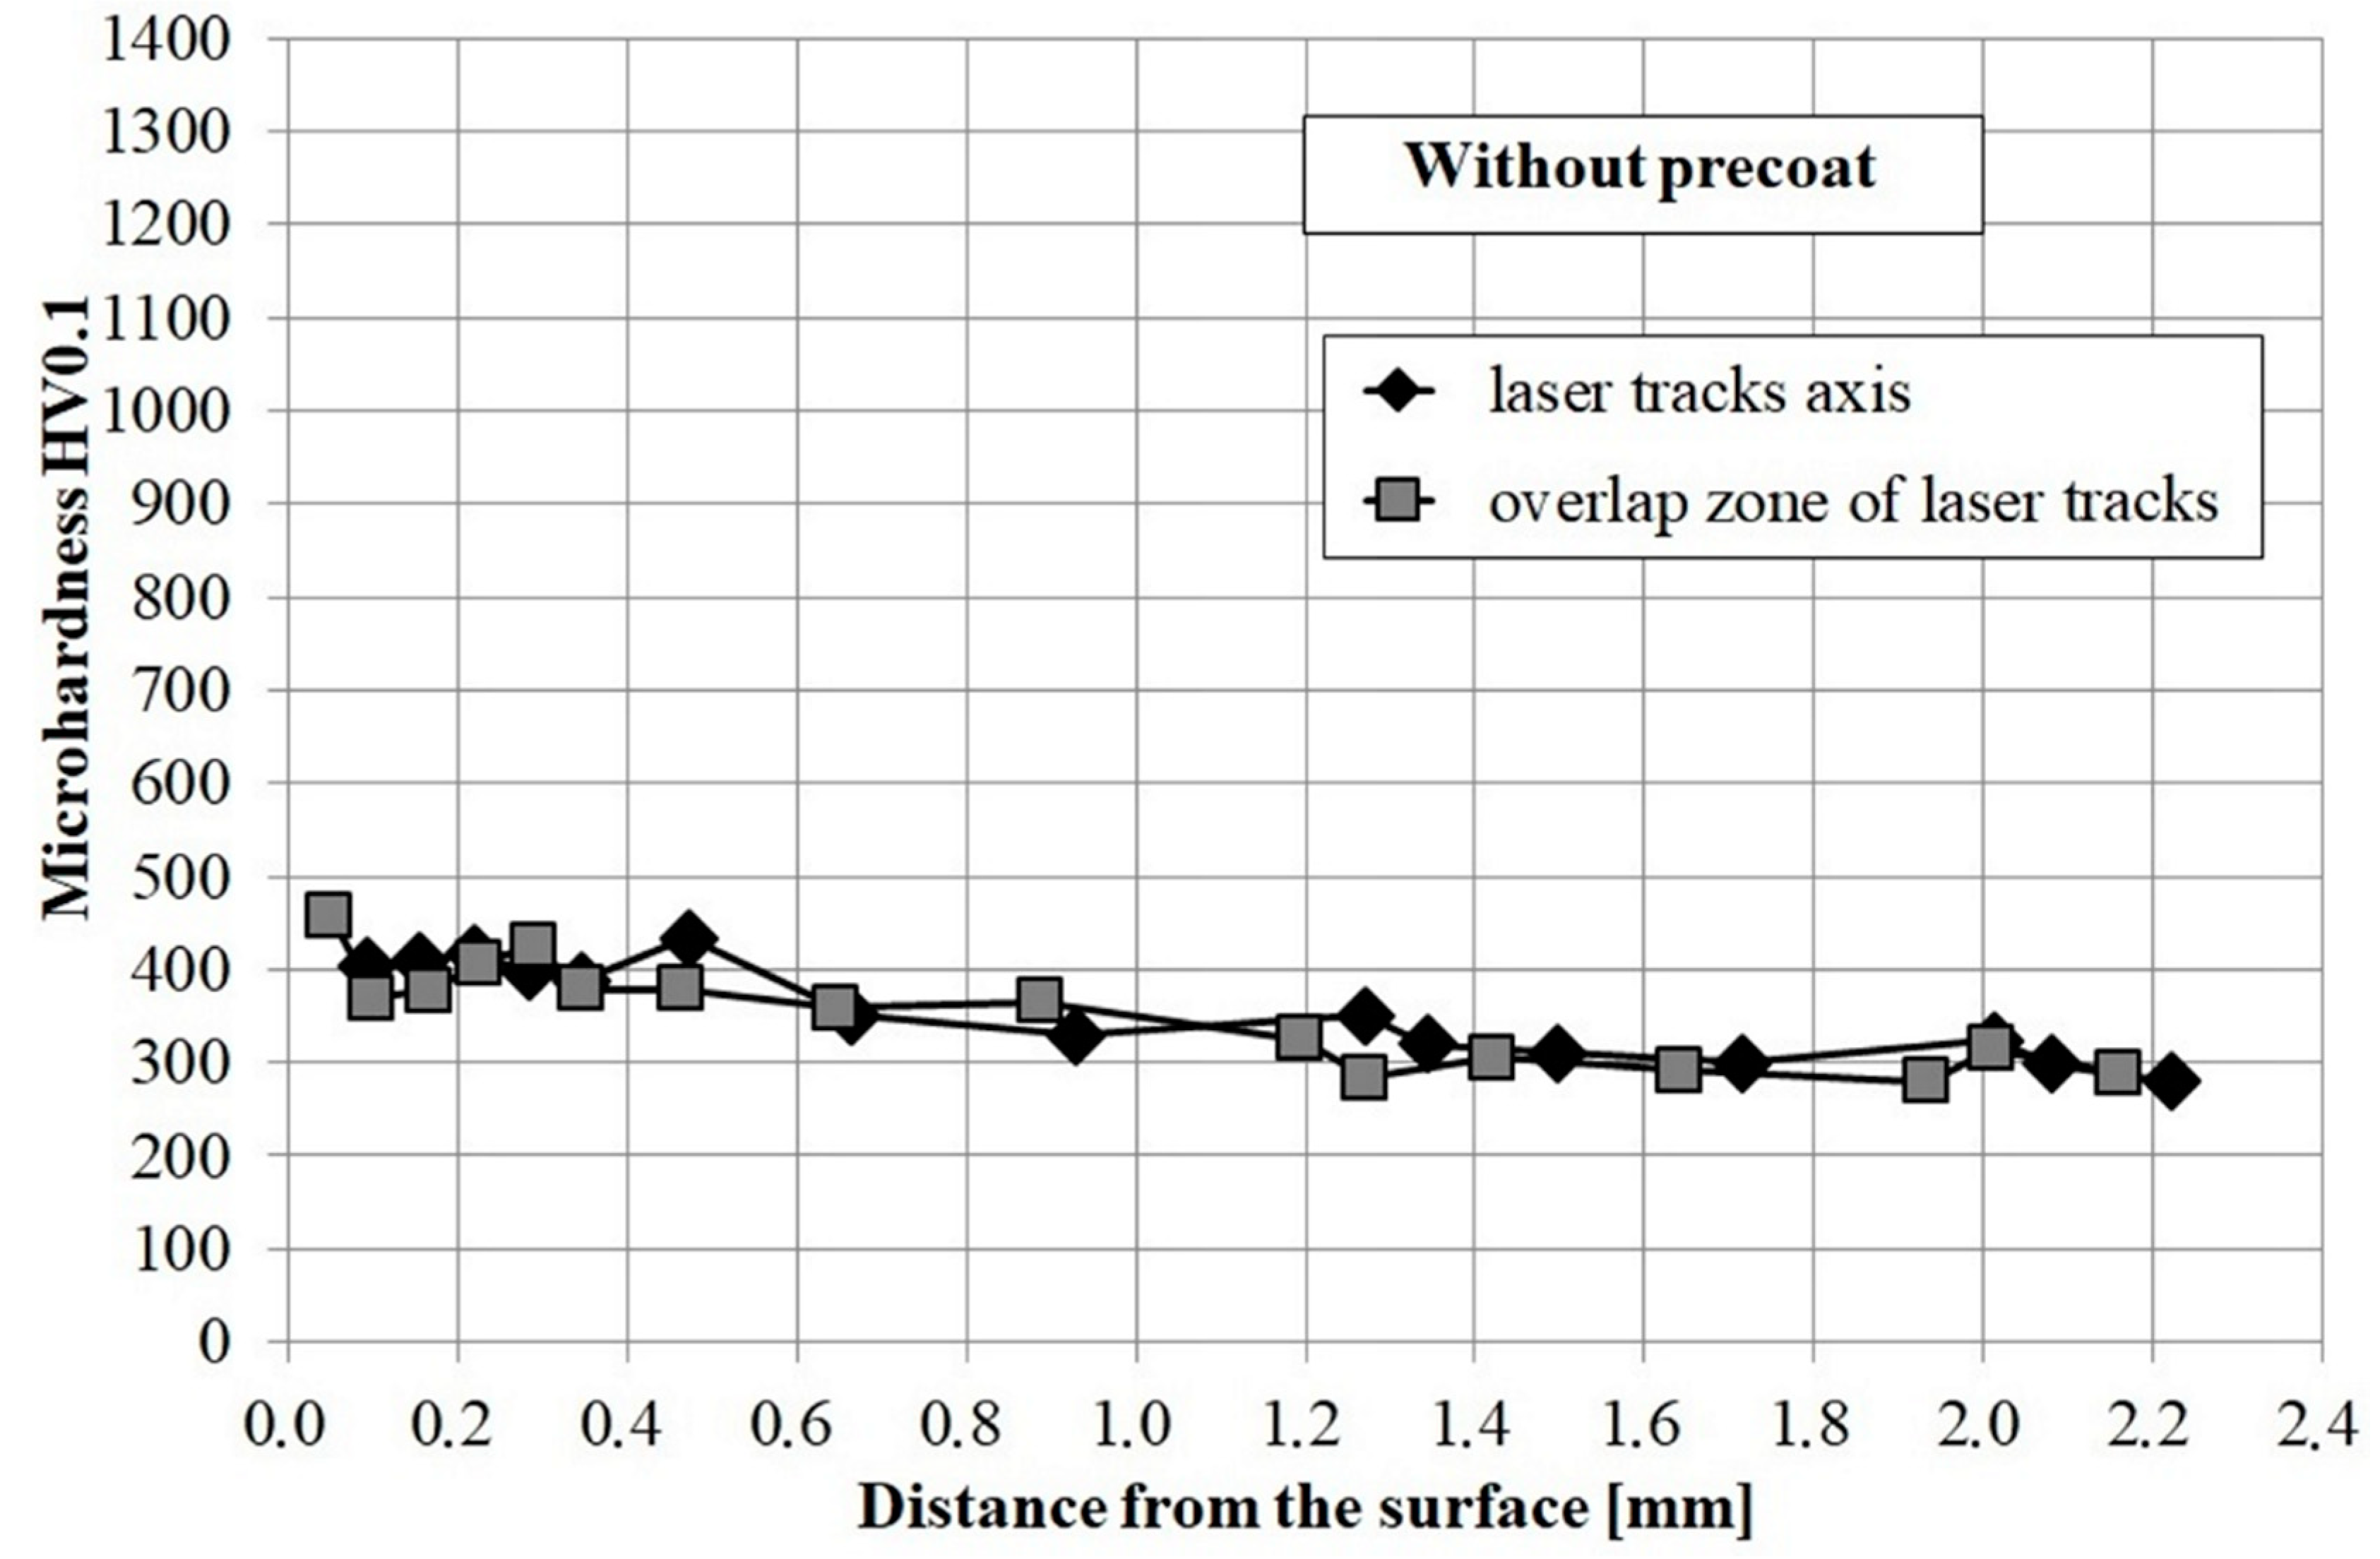
Microhardness profiles of laser modified coating containing molybdenum, boron as well as mixture of boron and molybdenum were compared with the microhardness profiles of CT90 steel after laser remelting using the same laser beam parameters. All the diagrams are presented in
Figure 7 and
Figure 8. Microhardness was investigated along the axis of the laser tracks and along the overlapping of tracks zone. In both cases microhardness was similar.
The microhardness of CT90 steel after laser modification without any pre-coat was about 400 HV0.1 (
Figure 7). The relatively low microhardness could have resulted from the use of high laser beam power. Subsequent laser tracks caused tempering of the previous ones, which resulted in a small increase in microhardness relative to the core.
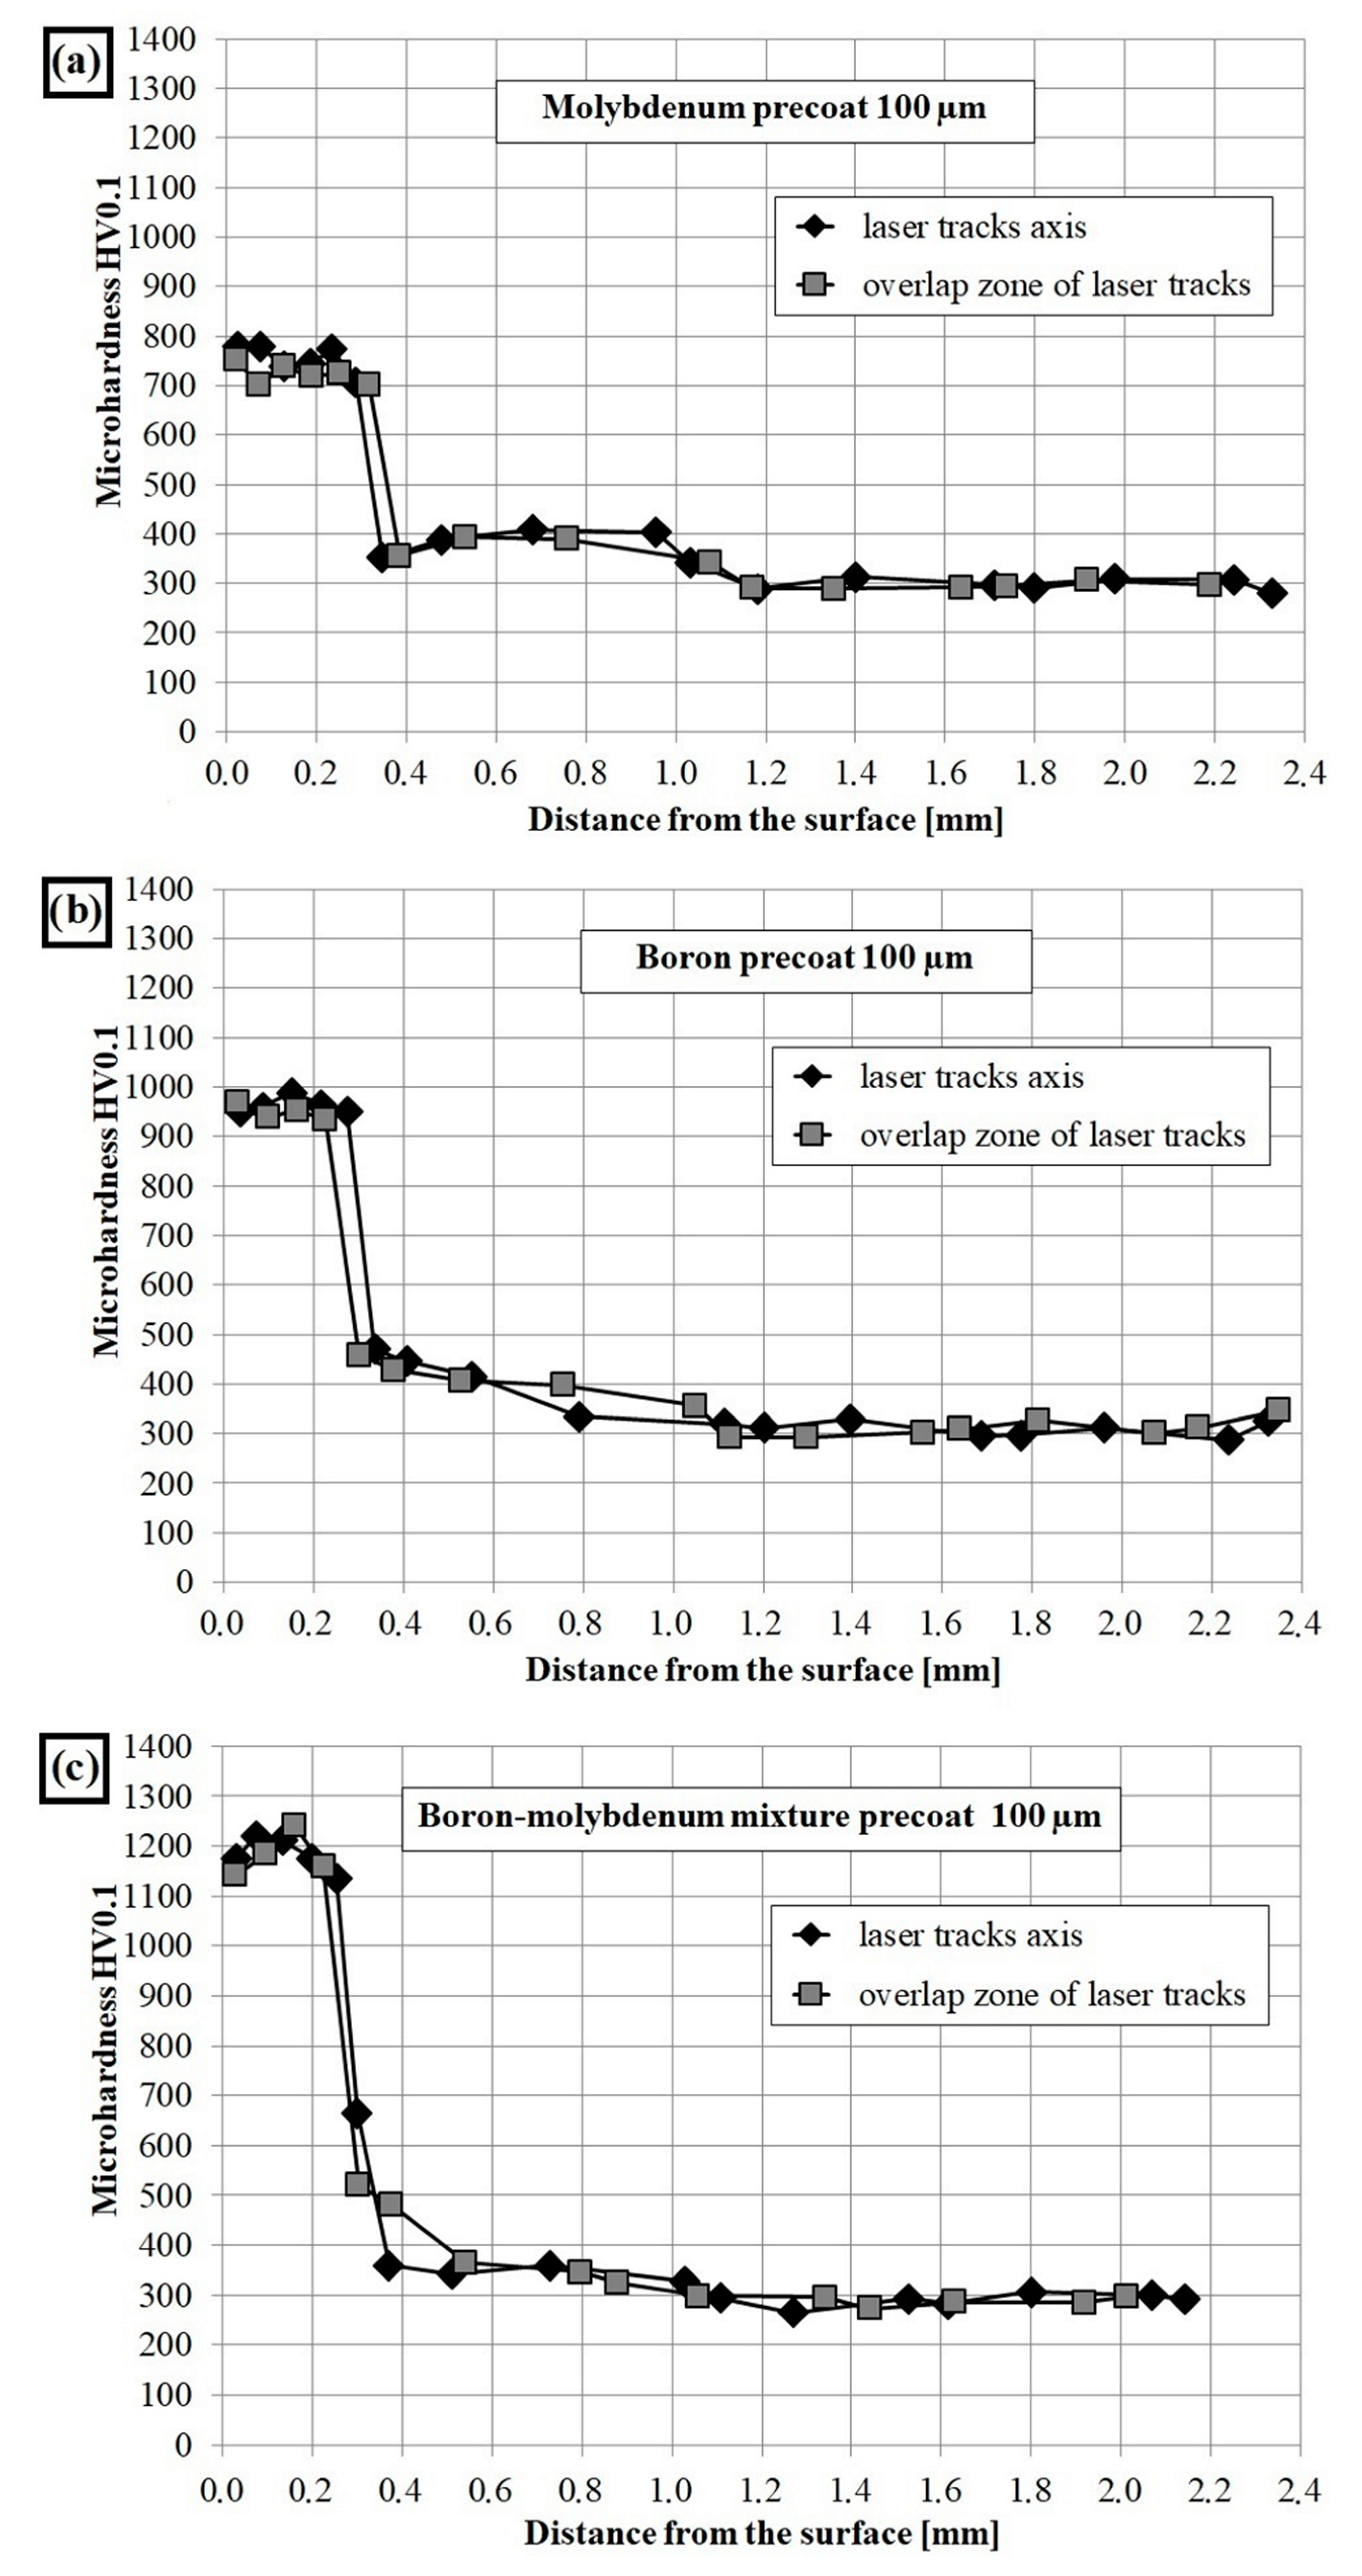
Figure 8a shows the microhardness profiles of Mo-coating. The tests have shown that microhardness in the remelted zone was about 800 HV0.1 and decreased gradually in the heat- affected zone to a hardness of 400 HV0.1, to finally reach the value of about 300 HV0.1 in the sorbite substrate. The addition of molybdenum caused an increase in microhardness. It can be assumed that during laser processing a solution saturated with molybdenum was formed (which is confirmed by EDS and XRD results). Molybdenum caused increase in hardenability, and thus during laser alloying the coating characterized by higher microhardness was obtained. For comparison, other researchers obtained a molybdenum coating with a hardness from 1100 to 900 HV depending on the laser processing parameters used [
20]. While, in paper [
13], the hardness on the coating cross-section was in the range from 750 to 650 HV with a laser beam power of 800 W and a scanning speed of 10 mm/s.
Figure 8b shows the microhardness profiles of B-coating. As a result of laser alloying the microhardness in the remelted zone was about 1000 HV0.1. In the heat affected zone the microhardness was lower and reaches about 500 HV, while in the core, a value of about 300 HV was found. The boron coatings obtained by laser alloying do not achieve the microhardness such as after diffusion boronizing process but are characterized by greater thickness. The microhardness is affected by the microstructure, which, in turn, changes depending on the parameters of the laser processing. The obtained microhardness values, in the remelted zone, were comparable to the results in other studies [
25]. An exception is the case of a coating in which FeB and B
2O
3 were produced and its microhardness ranged from 1600 to 900 HV [
10]. Each of the base components of the coating is characterized by a different atomic diameter. It can be concluded that the addition of boron (81 pm) or molybdenum (137 pm) to steel substrate consisting mainly of iron (124 pm) have an influence on the change in the crystal lattice and thus, the properties of the coating.
Various microhardness values in remelted zone for Mo-B-coating were probably due to varying thermal capacity of these materials. Average microhardness in the remelted zone of these coatings was approx. 1200 HV0.1 and decreased in the heat affected zone to a hardness ranging from 600 HV0.1 to 450 HV0.1, to finally reach the hardness of steel substrate (
Figure 8c).
It should be mentioned that the iron borides and molybdenum borides are characterized by high hardness (Mo
2B has 1660 HK, and Fe
2B has 1600 HV). In this study, such results of hardness were not obtained due to the high proportion of iron in the substrate, which is confirmed by the results of EDS and XRD analysis. In other work, B-Si coatings was examined [
26]. A lower laser beam power density (33.12 kW/cm
2) was used. Coatings were made on medium carbon steel. As a result, both boron and B-Si coatings were characterized by smaller thickness. It was found that addition of boron and silicon contribute to formation of hard iron borides phases. The B-Si coating had a higher microhardness than Mo-B coating and reached values up to 1800 HV0.1.
3.3. Corrosion Resistance
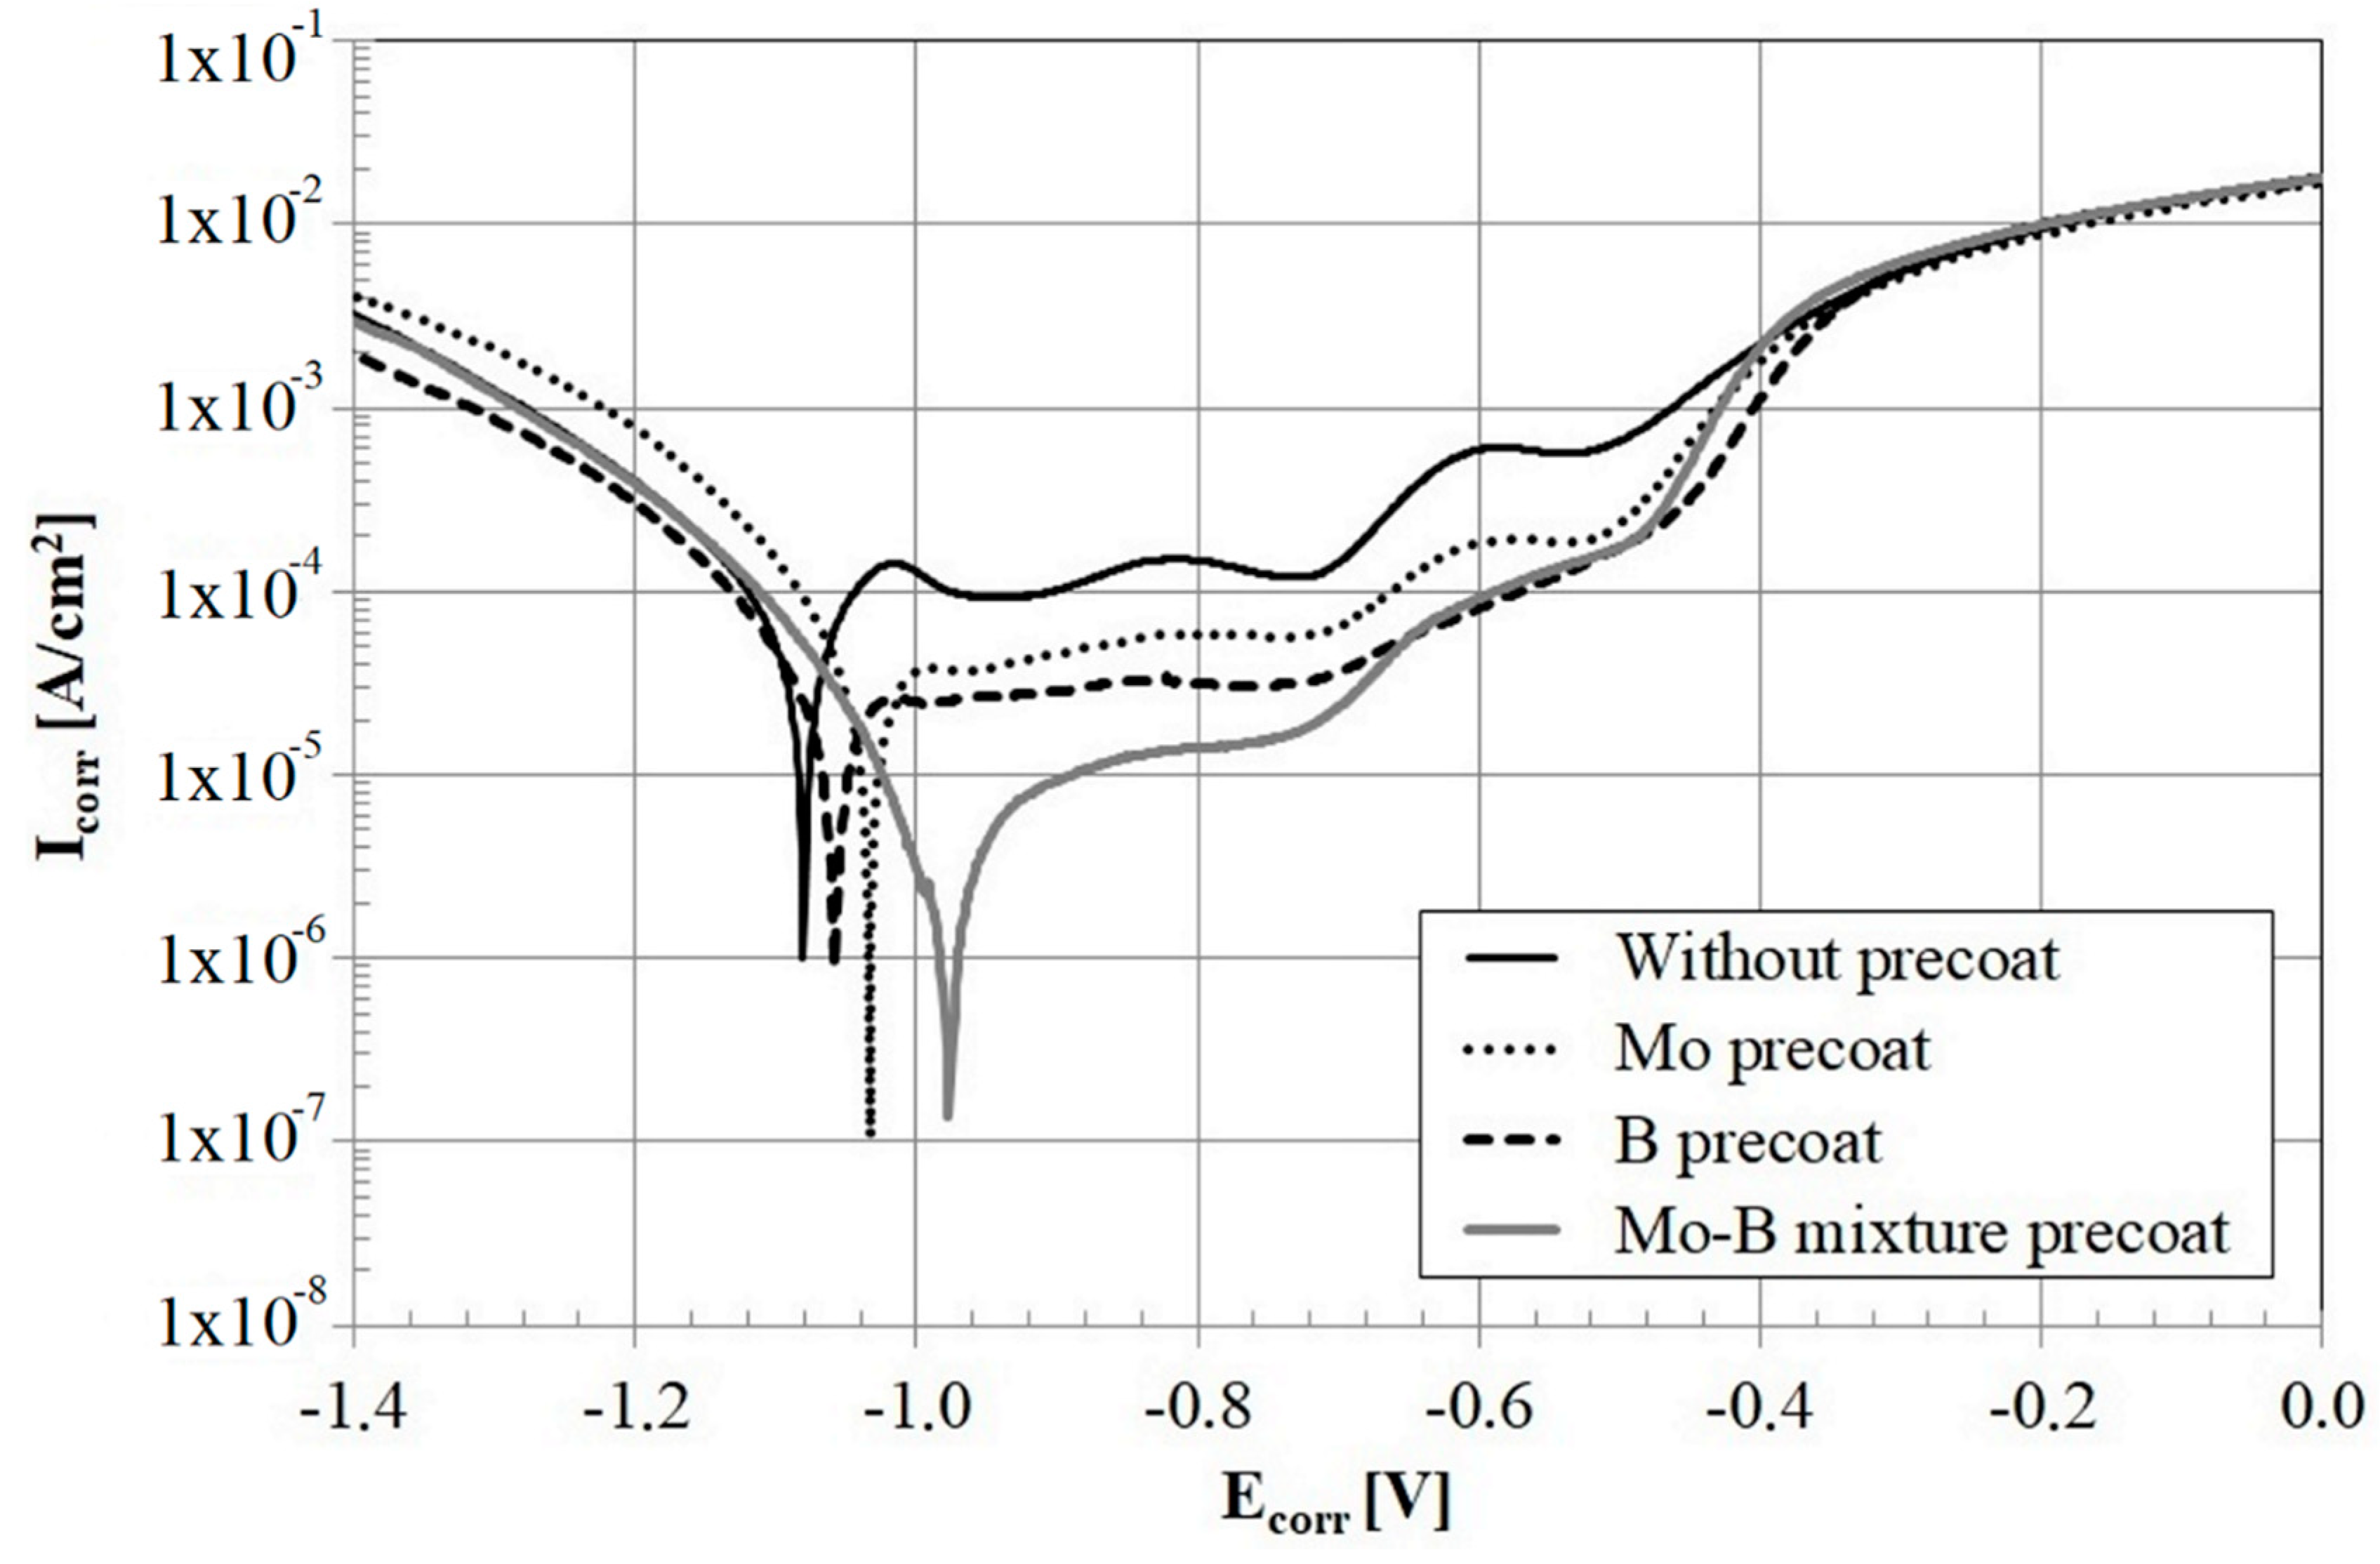
Results of corrosion tests are shown in
Figure 9 where the current density curves are presented as a function of predetermined potential. The values of electrochemical parameters determined based on the analysis of the curves are shown in
Table 5. In the tests carried out in a 5% NaCl solution the lowest corrosion resistance was obtained for CT90 steel after laser alloying. Laser modified Mo-coating and B-coating as well as Mo-B-coating showed better corrosion resistance. The best corrosion resistance was observed in the laser modified Mo-B-coating. Despite the occurrence of fine porosities of nanometeric size which were present in the microstructure of the Mo-coating, there is no rapid deterioration of corrosion resistance.
However, the combination of boron and molybdenum significantly improves the resistance of steel covered with such a coating. It can be seen that the corrosion curves are shifted towards lower potentials and lower corrosion current, which is a sign of better corrosion resistance.
The good corrosion resistance is affected by the obtained eutectic microstructure, which is rich in iron borides and molybdenum. The graph in
Figure 9 shows a slightly worse corrosion resistance of boron coating than molybdenum coating. It can be assumed that the reduced corrosion resistance was affected by cracks along the long dendrites in the boride-martensitic eutectic structure, visible in
Figure 3b. The B-Si coatings [
26] showed slightly better corrosion resistance than Mo-B coatings. This can be explained by the fact that described Mo-B coatings were thicker, so the content of iron susceptible to corrosion was higher.
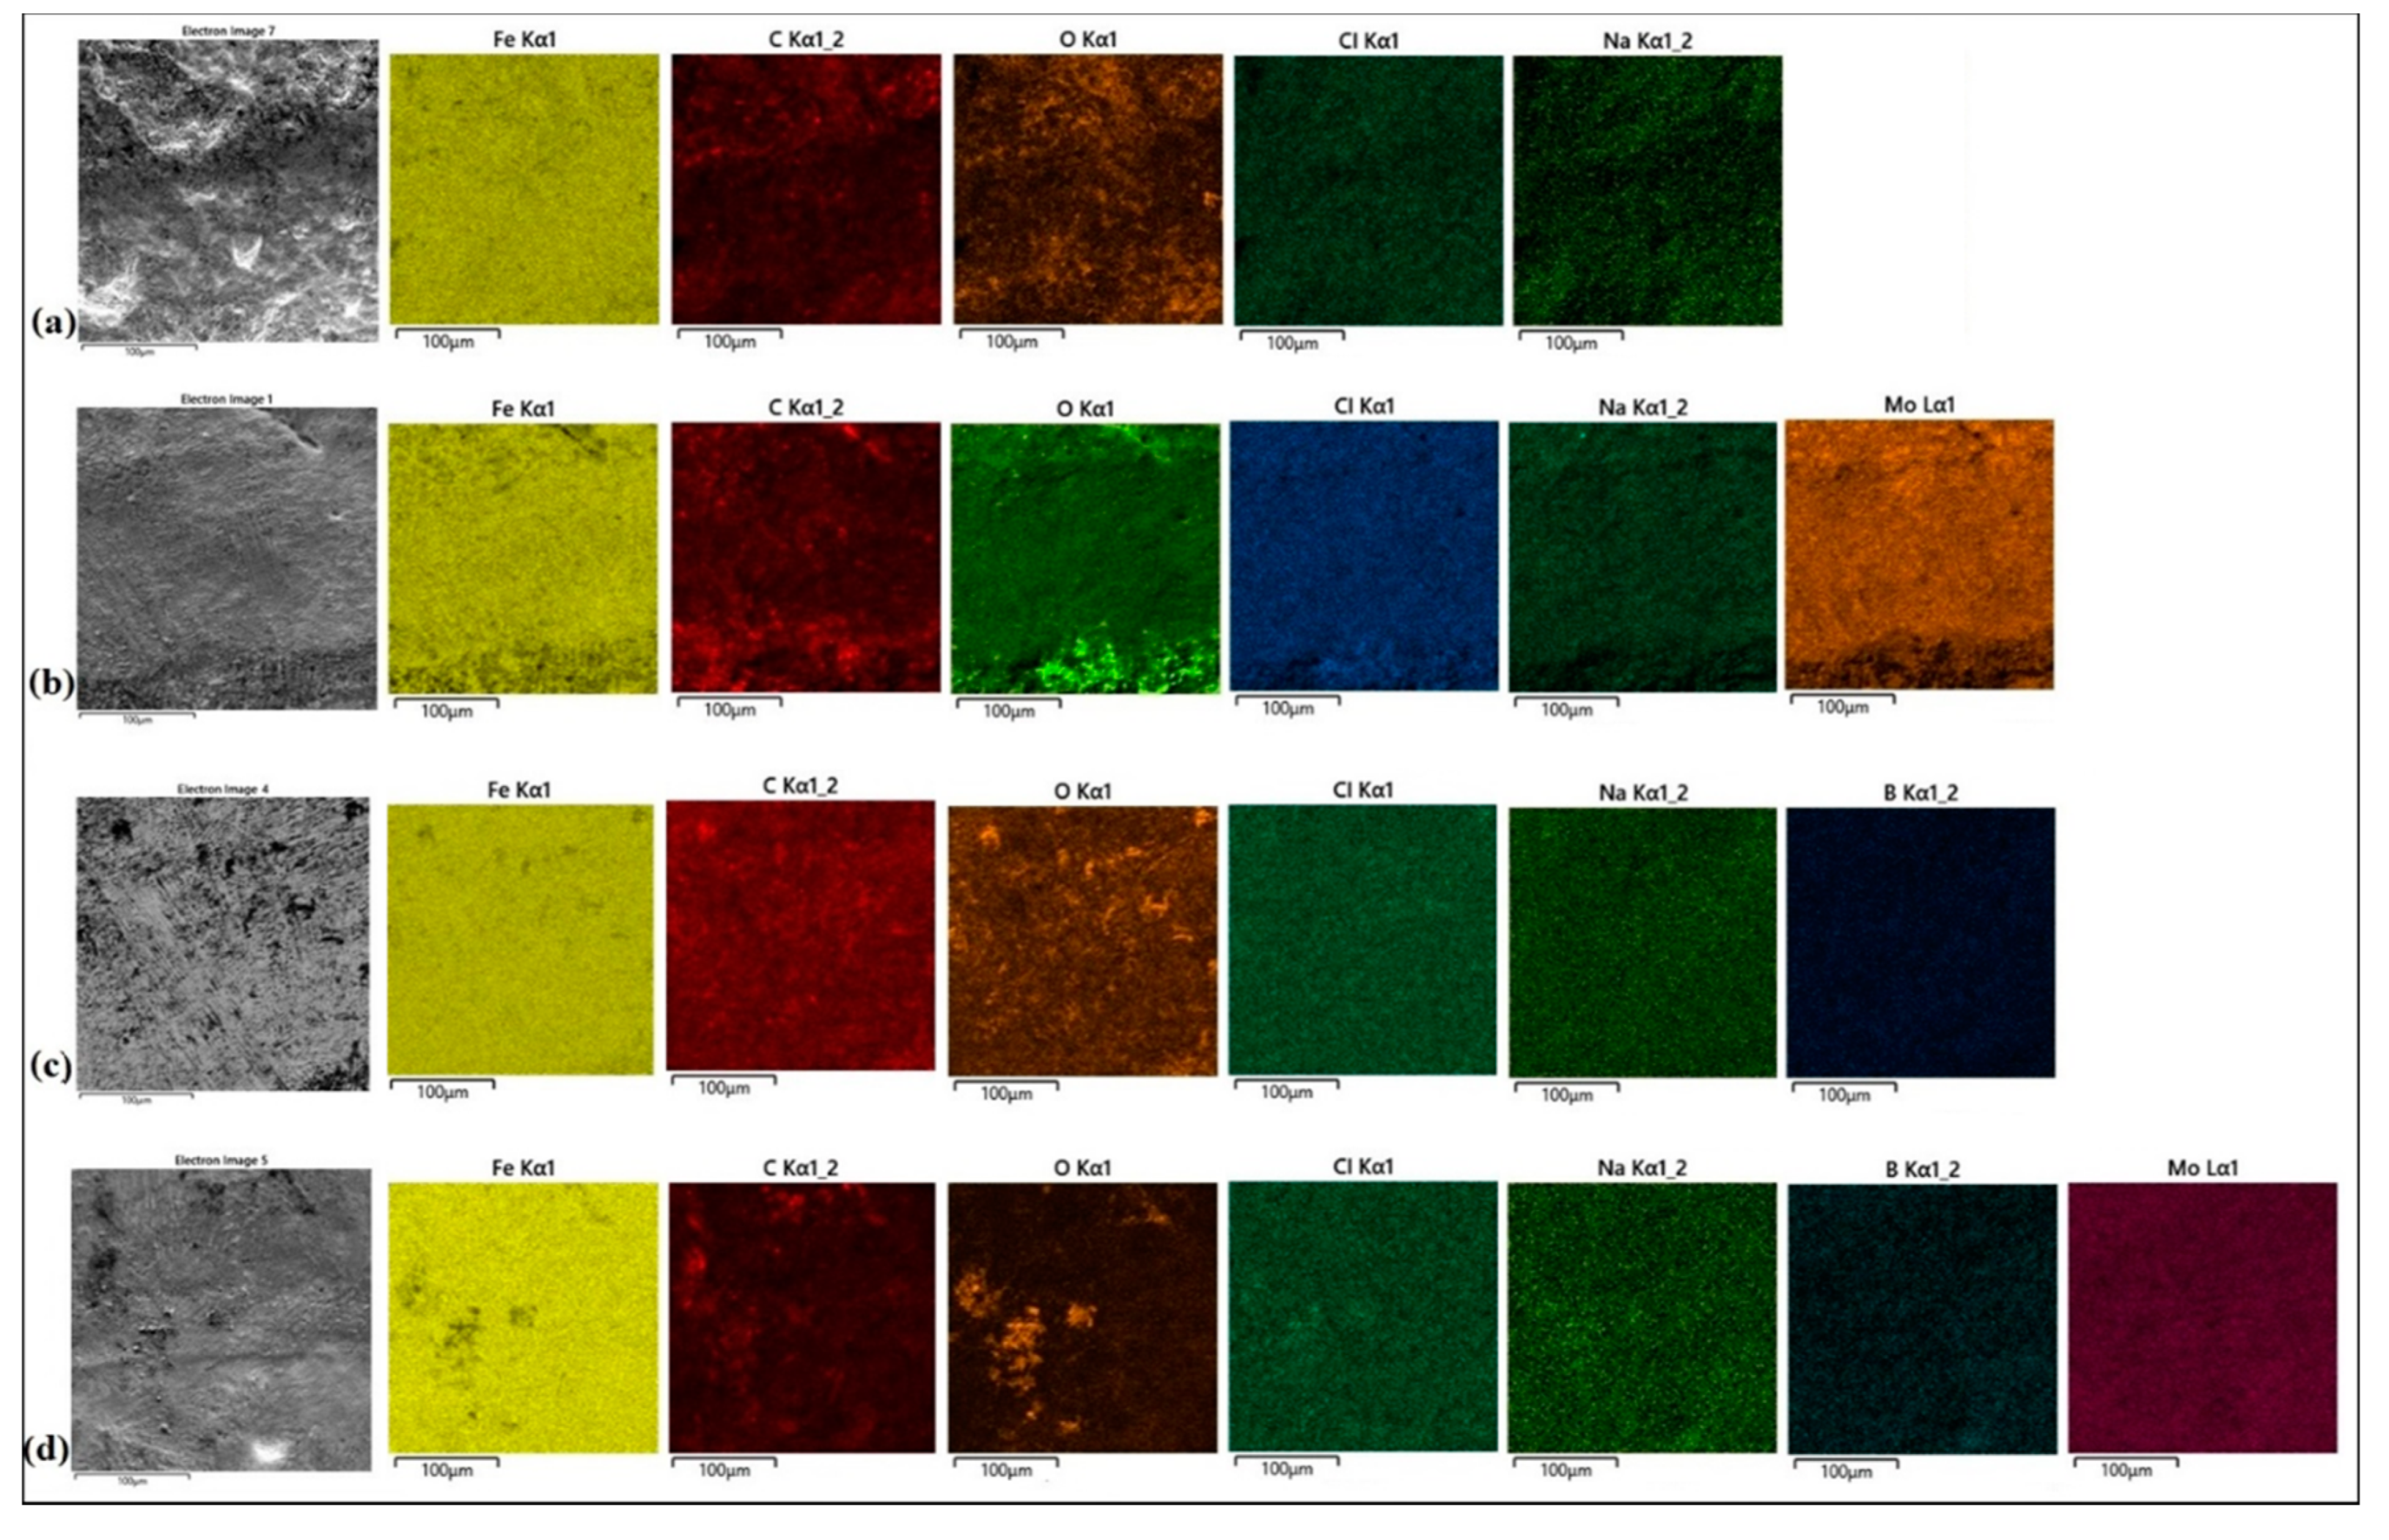
Surface conditions after corrosion resistance tests for all type of specimens are shown in
Figure 10a–d. The surface of CT90 steel after laser remelting was characterized by a larger number of large-size corrosion pits. Therefore it can be concluded that this surface was more susceptible to corrosion (
Figure 10a). There are also corrosion pits on the boron coating, but smaller in size and evenly distributed. Therefore, it can be concluded that the production of boron coating increased corrosion resistance compared to the laser alloying of steel (
Figure 10b). No corrosion pitting was found on the Mo coatings (despite numerous porosities) and on the Mo-B coatings (
Figure 10c,d, respectively). In addition, to determine corrosion products, all specimens were subjected to EDS analysis.
The EDS mappings are shown in
Figure 10a–d. Basic chemical elements from the coating and oxygen responsible for the formation of oxides, as well as chlorine and sodium from the 5% corrosive solution used for the tests were taken into account.
Figure 10a shows the surface of a steel specimen after laser remelting. The oxide products appeared on the entire observed area, and the distribution of oxygen was relatively even.
Figure 10b shows the surface of the Mo coating after corrosion tests. Increased oxygen content can be observed mainly in the bottom part of presented area. Fine porosities are visible there.
Figure 10c shows the surface condition of boron coating after corrosion testing in NaCl solution. Darker areas are the privileged places of oxide layer growth. In addition, cracks in the microstructure may have contributed to the reduction of corrosion resistance (
Figure 9).
Figure 10d shows the surface condition of Mo-B coating after corrosion tests. In some areas, an increased oxygen content can be seen, but it does not indicate pitting but only an oxide layer on the specimen surface. No porosity was observed in the microstructure, and the obtained values of potential and corrosion current indicate the best corrosion resistance. In all analyzed specimens subjected to corrosion tests, a multi-phase microstructures were identified, which was confirmed by the XRD results. Based on the obtained microstructure results, as well as EDS and XRD analysis in combination with corrosion tests results, it can be stated that boride-forming chemical elements increase corrosion resistance.

 ,
, 


