1. Introduction
The latest spintronics research heavily exploits oxide materials [
1,
2,
3,
4,
5,
6,
7], in which perovskites play a unique role due to their special properties [
8,
9,
10]. One of the widely used materials is La
0.67Sr
0.33MnO
3 (LSMO) [
11,
12,
13,
14,
15,
16], which is characterized by a Curie temperature above room temperature (RT) and nearly 100% spin polarization of electrons at the Fermi level [
17]. For this reason, LSMO is often used as a ferromagnetic electrode in a multiferroic tunnel junction. Depending on strain, temperature and the ratio of lanthanum to strontium atoms, LSMO can be a conductive ferromagnetic, antiferromagnetic, or a paramagnetic isolator [
18,
19,
20].
An ideal substrate for the LSMO layer is monocrystalline perovskite SrTiO
3 (STO). Its structural complementarity with LSMO (the same structure, i.e., perovskite, and similar lattice constant) allows epitaxial growth of a multilayer when the pulsed laser deposition (PLD) method is applied [
12,
13]. Therefore, perovskite materials, such as LSMO, BaTiO
3 [
21,
22,
23] and STO [
24,
25], have recently been extensively tested for tunnel junction applications [
26,
27,
28,
29,
30].
Currently, there are several unresolved problems of a fundamental nature that at least hinder the formation of multiferroic junctions with parameters allowing for their practical applications. One of these problems is too low magnetocrystalline anisotropy of LSMO layers, resulting in a lack of two distinctly different magnetization configurations/settings in one of the electrodes. There are also other sources of anisotropy, e.g., magnetoelastic [
31,
32,
33]. Currently, efforts are being made to induce an additional direction of easy magnetization in magnetic layers using nanostructuring as a source of a change in shape anisotropy [
34,
35]. Magnetic layers could exhibit magnetic anisotropy because of the introduction of disturbance sources of the atomic arrangement symmetry, which can lead to additional contribution to the anisotropy energies, like steps on the STO substrate (step anisotropy) [
36].
The aim of this article is to show how to control the magnetic anisotropy of LSMO. It can be done by introducing disturbance sources of the atomic arrangement symmetry, such as steps on the STO substrate and thus on the deposited LSMO layer. Different STO substrate preparation methods lead to different roughnesses of the surface, and thus different magnetic anisotropies. Magnetic anisotropy also depends on the amount of oxygen during and after deposition.
2. Materials and Methods
Three preparation methods of a single-crystal STO (100) substrate were conducted. The selected substrates showed a similar miscut effect (measured using the XRD measurement). The miscut is the effect of a slight mismatch between the polishing direction and the atomic plane. It results in a stepped surface with a random terrace direction and the width of the terraces corresponding to the miscut angle. The first method involves successive ultrasonic rinses in HCl-HNO
3 (3:1), deionized water, acetone and methanol, followed by annealing at 1000 °C in an oxygen atmosphere for an hour [
37]. For simplicity, let us call this method “acid”. The second method involves successive rinses in buffer solution NH
4F: HF (7:1), acetone, methanol and deionized water, followed by annealing at 1000 °C in an oxygen atmosphere for an hour [
38], hereafter referred to as the “buffer” method. The third one is based only on ultrasonic bath in deionized water and annealing in an oxygen atmosphere at 1000 °C for 1 h [
39], called the “DIW” (deionized water) method.
Thin LSMO films were grown onto the prepared STO by the pulsed laser deposition (PLD) technique, using a 248 nm excimer laser system (Coherent COMPex Pro 110F, Santa Clara, CA, USA) operated at an energy density of ~2 J·cm−2, with the distance between the sample and the target equal to 6.5 cm, pulse width of 20 ns, repetition rate of 10 Hz, and 1200 as the number of pulses. The aim was to obtain stoichiometric LSMO. Laser deposition was performed under 200 mTorr partial oxygen pressure and a substrate temperature of 750 °C. The thicknesses of the deposited LSMO layers are about 20 nm.
The surface morphology and the grain size dependence on the buffer were examined with an atomic force microscope (AFM) using the NTEGRA Aura—NT-MDT system (Amsterdam, The Netherlands). The crystallographic structure of the samples was investigated by x-ray diffraction (XRD) measurements, using an X’Pert MPD diffractometer (Malvern, UK). The hysteresis loops were measured by a vibrating sample magnetometer (VSM) LakeShore 7407 (Westerville, OH, USA) at room temperature in an external magnetic field applied at different angles in the plane of the sample.
3. Results and Discussion
3.1. Preparation and Roughness
The proper preparation of the STO substrate is crucial for obtaining high quality magnetic properties of the deposited layers. The substrate must have sufficient smoothness to allow epitaxial growth. Three different substrate preparation methods were tested, followed by atomic force microscopy (AFM) measurements.
Table 1 shows the roughness of the differently prepared samples.
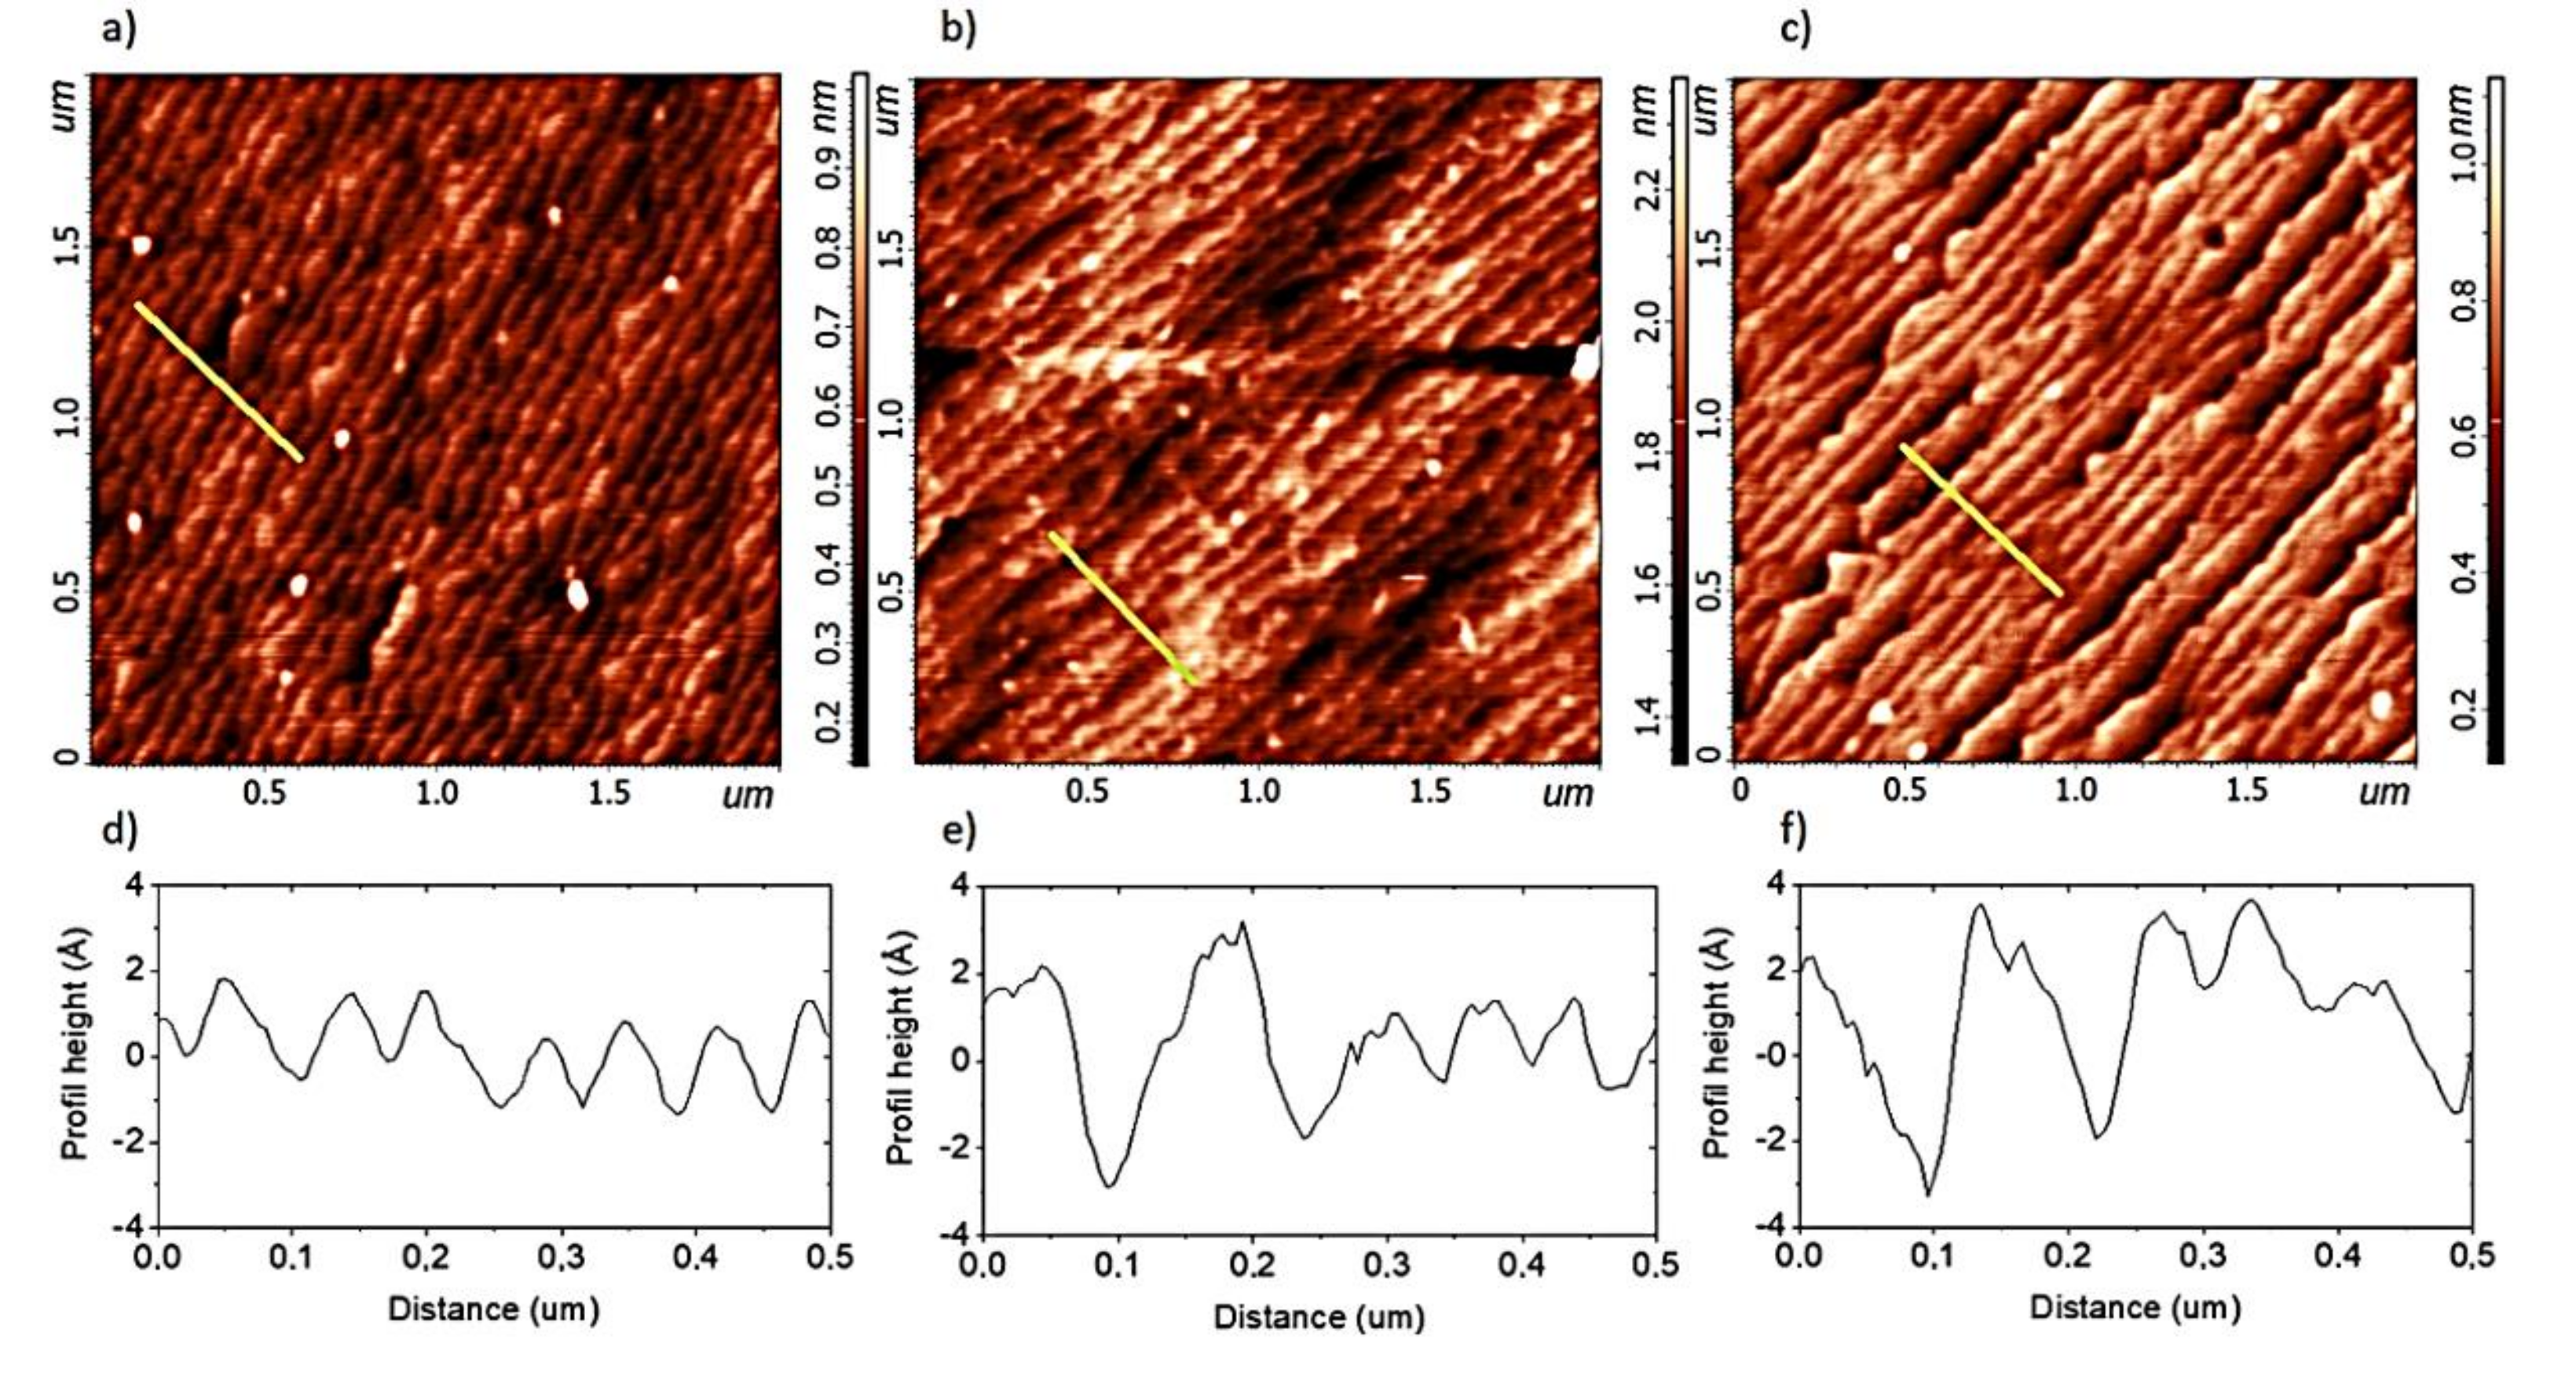
Figure 1 shows the surface of the STO samples examined with AFM after appropriate chemical treatment, i.e., acid, buffer and DIW method. Visible terraces are the result of the existence of the miscut and the appropriate treatment that affects the nature of the terraces.
Figure 1b shows that the buffer method results in a more wavy surface than the acid method (darker and lighter regions). As can be seen in
Figure 1c, the preparation process itself reveals additional grooves, visible as darker stripes. This is one of the effects that cause increased roughness.
The roughness is calculated from the height profile of the samples measured perpendicular to the terraces. It is calculated as the average absolute value of the height. In the ideal case, the maximum value would be half the unit cell (STO 3.89 Å, LSMO 3.87 Å), and the roughness would be a quarter, i.e., 0.97 Å. The measured roughness for all samples is less than half of the height of the unit cell, which means that they all have an atomically smooth surface. However, the roughness at this level should be understood as a higher number of defects, which will directly affect the deposited layers on such a substrate. In the real case, it is often difficult to distinguish where the terrace ends and where it begins, and the model terrace rarely takes place.
Figure 1 shows the differences between the height profiles of the STO samples prepared with the “acid”, “buffer” and “DIW” methods. The “acid” method results in a mostly uniform and smooth surface, but often with a half unit-cell height of terraces. The “DIW” method often results in terraces with one and a half height of the unit-cell steps (areas with SrO and TiO
2 termination), whereas the “buffer” method results in a surface rougher than that obtained with the “acid” one but smoother than in the case of the “DIW” method. Sometimes even larger defects appear. Generally, a good measure of these effects is roughness, which even for clearly stepped surfaces may have different values (
Table 1). The smoothest surface is the result of the most invasive preparation, such as the use of acids and buffer solutions. A rougher substrate can be obtained by only annealing and ultrasonic bath in deionized water.
3.2. Preparation and Roughness
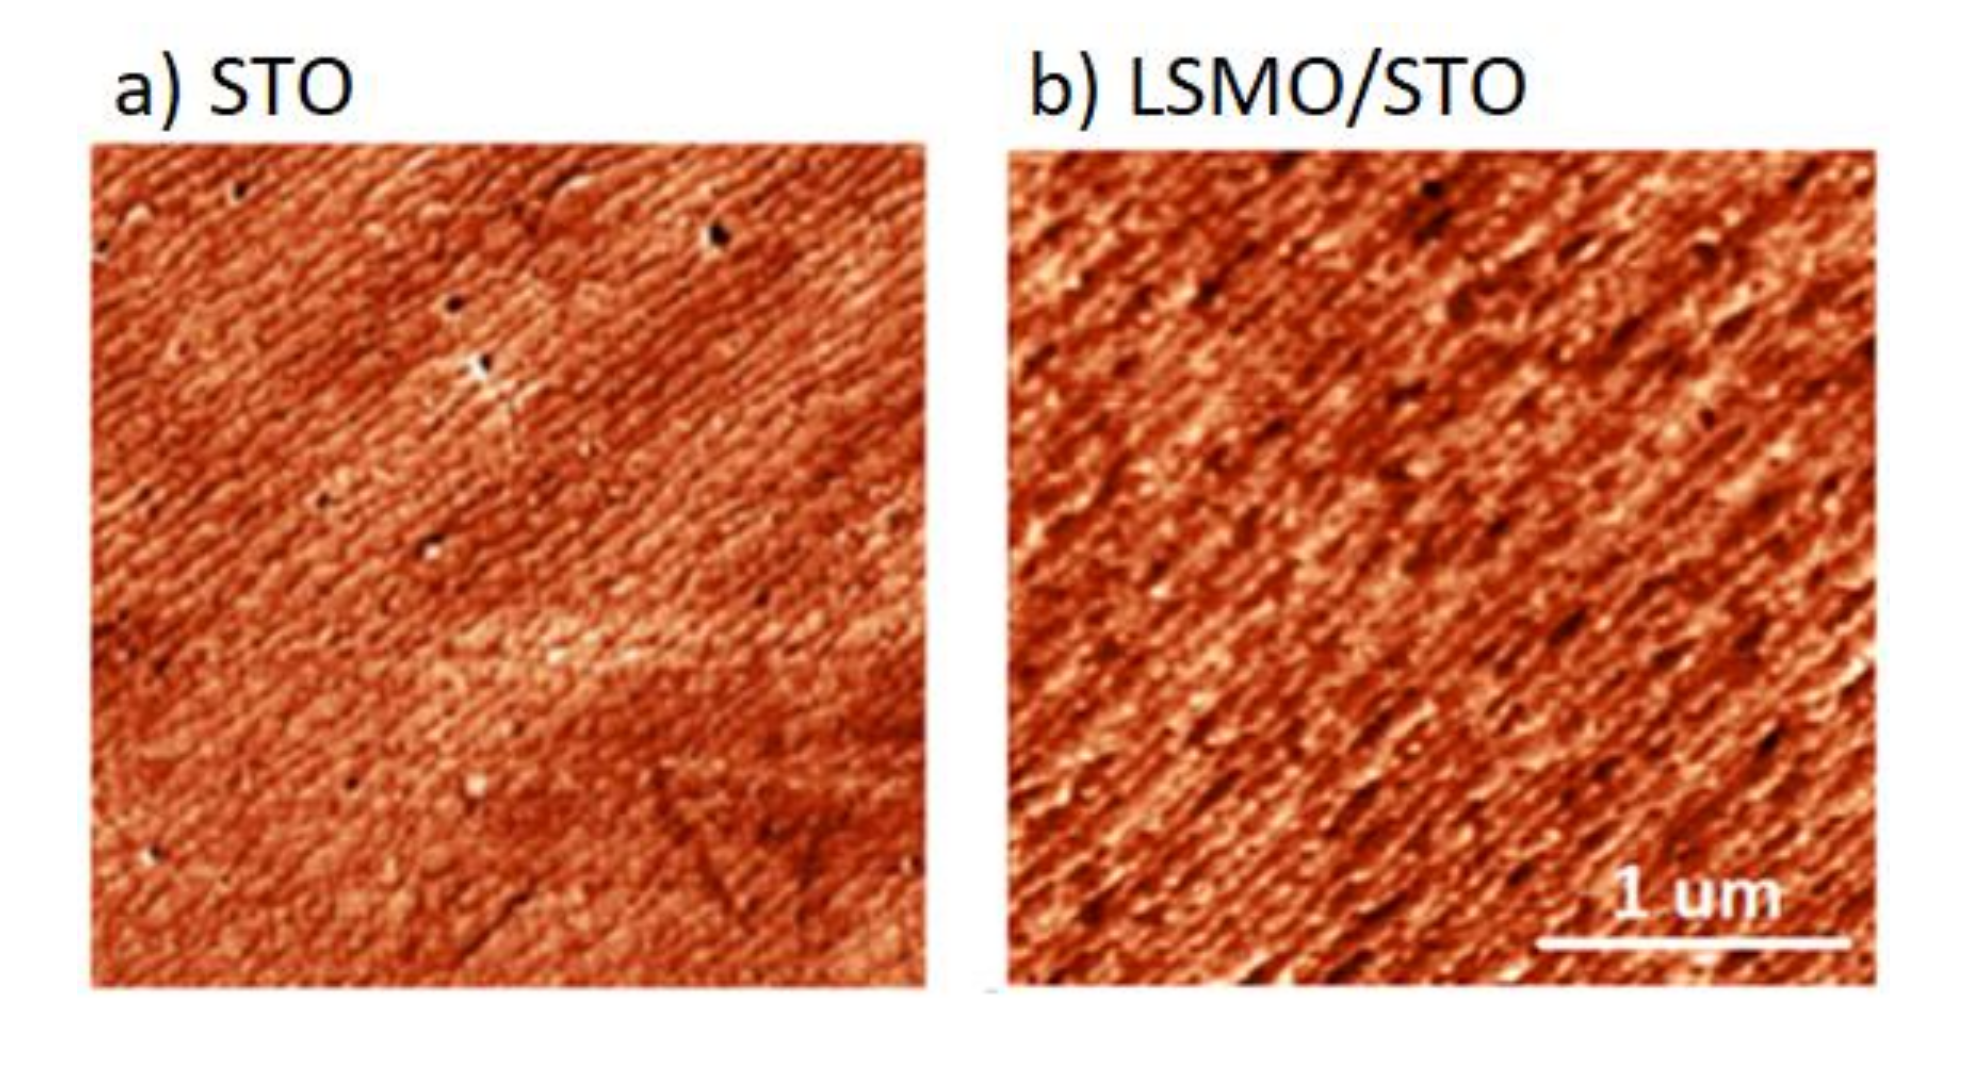
The existence of terraces on the deposited layers can be observed. They have the same width and direction, i.e., the surface of the deposited LSMO reproduces terraces of the STO surface.
This effect is visible even in the case of several dozen nm of the sputtered layers. The AFM measurements of the STO sample before and after the deposition of LSMO (prepared using the “buffer method”) are shown in
Figure 2. A similar effect was also observed for the other samples. Terrace propagation suggests layer-by-layer growth, and every layer of the deposited material has a terraced surface. This effect can be exploited to obtain a terraced surface with a certain roughness on different materials deposited on STO in a multilayer structure.
3.3. Step-Induced Anisotropy
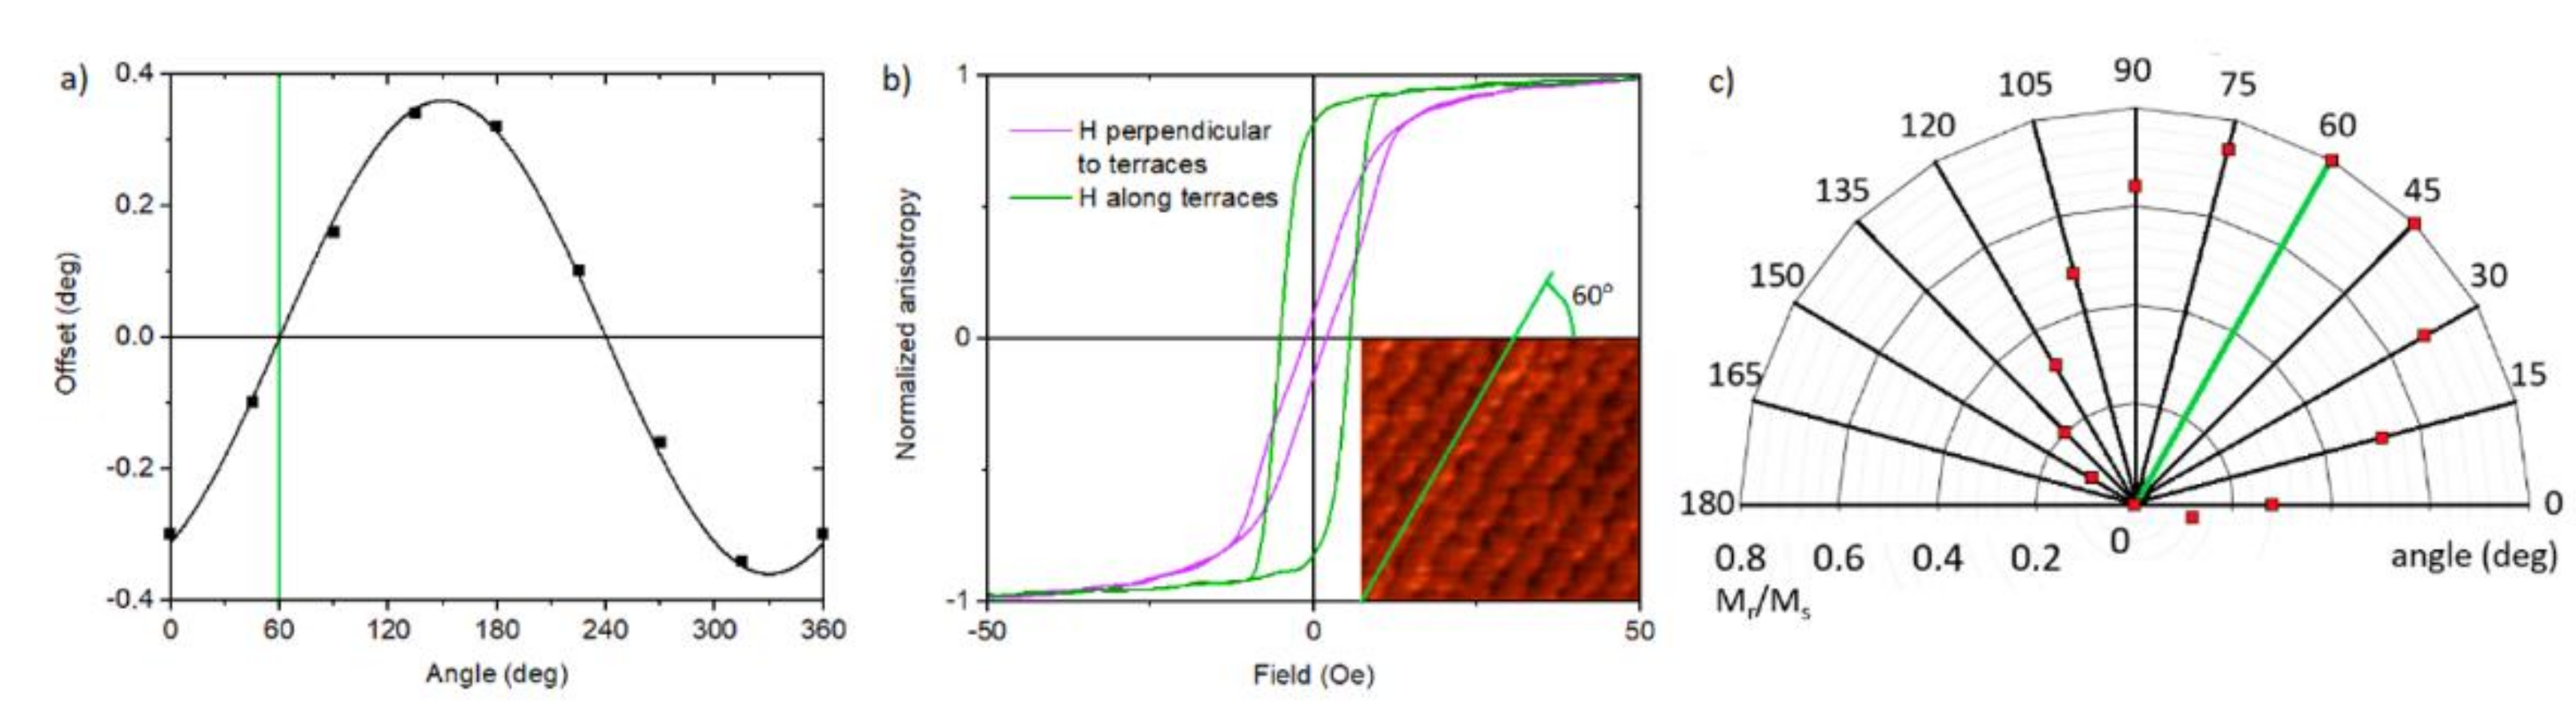
Figure 3a shows the offset angle of the LSMO/STO measured for different directions in the sample plane. The offset is the angle between crystalline planes and the sample plane. The orientation of the crystalline planes was determined using rocking curve measurements at STO (002) peak. The exact orientation of the sample plane was checked by tilting of the sample at incidence beam parallel to the sample plane and detector placed in front of an x-ray source. The zero offset occurs for the direction along the terrace (no inclination). The maximum value of the offset is the miscut angle.
Figure 3b shows the correlation between the steps and the magnetic easy and hard axes. The hysteresis loops of the LSMO/STO samples were measured by VSM for the field in the plane of the sample. The LSMO samples show the existence of magnetic anisotropy in the plane of the sample (
Figure 3c). There is a correlation between the direction of the terraces (resulting from the miscut) and the easy and hard axes. The magnetic hard axis occurs in the direction perpendicular to the terraces, whereas the easy axis along the terraces (
Figure 3b). Please note that the easy axis from the VSM measurement corresponds to the zero point of the offset (obtained from the XRD measurement) and the direction along the terraces obtained from the AFM measurements. Similar results and relationships were obtained for the other samples, as well. All measured samples have similar terrace widths; thus, the effect of the terraces density on anisotropy was not observed in our samples. No correlation was observed between the anisotropies and the crystallographic directions as well.
Thin ferromagnetic films grown on stepped surfaces show complex magnetic anisotropy due to their reduced symmetry [
40,
41]. The easy direction of magnetization is usually along the step edges, but it may switch to the plane perpendicular to the steps for films of a few monolayers in thickness. Such a magnetization orientation has been found experimentally using the magneto-optical Kerr effect for stepped Fe and Co ultrathin films with well-defined structures, grown epitaxially on Ag and Cu vicinal substrates and optionally covered by Au and Cu [
42,
43]. The observed orientation and canting of magnetization have been explained within a theoretical model by an interplay of the shape anisotropy due to magnetic dipolar interaction and three magnetocrystalline anisotropy terms arising from the spin–orbit interaction for films with stepped surfaces. The magnetic anisotropy energy has been found to include both a surface term and a volume contribution, which presumably results from the structural distortion of the film structure above the step edges of the underlying substrate due to the lattice mismatch between the film and the substrate.
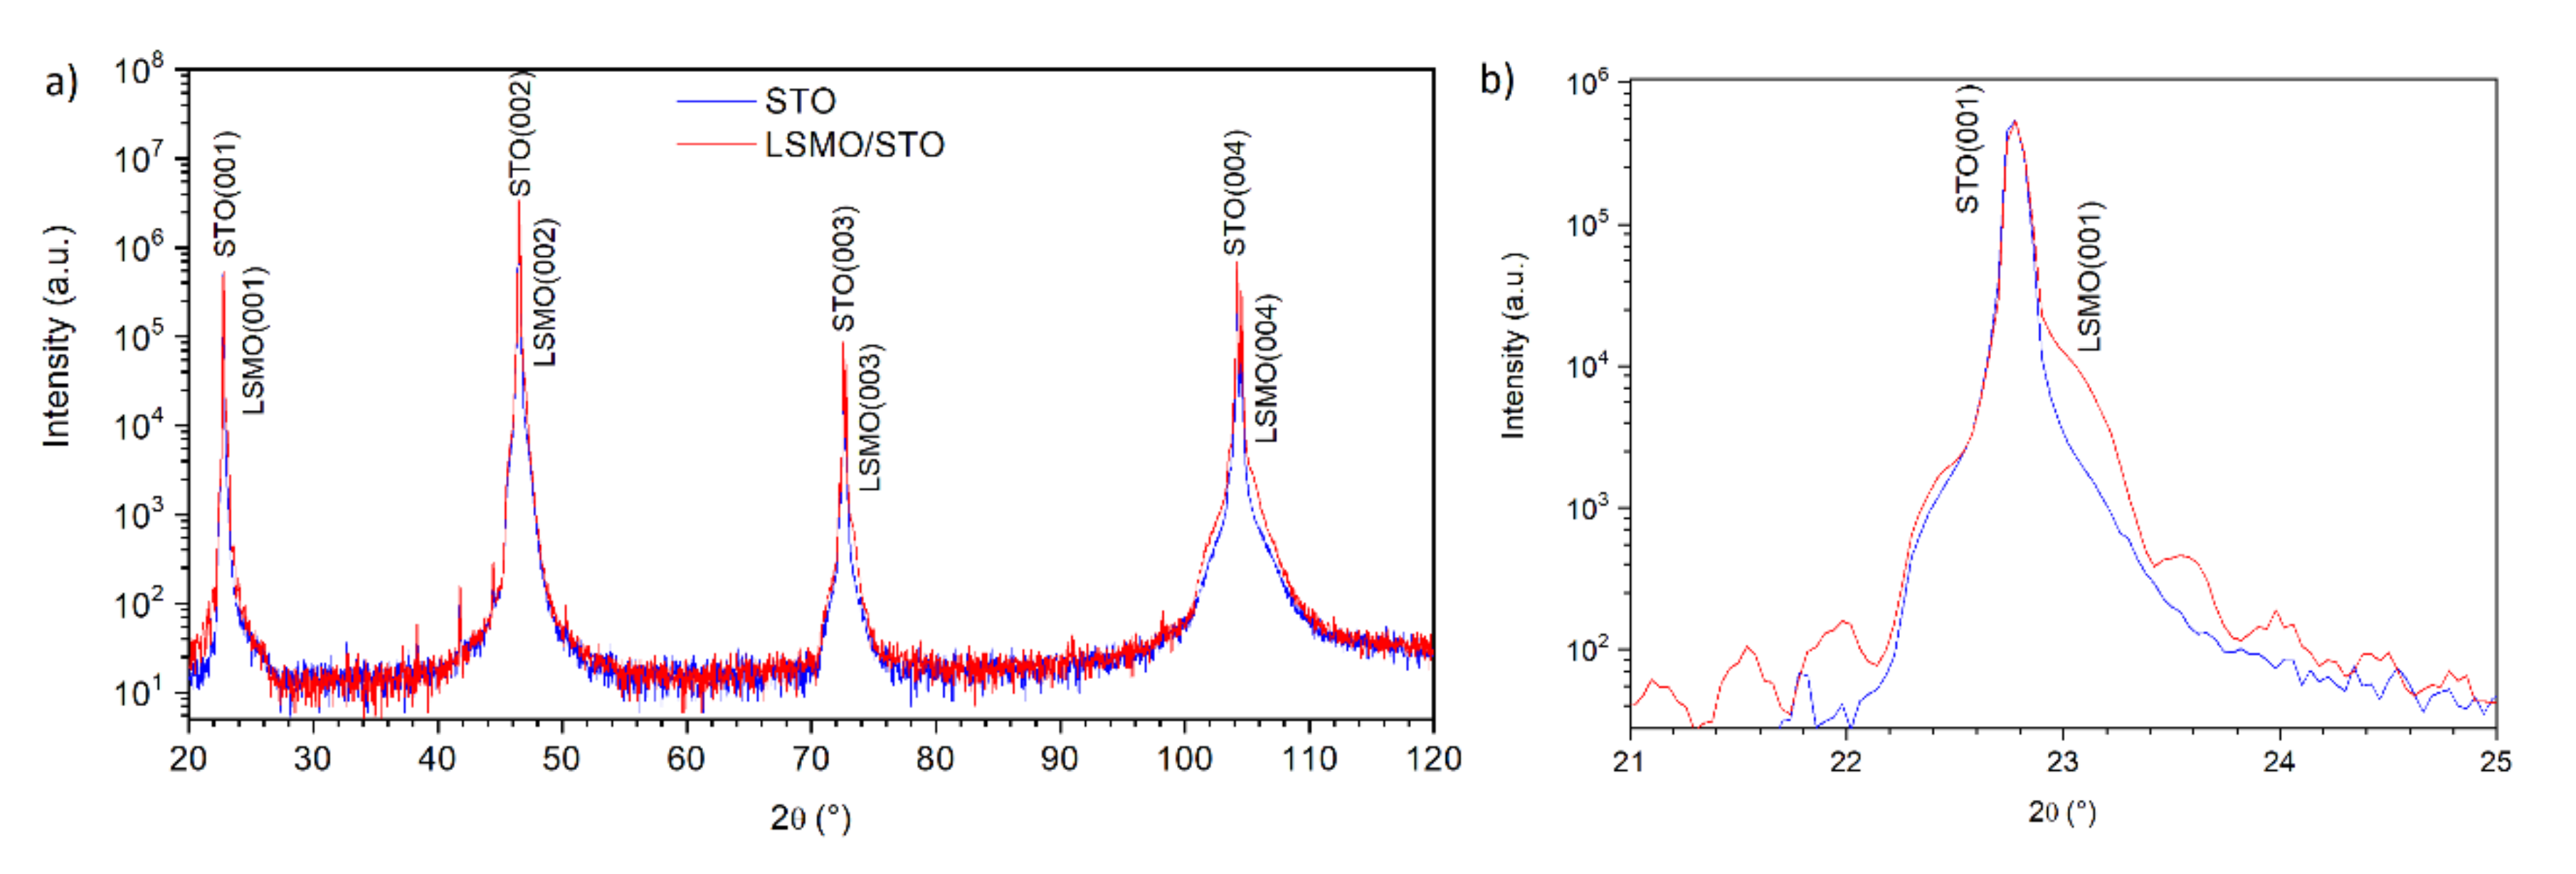
Figure 4 shows the XRD measurement of the STO substrate prepared by the “buffer” method and the same substrate after LSMO deposition. It shows crystalline growth of the LSMO layer. The presented XRD pattern shows not only high crystallinity of the sample, but also demonstrates high quality of interfaces—one can note the appearance of Laue oscillations in
Figure 4b. Similar results were obtained for the other samples.
3.4. Roughness and Anisotropy
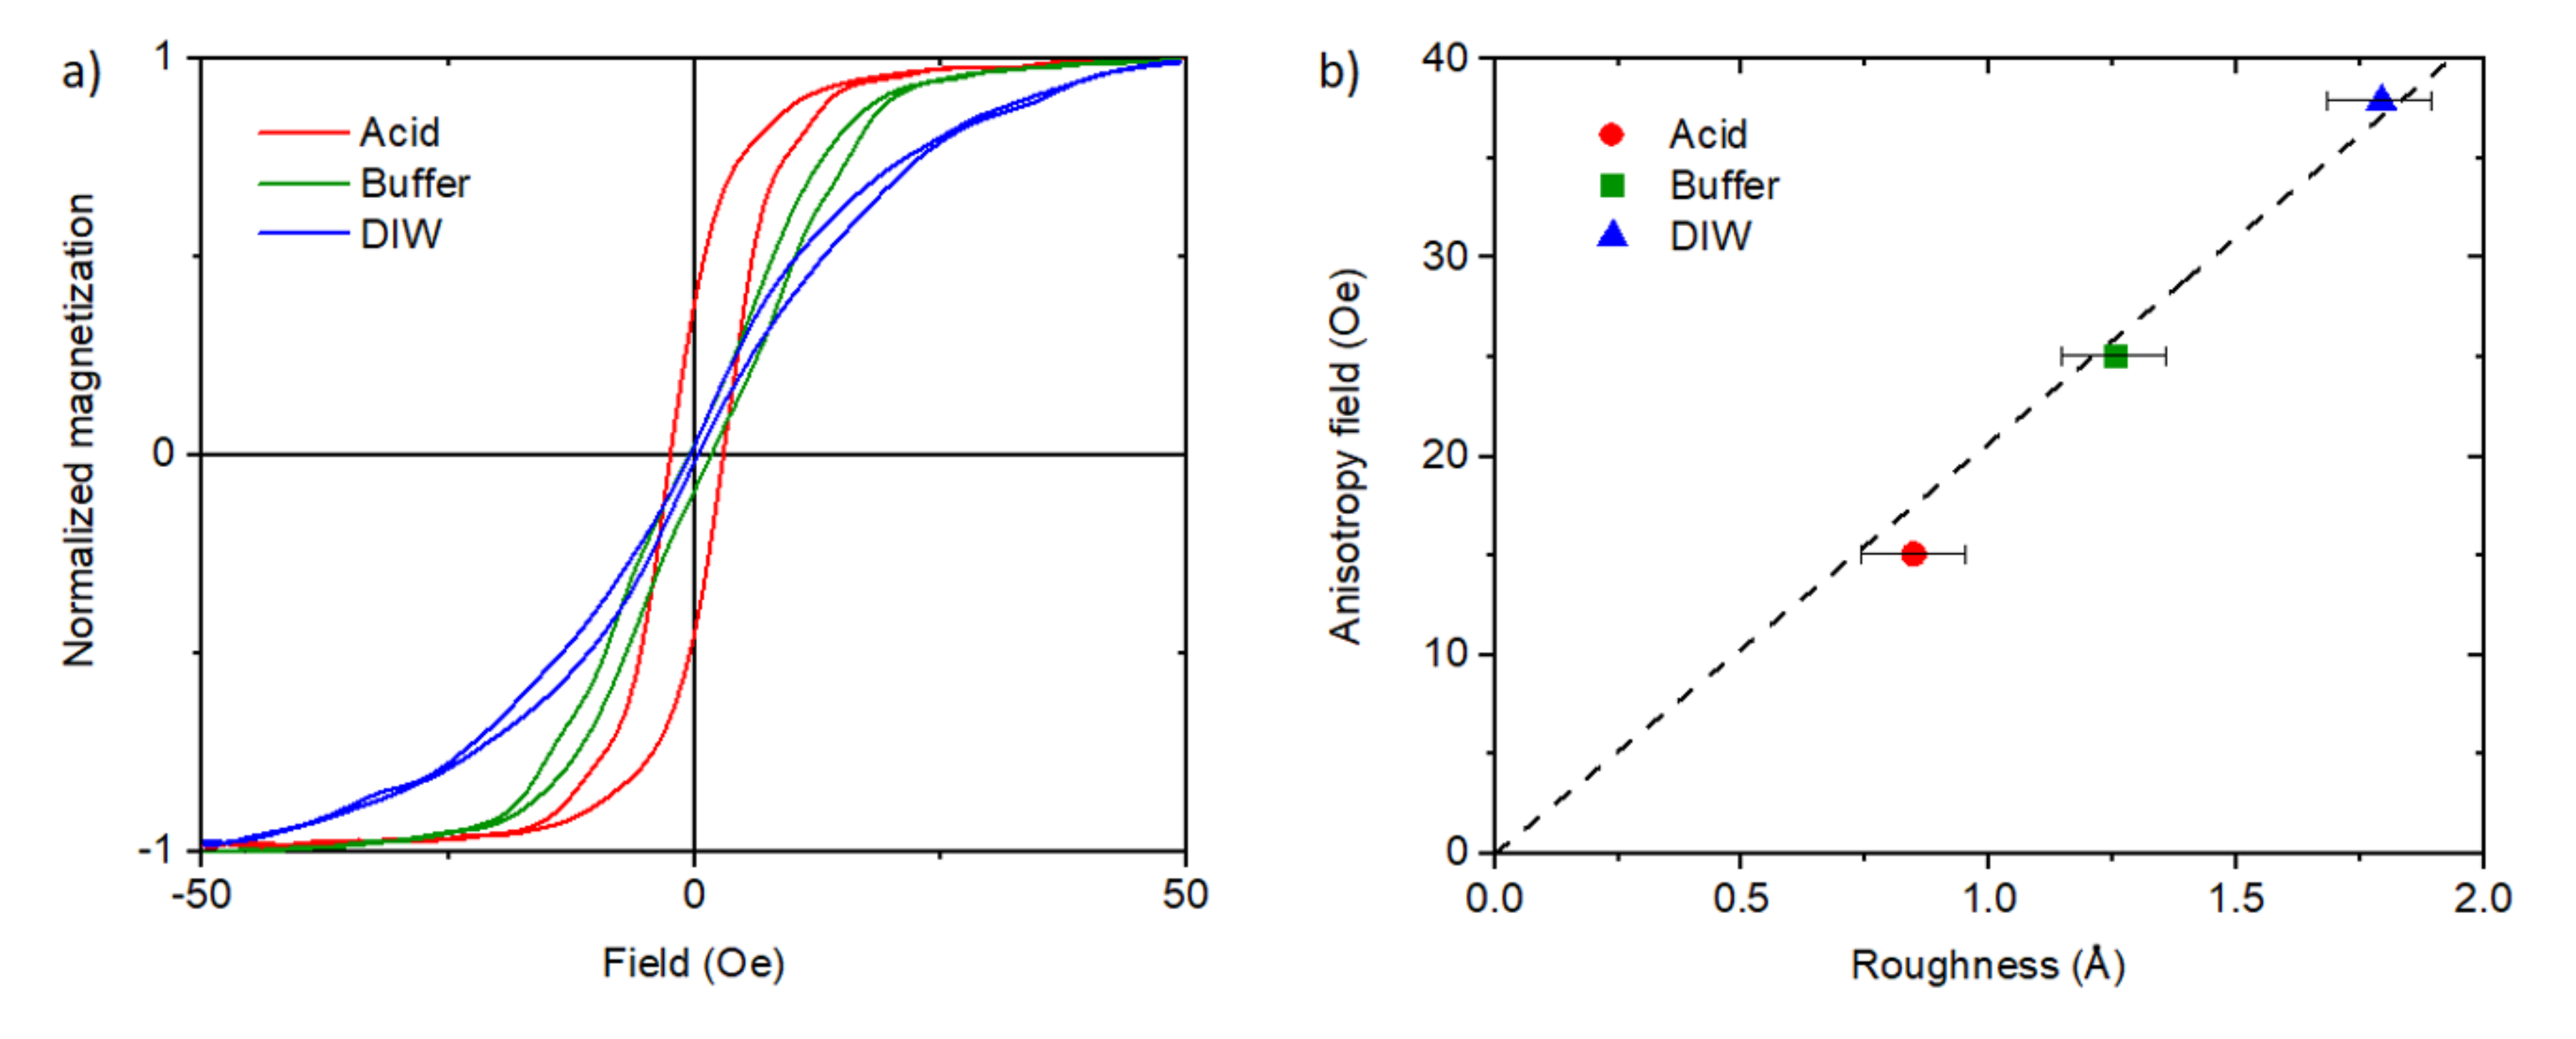
Figure 5a shows the hysteresis loops measured perpendicular to the terraces (along the hard axis) for substrates prepared using various methods. As it turns out, different methods of substrate preparation have an impact on the anisotropy field. The reason for these differences is the roughness of the substrates, which induces a relationship between roughness and anisotropy field (
Figure 5b). In this article, we use the anisotropy field as a measure of anisotropy, i.e., the magnetic field that must be applied along the hard axis to drag the direction of magnetization of the sample along the external field. It was measured using VSM at room temperature. It should be added that the hysteresis loops measured along the easy axis are rectangular for all samples. The dependence of the anisotropy field on roughness can be explained by the dipolar mechanism proposed by Arias and Mills [
44]. It occurs when roughness has a uniaxial character.
In the lowest order of the perturbation theory, we have a simple formula for approximation [
44]:
where
—reciprocal width of the Neel-type domain wall,
—miscut angle,
—total energy of the system. Using the expression for the effective magnetic field
, where
M—magnetization,
D—thickness of the layer,
—anisotropy field, we can formulate the following relation [
44]:
In their model, Arias and Mills assumed the ideal form of terraces. As shown in
Figure 1, this is not always the case. Instead of an angle, we use roughness as a measure of the source of the dipolar mechanism. In our case, due to the same width of the terraces of all samples, it will be a good approximation as
, where
is the roughness and
L is the average width of the terrace.
For our sample, we are in the regime of low roughness, so we should see a simple linear dependence of magnetic anisotropy as a function of roughness
Figure 5b shows the measured anisotropy versus the roughness for the LSMO/STO samples as a clearly linear dependence. It can also be concluded that the use of a specific method of STO preparation makes it possible to control the roughness of the substrate. Thus, it leads to different anisotropy fields of the deposited layers.
3.5. Anisotropy and Oxygen
All the previously shown results concerned quickly cooled (after deposition) LSMO samples without adding additional oxygen after deposition.
Figure 6a presents the hysteresis loops of three different LSMO/STO samples measured along the hard axis: (1) “Low oxygen”: a quickly cooled sample after deposition at 200 mTorr oxygen pressure, (2) “Annealed”: the same sample after additional annealing in an oxygen atmosphere and at 800 °C for 1 h, and (3) “High oxygen”: an LSMO sample slowly cooled after deposition with continuous addition of oxygen up to the value of 50 Torr. The measurement shows that anisotropy depends not only on the roughness and method of substrate preparation but also on oxygen treatment. LSMO is very sensitive to various types of influences and particularly to oxygen treatment due to its rich phase diagram and a Curie temperature close to room temperature.
Figure 6b shows the saturation magnetization for different types of oxygen treatment during and after deposition. This phenomenon is related to oxygen vacancies, which are known to affect magnetic properties in manganite films [
45]. The oxygen treatment leads to an increase in the concentration of Mn
3+ ions because of missing O-Mn bonds. The oxygen vacancy thus leads to the destruction of Mn
3+–Mn
4+ chains, in which hopping electrons in the double exchange mechanism lead to ferromagnetic ordering. In turn, the Mn
3+–Mn
3+ ion chains in the superexchange mechanism may lead to segregation into a form of larger antiferromagnetic clusters [
46]. This results in a degradation of the ferromagnetic properties. Oxygen deficiency also leads to point defects that become centers of the pining domain wall in LSMO. Both these mechanisms cause an increase in the magnetic anisotropy (anisotropy field—
Figure 6c) [
45]. Oxygen depletion can be particularly strong in interface areas, where by nature most defects occur. It may cause the dipolar mechanism due to changes in the effective surface charge density.
4. Conclusions
Three methods of STO substrate preparation were tested to obtain atomically flat surfaces. All these methods resulted in visible surface terraces with heights of about a unit cell and a roughness of less than 2 Å. LSMO layers were deposited on engineered STO substrates using PLD method. The propagation of the terraces on the deposited layers, with the same width and direction as those on the substrate, was confirmed even in the case of several dozen nm of LSMO. The use of appropriate deposition conditions (oxygen treatments and annealing) and the existence of terraces causes defects and oxygen vacancies, and thus magnetic anisotropy. The existing correlations between terraces and magnetic anisotropy have been confirmed in the samples by VSM, XRD and AFM measurements. The magnetic hard axis is perpendicular to the terraces and the magnetic easy axis is along the terraces. The correlation between the preparation of the substrate and its roughness as well as between its roughness and magnetic anisotropy has been shown. The most invasive methods, such as the use of acids and buffers, give the smoothest surface and lowest magnetic anisotropy. The highest anisotropy occurs for rougher surfaces obtained, for example, by only annealing and ultrasonic bath in deionized water. The dependence of the anisotropy field on roughness can be explained by the dipolar mechanism proposed by Arias and Mills [
44]. It occurs when roughness has a uniaxial character. In this case, the magnetic energy per volume is proportional to the roughness measured perpendicular to the terraces.
Author Contributions
Conceptualization, J.P.; data collection and analysis, J.P., M.P. and A.Ż.; XRD and AFM measurements, J.K.; writing—original draft preparation, J.P.; writing—review and editing, M.P., J.K. and A.Ż.; supervision, M.P.; funding acquisition, J.P. All authors have read and agreed to the published version of the manuscript.
Funding
The research was carried out thanks to the financial support of the National Science Centre, Poland (grant No. 2017/27/N/ST5/01635). Jakub Pawlak was partly supported by the EU Project POWR.03.02.00-00-I004/16.
Conflicts of Interest
The authors declare no conflict of interest. The funders had no role in the design of the study; in the collection, analyses, or interpretation of data; in the writing of the manuscript, or in the decision to publish the results.
References
- García, V.; Bibes, M. Ferroelectric tunnel junctions for information storage and processing. Nat. Commun. 2014, 5, 4289. [Google Scholar] [CrossRef]
- Cuellar, F.A.; Liu, Y.; Salafranca, J.; Nemes, N.; Iborra, E.; Sánchez-Santolino, G.; Varela, M.; Hernández, M.G.; Freeland, J.W.; Zhernenkov, M.; et al. Reversible electric-field control of magnetization at oxide interfaces. Nat. Commun. 2014, 5, 4215. [Google Scholar] [CrossRef] [PubMed]
- Varignon, J.; Vila, L.; Barthélemy, A.; Bibes, M. A new spin for oxide interfaces. Nat. Phys. 2018, 14, 322–325. [Google Scholar] [CrossRef]
- Oreshonkov, A.S.; Roginskii, E.M.; Shestakov, N.P.; Gudim, I.; Temerov, V.L.; Nemtsev, I.V.; Molokeev, M.S.; Adichtchev, S.V.; Pugachev, A.M.; Denisenko, Y.G. Structural, Electronic and Vibrational Properties of YAl3(BO3)4. Materials 2020, 13, 545. [Google Scholar] [CrossRef]
- Yao, X.; Duan, Q.; Tong, J.; Chang, Y.; Zhou, L.; Qin, G.; Zhang, X. Magnetoresistance Effect and the Applications for Organic Spin Valves Using Molecular Spacers. Materials 2018, 11, 721. [Google Scholar] [CrossRef]
- Lesne, E.; Fu, Y.; Oyarzun, S.; Rojas-Sanchez, J.C.; Vaz, D.C.; Naganuma, H.; Sicoli, G.; Attané, J.-P.; Jamet, M.; Jacquet, E.; et al. Highly efficient and tunable spin-to-charge conversion through Rashba coupling at oxide interfaces. Nat. Mater. 2016, 15, 1261–1266. [Google Scholar] [CrossRef]
- Pang, B.; Zhang, L.; Chen, Y.B.; Zhou, J.; Yao, S.; Zhang, S.; Chen, Y. Spin-glass-like behavior and topological Hall effect in SrRuO3/SrIrO3 superlattices for oxide spintronics applications. ACS Appl. Mater. Interfaces 2017, 9, 3201–3207. [Google Scholar] [CrossRef]
- Kepenekian, M.; Even, J. Rashba and Dresselhaus Couplings in Halide Perovskites: Accomplishments and Opportunities for Spintronics and Spin–Orbitronics. J. Phys. Chem. Lett. 2017, 8, 3362–3370. [Google Scholar] [CrossRef]
- Li, J.; Haney, P.M. Optical Spintronics in Organic-Inorganic Perovskite Photovoltaics. Phys. Rev. B 2016, 93, 155432. [Google Scholar] [CrossRef]
- Ascienzo, D.; Yuan, H.; Greenbaum, S.; Bayer, T.J.M.; Maier, R.; Wang, J.-J.; Randall, C.A.; Dickey, E.C.; Zhao, H.; Ren, Y.-H. Investigation of Electric Field–Induced Structural Changes at Fe-Doped SrTiO3 Anode Interfaces by Second Harmonic Generation. Materials 2016, 9, 883. [Google Scholar] [CrossRef]
- García, V.; Fusil, S.; Bouzehouane, K.; Enouz-Vedrenne, S.; Mathur, N.D.; Barthélémy, A.; Bibes, M. Giant tunnel electroresistance for non-destructive readout of ferroelectric states. Nature 2009, 460, 81–84. [Google Scholar] [CrossRef]
- Yin, Y.; Burton, J.D.; Kim, Y.M.; Borisevich, A.Y.; Pennycook, S.J.; Yang, S.M.; Noh, T.W.; Gruverman, A.; Li, X.G.; Tsymbal, E.Y.; et al. Enhanced tunnelling electroresistance effect due to a ferroelectrically induced phase transition at a magnetic complex oxide interface. Nat. Mater. 2013, 12, 397–402. [Google Scholar] [CrossRef] [PubMed]
- Majumdar, S.; Van Dijken, S. Pulsed laser deposition of La1−xSrxMnO3: Thin-film properties and spintronic applications. J. Phys. D Appl. Phys. 2013, 47, 34010. [Google Scholar] [CrossRef]
- Sukkurji, P.A.; Molinari, A.; Reitz, C.; Witte, R.; Kübel, C.; Chakravadhanula, V.S.K.; Kruk, R.; Clemens, O. Anion Doping of Ferromagnetic Thin Films of La0.74Sr0.26MnO3−δ via Topochemical Fluorination. Materials 2018, 11, 1204. [Google Scholar] [CrossRef]
- Pawlak, J.; Żywczak, A.; Szwachta, G.; Kanak, J.; Gajewska, M.; Przybylski, M. Structure and Magnetism of LSMO/BTO/MgO/LSMO Multilayers. Acta Phys. Pol. A 2018, 133, 548–551. [Google Scholar] [CrossRef]
- Bowen, M.; Bibes, M. Nearly total spin polarization in La2/3Sr1/3MnO3 from tunneling experiments. Appl. Phys. Lett. 2003, 82, 233–235. [Google Scholar] [CrossRef]
- Kim, E.J.; Watts, J.L.R.; Harteneck, B.; Scholl, A.; Young, A.; Doran, A.; Suzuki, Y. Magnetic domain structure of La0.7Sr0.3MnO3 nanoislands: Experiment and simulation. J. Appl. Phys. 2011, 109, 07D712. [Google Scholar] [CrossRef]
- Radaelli, G.; Gutierrez, D.; Qian, M.; Fina, I.; Sánchez, F.; Baldrati, L.; Heidler, J.; Piamonteze, C.; Bertacco, R.; Fontcuberta, J.; et al. Strain-Controlled Responsiveness of Slave Half-Doped Manganite La0.5Sr0.5MnO3 Layers Inserted in BaTiO3 Ferroelectric Tunnel Junctions. Adv. Electron. Mater. 2016, 2, 1600368. [Google Scholar] [CrossRef]
- Liao, Z.; Li, F. Origin of the metal-insulator transition in ultrathin films of La2/3Sr1/3MnO3. Phys. Rev. B. 2015, 92, 125123. [Google Scholar]
- Velev, J.P.; Burton, J.D.; Zhuravlev, M.; Tsymbal, E.Y. Predictive modelling of ferroelectric tunnel junctions. npj Comput. Mater. 2016, 2, 16009. [Google Scholar] [CrossRef]
- Wen, Z.; Li, C. Ferroelectric-field-effect-enhanced electroresistance in metal/ferroelectric/semiconductor tunnel junctions. Nat. Mater. 2018, 12, 617–621. [Google Scholar] [CrossRef]
- Wang, X.; Song, B.; Tao, L.L.; Wen, J.; Zhang, L.; Zhang, Y.; Lv, Z.; Tang, J.; Sui, Y.; Song, B.; et al. Effect of a semiconductor electrode on the tunneling electroresistance in ferroelectric tunneling junction. Appl. Phys. Lett. 2016, 109, 163501. [Google Scholar] [CrossRef]
- Pantel, D.; Alexe, M. Electroresistance effects in ferroelectric tunnel barriers. Phys. Rev. B 2010, 82, 134105. [Google Scholar] [CrossRef]
- Ruan, J.; Qiu, X.; Yuan, Z.; Ji, D.; Wang, P.; Li, A.; Wu, D. Improved memory functions in multiferroic tunnel junctions with a dielectric/ferroelectric composite barrier. Appl. Phys. Lett. 2015, 107, 232902. [Google Scholar] [CrossRef]
- Burton, J.D.; Tsymbal, E.Y. Prediction of electrically induced magnetic reconstruction at the manganite/ferroelectric interface. Phys. Rev. B 2009, 80, 174406. [Google Scholar] [CrossRef]
- Wang, Z.H.; Zhao, W.S.; Kang, W.; Bouchenak-Khelladi, A.; Zhang, Y.; Klein, J.-O.; Ravelosona, D.; Chappert, C. Write operation study of Co/BTO/LSMO ferroelectric tunnel junction. J. Appl. Phys. 2013, 114, 044108. [Google Scholar] [CrossRef]
- García, V.; Bibes, M.; Bocher, L.; Valencia, S.; Kronast, F.; Crassous, A.; Moya, X.; Enouz-Vedrenne, S.; Gloter, A.; Imhoff, D.; et al. Ferroelectric Control of Spin Polarization. Science 2010, 327, 1106–1110. [Google Scholar] [CrossRef]
- Valencia, S.; Crassous, A.; Bocher, L.; García, V.; Moya, X.; Cherifi, R.O.; Deranlot, C.; Bouzehouane, K.; Fusil, S.; Zobelli, A.; et al. Interface-induced room-temperature multiferroicity in BaTiO3. Nat. Mater. 2011, 10, 753–758. [Google Scholar] [CrossRef]
- García, V.; Bibes, M.; Barthélémy, A. Artificial multiferroic heterostructures for an electric control of magnetic properties. Comptes Rendus Phys. 2015, 16, 168–181. [Google Scholar] [CrossRef]
- Lepadatu, S.; Vopson, M.M. Heat-Assisted Multiferroic Solid-State Memory. Materials 2017, 10, 991. [Google Scholar] [CrossRef]
- Suzuki, Y.; Hwang, H.Y.; Cheong, S.-W.; Dover, R.B.V. The role of strain in magnetic anisotropy of manganite thin films. Appl. Phys. Lett. 1997, 71, 140–142. [Google Scholar] [CrossRef]
- Suzuki, Y.; Hwang, H.Y.; Cheong, S.-W.; Siegrist, T.; Van Dover, R.B.; Asamitsu, A.; Tokura, Y. Magnetic anisotropy of doped manganite thin films and crystals. J. Appl. Phys. 1998, 83, 7064–7066. [Google Scholar] [CrossRef]
- Berndt, L.M.; Balbarin, V.; Suzuki, Y. Magnetic anisotropy and strain states of (001) and (110) colossal magnetoresistance thin films. Appl. Phys. Lett. 2000, 77, 2903–2905. [Google Scholar] [CrossRef]
- Rajapitamahuni, A.; Zhang, L.; Koten, M.A.; Singh, V.R.; Burton, J.D.; Tsymbal, E.Y.; Shield, J.E.; Hong, X. Giant Enhancement of Magnetic Anisotropy in Ultrathin Manganite Films via Nanoscale 1D Periodic Depth Modulation. Phys. Rev. Lett. 2016, 116, 187201. [Google Scholar] [CrossRef]
- Telepinsky, Y.; Mor, V.; Schultz, M.; Hung, Y.-M.; Kent, A.D.; Klein, L. Towards a six-state magnetic memory element. Appl. Phys. Lett. 2016, 108, 182401. [Google Scholar] [CrossRef]
- Dabrowski, M.; Peixoto, T.R.F. Oscillations of the orbital magnetic moment due to d-band quantum well states. Phys. Rev. Lett. 2014, 113, 067203. [Google Scholar] [CrossRef]
- Kareev, M.; Prosandeev, S.; Liu, J.; Gan, C.; Kareev, A.; Freeland, J.W.; Xiao, M.; Chakhalian, J. Atomic control and characterization of surface defect states of TiO2 terminated SrTiO3 single crystals. Appl. Phys. Lett. 2008, 93, 61909. [Google Scholar] [CrossRef]
- Kawasaki, M.; Takahashi, K.; Maeda, T.; Tsuchiya, R.; Shinohara, M.; Ishiyama, O.; Yonezawa, T.; Yoshimoto, M.; Koinuma, H. Atomic Control of the SrTiO3 Crystal Surface. Science 1994, 266, 1540–1542. [Google Scholar] [CrossRef]
- Connell, J.G.; Isaac, B.J.; Ekanayake, G.B.; Strachan, D.R.; Seo, A. Preparation of atomically flat SrTiO3 surfaces using a deionized-water leaching and thermal annealing procedure. Appl. Phys. Lett. 2012, 101, 251607. [Google Scholar] [CrossRef]
- Mathews, M.; Postma, F.M. Step-induced uniaxial magnetic anisotropy of La0:67Sr0:33MnO3 thin films. Appl. Phys. Lett. 2005, 87, 242507. [Google Scholar] [CrossRef]
- Wang, Z.-H.; Cristiani, G.; Habermeier, H.-U. Uniaxial magnetic anisotropy and magnetic switching in La0.67Sr0.33MnO3 thin films grown on vicinal SrTiO3 (100). Appl. Phys. Lett. 2003, 82, 3731. [Google Scholar] [CrossRef]
- Dąbrowski, M.; Cinal, M.; Schmid, A.K.; Kirschner, J.; Przybylski, M. Fine-tuning of canted magnetization in stepped Fe films through thickness variation, Au capping, and quantum confinement. Phys. Rev. B 2019, 99, 184420. [Google Scholar] [CrossRef]
- Ye, J.; He, W.; Wu, Q.; Liu, H.; Zhang, X.-Q.; Chen, Z.-Y.; Cheng, Z.-H. Determination of magnetic anisotropy constants in Fe ultrathin film on vicinal Si (111) by anisotropic magnetoresistance. Sci. Rep. 2013, 3, 2148. [Google Scholar] [CrossRef] [PubMed]
- Arias, R.; Mills, D.L. Theory of roughness-induced anisotropy in ferromagnetic films: The dipolar mechanism. Phys. Rev. B 1999, 59, 11871–11881. [Google Scholar] [CrossRef]
- Sirena, M.; Haberkorn, N. Oxygen and disorder effect in the magnetic properties of manganite films. J. Magn. Magn. Mater. 2004, 272, 1171–1173. [Google Scholar] [CrossRef]
- Guo, H.; Wang, J. The Origin of Oxygen Vacancies Controlling La2/3Sr1/3MnO3 Electronic and Magnetic Properties. Adv. Mater. Interfaces 2016, 3, 1500753. [Google Scholar] [CrossRef]
© 2020 by the authors. Licensee MDPI, Basel, Switzerland. This article is an open access article distributed under the terms and conditions of the Creative Commons Attribution (CC BY) license (http://creativecommons.org/licenses/by/4.0/).


