3.1. Equilibrium Structure and Stability
After full optimization, the calculated lattice parameters of the five crystal structures are shown in
Table 1. Compared with experimental results, the theoretical results of MoAlB in this work show great agreement, with the deviations less than 0.56% [
5,
46]. In addition, the results in this work are highly consistent with the reported theoretical results calculated with the same method [
47]. Thus, the calculating method and parameters implemented in this work are supposed to be suitable, which ensures highly accurate predictions of other doped crystals. From
Table 1, it can be found that the volume of crystal cell shrunk after adding Si and Cr, while it tended to swell with the addition of W and Nb. This phenomenon can be easily understood considering the deviations between the doped atom and the initial one. In addition, Cr doped MoAlB crystal shows the lowest density, which decreases by 5.7% compared with the non-doping MoAlB. On the contrary, W doping dramatically increases the density of MoAlB by about 16.4%.
Thermostability of the crystal is an important parameter in evaluating the possibility of the doping reaction, and can be estimated by the parameters of cohesive energy (
Ecoh) and formation enthalpy (∆
Hr). In general, negative values of
Ecoh and ∆
Hr indicate the crystal structure to be thermodynamically stable. The
Ecoh and ∆
Hr of a compound can be calculated according to Equations (1) and (2) [
48,
49,
50,
51]:
where
Etol represents for total energy;
Eiso and
Ebulk represent the energy of an isolated atom and a single atom in bulk state, respectively. From
Table 1, it can be concluded that the all five calculated crystal structures are thermodynamically stable in view of the negative values of
Ecoh and ∆
Hr. From the perspective of
Ecoh, Si doped MoAlB is the most stable crystal due to its smallest
Ecoh, and the stability of crystal structures can be ranked in the order, Mo
4Al
3SiB
4 > Mo
3WAl
4B
4 > Mo
4Al
4B
4 > Mo
3NbAl
4B
4 > Mo
3CrAl
4B
4. On the other hand, the negative formation enthalpies also prove all the crystals structures to be thermodynamically stable. In this context, it can be concluded that the doping of Si, Cr, W, and Nb should be realized in experiments.
3.2. Elastic Properties
The mechanical properties can be investigated by calculating the elastic constants of the crystals. In this work, the elastic constants have been evaluated by the stress-strain method, where the stress-strain curve was described by generalized Hooker’s law, as shown in Equation (3):
where
σij represents for the stress tensor;
εij and
Cijkl represent the Lagrangian strain tensor and elastic constant tensor, respectively. The elastic constants (
Cij) of all the five crystals have been calculated and listed in
Table 2. The second order elastic constants of MoAlB show pretty good agreement with the reported results [
37,
47], indicating the reliability of our calculation. The mechanical stability of compounds can be justified according to Boron–Huang’s criteria [
52,
53,
54]. For the MoAlB crystals with orthorhombic lattice, the general criteria can be expressed as Equation (4):
According to the constants in
Table 2, all five crystal structures are mechanically stable, as they fully satisfy the above stability criterion. Like the MAX phases, the
C11,
C22, and
C33 of MoAlB crystal, representing elastic stiffness against principal strain, are much higher than those against shear strains (
C44,
C55 and
C66). In other words, MoAlB crystal is considerably incompressible along
a,
b, and
c crystal axis, but shows relatively weaker resistance to the shear deformation on the (1 0 0), (0 1 0) and (0 0 1) planes. Furthermore, it can be observed that
C11 and
C33 are higher than
C22 for all five crystals, indicating that MoAlB is more incompressible along the
a and
c axes [
38]. The weaker incompressibility along the
b axis may be attributed to the double-layer Al.
C33 is the largest among all the elastic constants, which signifies the strongest covalent bonding along the
c axis. Compared with initial MoAlB, Si and W doping are beneficial to improving the incompressibility along the
a and
c axes, with the increase of
C11 and
C33. On the other hand, it is apparent that the resistance to shear on the (0 1 0) plane is the weakest considering the smallest
C55 value. However, the (1 0 0) plane is expected to show the strongest resistance to shear. Intrinsically, the elastic properties are mainly responding to the chemical bonding in the crystal, which will be deeply discussed thereinafter.
The ductility and brittleness of a compound can be verified by the value of Cauchy pressure on some extent [
38]. If the Cauchy pressure is negative, the compound is expected to be brittle in nature. According to
Table 2, Cauchy pressure of each calculated crystal can be calculated by the equation of (
C12–C44). It can be deduced from the negative Cauchy pressures that the calculated MoAlB crystals are intrinsically brittle. Furthermore, the ductility relation is Mo
4Al
3SiB
4 > Mo
3NbAl
4B
4 > Mo
3WAl
4B
4 > Mo
3CrAl
4B
4 > Mo
4Al
4B
4, by comparing the values of Cauchy pressure. In this context, it can be concluded that the addition of Si, Nb, W, and Cr benefits the improved ductility of MoAlB.
The bulk modulus (
B), shear modulus(
G), and Young’s modulus(
E) can be estimated based on the elastic constants (
Cij), according to the Voigt–Reuss–Hill (VRH) scheme [
55]. The VRH approximation means the average of Voigt and Reuss approximations. Herein, Voigt approximation, based on the assumption of uniform strain, decides the upper bounds of the elastic modulus, as expressed by Equations (5) and (6):
And Reuss approximation, based on the assumption of uniform stress, decides the lower bounds. It can be defined as the elastic compliances (
Sij) which are the inverse matrix of
Cij, as expressed by Equations (7) and (8):
Finally, the
B,
G, and
E can be obtained following Equations (9)–(11), and Poisson’s ratio (
ν) can be calculated according to Equation (12).
Table 3 lists the calculated bulk moduli (
B), shear moduli (
G), and Young’s moduli (
E) of all five calculated crystals. Additionally, the moduli data at 300K, measured by high-temperature resonant ultrasound spectroscopy (RUS) by Kota et al., have been provided as a comparison [
56]. As shown, the calculated
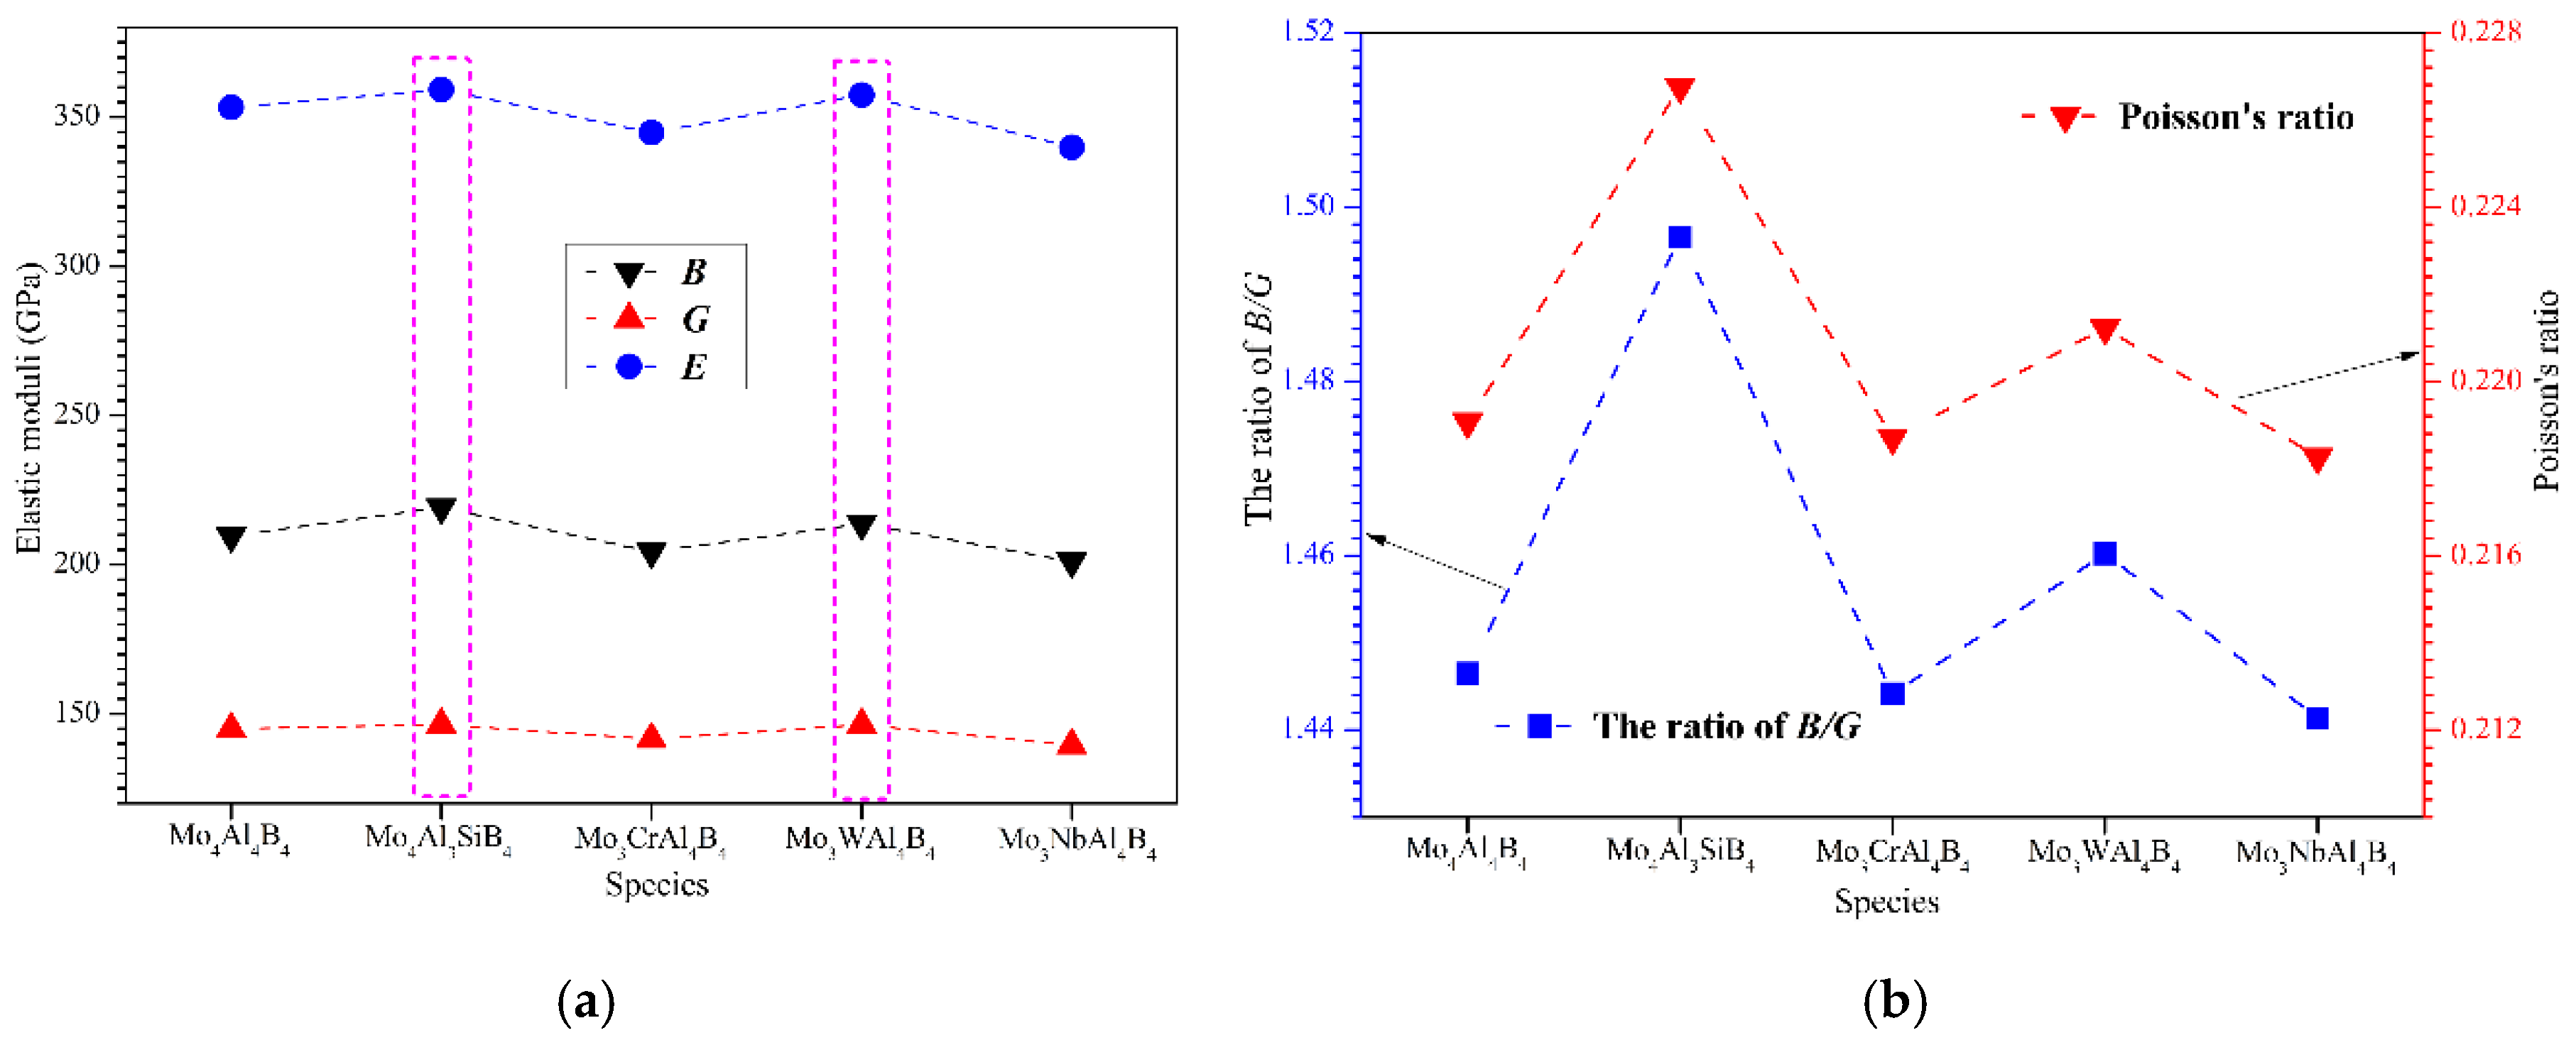
E of MoAlB is a little underestimated in this work compared with the experimental result. The calculated bulk modulus, shear modulus, and Young’s modulus have been plotted in
Figure 2a. First, it can be found that Young’s moduli of MoAlB are considerably higher, with the values larger than 350 GPa indicating the strong chemical bonding inside the crystal. From
Figure 2a, it can be visibly observed that the bulk modulus (
B) is substantially larger than the shear modulus (
G). Intriguingly, Si and W doped MoAlB exhibits a relatively higher elastic moduli compared to the others. This implies Si and W doping can help enhance the bonding interactions among the atoms. However, Cr and Nb doping seem to be detrimental to the elastic moduli. On the other hand, Pugh’s ratio can be obtained by calculating the ratio of
B/G.
B/G ratio is usually used to judge the ductile and brittle character of a solid [
57]. A higher
B/G value indicates a higher ductility, with a critical value of 1.75. Thus, the five calculated MoAlB crystals can be classified as brittle materials, with a
B/G value less than 1.75, which is totally consistent with the prediction from Cauchy pressure. However, according to the previously reported experimental results [
5,
14,
17,
22], MoAlB exhibits considerable toughness and damage tolerance. In this case, the predication about the toughness of MoAlB may not be so dependent as other compounds on the value the of B/G ratio. This phenomenon agrees well with the literature’s reports that Pugh’s ratio may not necessarily be a strong indication of ductility, for the ternary layered compounds, such as MAB and MAX phases [
36,
58,
59], because the effects of the layered structure, and significantly weak bonds of Al, on ductility, are underestimated during the calculation.
Figure 2b reveals the Poisson’s and
B/
G ratios of the calculated MoAlB crystals. As shown, Mo
4Al
3SiB
4 crystal possesses the highest
B/
G and Poisson’s ratios, indicating superior ductility. By comparison, it can be concluded that Si and W doping can play a positive role in improving the ductility of MoAlB, while Cr and Nb doping seem to make adverse contributions.
Poisson’s ratio is also one of the important parameters in assessing the solid’s ductility and brittleness. With the critical value of 0.26, the material with a Poisson’s ratio lower than this usually behaves in a brittle manner, otherwise the material is expected to be ductile. In this context, the five calculated MoAlB crystals are all classified as brittle materials. This shows great consistency with the results of Cauchy’s pressure and B/G ratio. Moreover, the variation of Poisson’s ratio is also in good agreement with the B/G ratio. In summary, Si and W doping can enhance the elastic moduli and improve the ductility of MoAlB, which is expected to be an effective method to optimize the mechanical properties.
3.3. Elastic Anisotropy
The anisotropy of mechanical properties is a key factor that affects the material’s properties. Microcracks usually appear, originating from the mechanical anisotropy of materials. In MoAlB crystal, the elastic modulus along different principal axes are expected to differ from each other, considering the difference in the elastic constants in
Table 2. To reveal the anisotropic features, the universal anisotropic index (
AU), percent anisotropies (
AB and
AG), and shear anisotropic indexes (
A1,
A2 and
A3) have been calculated in this work according to Equations (13)–(18):
Table 4 lists the calculated anisotropic indexes of MoAlB crystals, with and without elemental doping. First, it can be found that Mo
4Al
3SiB
4 and Mo
3WAl
4B
4 have relatively smaller
AU, compared with the initial MoAlB, implying that the crystals tend to be more isotropic after Si and W doping. In addition, the
AB and
AG show the same varying trend with Si and W addition. Generally, directional covalent bonding plays a significant role in affecting the crystal’s anisotropy, while the metallic bonding contributes to improving the isotropy. Thus, it can be hypothesized that Si and W doping can help ameliorate the metallic character of MoAlB, which is beneficial to the crystal’s ductility. This results is in good agreement with the Pugh’s and Poisson’s ratios discussed above. Then,
A1,
A2, and
A3 reveal the anisotropies of shear moduli on the (1 0 0), (0 1 0), and (0 0 1) planes, respectively. Mo
3CrAl
4B
4 shows the smallest
A1 and Mo
4Al
3SiB
4 shows the smallest
A3, while Mo
3WAl
4B
4 and Mo
4Al
4B
4 share the smallest
A2. In other words, Mo
3CrAl
4B
4, Mo
4Al
3SiB
4, Mo
3WAl
4B
4, and Mo
4Al
4B
4 have the most isotropic shear moduli on the (1 0 0), (0 0 1), and (0 1 0) planes, respectively. Overall, Mo
3NbAl
4B
4 is regarded as the most anisotropic crystal due to the relatively high anisotropic index.
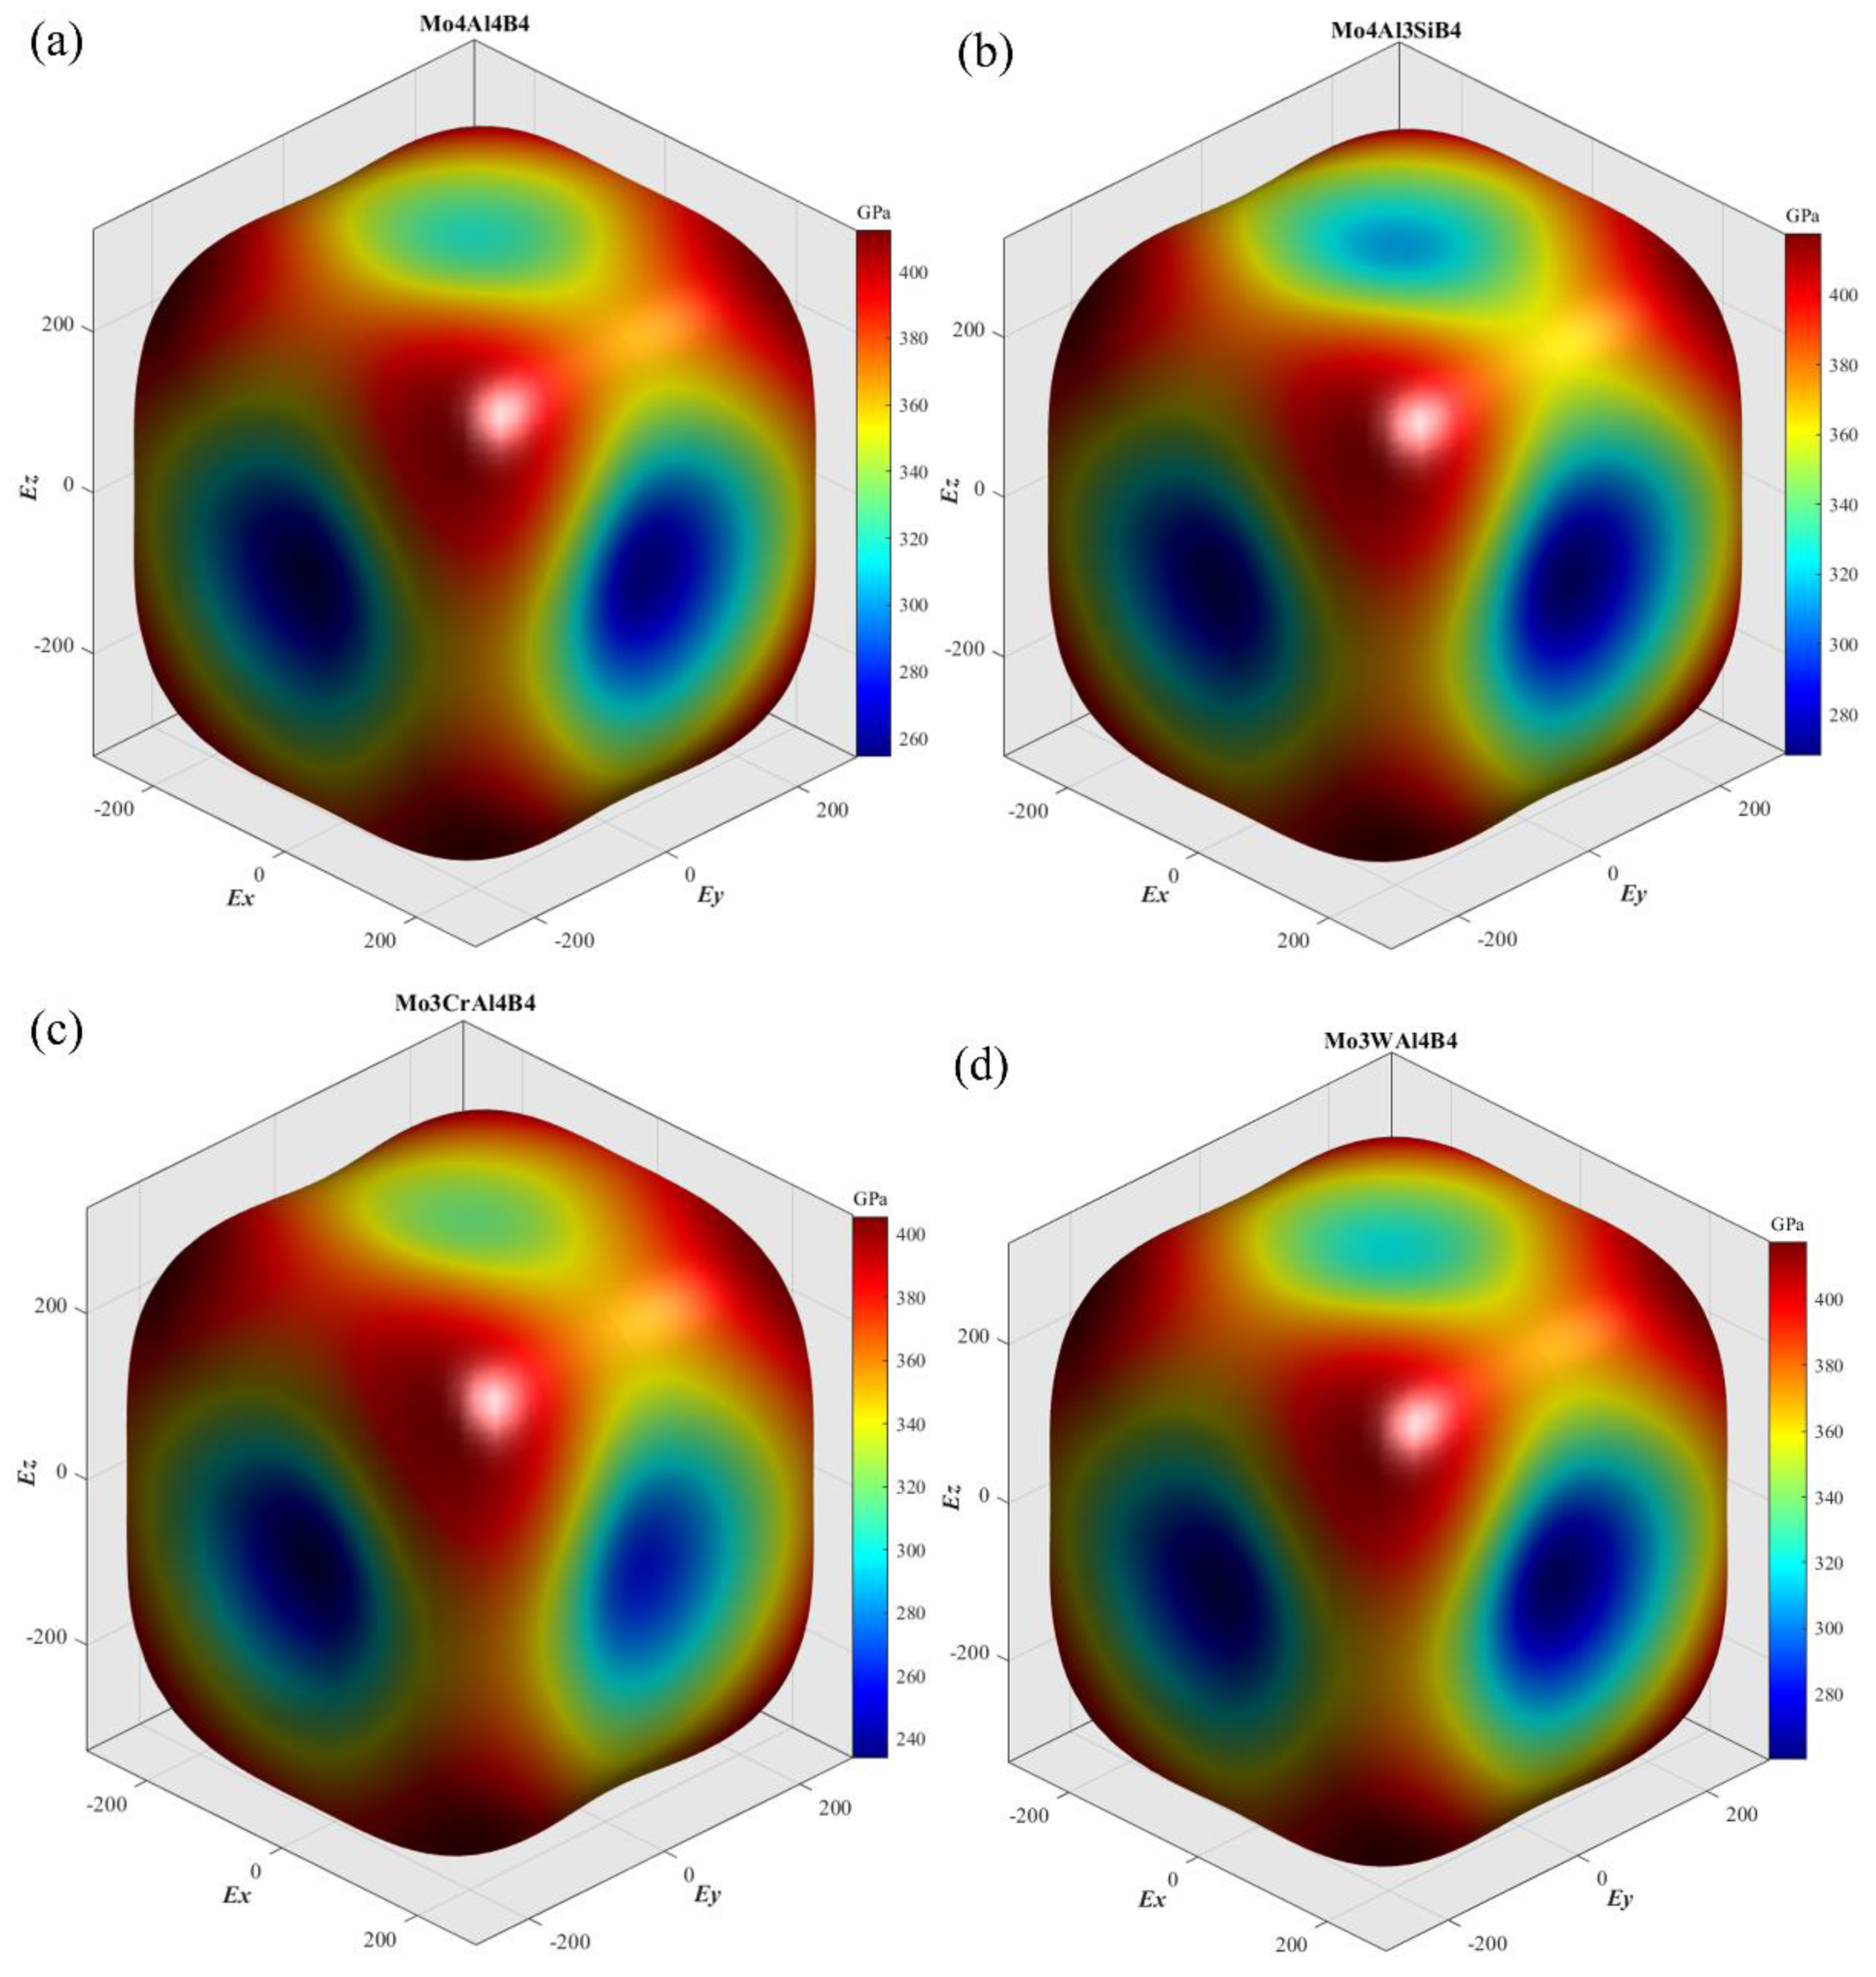
Young’s modulus is an important parameter to evaluate the mechanical properties of a material. Thus, the anisotropic features of Young’s modulus are worthwhile to be clearly elucidated. The spatial surface contours are practical and visible, giving insight to the anisotropies of Young’s modulus [
37]. In this case, the spatial surface contours of Young’s moduli, as a function of direction, have been depicted according to Equation (19):
where
l1,
l2, and
l3 are the directional cosines;
Sij represents the elastic compliance constant. In spherical coordinates:
l1 = sin
θ cos
ψ,
l2 = sin
θ sin
ψ and
l3 = cos
θ, respectively.
Figure 3 exhibits the three-dimensional surface contours of Young’s modulus of the five calculated crystals. As seen, the Young’s modulus of MoAlB shows great anisotropy, because the isotropic crystal usually has a spherical contour shape. The Young’s modulus of the five calculated crystals is the largest along the [1 1 1] crystal direction. On the contrary, the Young’s modulus seems to be the smallest along the [0 1 0] crystal direction. Overall, the contour shapes of the five crystals have considerable similarity, which may be attributed to the small difference in their lattice structures. To clarify the differences on different feature crystallographic planes, the planar projections on the (1 0 0), (0 1 0), (0 0 1), and (1 1 0) planes have been depicted in
Figure 4. It can be noticed that the Young’s moduli on the (1 0 0) and (0 1 0) planes are obviously more anisotropic than those on the other two planes. Compared with the initial MoAlB crystal, the Mo
4Al
3SiB
4 and Mo
3WAl
4B
4 show more isotropic Young’s modulus distribution, while the distributions of Mo
3CrAl
4B
4 and Mo
3NbAl
4B
4 are more anisotropic. This result agrees well with the discussion on the anisotropic parameter,
AU. On the other hand, it can be observed that, for five calculated crystals, the Young’s moduli along the [1 1 1] direction are the largest, while those along [0 1 0] are the smallest. Along the [1 1 1] direction, the Young’s modulus is higher than 400GPa, indicating the superior stiffness. As for the three principal axes, the relationship of Young’s modulus is
E[0 0 1] >
E[1 0 0] >
E[0 1 0], which is consistent with the spatial contours in
Figure 3. Furthermore, it can be found that Si and W doping can account for the enhancement of Young’s modulus, especially along the [0 1 0] direction. The Young’s modulus along [0 1 0] can be improved from 254.60 to 272.74 and 263.68 GPa after Si and W doping, respectively. In general, the low Young’s modulus relates tightly with poor energy. Thus, Si and W doping are supposed to improve the uniaxial tension resistance along [0 1 0] of MoAlB.
3.4. Electronic Structures
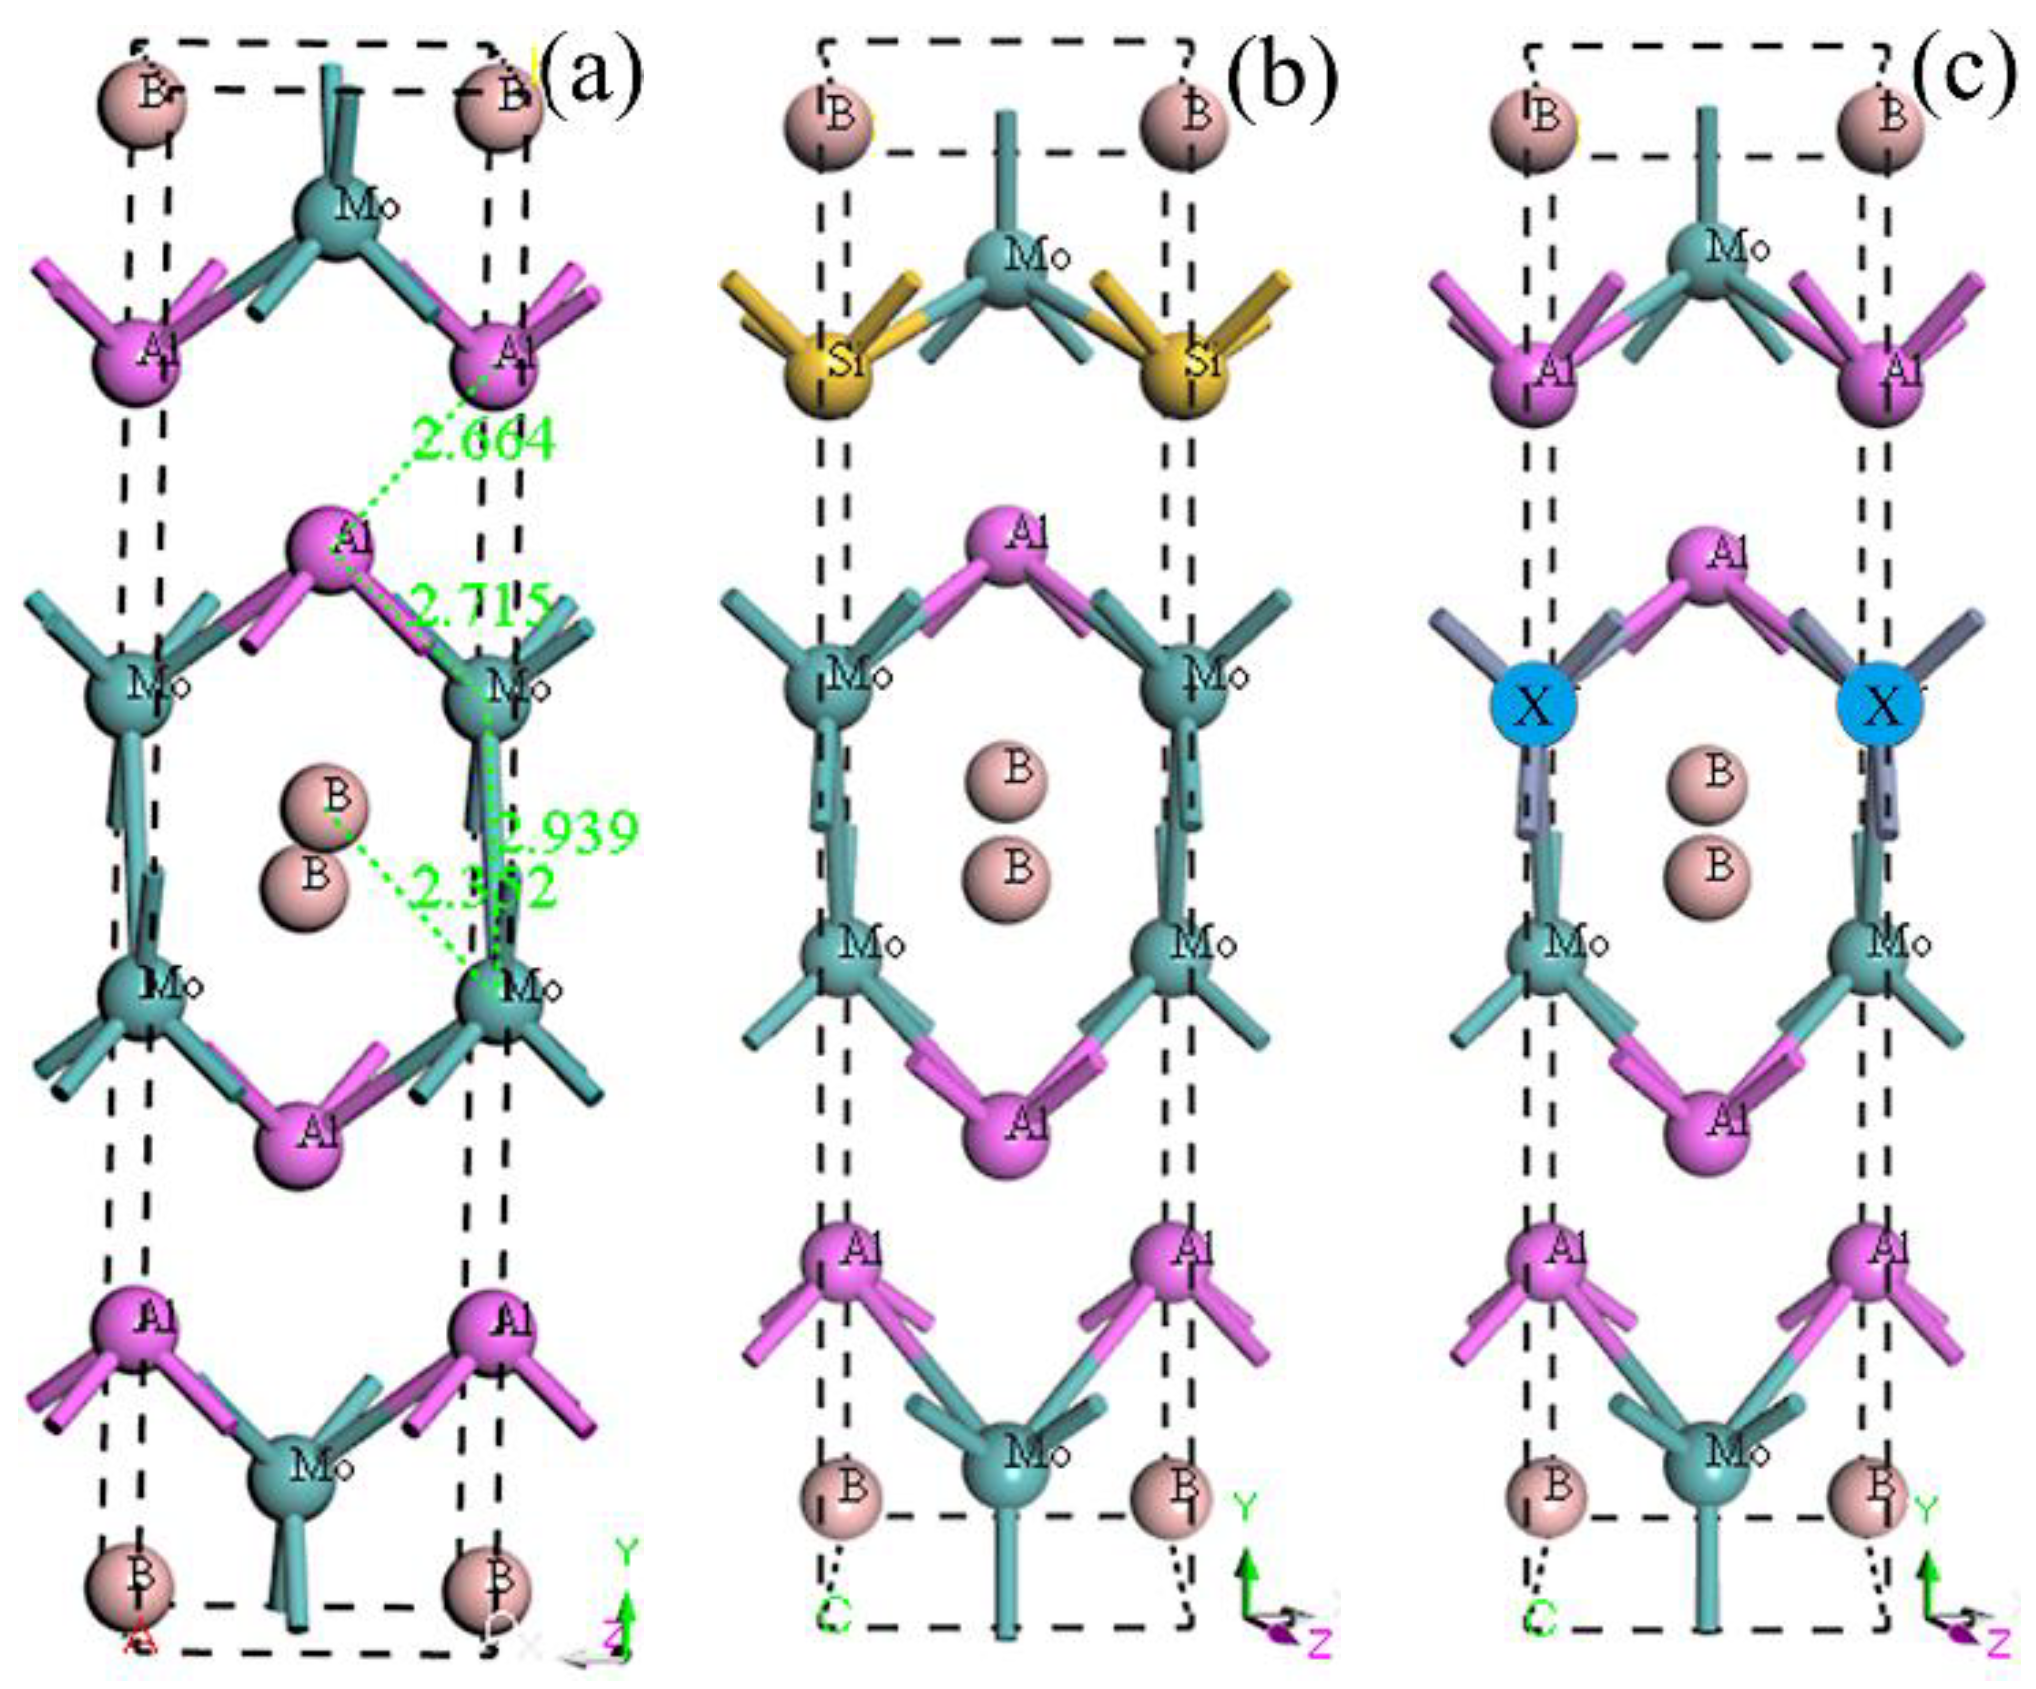
To further put insight into the bonding character of MoAlB, as well as the elementally doped crystals, the electronic structures were explored, including the density of states (DOS) and electron density distribution.
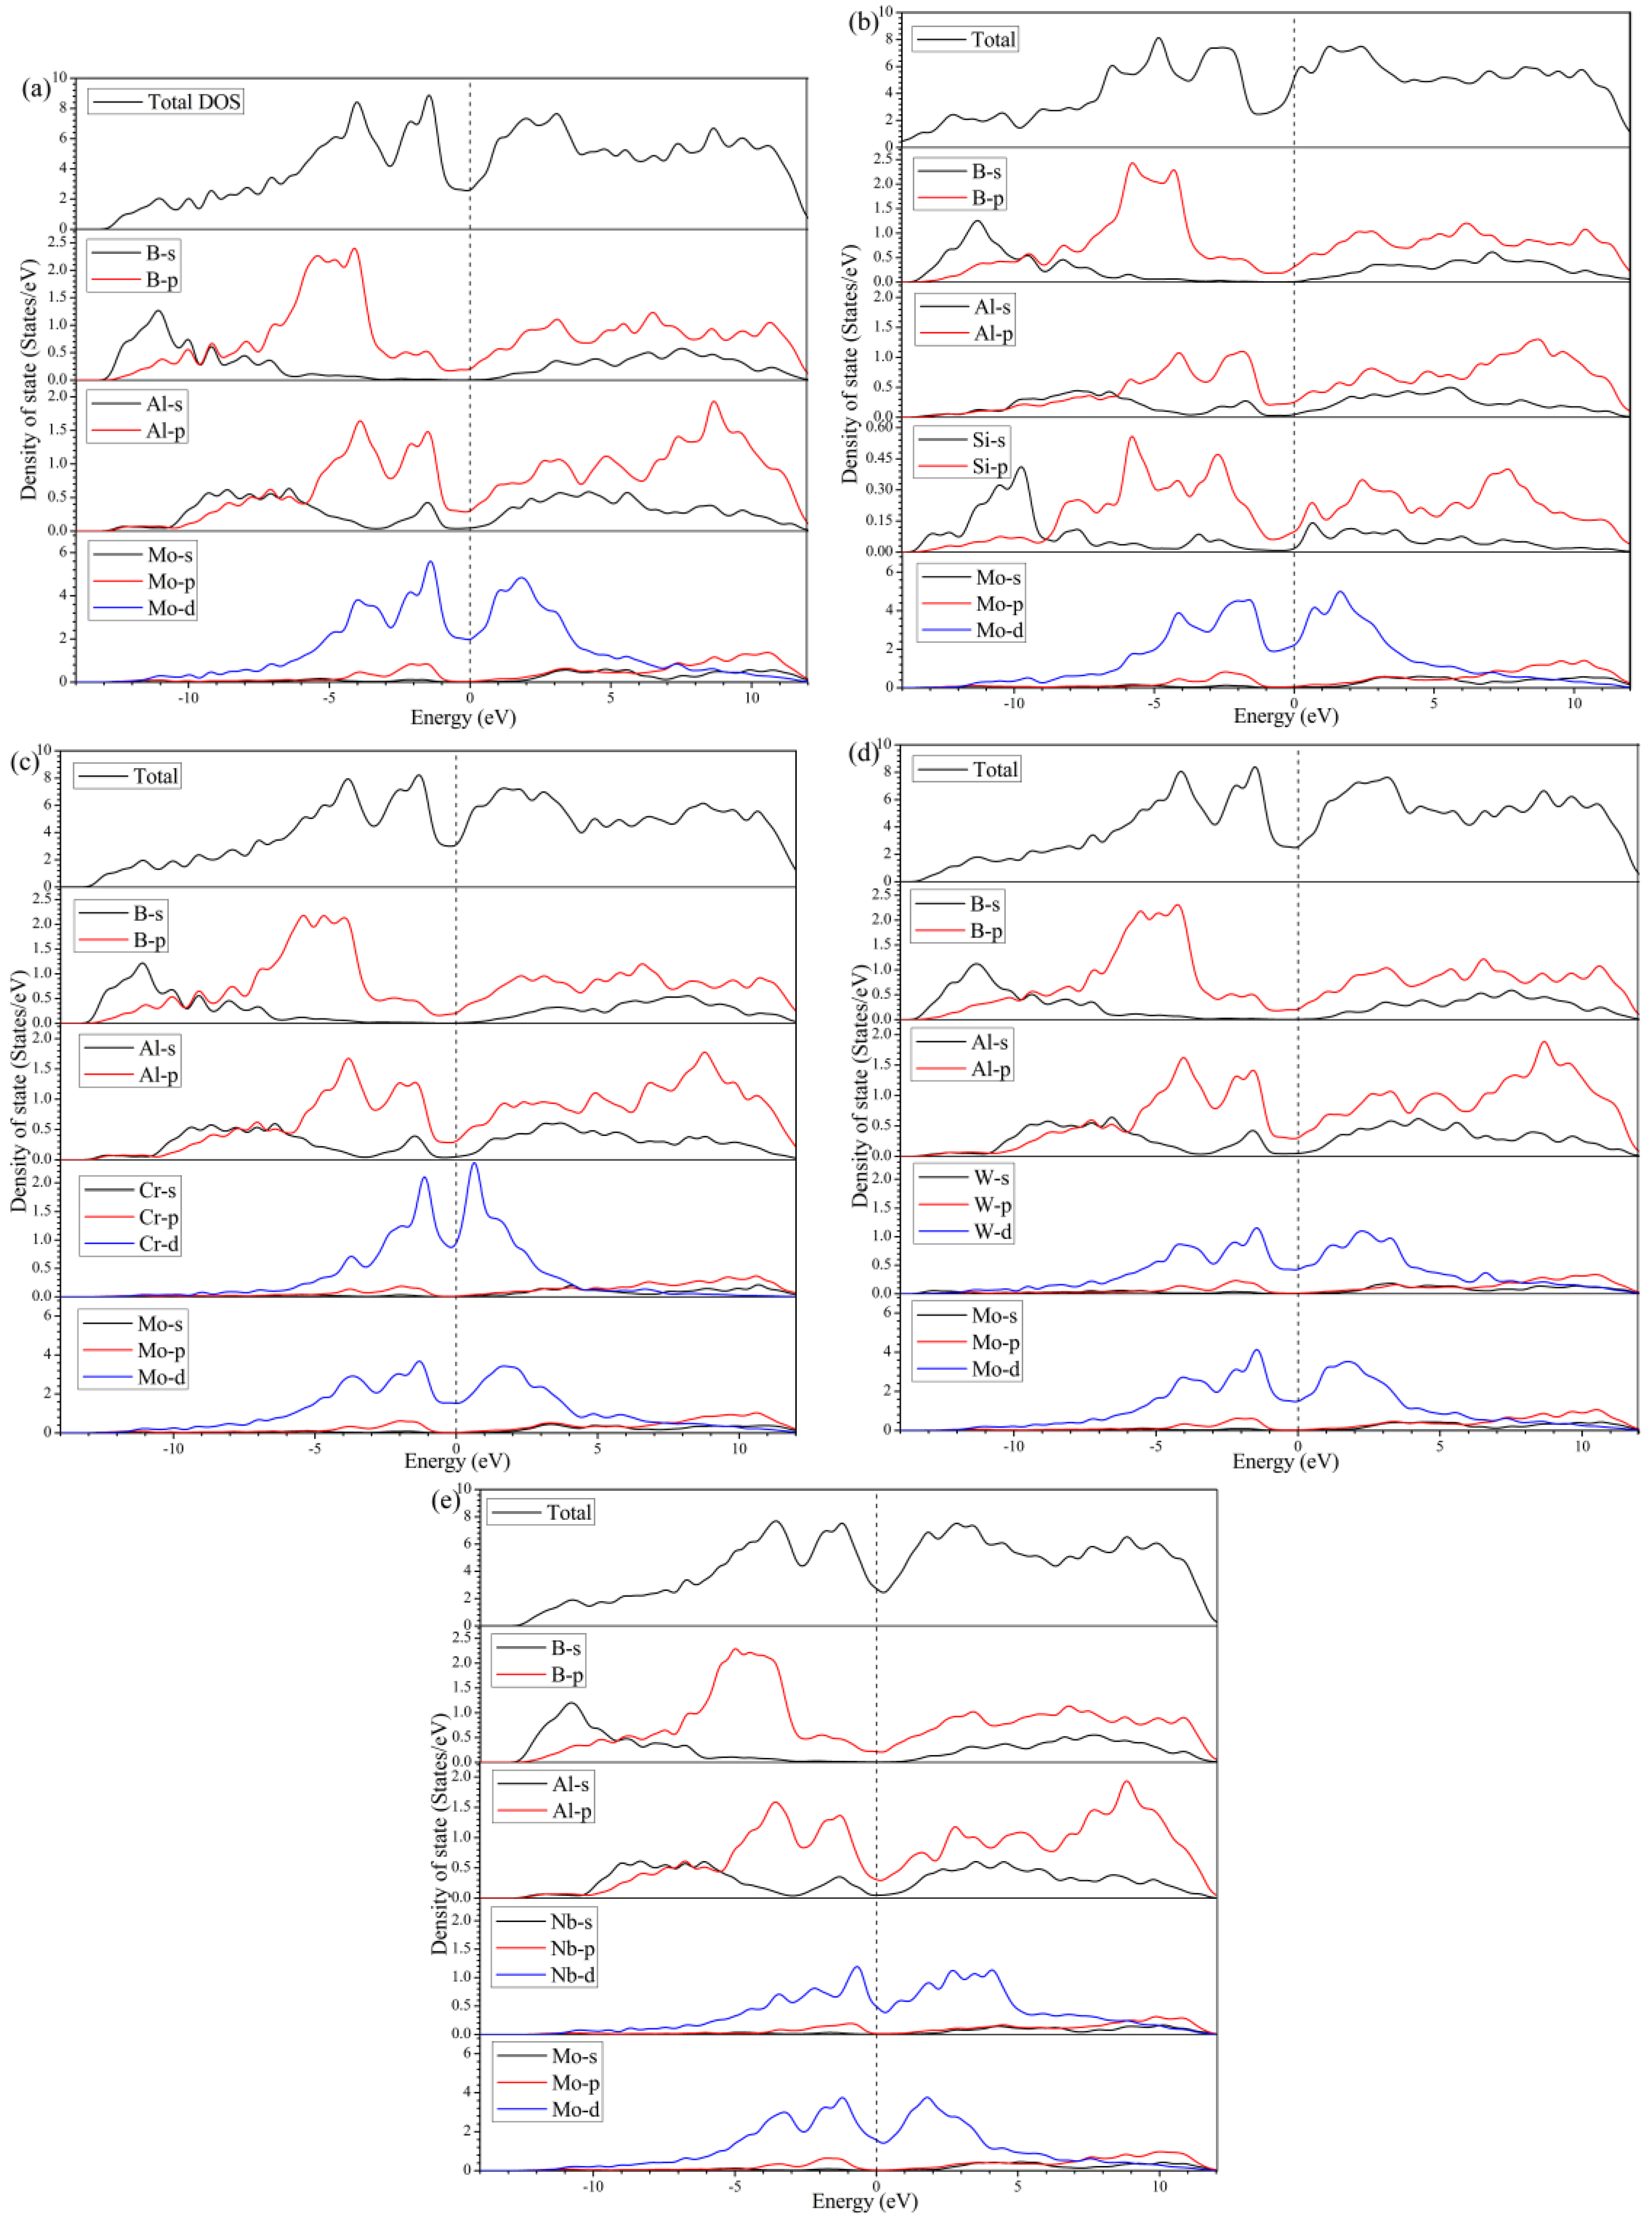
Figure 5 illustrates the total density of states (TDOS) and the partial density of states (PDOS) of the five calculated crystals. For all five crystals, the values of the DOS, at Fermi energy level (
Ef), are larger than zero, implying the metallic character of MoAlB. In addition, it is noticed that the
Ef exactly locates in the valley position of the TDOS, which is a portent of decent stability. By analyzing the PDOS of different atoms, it can be found that the DOS at
Ef is mainly contributed to by the
d states of Mo or the corresponding metal atoms. In other words, Mo, or the doped transition metal atoms, play the dominant role in the electronic conduction of MoAlB.
From
Figure 5a, the valence band below −7.0 eV is mainly constituted from the
s and
p states of B and Al. The corresponding hybridizations account for the chemical bonding between B-B, Al-B, and probably Al-Al in MoAlB. From −7.0 to −3.0 eV, the highest peak is mainly attributed to the strong hybridizations among B-
s, Al-
p, and Mo-
d orbitals, which renders into the formations of strong covalent bonding of Mo-B and Al-B. Moreover, the considerably high valence bands, with the peak centered around −1.2 eV, are mainly composed of the hybridization between Al-
p and Mo-
d states, indicating the relatively weak Mo-Al bonds. In Si doped MoAlB, the
s and
p states of Si make significant contributions to the valence bands below −7.0 eV, as shown in
Figure 5b, which is possibly to facilitate the formation of Si-B bonds. In addition, the valence bands from −7.0 to −3.0 eV mainly originate from B-
p, Al-
p, Si-
p, and Mo-
d states, indicating the formation of covalent bonds between Mo, Al, B, and Si atoms, except for the initial Mo-B and Al-B bonds. Thus, the elastic properties of MoAlB are supposed to be improved due to the enhancement of internal bonding. However, after the doping of transition metal atoms of Cr, W, or Nb, the main differences in the states hybridization can be found to appear from −7.0 eV to
Ef, originating from the contribution of their
d states, as shown in
Figure 5c to e. Herein, W is found to show the strongest hybridization with Mo, Al, and B, at around −4.0 eV, where the DOS peak is located, as shown in
Figure 5d. In this case, the chemical bondings of W with Mo, Al, and B are hypothesized to be consequently intensified. Nevertheless, Cr and Nb mainly participate in the hybridization with Mo and Al at around −1.2 eV, which is deemed to affect the bonds of Mo (Cr or Nb)-Al.
To clearly elucidate the type of chemical bonding as well as the corresponding evolution of the bonding strength with elemental doping, the bond lengths and overlapped populations have been analyzed and listed in
Table 5. Simultaneously, the electron density distributions on the (1 0 0) and (1 0 1) crystal planes have been depicted as shown in
Figure 6. From
Table 5, it can be visibly found that the B-B bond has the shortest bond length and largest population (much larger than 1), indicating the strongest B-B covalent bonding. This conclusion can be confirmed from
Figure 6a, in which a significantly high electron density can be observed between B-B atoms. The bonding between B-B shows apparently directional characters. In addition, Al-B and Mo-B bonds have overlapped populations much smaller than one, indicating mixed ionic and covalent bondings. However, the populations of Al-Al and Al-Mo bonds are extremely close to one, implying a significant tendency to covalent bonding. Herein, a negative value of overlapped population appears, basically for the bonds with a long distance. Generally, the negative population implies the antibonding or nonbonding between the two atoms.
After the introduction of Si, Cr, W, and Nb atoms, the B-B bond changes little, maintaining to show strong B-B covalent bonding, as listed in
Table 5. However, it is worth noting that Si addition contributes to intensifying the Al/Si-B and Al/Si-Mo bonds, by increasing the bond population but decreasing the bond length. As shown in
Figure 6b and c, it can be visible that the electron densities between Si-B and Si-Mo are much higher compared with the initial MoAlB crystal. Additionally, the bond length of Si-Al is observed to be shortened due to the smaller radius of Si. Consequently, as a sacrifice, the Mo-B bonds adjacent to the doped Si atom seem to be weaken, as shown in
Figure 6c, which can also be confirmed from the decreased population. From
Figure 6d, it can be found that the Al-Al bonds can be enhanced to some degree, while the other bonds change little after Cr doping. Intriguingly, W-B and W-Al bonds can be apparently intensified with a higher electron density, as displayed in
Figure 6e, which is also consistent with the results of bond population in
Table 5. Thus, the improvement of the elastic properties of MoAlB after W doping can be explained from the perspective of bonding characters. For Mo
3NbAl
4B
4, nearly all bonds can be extended due to the larger atomic radius, so that the bonding strength around Nb can be weakened somewhat. The worst mechanical performances of Mo
3NbAl
4B
4 are reasonable from the discussion above.
3.5. Debye Temperature
Debye temperature (
θD) is an important fundamental parameter in evaluating the physical properties of solids, for instance, the melting temperature, thermal expansion, and specific heat. It can be estimated by the average sound velocity (
vm), according to Equation (20) [
49,
50,
60,
61]:
where
kB,
h, and
NA are the Boltzmann, Planck, and Avogadro constants, respectively;
n is the number of atoms in each formula;
ρ is the density; and
M is the molecular weight. Herein, the average sound velocity (
vm) can be calculated by Equation (21) [
49,
50,
60]:
where
vt and
vl are the transversal and longitudinal sound velocities, respectively. The
vt and
vl can be obtained by the elastic moduli
B and G, according to Navier’s equation [
49,
50,
60], as shown below:
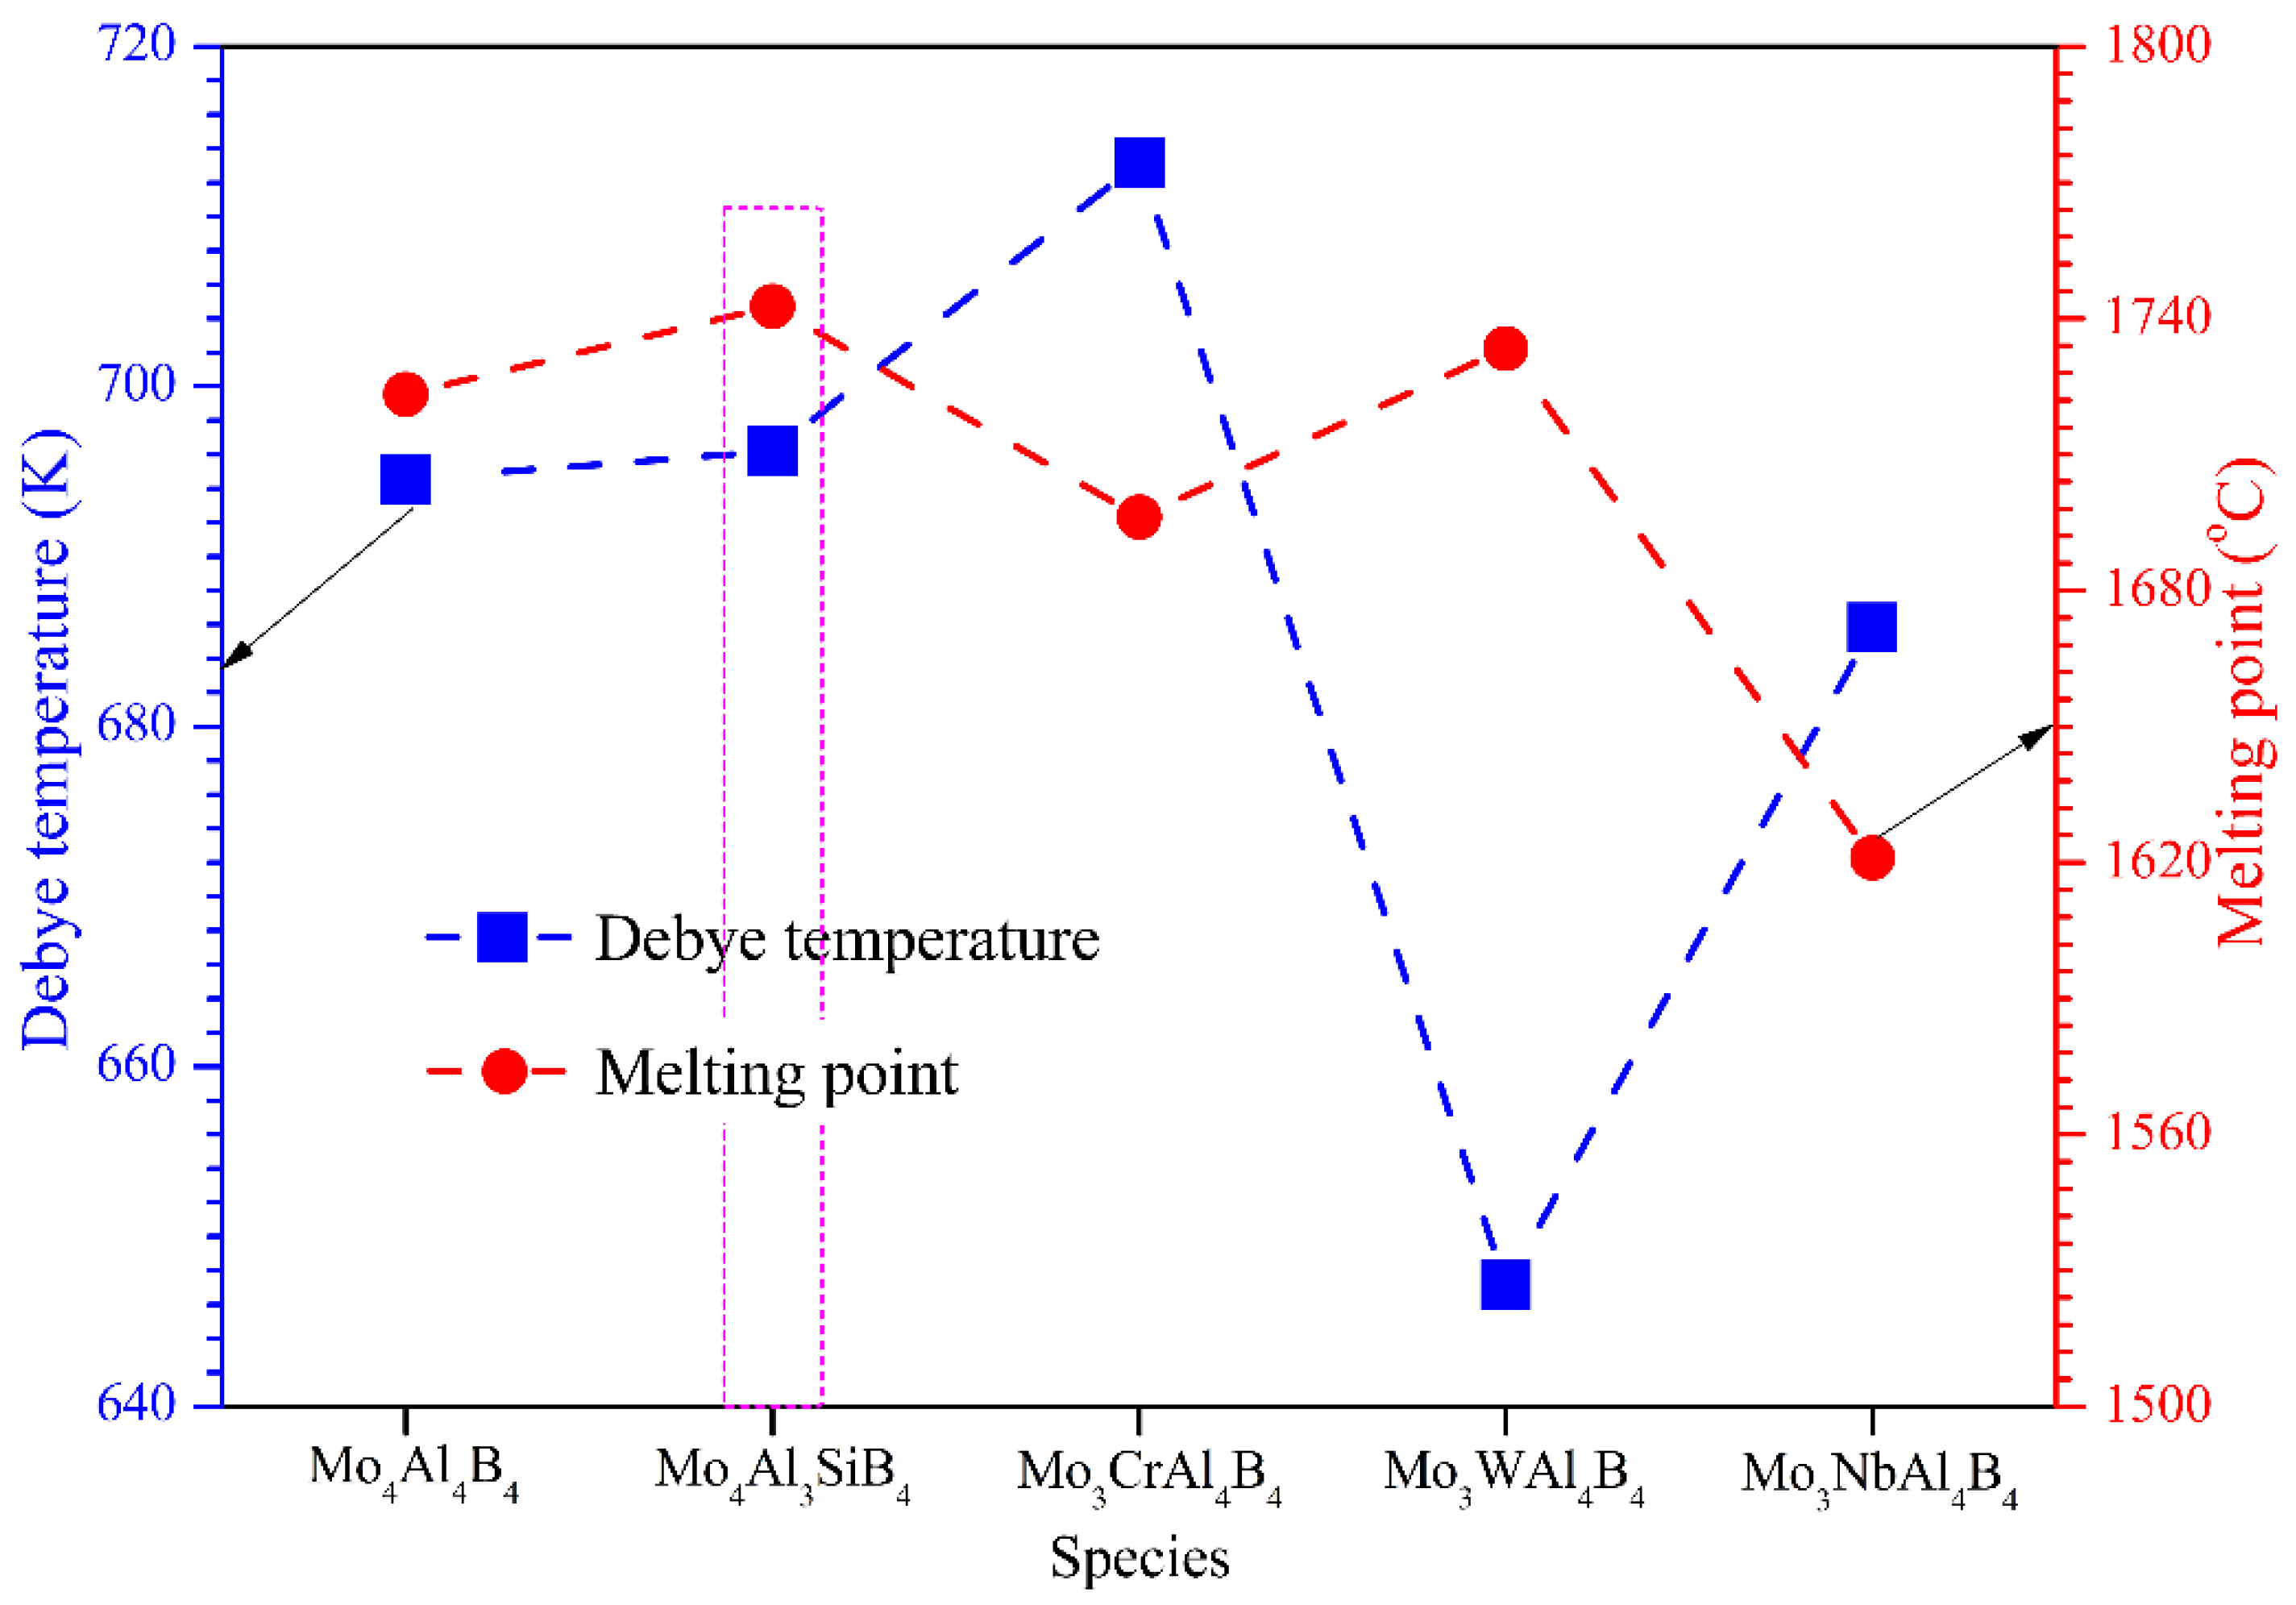
The calculated sound velocities and Debye temperatures (
θD) of the five calculated crystals have been summarized in
Table 6. The Debye temperature of MoAlB is considerably high, indicating its correspondingly good thermal conductivity and strong average chemical bonding. After the introduction of Si, Cr, W, and Mo atoms,
Vt and
Vl change little, except that the
Vl of Mo
3WAl
4B
4 decreases dramatically. Not surprisingly, the average sound velocity shows a remarkable decrease, accounting for the lowest
θD of Mo
3WAl
4B
4, as shown in
Figure 7. In this case, W doping is supposed to weaken the average atomic bonding of MoAlB. By comparison, Si and Cr doping can trigger the increase of
θD of MoAlB. On the other hand, the melting temperature (
Tm) can be empirically obtained with the aid of calculated elastic constants by Equation (24) [
62]:
where
C11 and
C33 are the elastic constants in
Table 2, respectively. As the structural material applied in the high-temperature fields, the melting point is a fairly important parameter that affects MoAlB’s application potential. From
Figure 7, it can be visibly found that Mo
4Al
3SiB
4 and Mo
3WAl
4B
4 possess higher
Tm than the initial MoAlB. Gene.rally, the melting temperature is tightly associated with the strong covalent bonding in the solid. Thus, the considerable
Tm can provide some evidence of the enhancement of covalent bonding after Si and W doping. In conclusion, we can conclude that Si is supposed to be the best doping element to ameliorate the mechanical and physical performance of MoAlB, which will be verified through experimental research in the future.


