The Thermal Conductivity of 3D Printed Plastic Insulation Materials—The Effect of Optimizing the Regular Structure of Closures


Abstract
:
1. Introduction
2. Materials and Methods
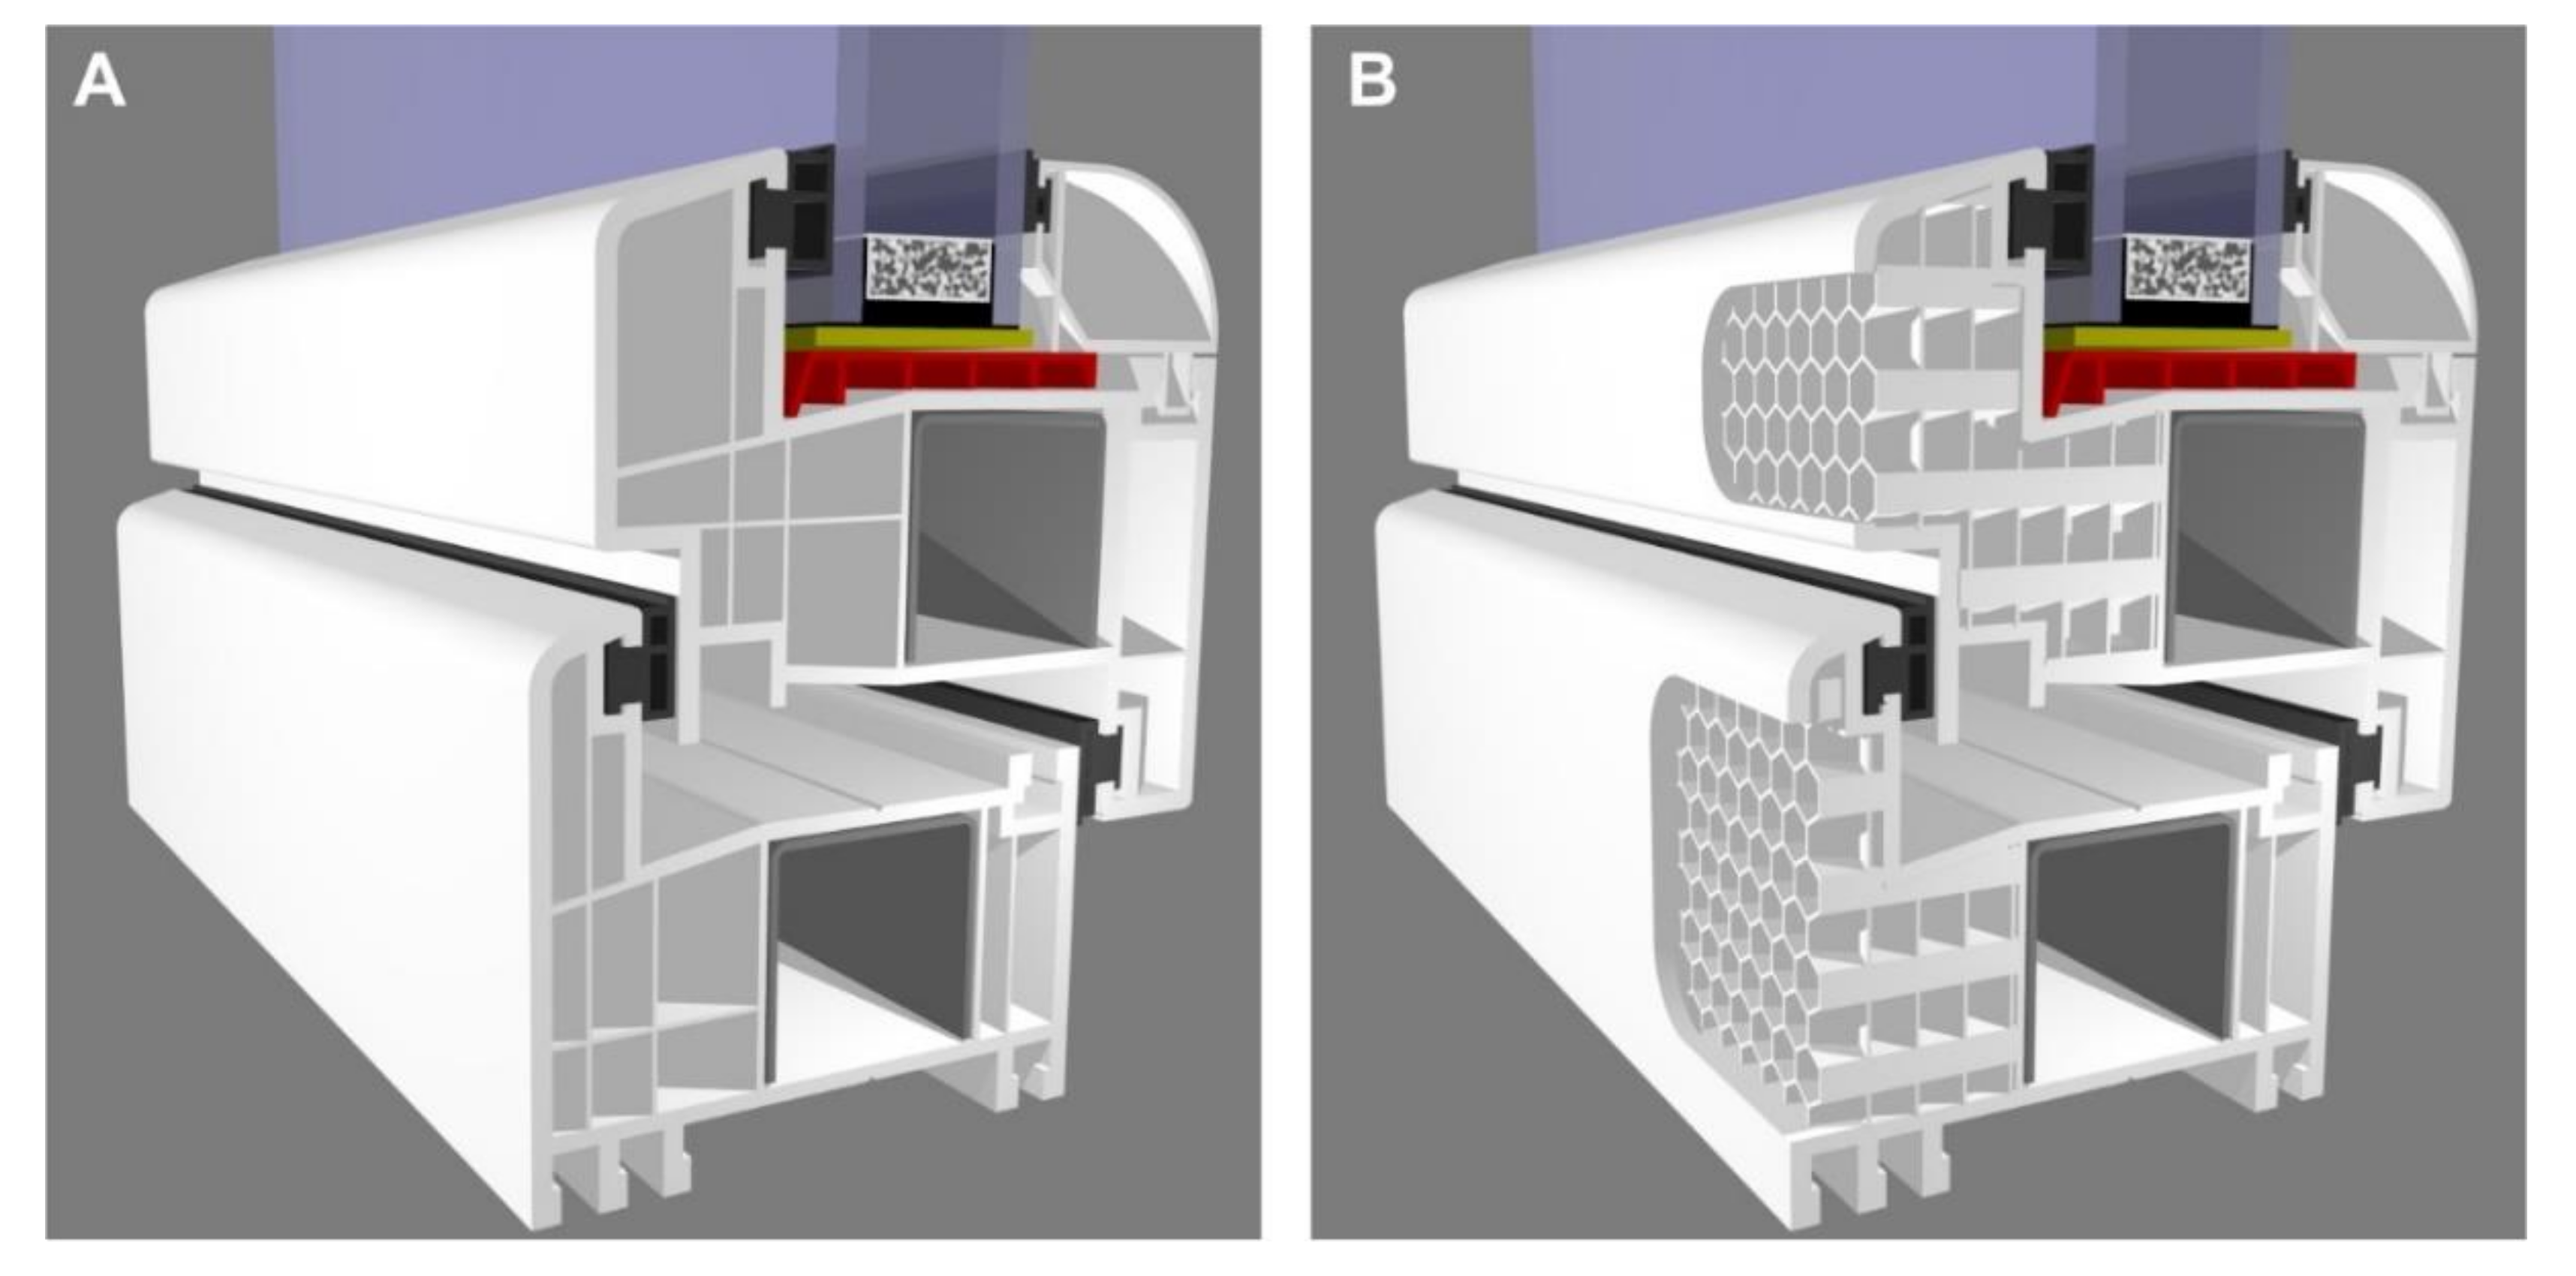
2.1. Practical Use Multilayer Insulation Material Made of Plastic with Thin Walls
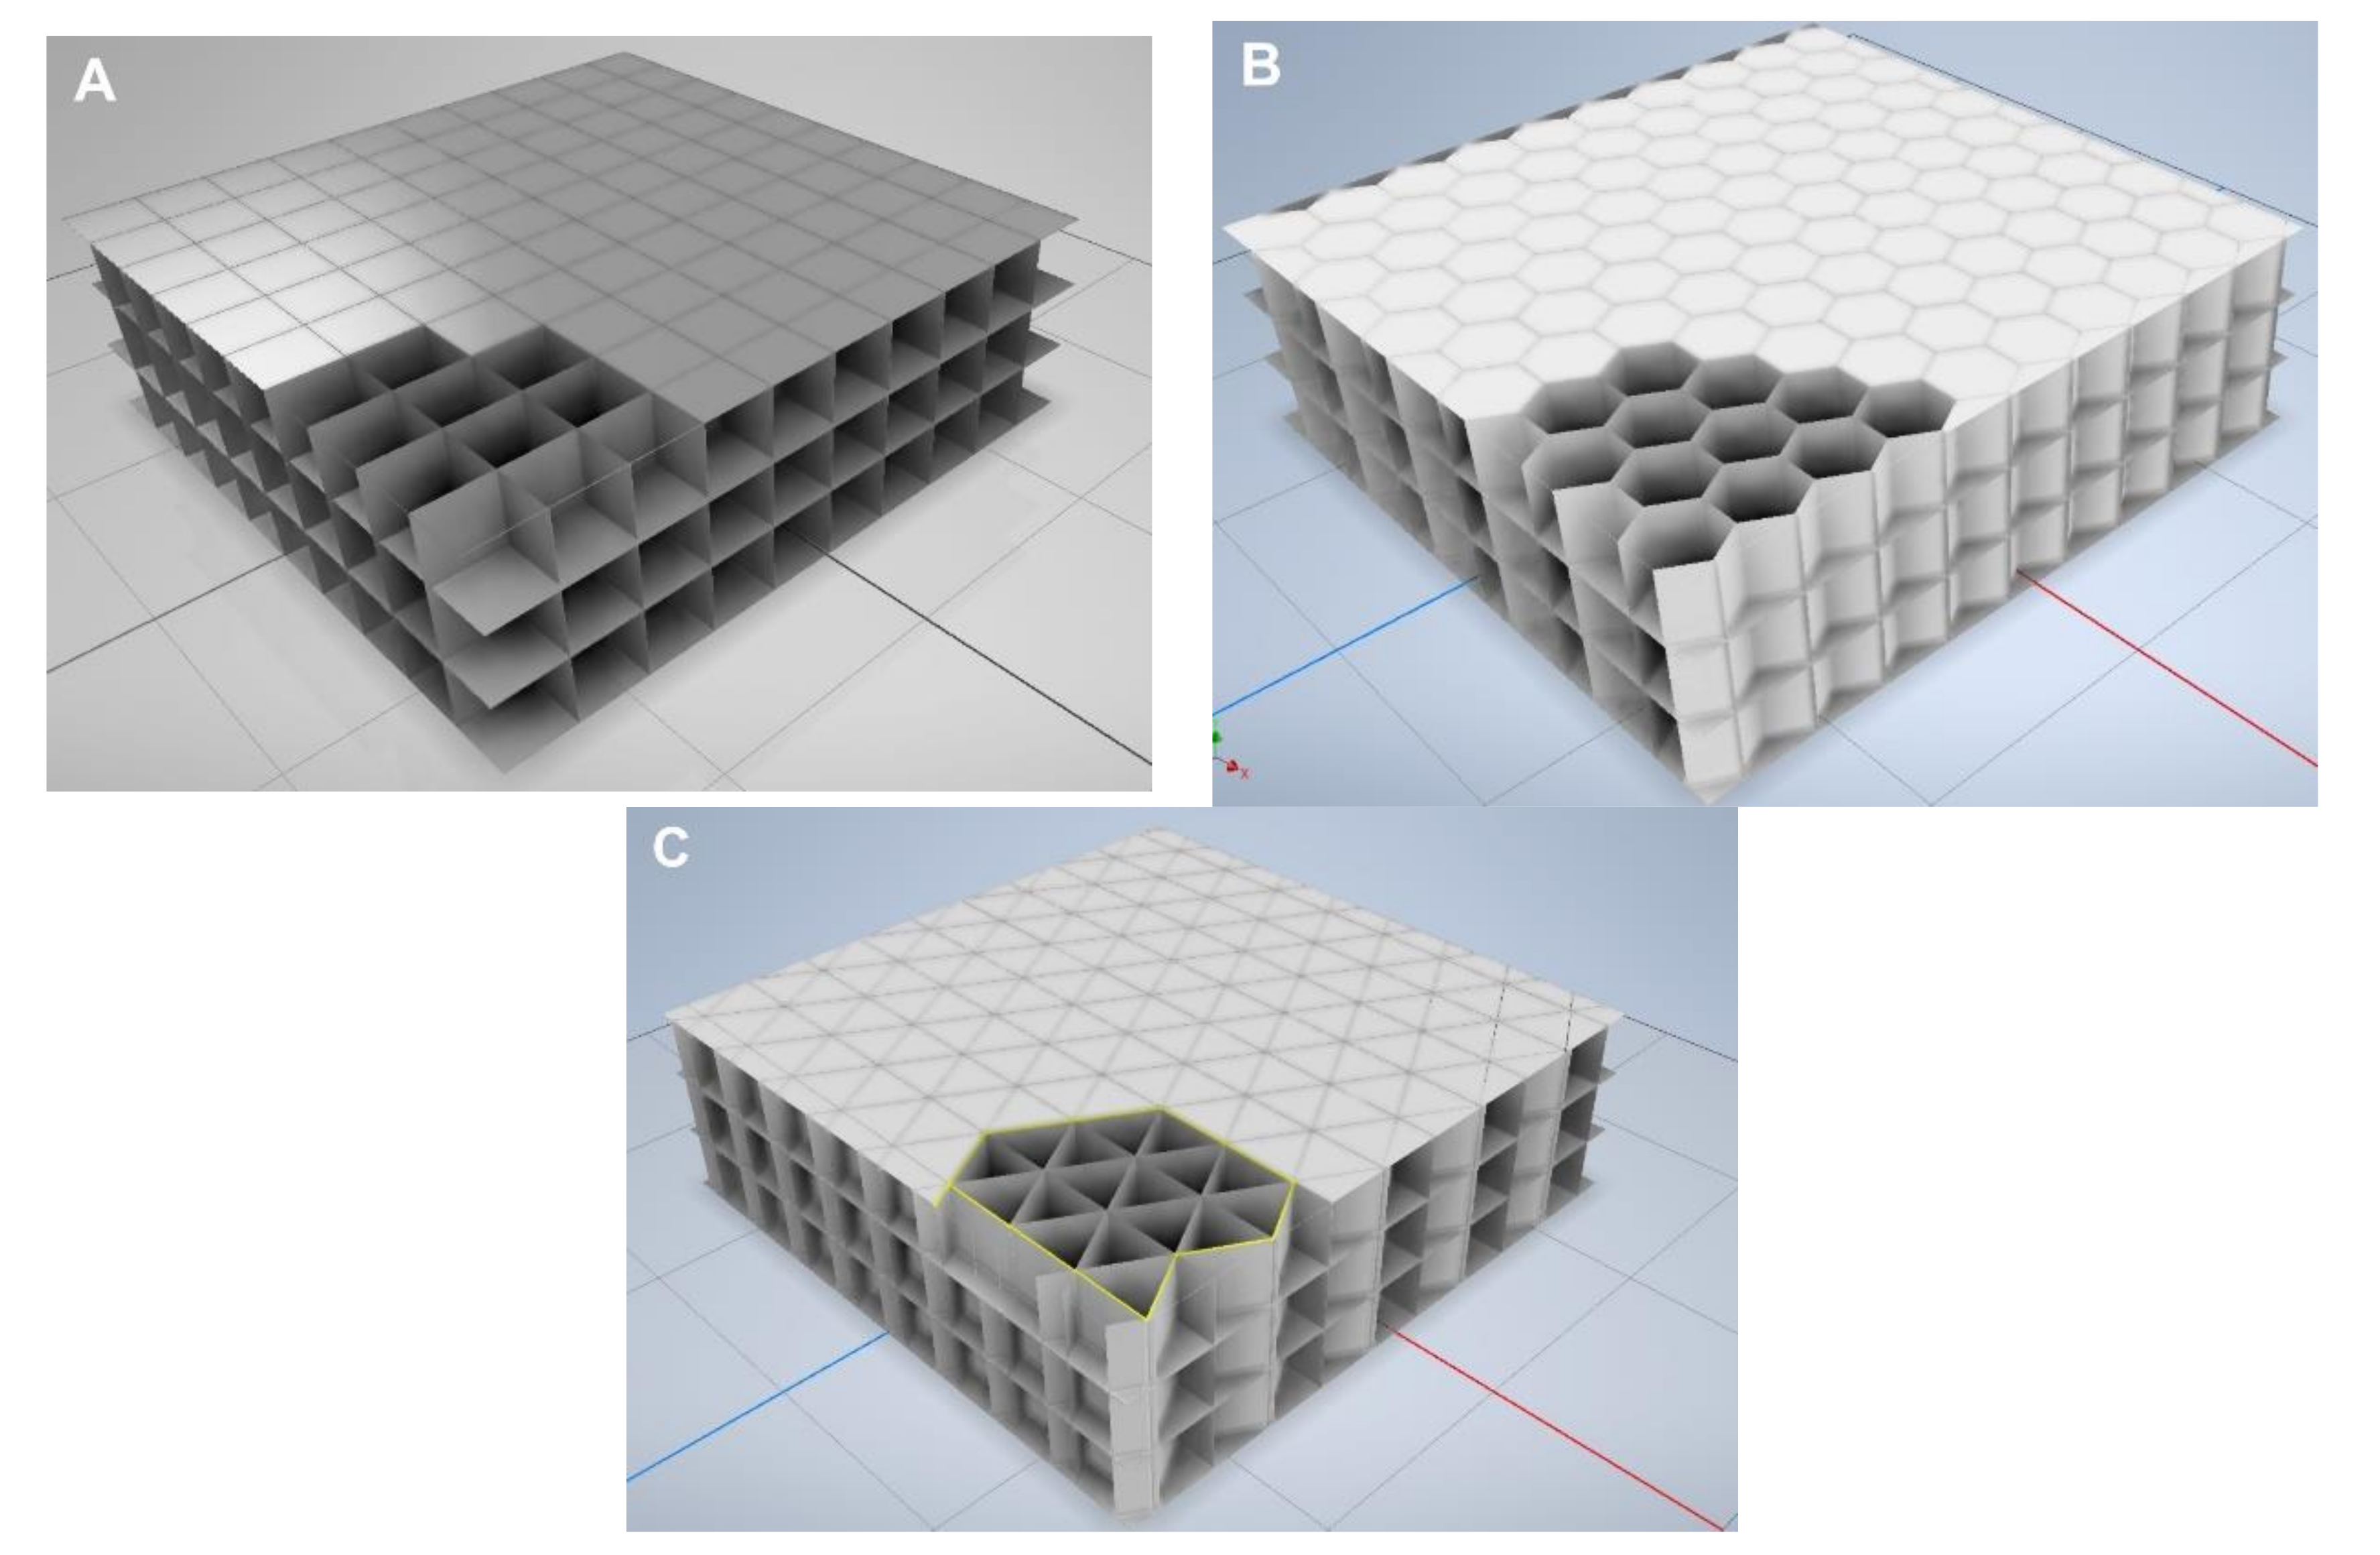
2.2. Design And 3D Printing of Multilayer Insulation
2.3. Mathematical Model
- qw—Heat conduction along plastic walls, W/m2,
- qa—Heat transfer through air,
- qc—Convective heat transfer, depending on the Rayleigh number value, W/m2,
- qr—radiation between layers, W/m2.
- TH—Temperature of hot side, K
- TC—Temperature of cold side, K
- n—Number of layers,
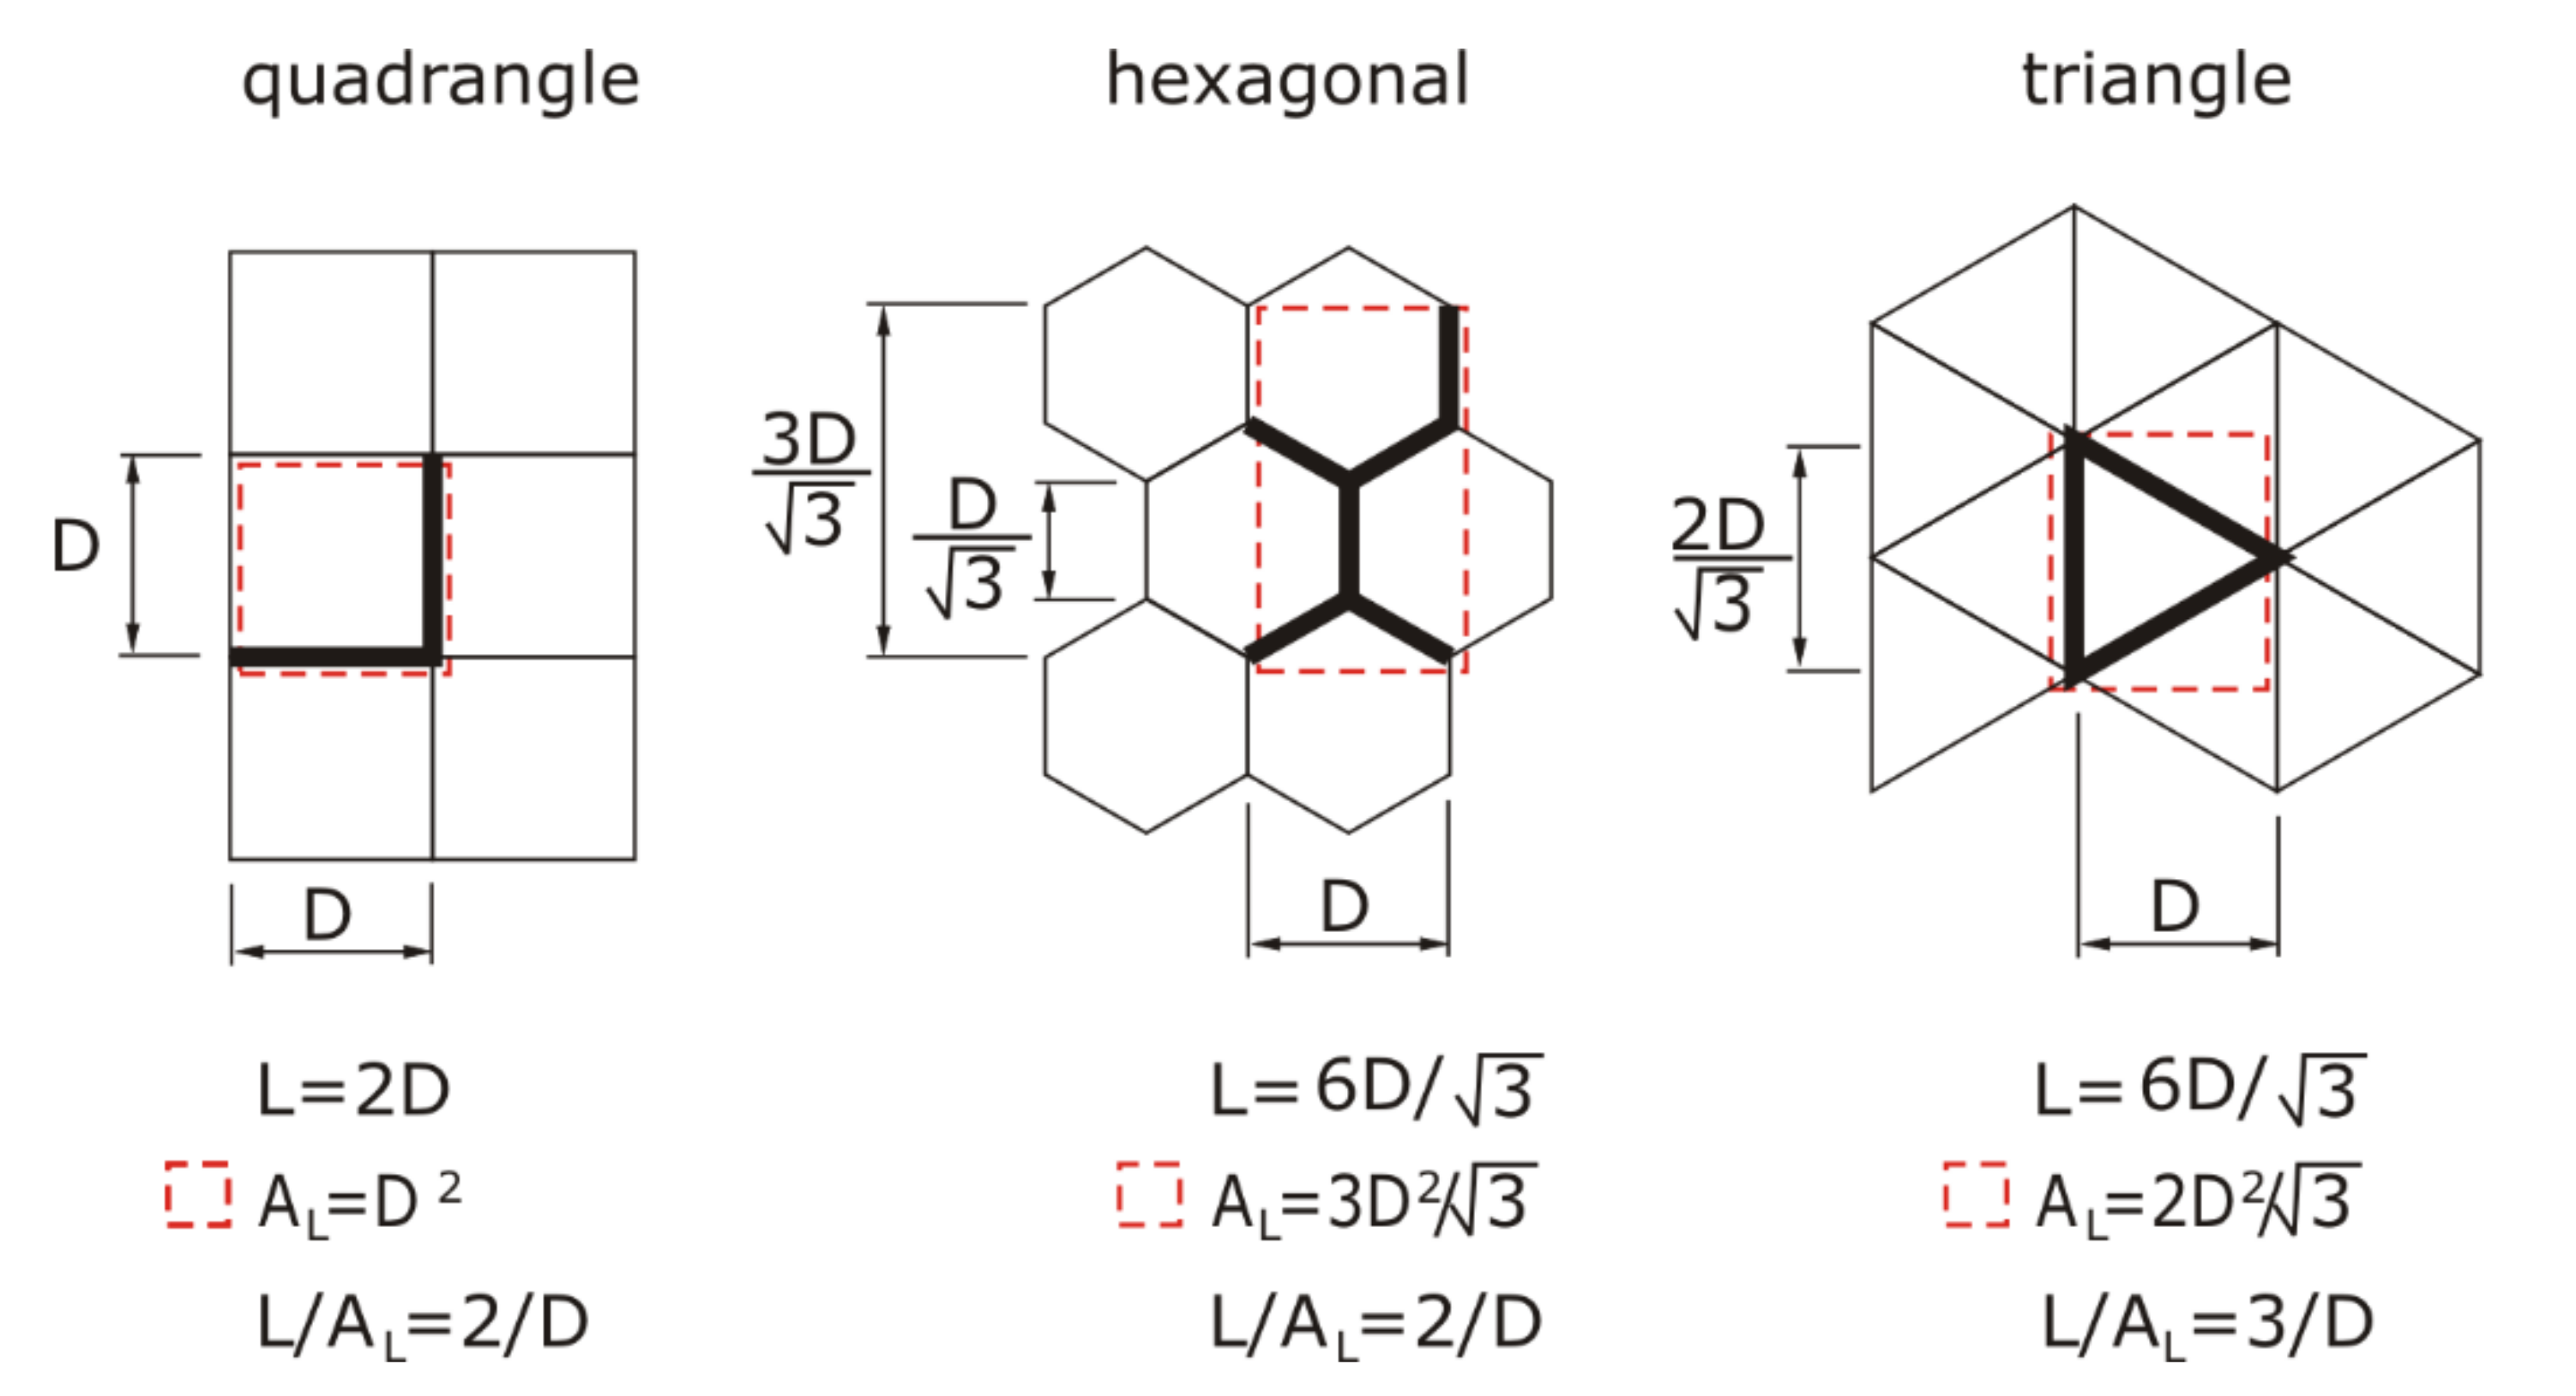
- D—Dimension of structure closure, m
- R—Thermal resistance, m2·K/W
- L—Wall length, m
- AL—Heat transfer area with walls that have length, L, m2
- Kw—Thermal conductivity of the wall material, W/(m·K)
- L/AL = 2/D for the quadrangle and hexagonal structures,
- L/AL = 3/D for the triangle structure.
- Ka—Thermal conductivity of air, W/(m·K)
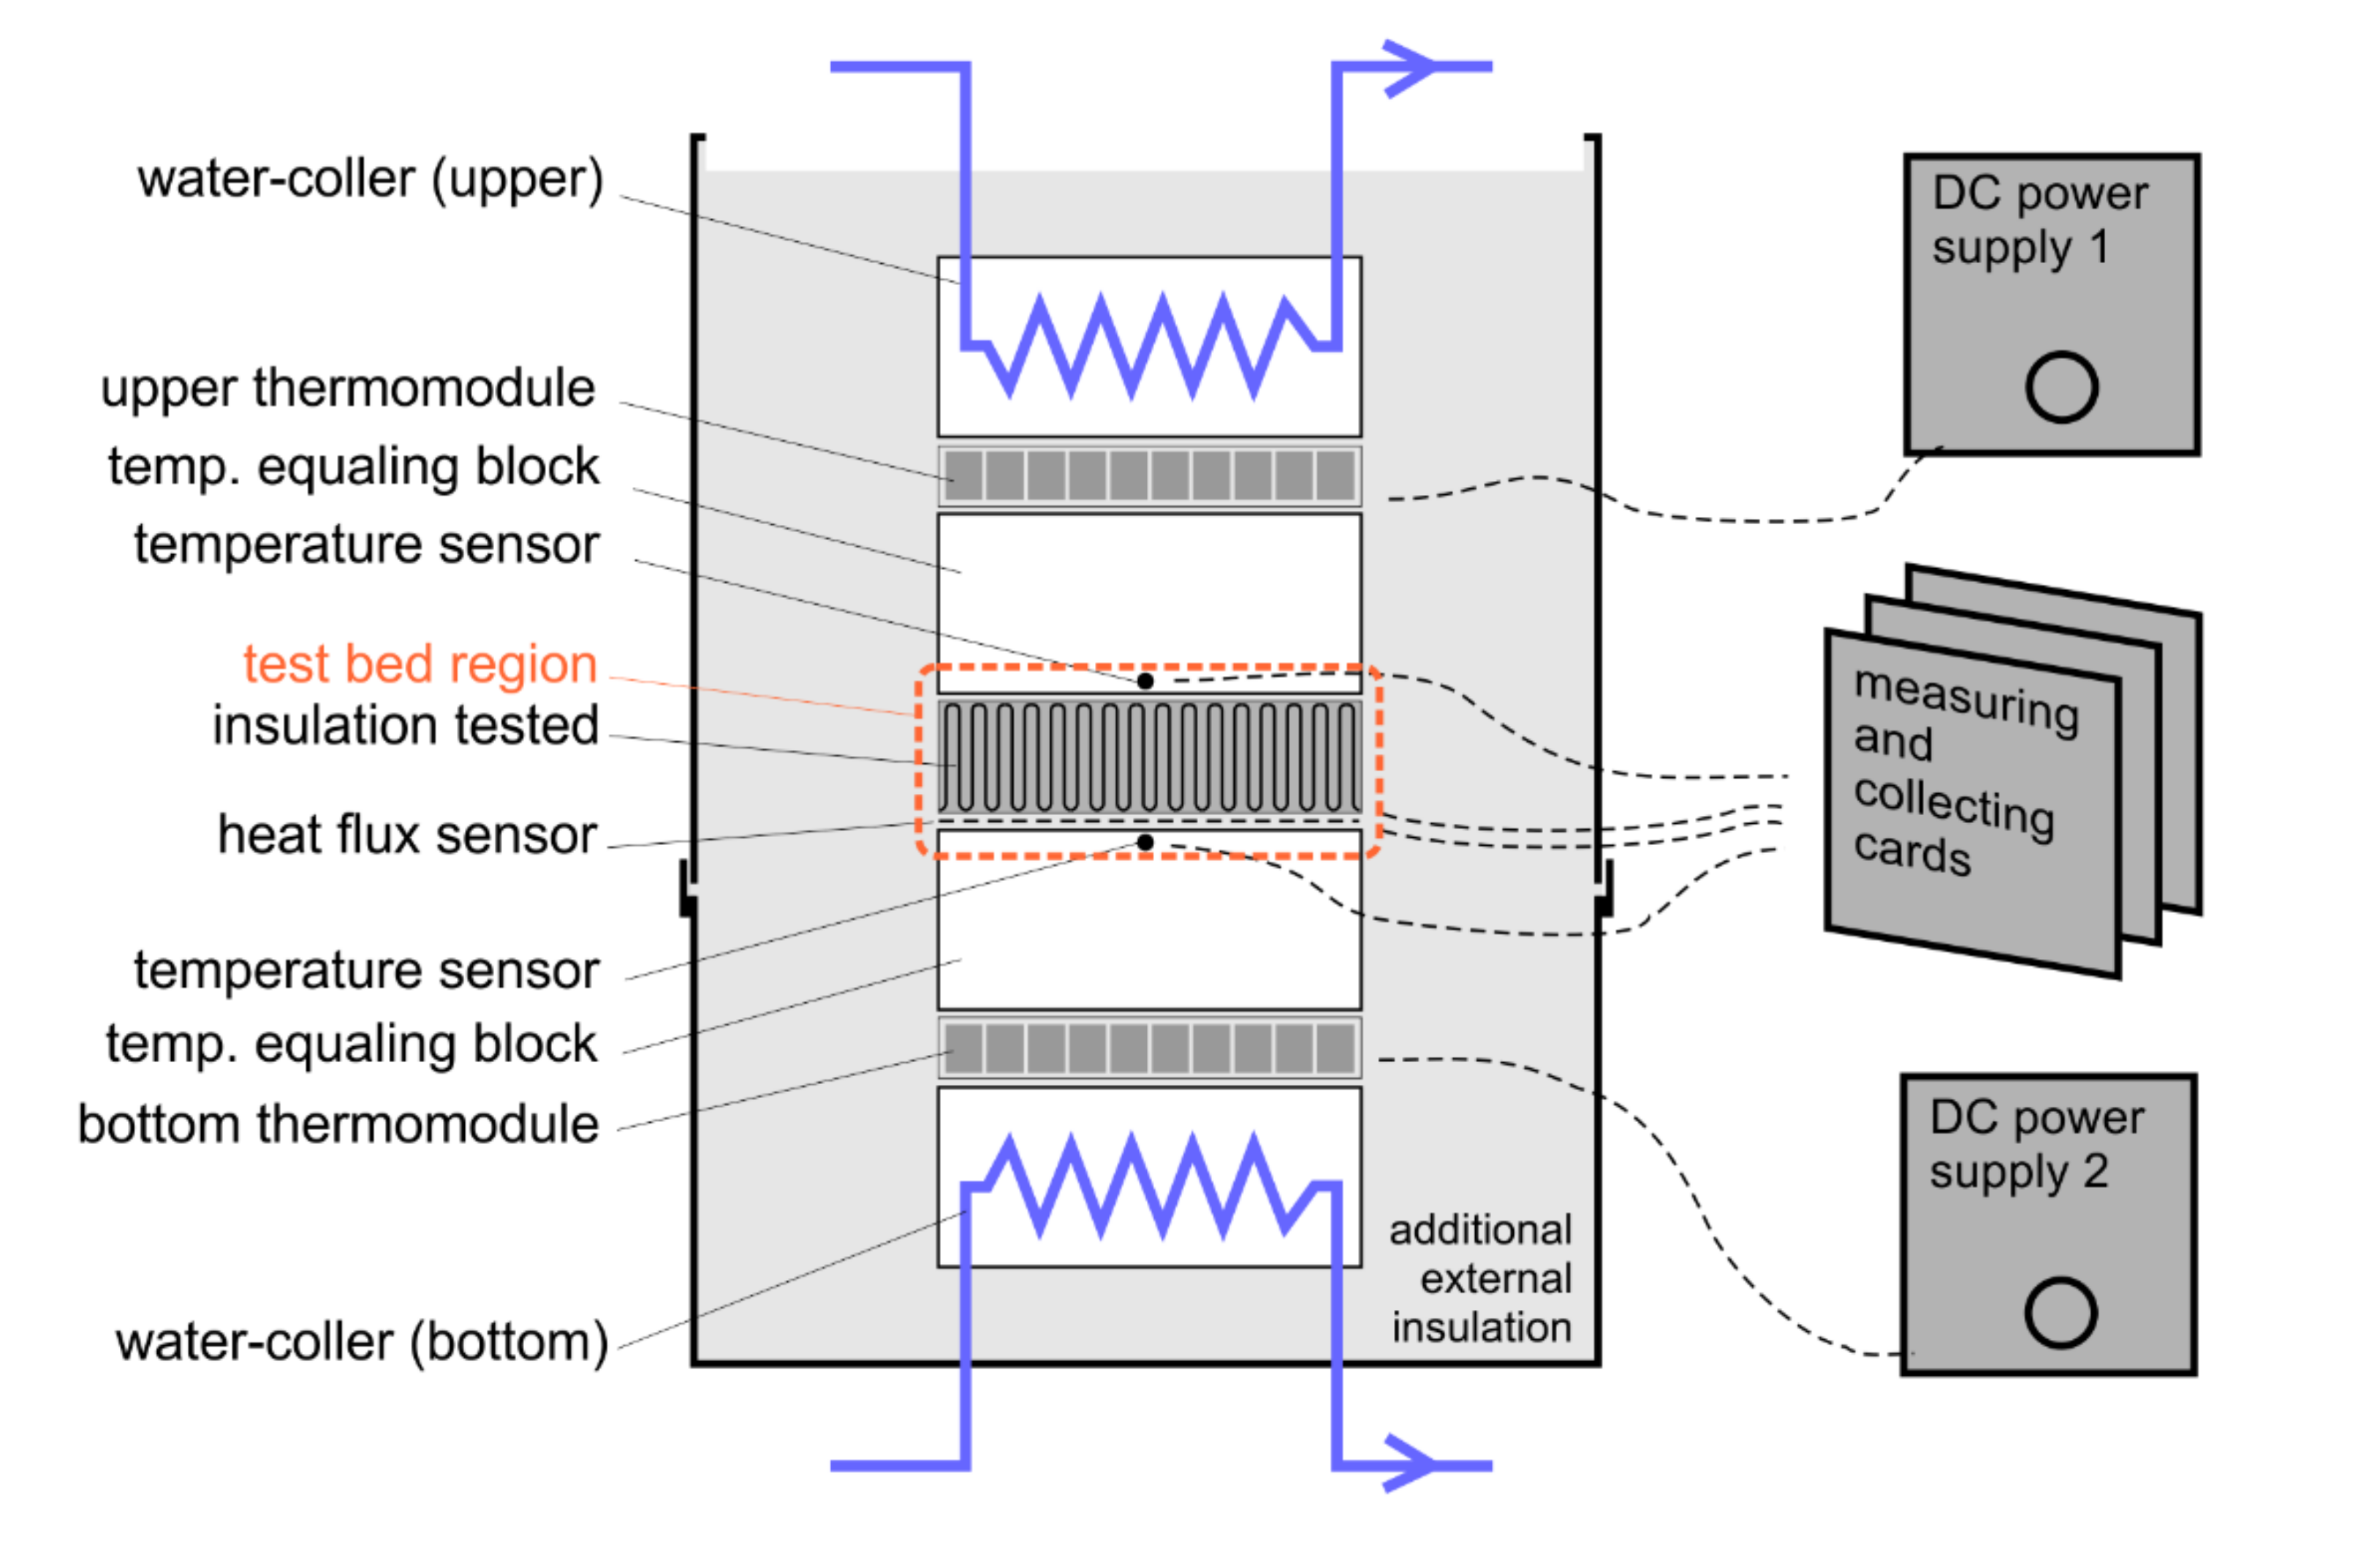
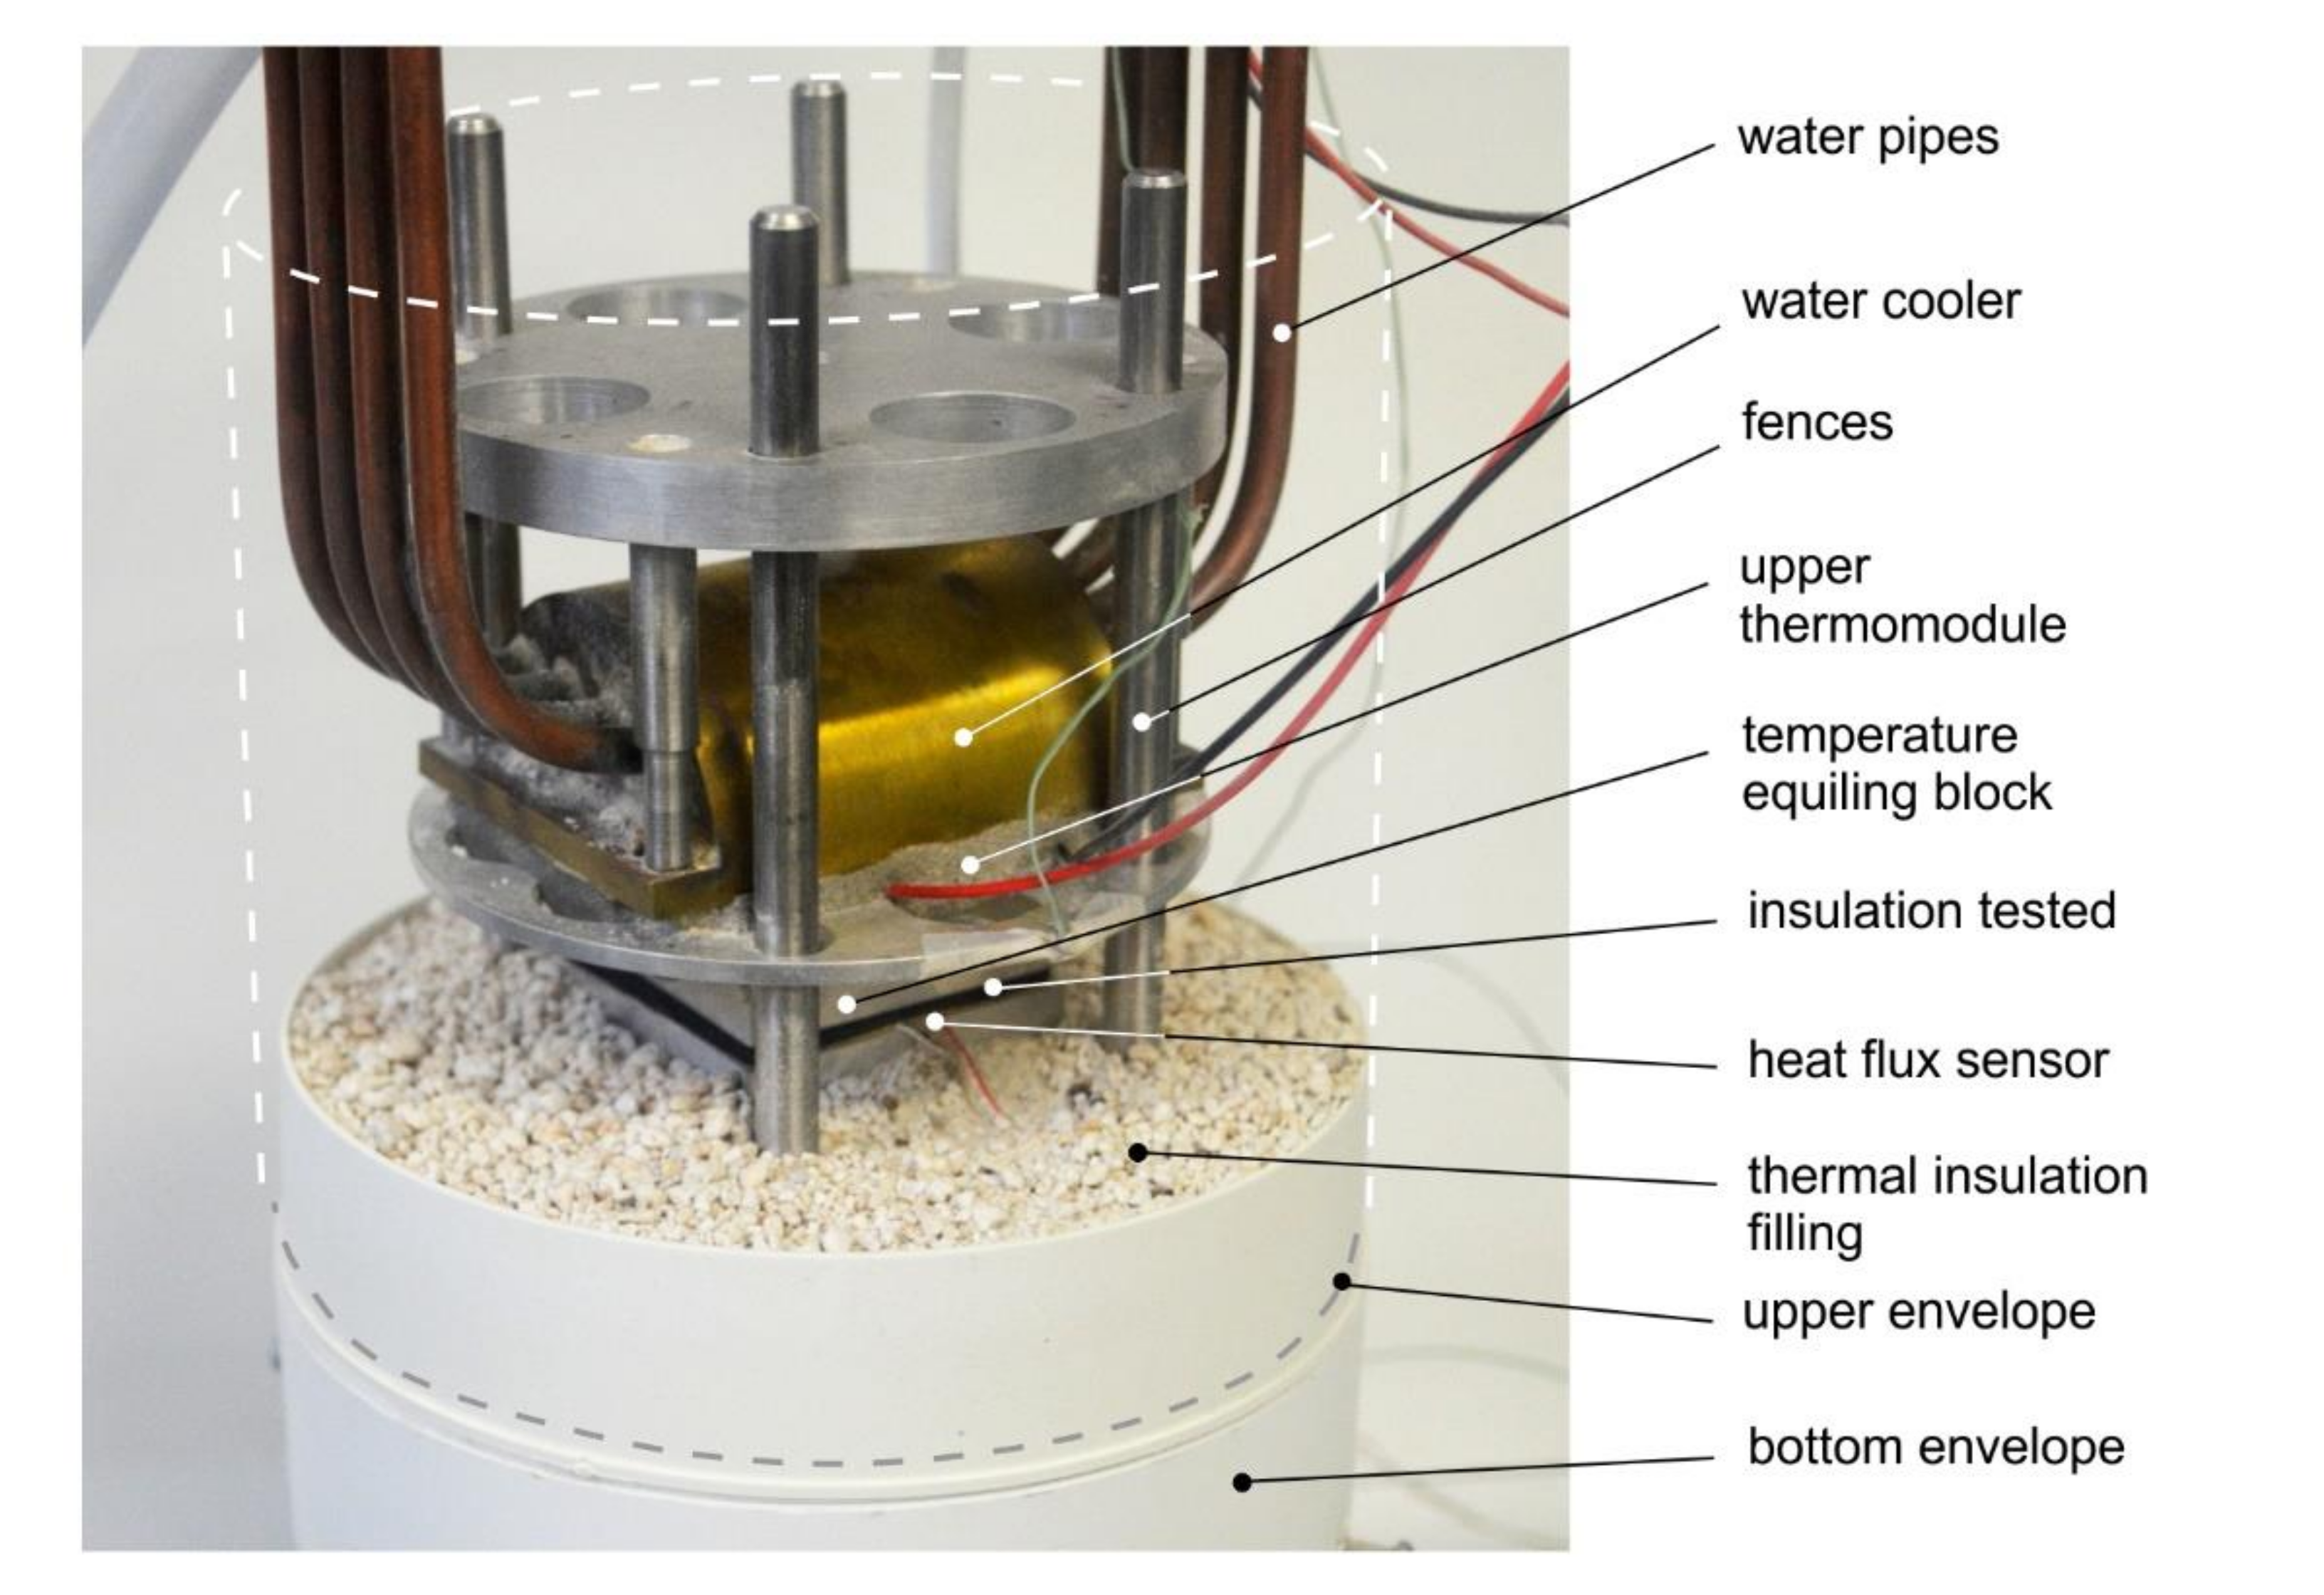
2.4. Experiments
- (a)
- heated at the top mode,
- (b)
- heated at the bottom mode.
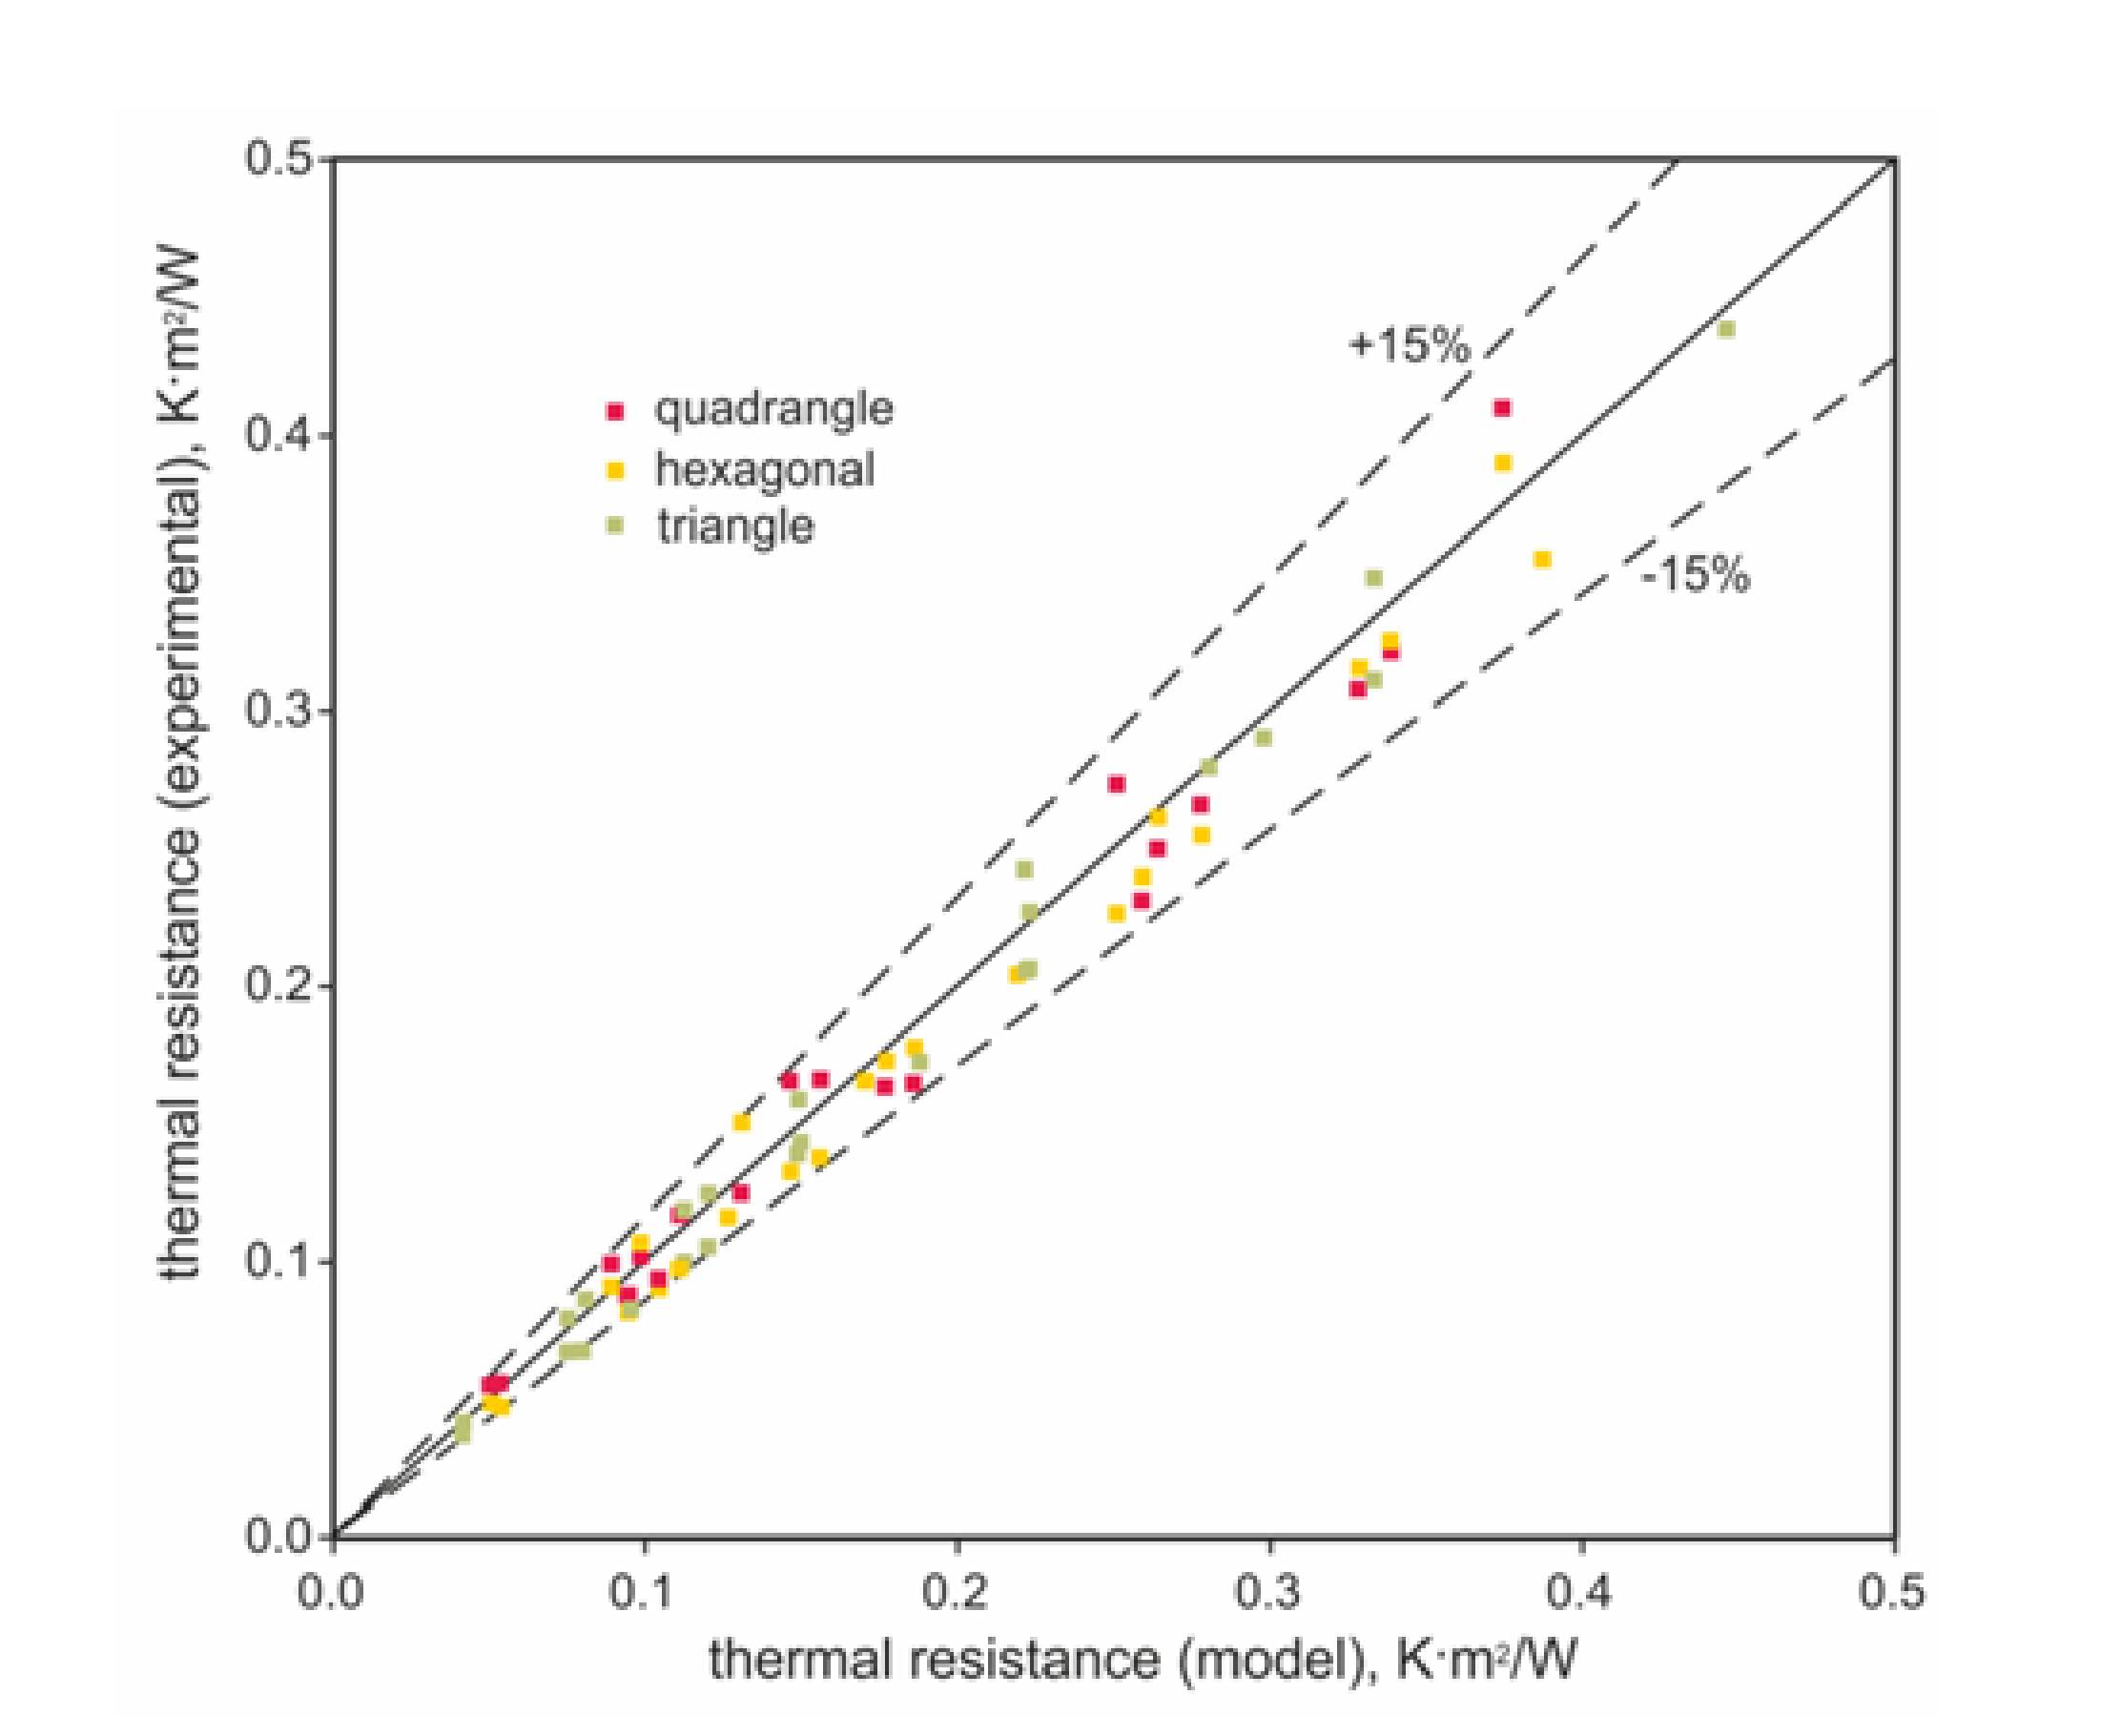
3. Results
4. Discussion
5. Conclusions
Author Contributions
Funding
Conflicts of Interest
Abbreviations
| A | area of heat transfer, m2 |
| D | dimension of structure closure, m |
| H | multilayer insulation thickness, m |
| K | thermal conductivity, W/(m·K) |
| L | wall length, m |
| R | thermal resistance, m2·K/W |
| T | temperature, K |
| q | heat flux, W/m2 |
| Greek symbols | |
| δ | plastic wall thickness, m |
| ε | emissivity of plastic material |
| σ | Stefan–Boltzmann constant |
| Subscripts | |
| a | air |
| C | cooled side |
| c | convection |
| H | heated side |
| HB | heated at the bottom |
| HT | heated at the top |
| i | insulation |
| L | related to walls that have length L |
| n | number of layers |
| p | plastic |
| r | radiation |
| w | wall |
References
- Hasanzadeh, R.; Azdast, T.; Doniavi, A.; Eungkee, L.R. Thermal Conductivity of Low Density Polyethylene Foams Part I: Comprehensive Study of Theoretical Models. J. Therm. Sci. 2019, 28, 745–754. [Google Scholar]
- Hasanzadeh, R.; Azdast, T.; Doniavi, A. Thermal Conductivity of Low-Density Polyethylene Foams Part II: Deep Investigation using Response Surface Methodology. J. Therm. Sci. 2020, 29, 159–168. [Google Scholar] [CrossRef]
- Park, S.; Song, S.-Y. Evaluation of Alternatives for Improving the Thermal Resistance of Window Glazing Edges. Energies 2019, 12, 244. [Google Scholar] [CrossRef] [Green Version]
- Gustavsen, A.; Arasteh, D.; Jelle, B.P.; Curcija, C.; Kohler, C. Developing Low-conductance Window Frames: Capabilities and Limitations of Current Window Heat Transfer Design Tools—State-of-the-Art Review. J. Build. Phys. 2008, 2, 32. [Google Scholar] [CrossRef] [Green Version]
- Canessa, E.; Fonda, C.; Zennaro, M. Low Cost 3-D Printing for Science, Education & Sustainable Development; ICTP: Trieste, Italy, 2013. [Google Scholar]
- Ligon, S.C.; Liska, R.; Stampfl, J.; Gurr, M.; Muülhaupt, R. Polymers for 3D Printing and Customized Additive. Manufacturing 2017, 117, 10212–10290. [Google Scholar]
- Yazdani Sarvestani, H.; Akbarzadeh, A.H.; Niknam, H.; Hermenean, K. 3D printed architected polymeric sandwich panels: Energy absorption and structural performance. Compos. Struct. 2018, 200, 886–909. [Google Scholar] [CrossRef]
- Tyczyński, P.; Siemiatkowski, Z.; Bąk, P.; Warzocha, K.; Rucki, M.; Szumiata, T. Performance of Maraging Steel Sleeves Produced by SLM with Subsequent Age Hardening. Materials 2020, 13, 3408. [Google Scholar] [CrossRef]
- Zhang, D.; Dong, Q. Fracturing and Damage of 3D-Printed Materials with Two Intermittent Fissures under Compression. Materials 2020, 13, 1607. [Google Scholar] [CrossRef] [Green Version]
- Park, S.A.; Lee, S.H.; Kim, W.D. Fabrication of porous polycaprolactone-hydroxyapatite (PCLHA) blend scaffolds using a 3D plotting system for bone tissue engineering. Bioprocess. Biosyst. Eng. 2011, 34, 505–513. [Google Scholar] [CrossRef]
- Little, J.P.; Horn, T.J.; Marcellin-Little, D.J.; Harrysson, O.L.A.; West, H.A., II. Development and validation of a canine radius replica for mechanical testing of orthopedic implants. Am. J. Vet. Res. 2012, 73, 27–33. [Google Scholar] [CrossRef]
- Tarafder, S.; Balla, V.K.; Davies, N.M.; Bandyopadhyay, A.; Bose, S. Microwave-sintered 3D printed tricalcium phosphate scaffolds for bone tissue engineering. J. Tissue Eng. Regen. Med. 2013, 7, 631–641. [Google Scholar] [CrossRef] [PubMed]
- Honiball, J.R. The Application of 3D Printing in Reconstructive Surgery. Master’s Thesis, University of Stellenbosch, Stellenbosch, South Africa, 2010. [Google Scholar]
- Tarfaoui, M.; Nachtane, M.; Goda, I.; Qureshi, Y.; Benyahia, H. 3D Printing to Support the Shortage in Personal Protective Equipment Caused by COVID-19 Pandemic. Materials 2020, 13, 3339. [Google Scholar] [CrossRef]
- Grabowska, B.; Kasperski, J. Modeling of thermal properties of thermal insulation layered with transparent, opaque and reflective film. J. Therm. Sci. 2018, 27, 463–469. [Google Scholar] [CrossRef]
- Wadley, H.N. Multifunctional periodic cellular metals. Phil. Trans. R. Soc. A 2006, 364, 31–68. [Google Scholar] [CrossRef]
- Petras, A.; Sutcliffe, M. Failure mode maps for honeycomb sandwich panels. Compos. Struct. 1999, 44, 237–252. [Google Scholar] [CrossRef]
- Rathbun, H.; Radford, D.D.; Xue, Z.; He, M.Y.; Yang, J.; Deshpande, V.; Fleck, N.A.; Hutchinson, J.W.; Zok, F.W.; Evans, A.G. Performance of metallic honeycomb-core sandwich beams under shock loading. Int. J. Solids Struct. 2006, 43, 1746–1763. [Google Scholar] [CrossRef] [Green Version]
- Buitrago, B.L.; Santiuste, C.; Sanchez-Saez, S.; Barbero, E. Modelling of composite sandwich structures with honeycomb core subjected to high- velocity impact. Compos. Struct. 2010, 92, 2090–2096. [Google Scholar] [CrossRef] [Green Version]
- Masters, I.; Evans, K. Models for the elastic deformation of honeycombs. Compos. Struct. 1996, 35, 403–422. [Google Scholar] [CrossRef]
- Meraghni, F.; Desrumaux, F.; Benzeggagh, M. Mechanical behaviour of cellular core for structural sandwich panels. Compos. A Appl. Sci. Manuf. 1999, 30, 767–779. [Google Scholar] [CrossRef]
- Becker, W. Closed-form analysis of the thickness effect of regular honeycomb core material. Compos. Struct. 2000, 48, 67–70. [Google Scholar] [CrossRef]
- Schaedler, T.A.; Carter, W.B. Architected cellular materials. Annu. Rev. Mater. Res. 2016, 46, 187–210. [Google Scholar] [CrossRef]
- Bitzer, T. Honeycomb Technology: Materials, Design, Manufacturing, Applications and Testing; Springer Science & Business Media: Dordrecht, The Netherlands, 2012. [Google Scholar]
- Abueidda, D.W.; Elhebeary, M.; Shiang, C.-S.; Pang, S.; Abu Al-Rub, R.K.; Jasiuk, I.M. Mechanical properties of 3D printed polymeric Gyroid cellular structures: Experimental and finite element study. Mater. Des. 2019, 165, 107597. [Google Scholar] [CrossRef]
- Kinstlinger, I.S.; Bastian, A.; Paulsen, S.J.; Hwang, D.H.; Ta, A.H.; Yalacki, D.R.; Schmidt, T.; Miller, J.S. Open-Source Selective Laser Sintering (OpenSLS) of Nylon and Biocompatible Polycaprolactone. PLoS ONE 2016, 2, 3. [Google Scholar] [CrossRef] [PubMed] [Green Version]
- Pelanconi, M.; Barbatoa, M.; Zavattoni, S.; Vignoles, G.L.; Ortona, A. Thermal design, optimization and additive manufacturing of ceramic regular structures to maximize the radiative heat transfer. Mater. Des. 2019, 163, 107539. [Google Scholar] [CrossRef]
- Gosselin, C.; Duballet, R.; Roux, P.; Gaudillière, N.; Dirrenberger, J.; Morel, P. Large-scale 3D printing of ultra-high performance concrete—a new processing route for architects and builders. HAL 2016, 100, 102–109. [Google Scholar] [CrossRef] [Green Version]
- Kasperski, J.; Grabowska, B. Optimizing the thermal effectiveness of an insulation wrap with internal folded polypropylene film for the transportation of frozen food. Int. J. Refrig. 2016, 67, 1–21. [Google Scholar] [CrossRef]
- Kasperski, J.; Grabowska, B. Effect of plastic film transmittance on heat transfer of a multi-layer structure made of rectangular air cells. Int. J. Refrig. 2018, 92, 1–21. [Google Scholar] [CrossRef]
- Roshenow, W.M.; Hartnett, J.P.; Cho, Y.I. Handbook of Heat Transfer; McGraw-Hill Education: New York, NY, USA, 1998. [Google Scholar]


| Structure | Quadrangle | Hexagonal | Triangle | |||||||||||
|---|---|---|---|---|---|---|---|---|---|---|---|---|---|---|
| Number of layers | Dimension of closure, mm | Dimension of closure, mm | Dimension of closure, mm | |||||||||||
| 4 | 6 | 8 | 10 | 4 | 6 | 8 | 10 | 4 | 6 | 8 | 10 | |||
| Thermal resistance, m2K/W | Thermal resistance, m2K/W | Thermal resistance, m2K/W | ||||||||||||
| Heated at the top | Model | 1 | 0.050 | 0.090 | 0.131 | 0.171 | 0.050 | 0.090 | 0.131 | 0.171 | 0.039 | 0.072 | 0.108 | 0.144 |
| 2 | 0.099 | 0.178 | 0.260 | 0.340 | 0.099 | 0.178 | 0.260 | 0.340 | 0.076 | 0.141 | 0.213 | 0.287 | ||
| 3 | 0.147 | 0.265 | 0.389 | 0.509 | 0.147 | 0.265 | 0.389 | 0.509 | 0.113 | 0.210 | 0.318 | 0.429 | ||
| Experimental | 1 | 0.055 | 0.099 | 0.125 | 0.165 | 0.048 | 0.091 | 0.151 | 0.166 | 0.042 | 0.079 | 0.118 | 0.143 | |
| 2 | 0.102 | 0.163 | 0.230 | 0.320 | 0.106 | 0.172 | 0.238 | 0.324 | 0.086 | 0.158 | 0.226 | 0.289 | ||
| 3 | 0.166 | 0.248 | 0.354 | 0.470 | 0.132 | 0.260 | 0.354 | 0.476 | 0.124 | 0.242 | 0.310 | 0.437 | ||
| Discrepancies *, % | 1 | −8 | −9 | 5 | 4 | 5 | −1 | −13 | 3 | −7 | −10 | −9 | 1 | |
| 2 | −3 | 9 | 13 | 6 | −7 | 3 | 9 | 5 | −12 | −11 | −6 | −1 | ||
| 3 | −12 | 7 | 10 | 8 | 11 | 2 | 10 | 7 | −9 | −13 | 3 | −2 | ||
| Heated at the bottom | Model | 1 | 0.050 | 0.090 | 0.108 | 0.124 | 0.050 | 0.090 | 0.108 | 0.124 | 0.039 | 0.072 | 0.091 | 0.109 |
| 2 | 0.099 | 0.178 | 0.213 | 0.245 | 0.099 | 0.178 | 0.213 | 0.245 | 0.076 | 0.141 | 0.181 | 0.217 | ||
| 3 | 0.147 | 0.265 | 0.319 | 0.367 | 0.147 | 0.265 | 0.319 | 0.367 | 0.113 | 0.210 | 0.270 | 0.324 | ||
| Experimental | 1 | 0.056 | 0.087 | 0.116 | 0.116 | 0.047 | 0.078 | 0.097 | 0.116 | 0.036 | 0.067 | 0.082 | 0.099 | |
| 2 | 0.090 | 0.164 | 0.202 | 0.272 | 0.087 | 0.177 | 0.203 | 0.226 | 0.067 | 0.138 | 0.171 | 0.205 | ||
| 3 | 0.165 | 0.265 | 0.306 | 0.408 | 0.136 | 0.253 | 0.314 | 0.388 | 0.098 | 0.205 | 0.278 | 0.347 | ||
| Discrepancies *, % | 1 | −10 | 3 | −8 | 7 | 7 | 15 | 10 | 7 | 7 | 7 | 11 | 10 | |
| 2 | 10 | 8 | 5 | −10 | 14 | 0 | 5 | 9 | 13 | 2 | 6 | 6 | ||
| 3 | −11 | 0 | 4 | −10 | 8 | 5 | 1 | −6 | 15 | 3 | −3 | −7 | ||
| Structure | Quadrangle and Hexagonal | Triangle | |||||||||
|---|---|---|---|---|---|---|---|---|---|---|---|
| Number of | Dimension of closure, mm | Dimension of closure, mm | |||||||||
| layers | 4 | 5 | 6 | 8 | 10 | 4 | 5 | 6 | 8 | 10 | |
| Thermal resistance, m2K/W | Thermal resistance, m2K/W | ||||||||||
| Heated at the top | 1 | 0.050 | 0.070 | 0.090 | 0.131 | 0.171 | 0.039 | 0.055 | 0.072 | 0.108 | 0.144 |
| 2 | 0.099 | 0.137 | 0.178 | 0.260 | 0.340 | 0.076 | 0.107 | 0.141 | 0.213 | 0.287 | |
| 5 | 0.244 | 0.340 | 0.441 | 0.647 | 0.848 | 0.186 | 0.264 | 0.349 | 0.529 | 0.713 | |
| 10 | 0.485 | 0.677 | 0.880 | 1.292 | 1.693 | 0.370 | 0.526 | 0.696 | 1.056 | 1.424 | |
| Heated at the bottom | 1 | 0.050 | 0.070 | 0.090 | 0.108 | 0.124 | 0.039 | 0.055 | 0.072 | 0.091 | 0.109 |
| 2 | 0.099 | 0.137 | 0.178 | 0.213 | 0.245 | 0.076 | 0.107 | 0.141 | 0.181 | 0.217 | |
| 5 | 0.244 | 0.340 | 0.441 | 0.529 | 0.610 | 0.186 | 0.264 | 0.349 | 0.449 | 0.538 | |
| 10 | 0.485 | 0.677 | 0.880 | 1.057 | 1.218 | 0.370 | 0.526 | 0.696 | 0.895 | 1.074 | |
| Density, kg/m3 | Density, kg/m3 | ||||||||||
| Density | 1 | 580.5 | 464.4 | 387.0 | 290.3 | 232.2 | 725.6 | 580.5 | 483.8 | 362.8 | 290.3 |
| 2 | 507.9 | 406.4 | 338.6 | 254.0 | 203.2 | 653.1 | 522.5 | 435.4 | 326.5 | 261.2 | |
| 5 | 464.4 | 371.5 | 309.6 | 232.2 | 185.8 | 609.5 | 487.6 | 406.4 | 304.8 | 243.8 | |
| 10 | 449.9 | 359.9 | 299.9 | 224.9 | 180.0 | 595.0 | 476.0 | 396.7 | 297.5 | 238.0 | |
© 2020 by the authors. Licensee MDPI, Basel, Switzerland. This article is an open access article distributed under the terms and conditions of the Creative Commons Attribution (CC BY) license (http://creativecommons.org/licenses/by/4.0/).
Share and Cite
Grabowska, B.; Kasperski, J. The Thermal Conductivity of 3D Printed Plastic Insulation Materials—The Effect of Optimizing the Regular Structure of Closures. Materials 2020, 13, 4400. https://doi.org/10.3390/ma13194400
Grabowska B, Kasperski J. The Thermal Conductivity of 3D Printed Plastic Insulation Materials—The Effect of Optimizing the Regular Structure of Closures. Materials. 2020; 13(19):4400. https://doi.org/10.3390/ma13194400
Chicago/Turabian StyleGrabowska, Beata, and Jacek Kasperski. 2020. "The Thermal Conductivity of 3D Printed Plastic Insulation Materials—The Effect of Optimizing the Regular Structure of Closures" Materials 13, no. 19: 4400. https://doi.org/10.3390/ma13194400