1. Introduction
The direct carbon fuel cell (DCFC) is a power generation device converting the chemical energy of carbon directly into electricity by electrochemical oxidation of the fuel. The basic structure of DCFC is similar to other cell types, such as Molten Carbonate Fuel Cell (MCFC) or Solid Oxide Fuel Cell (SOFC). However, in the DCFC, solid carbonaceous fuels (e.g., hard coals, brown coals, charred biomass, active carbons, carbon black, graphite, coke, etc.) are used and directly oxidized at the anode surface, and no gaseous fuels (e.g., H2 or CO) are required, as in the case of MCFC or SOFC.
Compared to other technologies, the solid carbon-fueled fuel cells have several unique features and advantages [
1], offering higher thermodynamic efficiency and lower emission of carbon dioxide per unit of the generated electricity. Furthermore, the fuel for the DCFC does not require any sophisticated preparation, since the solid carbon can be easily obtained from various resources [
1,
2] such as coal, petroleum coke, charred biomass (e.g., grass, woods, nut shells, corn husks), or even organic garbage. There are four basic types of direct carbon fuel cells under development, which generally differ with respect to electrolyte types, which can be either molten carbonates [
3,
4], solid oxygen ion conducting ceramics [
5,
6,
7,
8], or aqueous [
9] or molten hydroxides [
10]. Composite electrolytes (so-called hybrid electrolytes) are also widely used in DCFC prototypes [
11,
12,
13].
The molten hydroxide Direct Carbon Fuel Cell (MH-DCFC) is considered to be the most promising type of DCFC, due to its advantages [
10], such as high ionic conductivity, the higher electrochemical activity of carbon (higher anodic oxidation rate and lower overpotentials) and higher efficiency of carbon oxidation due to the lower operating temperature (the dominant product of carbon oxidation is CO
2 vs. CO). Accordingly, the MH-DCFC can be operated at lower temperatures (roughly 673–873 K), and thus cheaper materials can be used to manufacture the cell components.
MH-DCFCs are still under development, due to several fundamental and technological challenges, such as improvement of anode design in order to increase solid fuel reactive sites and reduce the cell cost, as well as maintaining cell operation at low temperatures, investigating carbon fuel characteristics and the required level of fuel pre-processing to maximize reactivity, providing a method for supplying solid carbonaceous fuels to the electrode/electrolyte interface, understanding the long-term effects of residual impurities in carbon-based fuels, technology scale-up, etc. Due to the strong corrosive behavior of the molten hydroxide electrolyte, the selection of materials resistant to that environment is also very important.
The corrosion processes of the cell elements accompanying the processes taking place on the MH-DCFC electrodes reduce the main electrical parameters, such as current and power density (both activation overpotential and ohmic polarization are increased). Moreover, substances generated as a result of these corrosive processes may contaminate the electrolyte and the surface of the carbon particles, which may cause an undesirable reduction in the redox reactions rate, resulting in an increase in the activation overpotential and concentration polarization.
The chemical reactions in the molten hydroxides cause corrosive processes in metals and alloys that are in contact with the electrolyte. From the point of view of the electrochemical corrosion, it is important to determine the durability of metals and their alloys due to the oxidizing properties of the corrosive environment. In the case of molten hydroxides, the corrosive effect is primarily determined by the type of hydroxide (NaOH, KOH, LiOH), temperature and the ability to dissolve oxygen.
Table 1 summarizes the corrosion rates of selected, generally available materials in a molten NaOH environment. The results relate to corrosion tests carried out at the operating temperature of the MH-DCFC (673 ÷ 773 K) and higher, i.e., from 853 K to 973 K. The tests were carried out by immersing the samples in molten hydroxide, and then measuring their weight changes over time. The corrosion rate was determined in mm year
−1.
Analysis of the data contained in
Table 1 indicates that nickel and its alloys—Monel 600, Monel 500, Inconel—show the highest corrosion resistance. Nickel-based alloys (3% Ni-Fe alloy) are also characterized by moderate corrosion resistance. It can also be seen that the corrosion rate increases as the temperature increases. Under the examined conditions, 301SS steel turned out to be attractive, both in economic terms as well as in terms of corrosion resistance. Austenitic steels, despite expensive alloying additions, do not show satisfactory corrosion resistance in molten NaOH. Corrosion rates comparable to those of austenitic steels were obtained for copper. At a temperature of approximately 773 K, the corrosion rate of copper was 17.2 mm year
−1, and the corrosion rate of austenitic steel ranged from 11.8 to 24.4 mm year
−1.
Considering the data summarized in
Table 1, it appears that a number of construction materials can be used to manufacture the elements of direct carbon fuel cells with anode, cathode, electrolyte container, which are used in molten hydroxide electrolyte. Metals and alloys commonly used in MH-DCFC include carbon steel, stainless steel, nickel and high-nickel alloys [
10]. All of these alloys have been selected, among others, to investigate directly in order to determine the material most suitable for target cell components construction in MH-DCFC [
17].
Carbon steel (iron) is the predominant construction material used in the first generations of MH-DCFC [
18,
19,
20]; therefore, it was used by the authors to build the first prototype of the fuel cell [
17].
Austenitic stainless steel (SS) 300 series (i.e., SS 304L, SS 316L) was chosen to build the second prototype of MH-DCFC. 304 and 316 stainless steels are among the most commonly used types of stainless-steel materials in many applications. Type 304L and 316L SS are extra low-carbon variations of type 304 and 316 SS (e.g., max. carbon content for 304 SS is 0.08% and for the 304L SS max. carbon level is 0.030%). All other element ranges are essentially the same (the nickel range for 304 is 8.00–10.50%, and for 304L it is 8.00–12.00%). The lower carbon SS grades (304L and 316L) overcome the risk of intercrystalline corrosion. This can take place if the steel is held in a temperature range of 723 K to 1123 K for periods of several minutes, depending on the temperature, and is subsequently exposed to aggressive corrosive environments. Corrosion then takes place along the grain boundaries. If the carbon content is below 0.030%, then this intercrystalline corrosion does not take place following exposure to such temperatures. In general, 316L alloy is more corrosion resistant than type 304 stainless steels [
21].
The third MH-DCFC prototype was manufactured from nickel and high-nickel alloys. Commercially pure nickel grades (Nickel 200 and 201) are used in a wide range of fields, such as in the aerospace and chemical industries (including hydroxide services) due to their high corrosion resistance. Nickel 201 is better suited in situations where high temperatures are applied, due to its lower carbon content [
22,
23]. However, nickel is rapidly oxidized in situ to NiO, which is a p-type semiconductor. The high corrosion resistance of Ni-based alloy Inconel 600 in molten alkaline solution of NaOH was attributed by Tran et al. [
24] to the passive film of Ni–Cr spinel-type oxide which protects and prevents the leaching of Cr as chromite and chromate from the alloy.
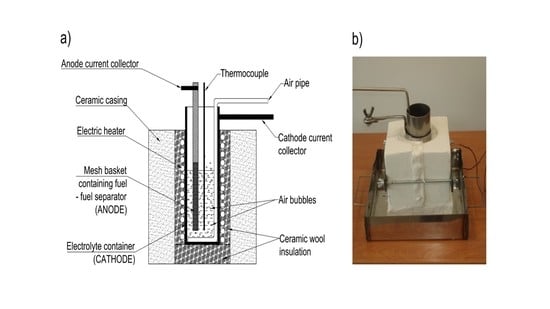
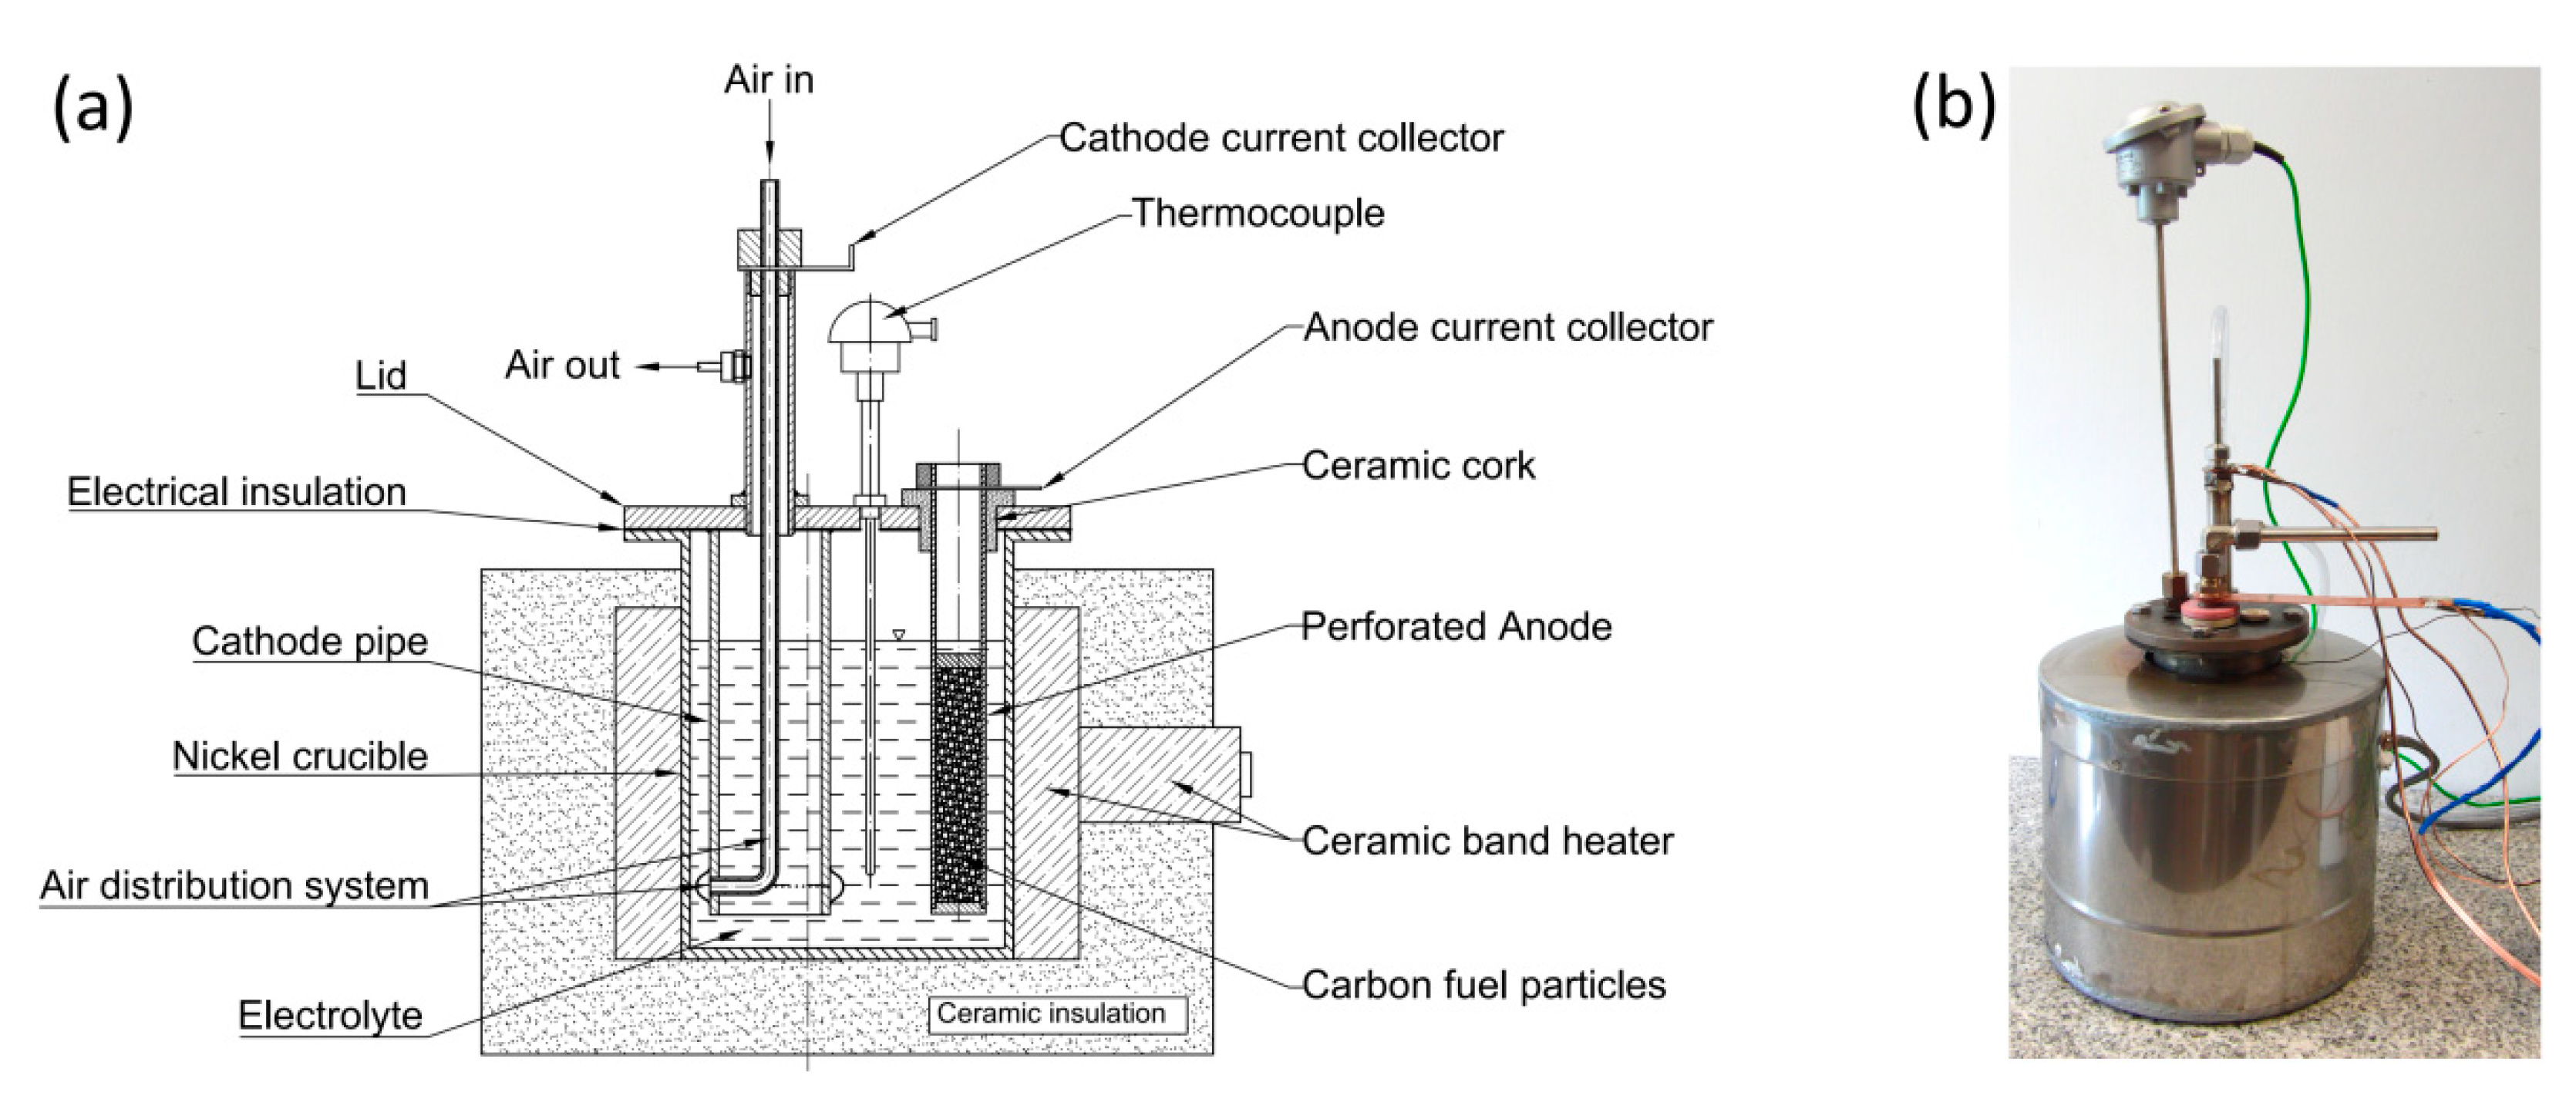
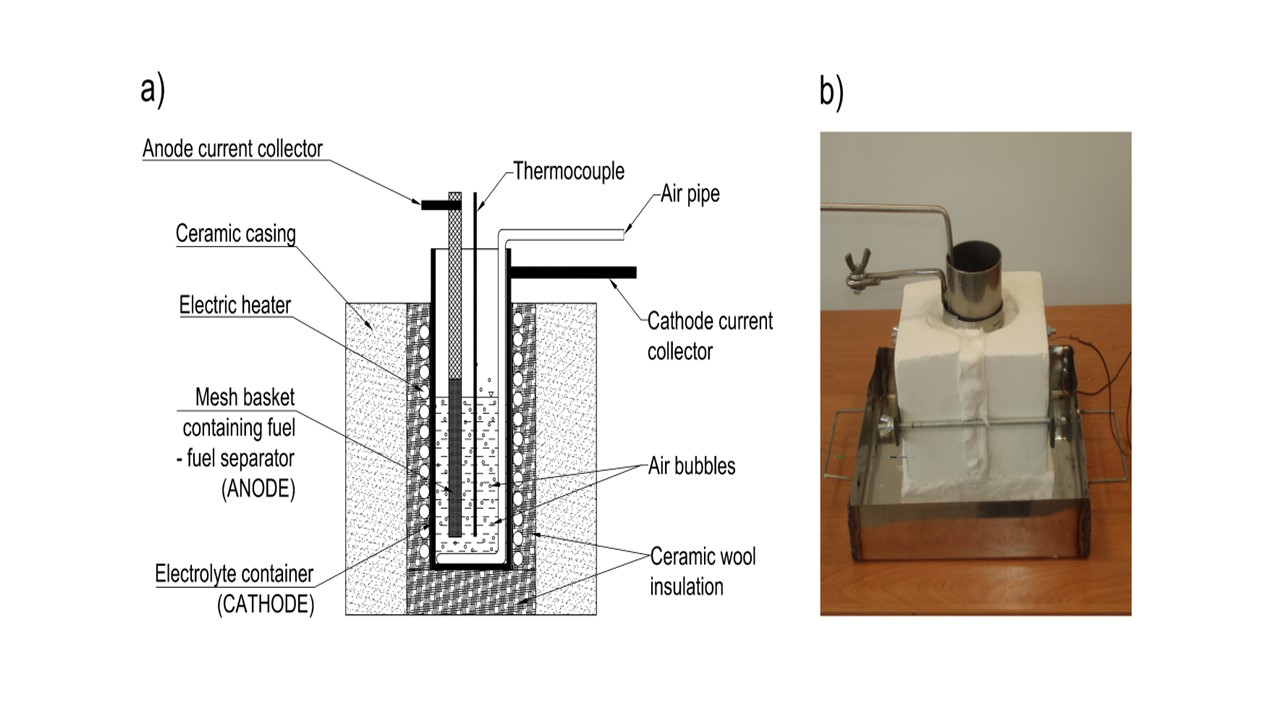
The present work illustrates the construction and performance of a DCFC with hydroxide electrolyte. Three generations of MH-DCFC prototypes were built and tested in order to determine the influence of the molten hydroxides environment on the cell performance characteristics and durability of used materials such as carbon steel, stainless steels or nickel and its alloys.
3. Results
3.1. Model I
The variations of the cell voltage plotted against time for the current I = 0 A (open circuit voltage—OCV) are shown in
Figure 12a, and the relationships between cell voltage, power density, and current density (performance characteristics; polarization curves) for a commercial biochar and graphite are plotted in
Figure 12b. Performance characteristics were determined after 3 h of cell operation without external load.
As indicated by the results presented in
Figure 12a, the OCV values increased slowly until they reached a stable plateau after roughly 1 h and then remained quite stable. The differences between the OCV values, particularly at the initial period of cell operation, were probably brought about by gradual wetting of the inner surface of the fuel (biochar particles and graphite electrode surface) by liquid molten electrolyte [
31]. The OCV values measured by digital multimeter after 3 h of operation were 1.075 V and 0.852 V for biochar and graphite, respectively.
The voltage–current density characteristics (
Figure 12b) show that the limiting current condition is reached nearly 7.77 mA cm
−2 with biochar as a fuel and 4.2 mA cm
−2 for graphite, while the maximum values of power density were respectively: 5.1 mW cm
−2 and 2.5 mW cm
−2.
The differences in cell operation, associated with a particular fuel, are probably the effect of the fuel specific surface area (and thus the reaction kinetics), or are brought about by so-called crystallographic disorders (crystal structure disorder). Compared with graphite, the structure of biochar is in a more disordered form. The reactivity of disordered carbon is much higher than that of the graphitic carbon because the disordered carbon contains many more edge sites as well as various types of defects that are more reactive than crystalline sites.
Polarization is caused by chemical and physical factors associated with various elements of the fuel cell. These factors limit the reaction processes when current is flowing. The current–voltage characteristics shape (
Figure 12b) depends on many factors, but in general it can be seen that both curves were dominated by the ohmic polarization (middle region of the polarization curves) related to the resistances of the electrolyte and electrodes. In both cases, regions related to concentration polarization (end regions of the characteristics) are also noticeable. However, only graphite was characterized by a clear region associated with activation losses (occur at low currents), which may be related to its lower reactivity compared to biochar.
During the analysis of the fuel cell operation, progressive corrosion of carbon steel and the presence of corrosion products in the electrolyte were observed. The formation of non-conductive oxide layers on the surface of the crucible (cathode) and separator (anode) could have a major impact on the concentration polarization. Even if mass transport (supply of substrates and removal of products to and from the surface of the electrodes) was fast enough, as a result of the formation of oxide layers, it was difficult to transfer the electric charge. In addition, in the case of a solid graphite electrode, its surface was covered with a layer of corrosion products, which probably limited the transport of hydroxyl ions to reaction zones. The described processes probably had the greatest impact on the high value of the internal resistance of the cell, which in the case of graphite was 2.19 Ω, while for charcoal it was 1.69 Ω.
The second stage of the research was to carry out the long-term test for Model I. In this case, biochar was used as fuel (0.5 g). The cell worked under a load of 20 Ω, which corresponded to the maximum power obtained during determination of cell performance characteristics. The voltage and current values determined during the long-term experiment are plotted in
Figure 13.
The fuel cell, after working for 27 h, reached a final voltage of about 0.09 V. It can also be seen that the current intensity, despite the progressive voltage drop, maintained a value in the range of 10 to 18 mA throughout the entire duration of the test. Strong corrosion of the cell construction materials was found after the test, which can be seen in the pictures in
Figure 14. In addition, the electrolyte had a dark brown color, indicating the penetration of corrosion products into it. The production of non-conductive oxide layers on the cell elements, in particular on the crucible (cathode) and separator (anode) surfaces, could have an impact on the observed voltage and current fluctuations. Since the current did not decrease over time, as was the case for voltage, and after the experiment a biochar weight loss of only 0.12 g (24% compared to the initial mass) was found, it can be concluded that the voltage drop at the electrodes of the cell was caused by progressive corrosion.
Carbon steel, despite the positive results obtained by Jacques, quickly degraded in the environment of molten NaOH. The main corrosion product is iron oxide (Fe
2O
3), which is shown in the diffraction pattern recorded for the electrolyte tank fragment (cathode) after the cell had finished working (
Figure 15). In the case of the separator, the visible black color corresponds to fragments of unreacted fuel (biochar).
Similar results were obtained by Zecevic at al. [
25]. Carbon steel oxidizes very quickly and corrodes in the presence of oxygen contained in the electrolyte. The cathode surface becomes nonconductive after oxidation due to the formation of Fe
2O
3. On the other hand, the cathode, made of mild steel with addition of titanium, enables cell operation for over 540 h. With the use of mild steel doped with 2 wt% of titanium (Fe2Ti), the formation of a layer of oxide is caused on the material surface, which represents the degenerated semi-conductor characterized by a stable electrical conductivity and good corrosion resistance. This material also has very good chemical stability and promising catalytic properties for the oxygen reduction reaction [
25].
3.2. Model II
The variations in OCV plotted against time, and the relationships between cell voltage, power density, and current density, are shown in
Figure 16.
As in the case of Model I, the OCV slowly increased over time and reached a plateau after an hour (see
Figure 16a). The voltage measured after 3 h of cell operation was 0.95 V for biochar and 0.6 V for graphite. The use of different materials for the construction of the anode and cathode was probably the reason for obtaining lower OCV voltage values compared to Model I (it is probably that the values of the potentials generated on the electrodes were different).
As can be seen in
Figure 16b, Model II produced an increased performance, with maximum power densities of above 6.7 mW cm
−2 with graphite rod serves as a fuel. For biochar, the maximum power densities were comparable with the first prototype and equaled to 4.8 mW cm
−2.
The use of materials characterized by greater corrosion resistance in the environment of molten hydroxides in the construction of Model II improved the quality of the electrolyte, which could be visually assessed. This probably resulted in an increase in the obtained power density (especially in the case of graphite), as well as a lower internal resistance (1.54 Ω for graphite and 1.19 Ω for biochar).
Model II was also subjected to a long-term test in order to determine the stability of operation and the influence of the molten NaOH environment on individual cell components, and thus on the cell’s lifetime. In this case, biochar was also used as fuel (9.0 g), and the cell was operated under a load of 50 Ω. The voltage and current values determined during the long-term experiment are plotted in
Figure 17.
The fuel cell operation was analyzed for 93 h, after which a voltage drop at the terminals below 0.1 V was noted. After the experiment, a biochar mass loss of 3.1 g (≈34% compared to the initial weight) was found. Due to the materials used, the cell worked three times longer than Model I; however, the progressive corrosion of individual cell elements negatively affected the operation of the device, which could be indicated by the observed voltage and current fluctuations.
Figure 18 presents photos of the anode, cathode and electrolyte crucible after the long-term test.
The different colors of the layers that have formed on the surface of the cell elements after long-term testing allow to determine the type of oxides:
red, brown—iron (III) oxide; Fe2O3,
dark brown—iron (II) chromate; Fe2CrO4,
yellow—iron (III) oxide monohydrate; Fe2O3 ∙ H2O, sodium chromate; Na2CrO4,
black—nickel (II) oxide; NiO.
The collection of electric charges from biochar particles was done through a steel mesh. The steel mesh during the operation of the cell was covered with an oxide layer, which in addition to iron oxides also formed nickel and chromium oxides. These oxides show high electrical resistance, which could have worsened the electron charge collection from biochar particles, and this in turn would explain the lower operating parameters obtained for biochar compared to graphite, for which the charge was collected directly from the electrode surface. Like the Model I, oxide layers formed on the surface cell anodes and cathodes were probably the main reason for the observed voltage and current fluctuations.
Model II elements are made of 304L and 316L corrosion-resistant alloy steel (containing chromium and nickel—additives responsible for increasing the corrosion resistance of steel). The electrolyte tank in the case of Model II was built of two types of materials: in the lower part made of nickel, in the upper part made of 304L alloy steel. The heterogeneity of the material from which the crucible was made resulted in accelerated degradation of steel as a less noble material during the operation of the cell, under current conditions, at the Ni/304L contact point. At the interface of both materials, a micro-cell and steel (and especially the steel component, i.e., Fe) were formed, undergoing oxidation. The result of steel digestion was visible as a layer of rust in the upper part of the crucible (see
Figure 18c).
The cathode was a 316Ti stainless steel tube with a porous air sparger made of sintered 316L steel powder. It can be seen that 316Ti steel was disintegrated and corrosion products were deposited on the surface of the tube. In the case of the air sparger made of 316L steel, a black oxide layer is visible, which is most likely NiO.
The XRD patterns (
Figure 19) of the anode and cathode surface after long-term operation of the Model II shows that apart from the austenitic phase of iron (III) oxide (hematite; Fe
2O
3) and iron oxyhydroxide (lepidocrocite; γ-FeO[OH]), a solid residue of Na
2CO
3 was formed on the surface of the anode tube resulting from the carbonation of the electrolyte.
3.3. Model III
In the case of the MH-DCFC Model III, the electrolyte was a mixture of molten sodium and lithium hydroxides (molar ratio: 9:1). Lithium hydroxide was the donor of Li
+ ions, which served the in situ lithiation process of the NiO layer during the cell operation.
Figure 20 shows the OCV changes vs. time and the performance characteristics of the Model III fueled by biochar and graphite.
Using nickel and its alloys in the construction of Model III contributed to a significant increase in the most important electrical parameters, such as OCV, power and current densities, when biochar was used as a fuel. In turn, for graphite, the change in the cell structure and the materials used resulted in a slight decrease in the current and power density values, which could be caused by a change in the electrolyte composition (pure NaOH was used in Models I and II, while the electrolyte in Model III was the NaOH-LiOH mixture).
The results shown in
Figure 20a indicate that, in the case of graphite, the cell reached a stable voltage after an hour, while for biochar, the voltage stabilization was achieved after 2 h. Finally, after 3 h of non-load operation, the measured OCV was equal to 1.05 V and 0.67 V for biochar and graphite, respectively. The estimated internal resistance was 0.39 Ω for graphite and 0.52 Ω for biochar. The obtained maximum power and current densities were, respectively, 5.3 mW cm
−2 and 29.5 mA cm
−2 for graphite and 33.5 mW cm
−2 and 75.0 mA cm
−2 for biochar.
The decrease in the internal resistance value and the increase in other electrical parameters (compared to Models I and II) were most likely related to the reduction of corrosion of the cell components (in particular the anode and cathode). Moreover, after each of the tests, no contamination of the electrolyte with corrosion products was observed.
Positive results of the preliminary tests of model III, similarly to Models I and II, were verified with the long-term test. The mass of used biochar was 2.6 g, while the external load of the cell was set to 1 Ω. The voltage and current values recorded during the long-term experiment are presented in
Figure 21.
The fuel cell worked for more than 43 h, after which a voltage drop at the terminals to about 0.02 V was noted. After the experiment, it was found that the entire mass of biochar had reacted, which may explain the gradual decrease in current and voltage over time. No corrosion products were observed in the electrolyte after the test. Similarly, the construction materials did not show any signs of corrosion, and their appearance was identical to that after the lithiation process (cf.
Figure 8). Due to the elimination of the problem of progressive corrosion of cell elements, the explanations required visible fluctuations in voltage and current during cell operation. The most probable cause of the occurring fluctuations was the decreasing amount of fuel in the separator and the associated loss of biochar particles in contact with the current collector (nickel mesh).
Molten hydroxide electrolyte DCFC manufactured from nickel was also examined by Guo el al. [
32]. No significant changes in the value of recorded electrical parameters generated from the cell and no significant electrolyte degradation were found during 100 h of experimentation. The test performed for various operating temperatures of cells in the range of 643–823 K showed that the increase in temperature leads to the increased conductivity of both electrolyte and oxide layers formed on the surfaces of electrodes while cells’ power also increased [
32].
In the case of Model III, electrodes were made of nickel (Nickel 201) and high-nickel alloy (Inconel 600). To observe surface and structural changes of materials exposed in molten NaOH, microstructure tests were performed.
Figure 22 presents the microstructures of the tested materials after a long-term test. The structure of the Inconel 600 and Nickel 201 alloys indicates that a good adherent and protective oxide layer was formed. No pitting or similar material discontinuities can be observed. The bright areas in the pictures are products resulting from the reaction of the electrolyte with the material. XRD analysis (
Figure 23) indicated that the main components of Inconel 600 material, regardless of the time the material was exposed in the electrolyte, were the NiO phase and the LiNiO phase. The presence of the lithium–nickel phase, even after 43 h of exposure, was satisfactory, because it means that the surface layer containing the LiNiO phase continuously protects and maintains its semiconductor properties by doping nickel oxide with lithium (which was the intention of the lithiation process).
As can be seen from the analysis of the data summarized in
Table 6, the nickel lithiation process prevents corrosion. The weight increase of the sample after 77 h of cell operation may result from the strengthening of the nickel oxide layer on the material surface as well as the simultaneous incorporation of lithium ions in the NiO structure.


