Influence of the Mechanical Properties of Elastoplastic Materials on the Nanoindentation Loading Response


Abstract
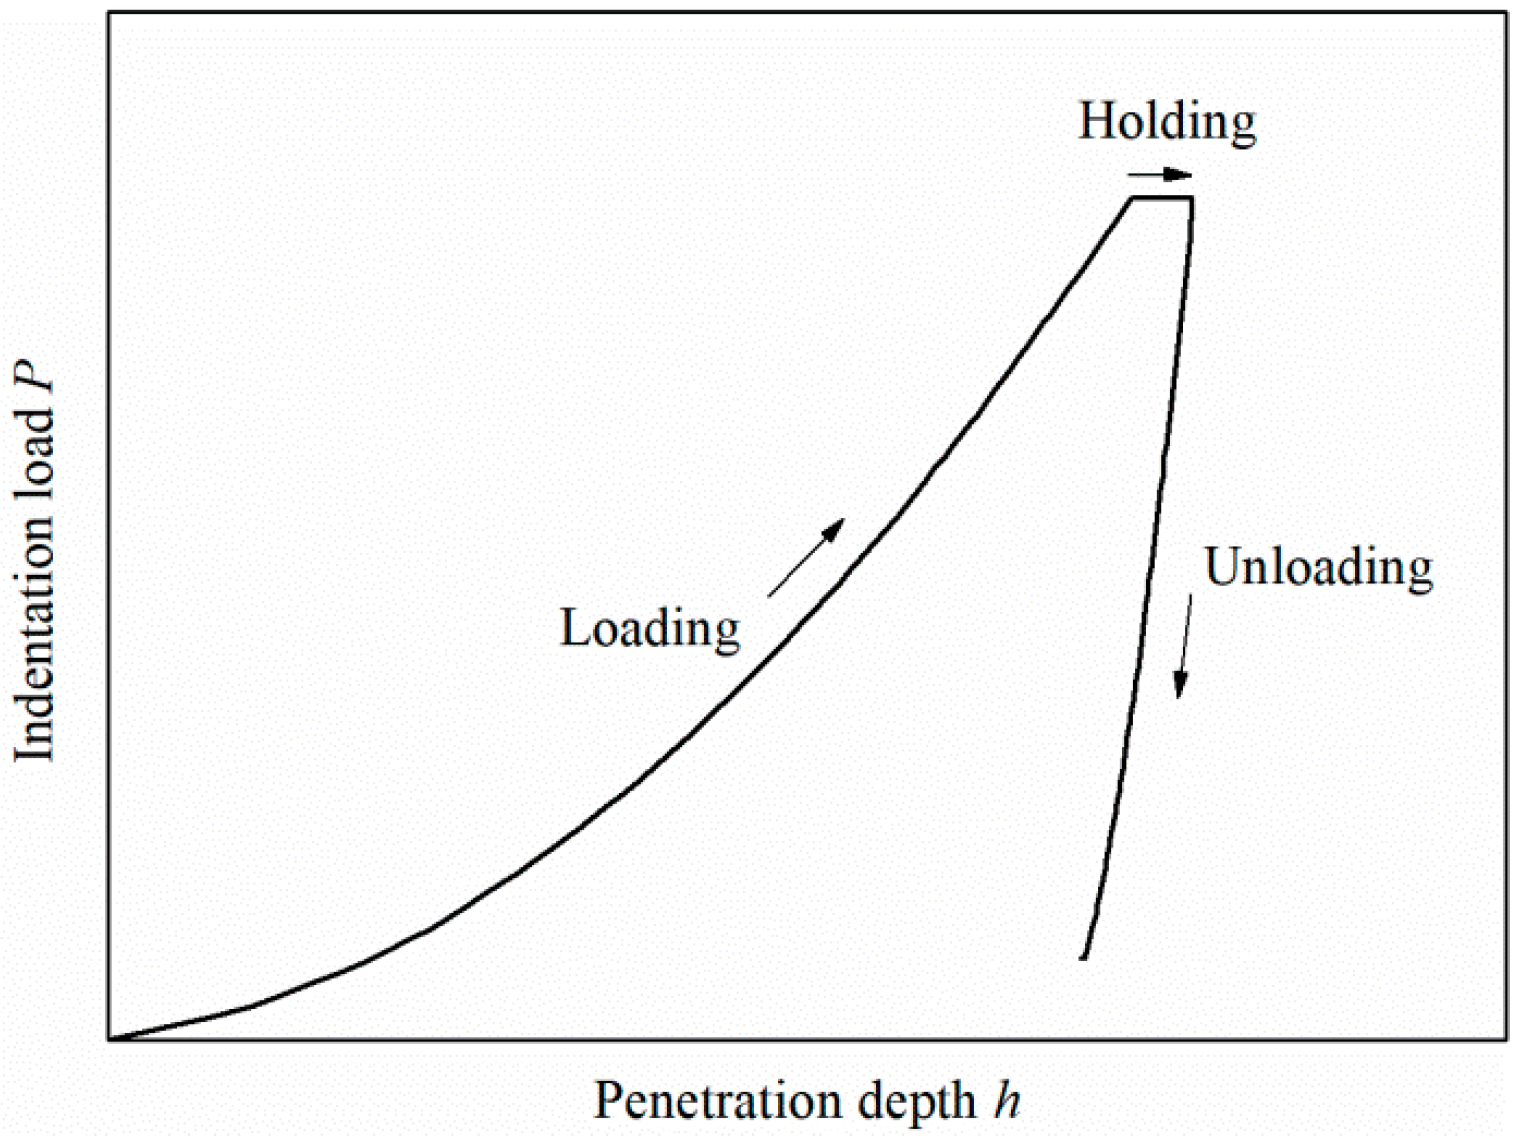
:1. Introduction
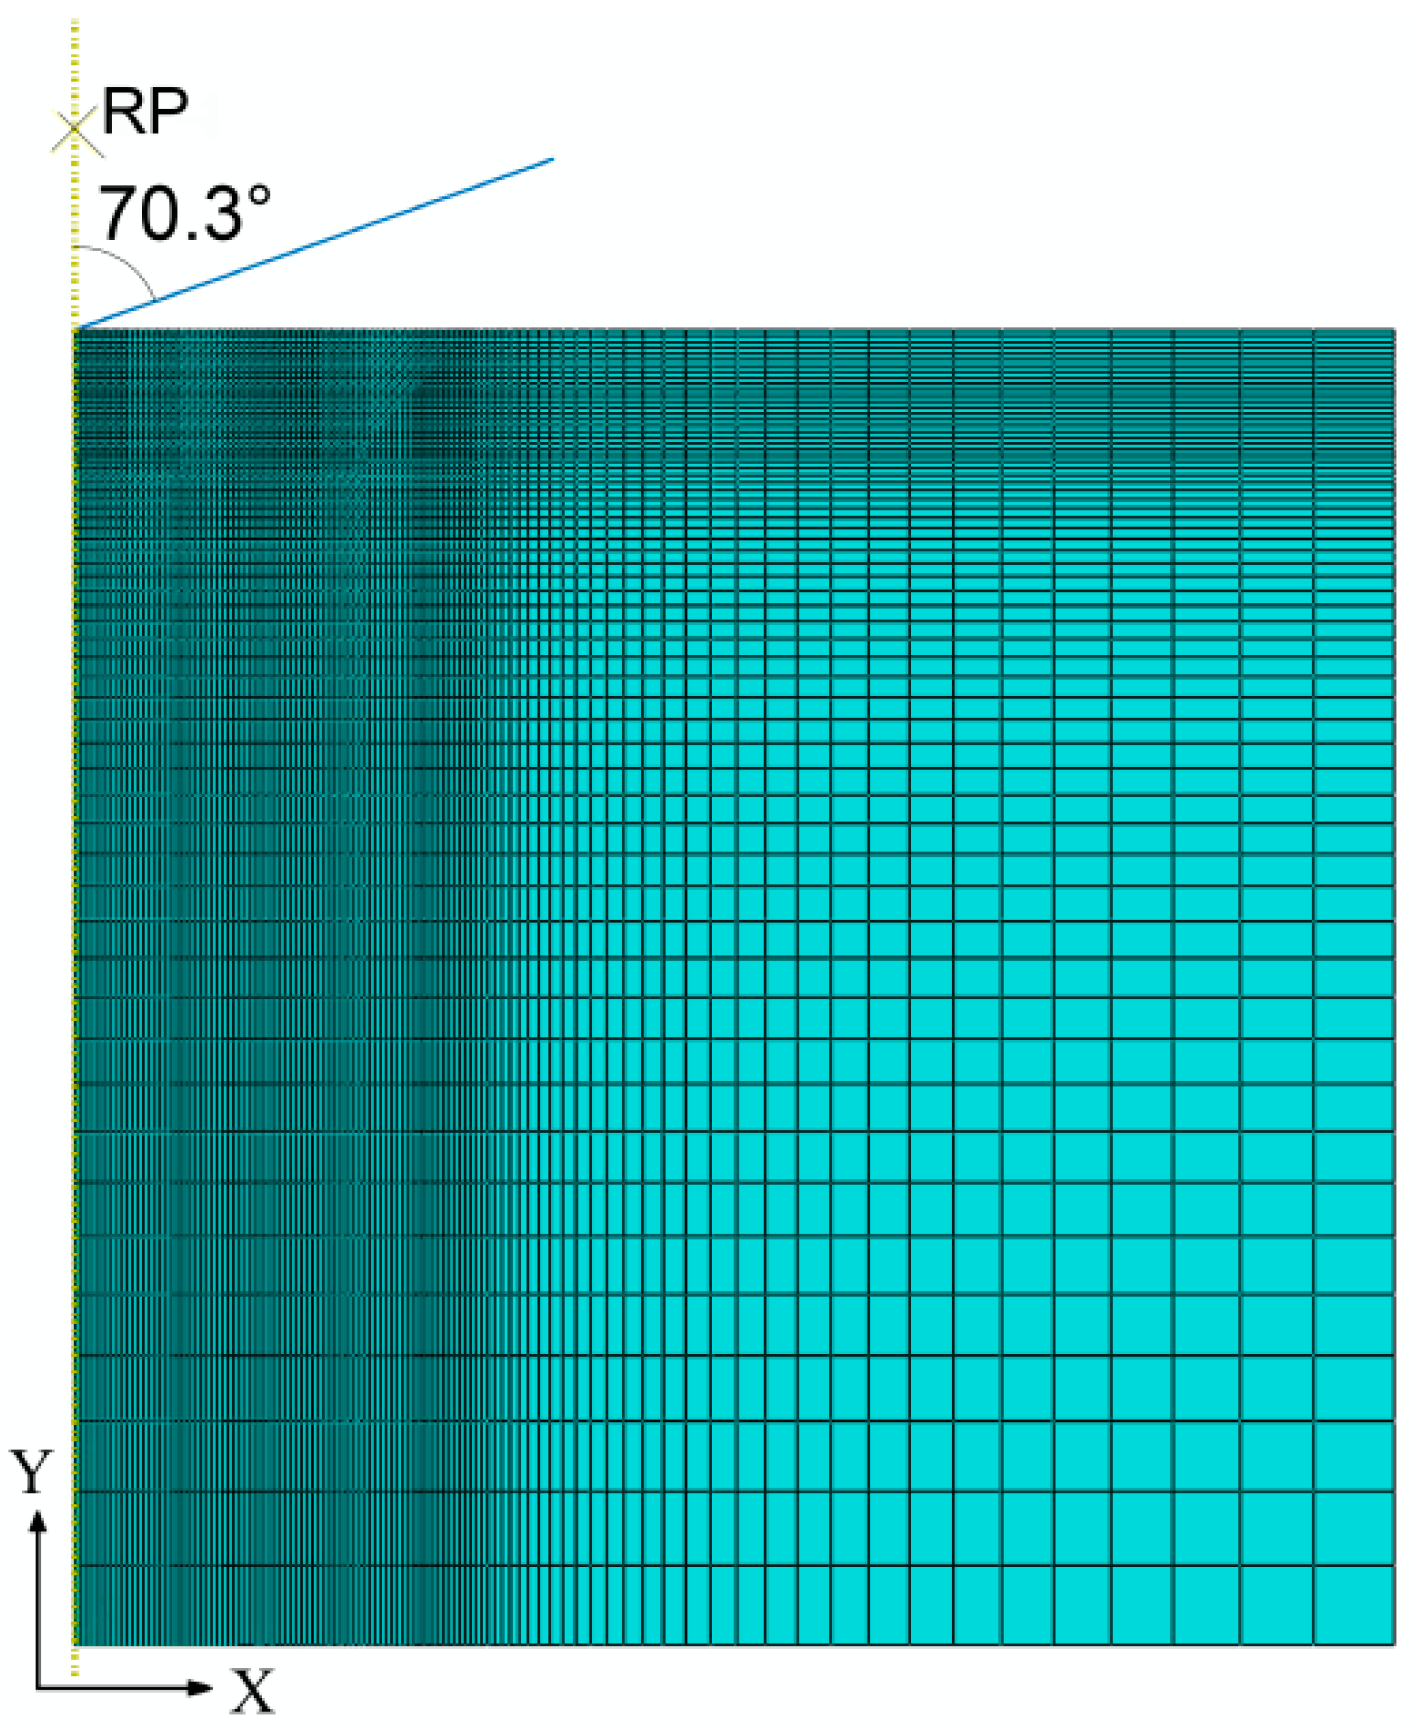
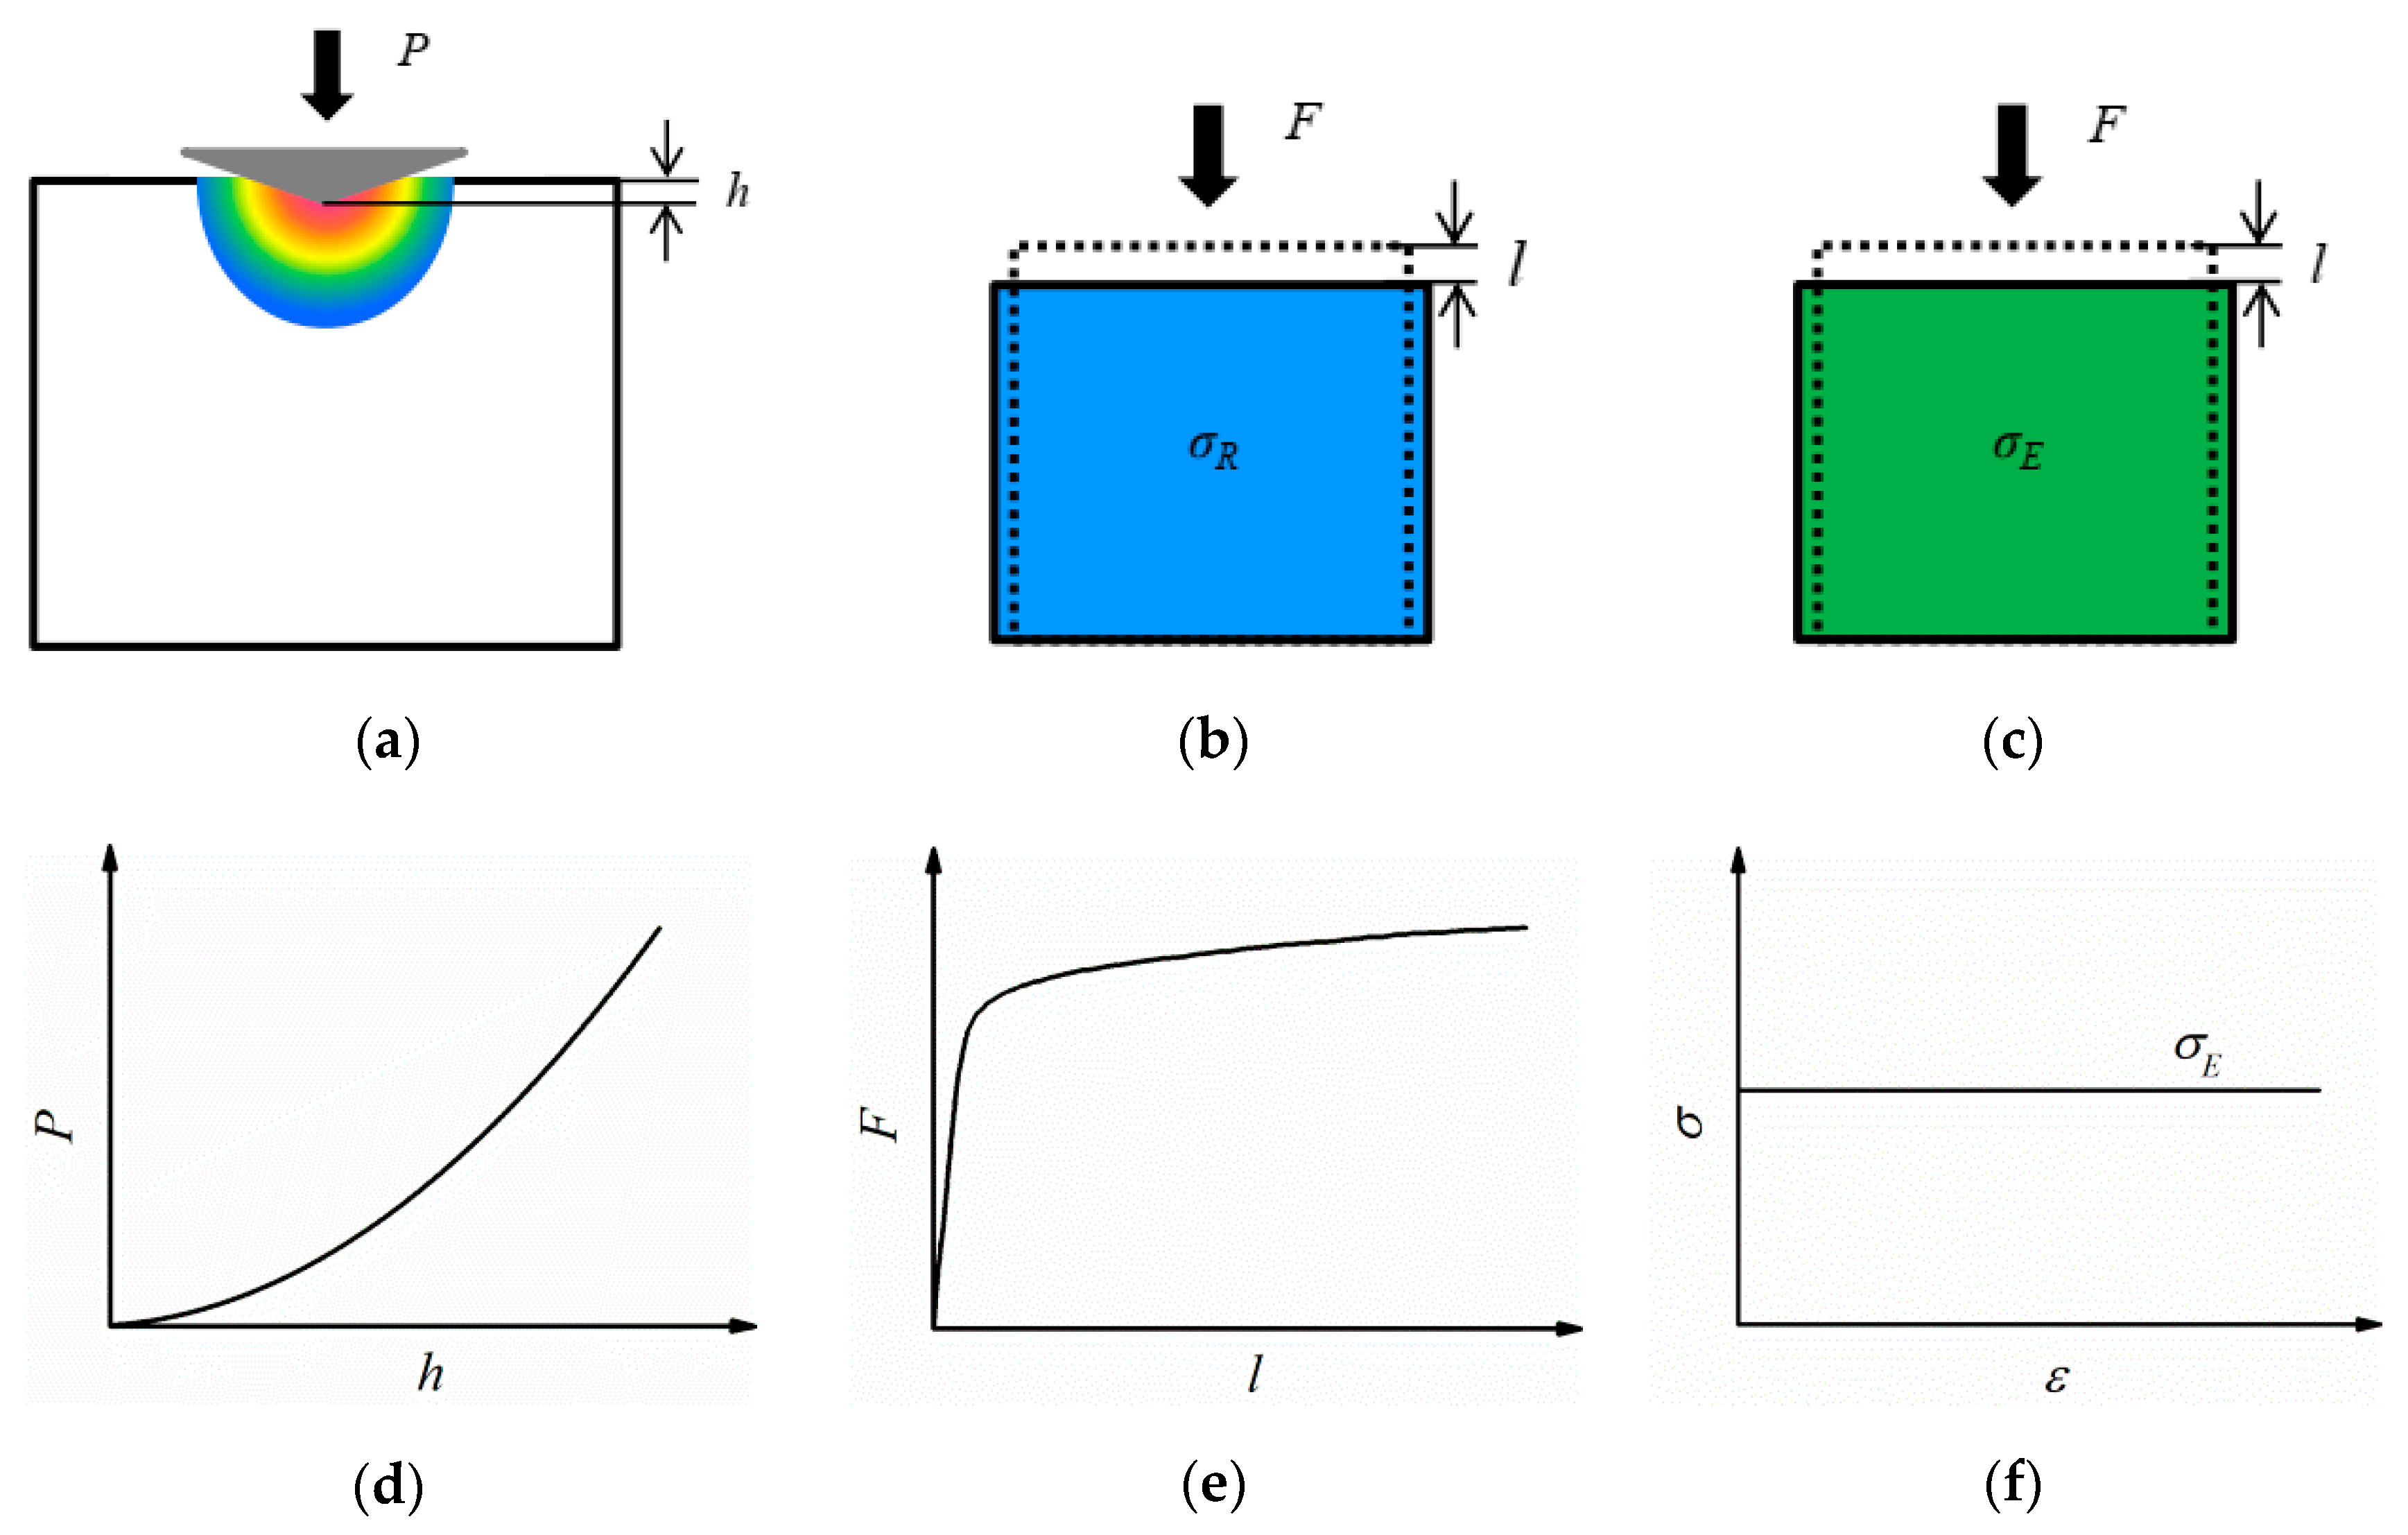
2. FE Model
3. Results
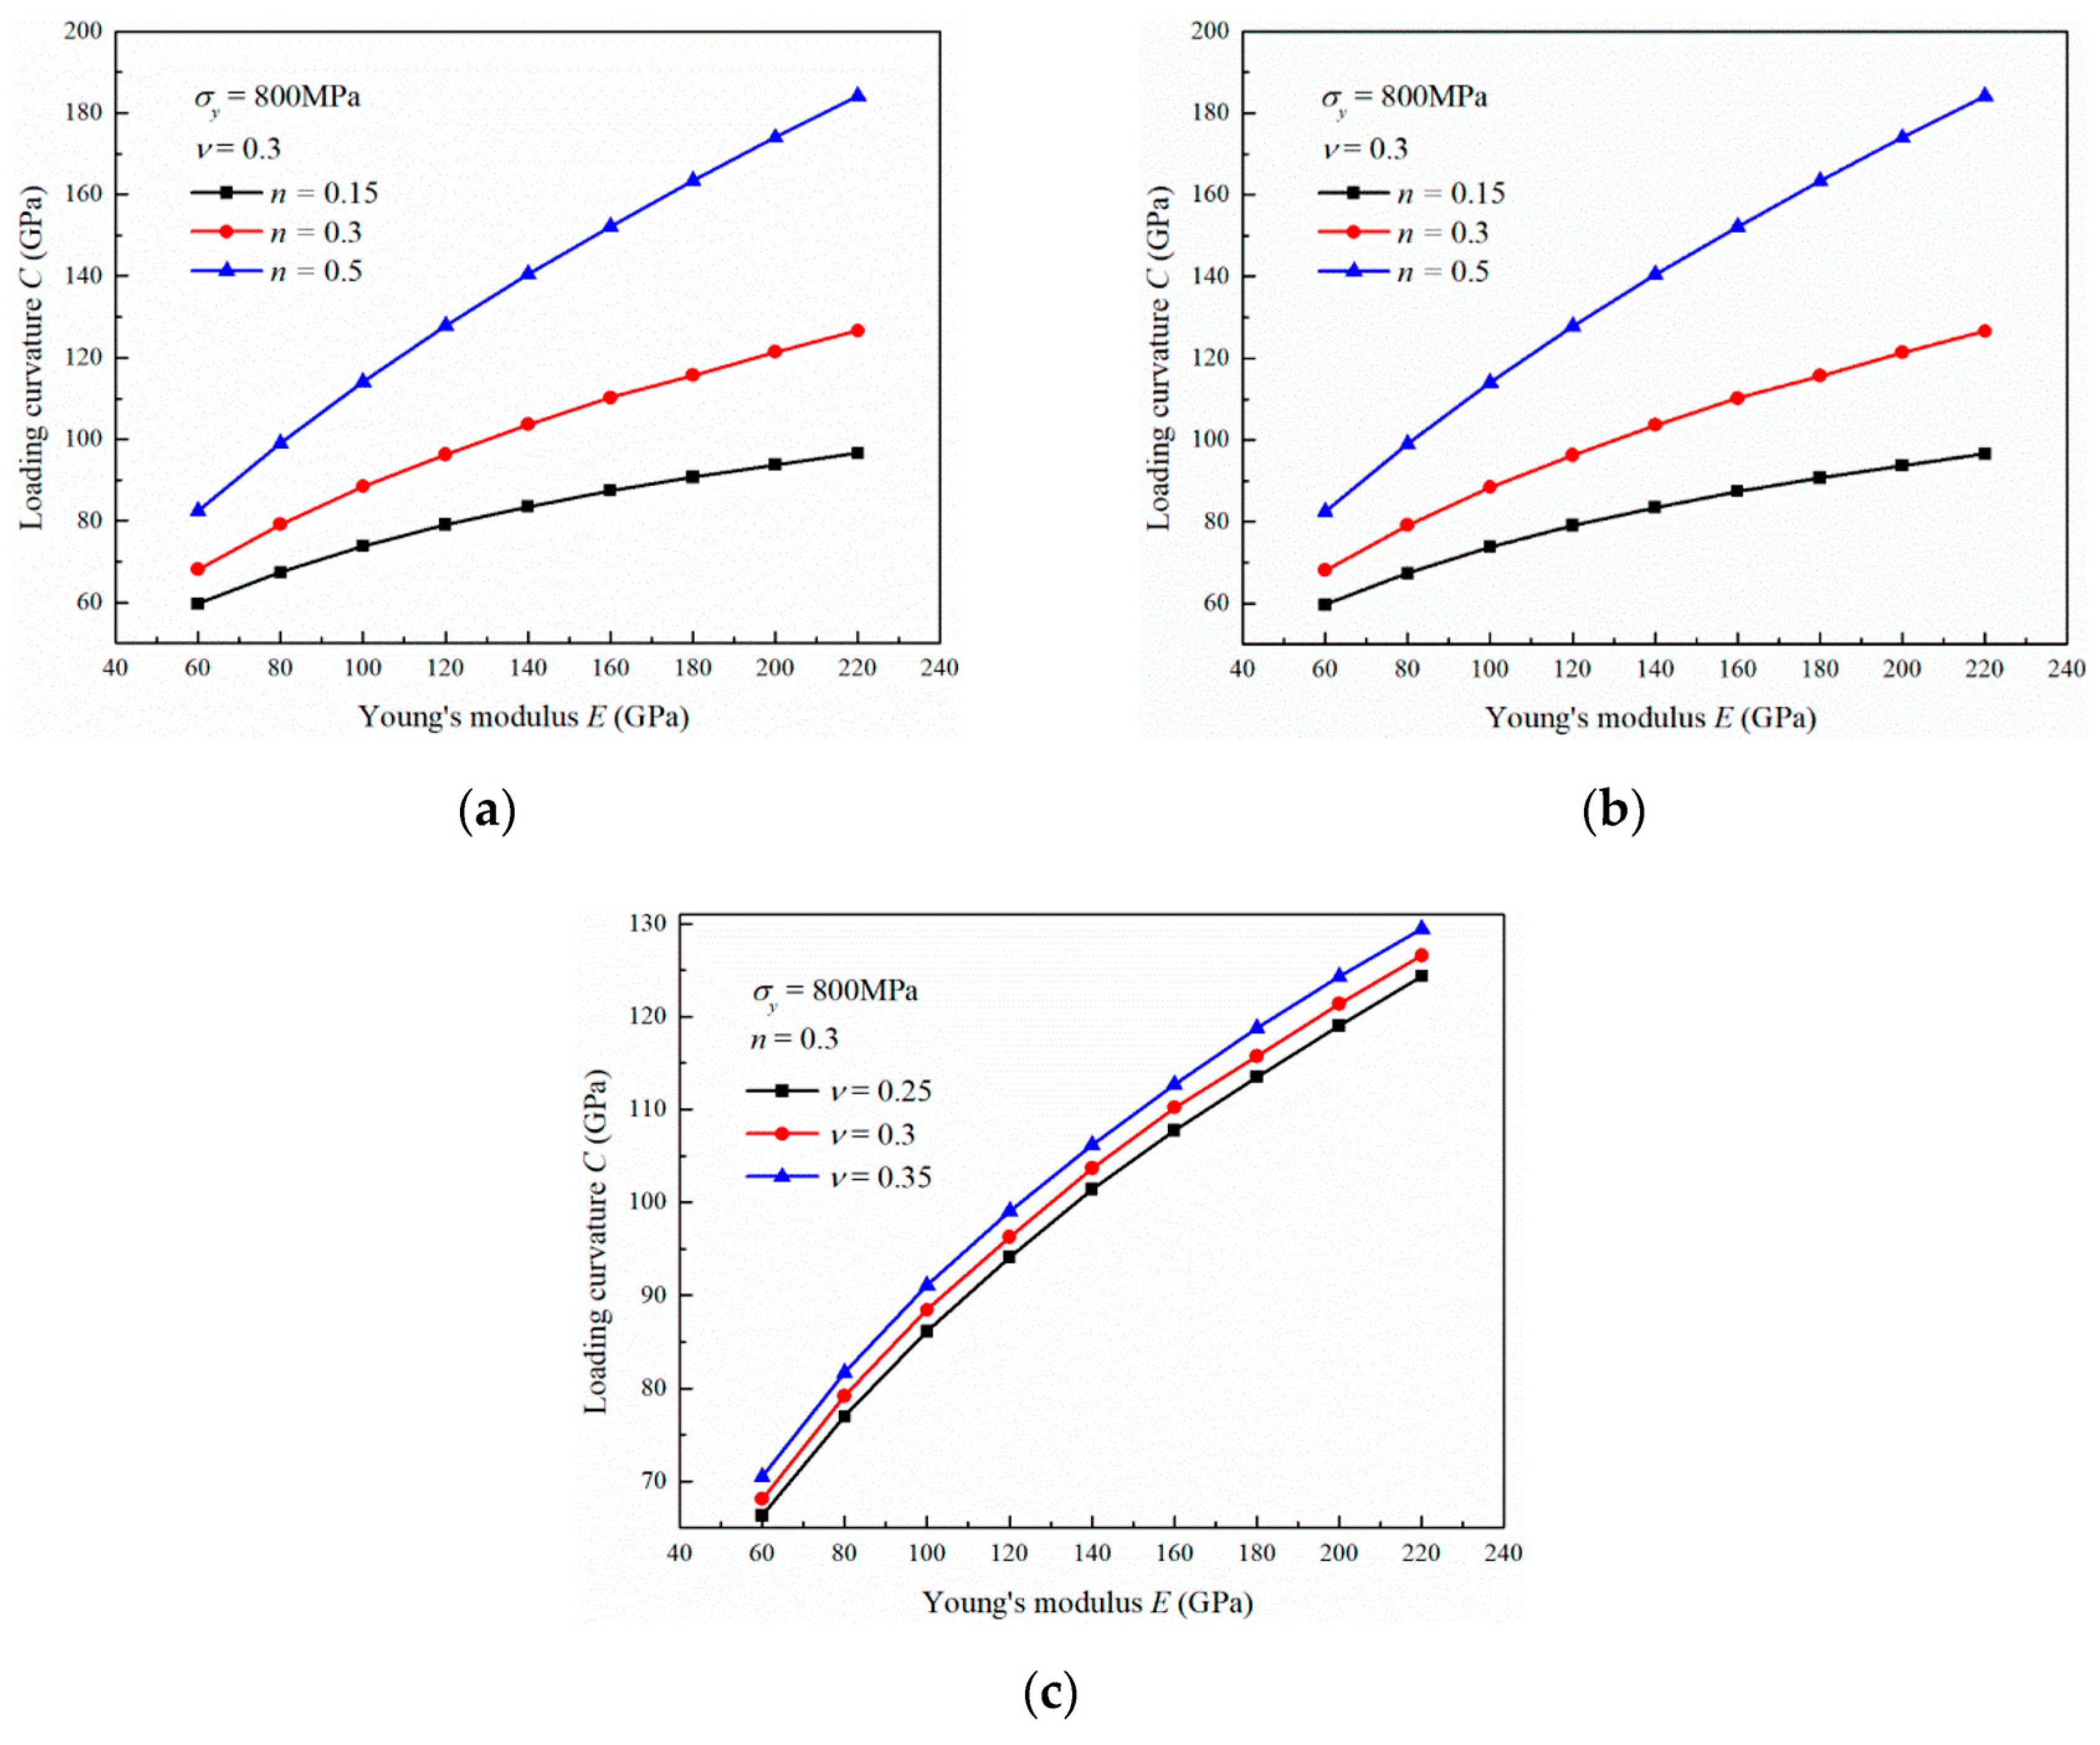
3.1. Influence of the Young’s Modulus
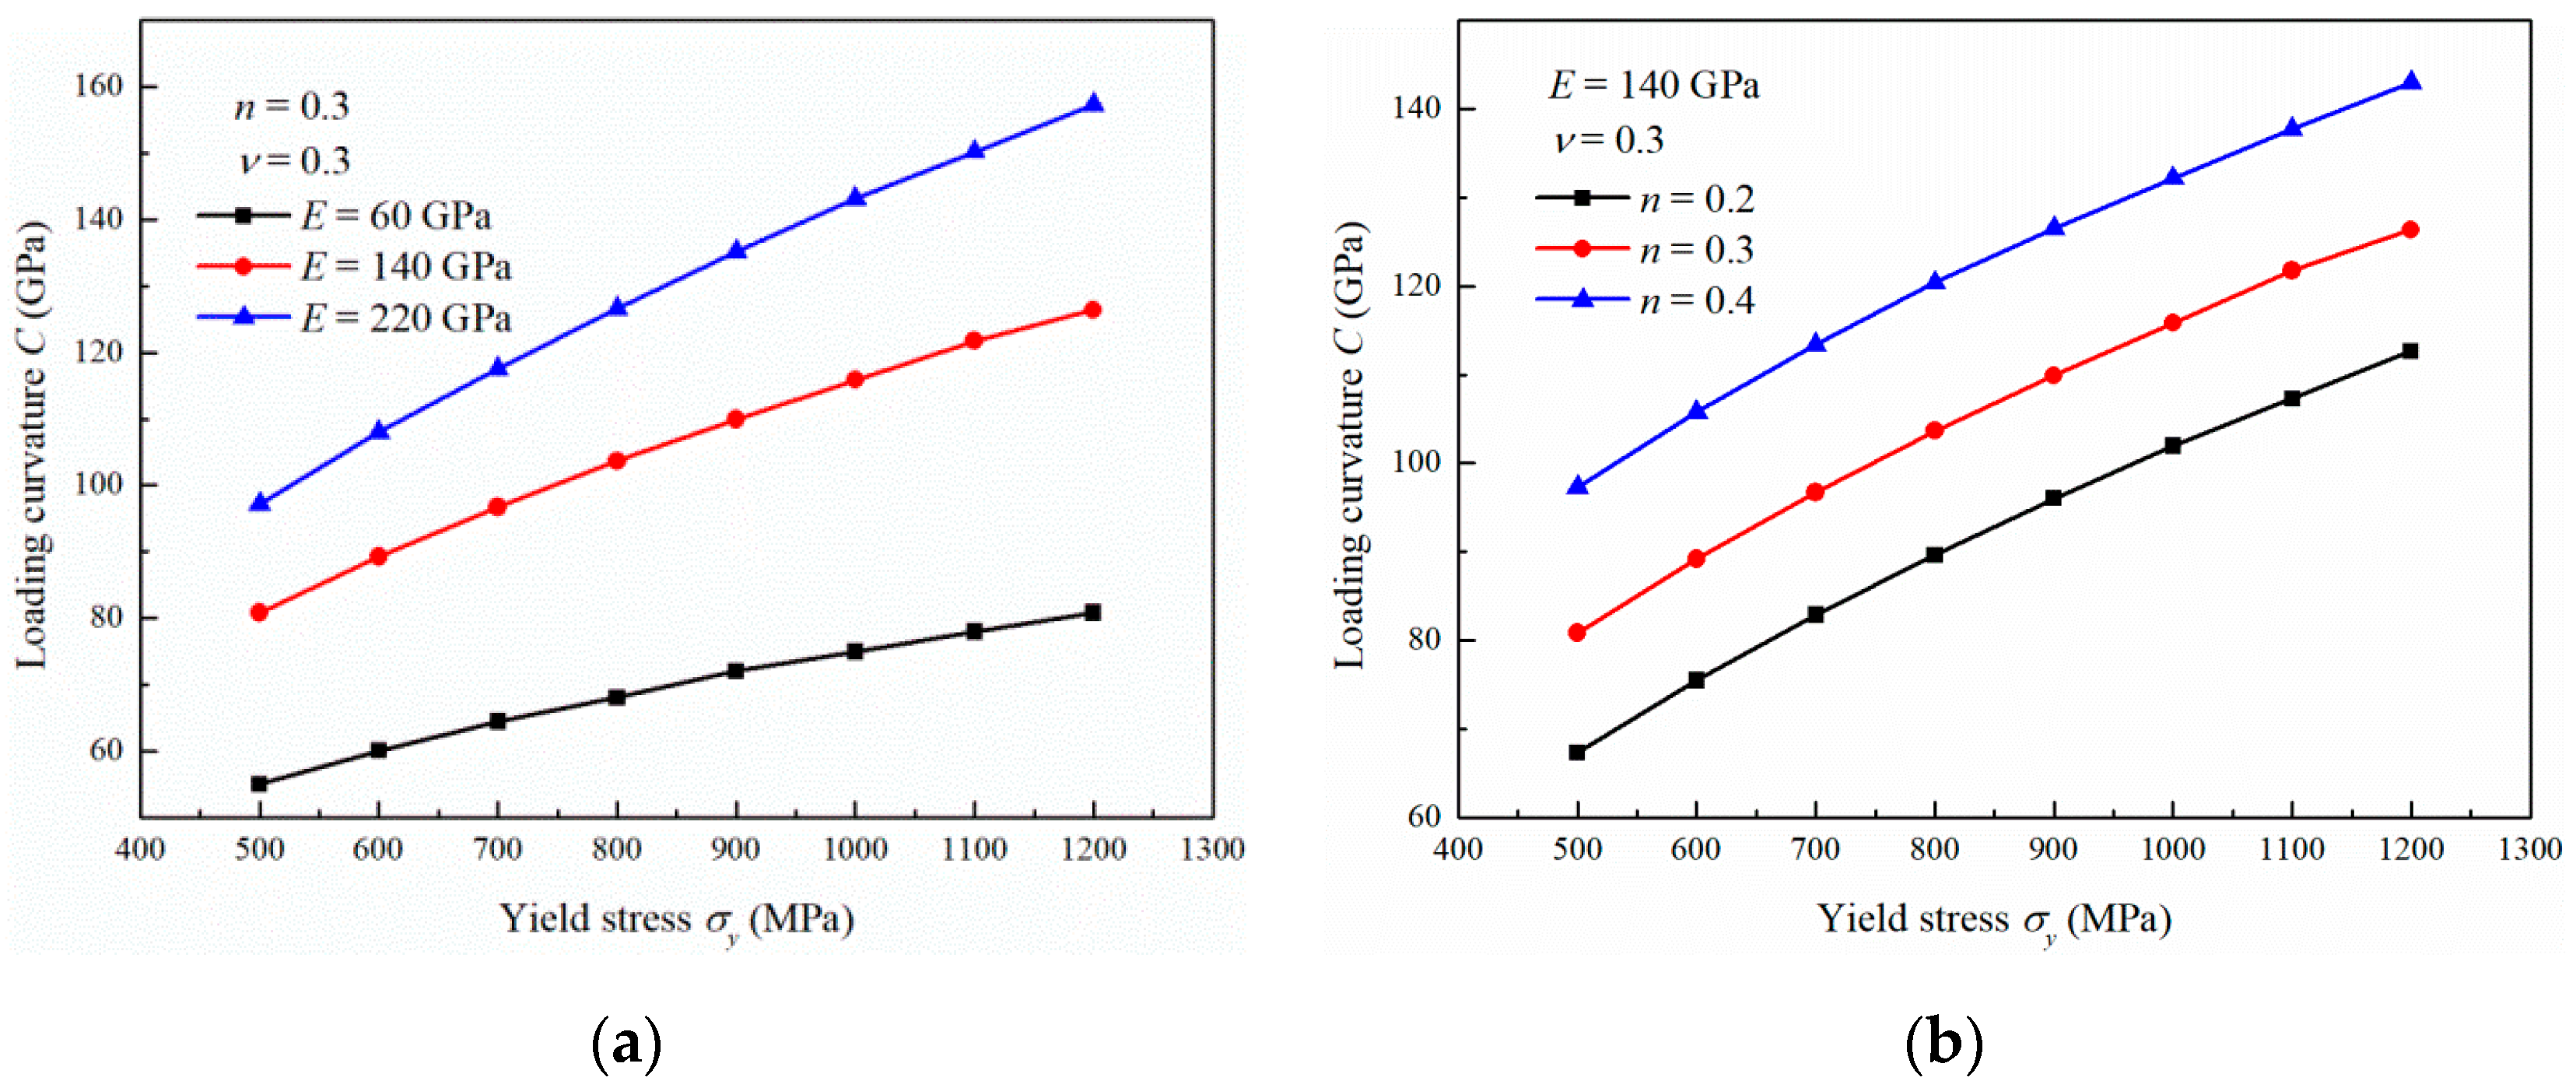
3.2. Influence of the Yield Stress
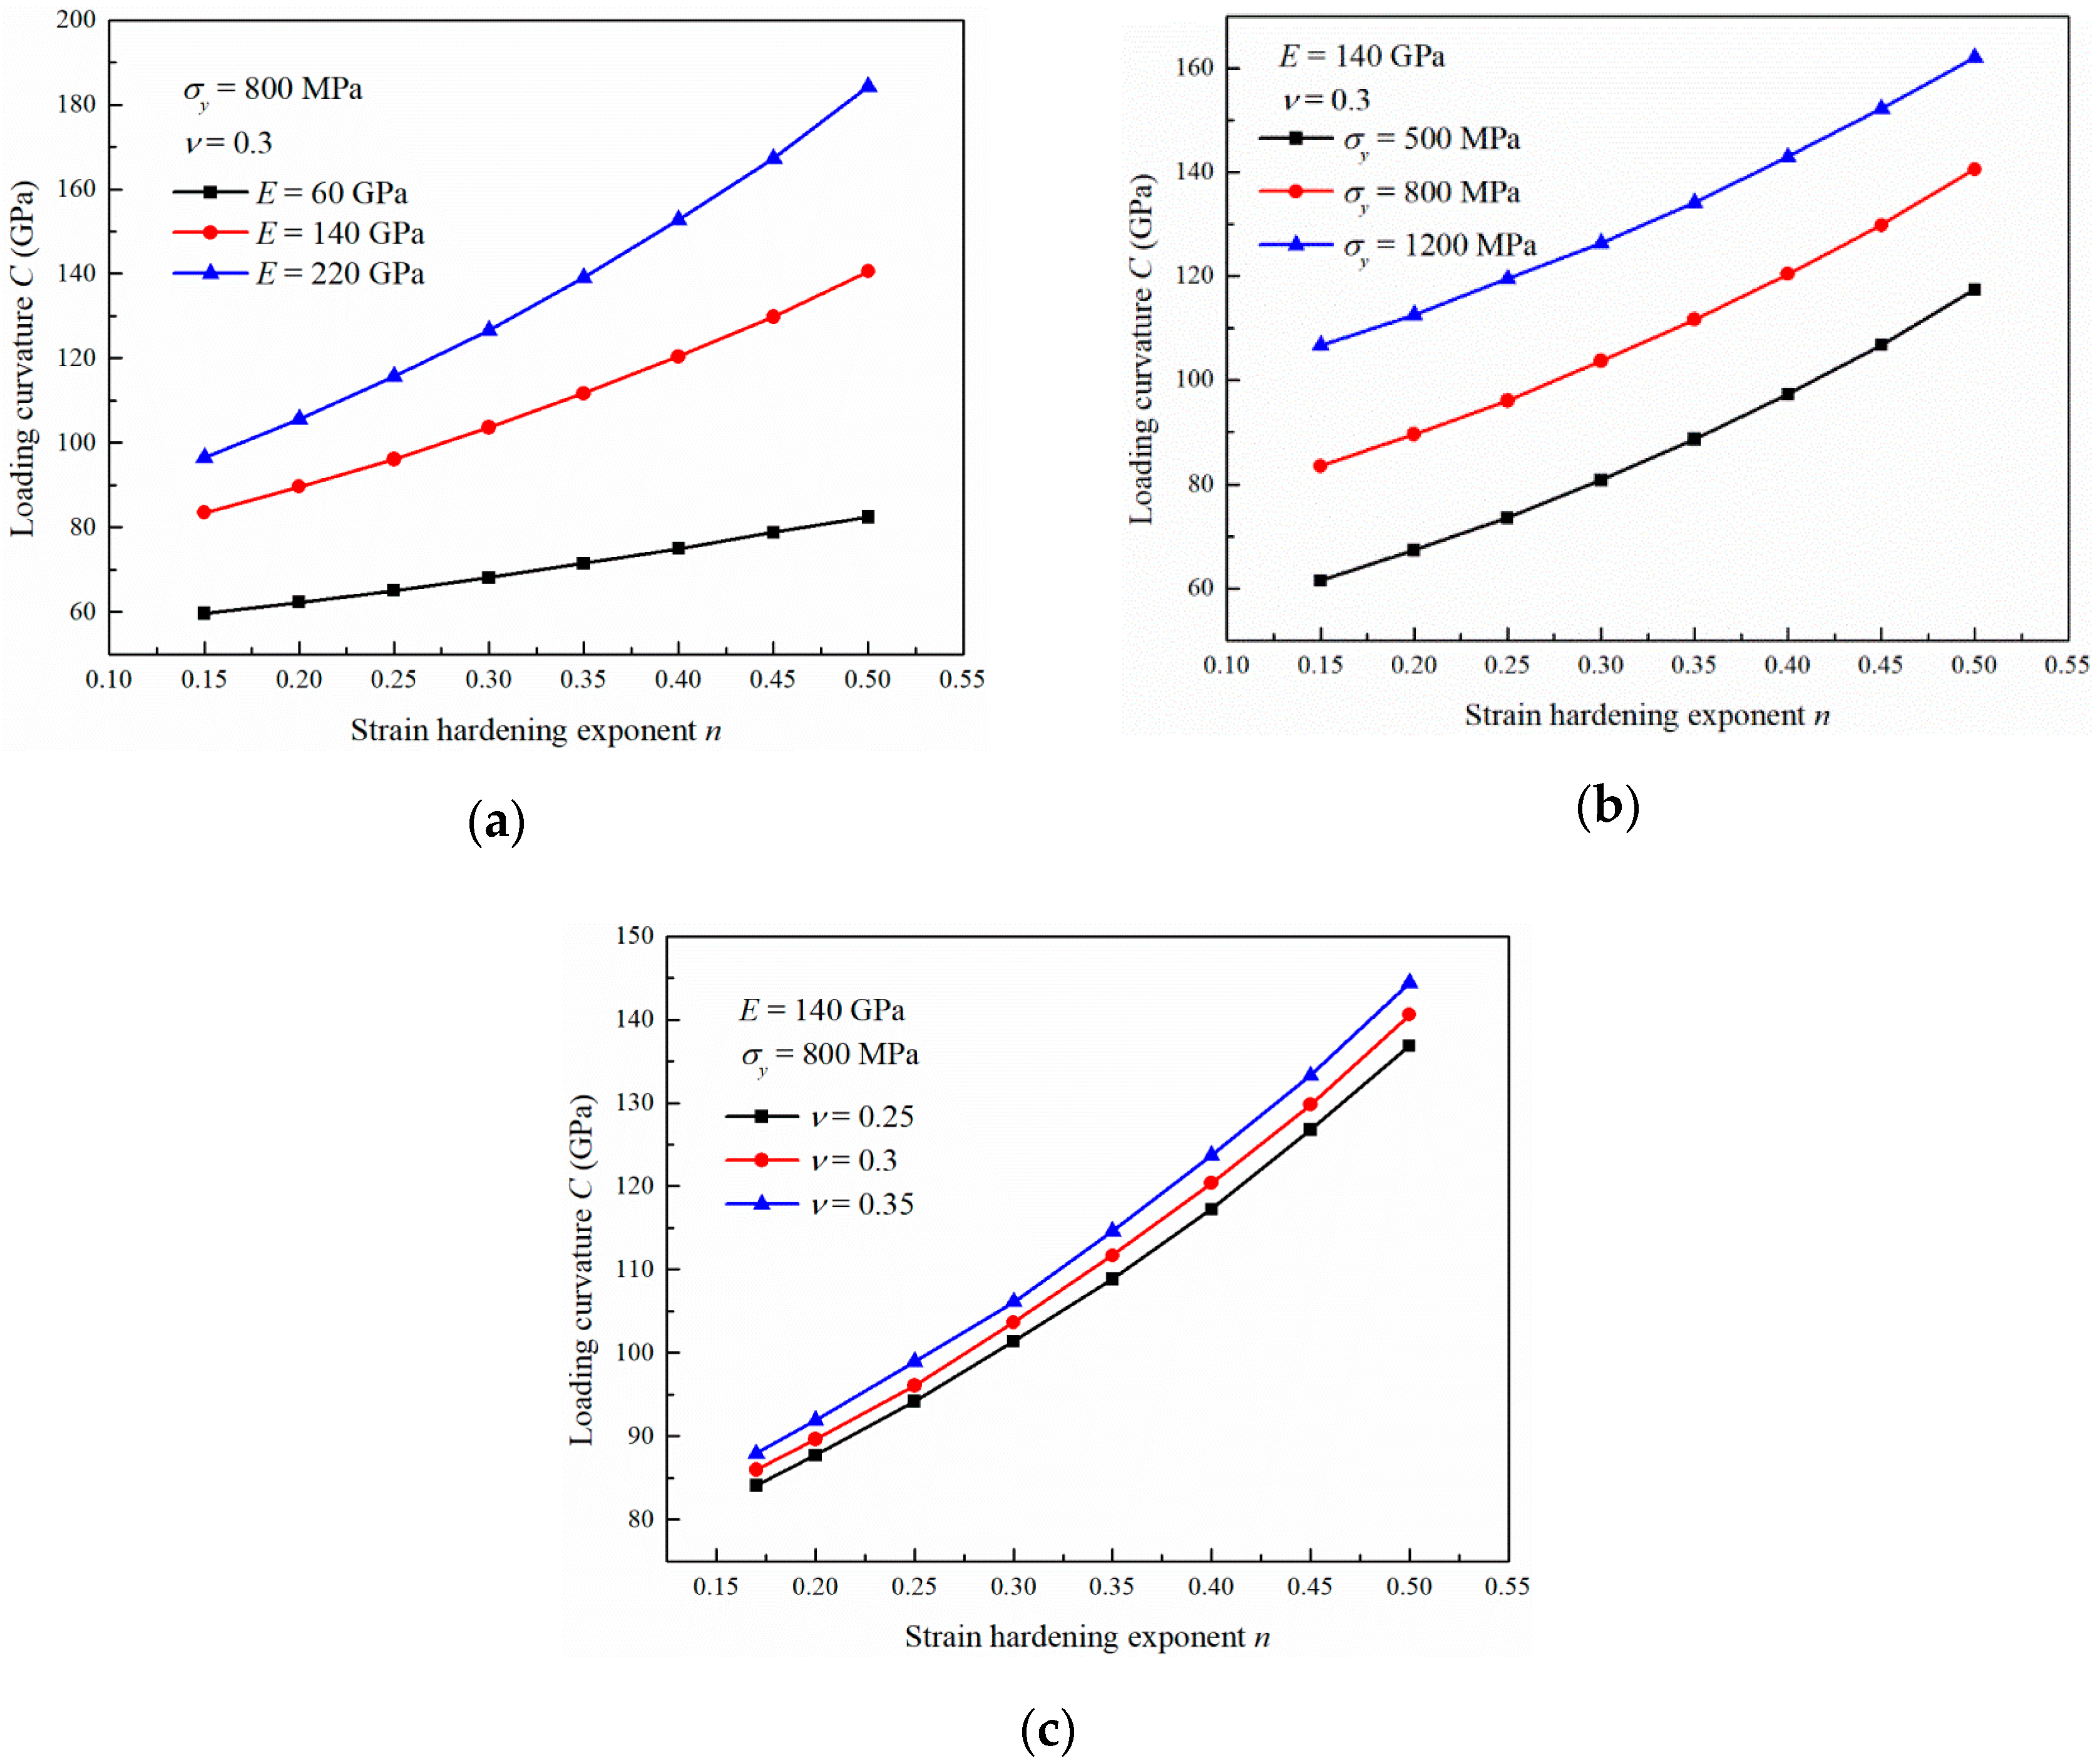
3.3. Influence of the Strain Hardening Exponent
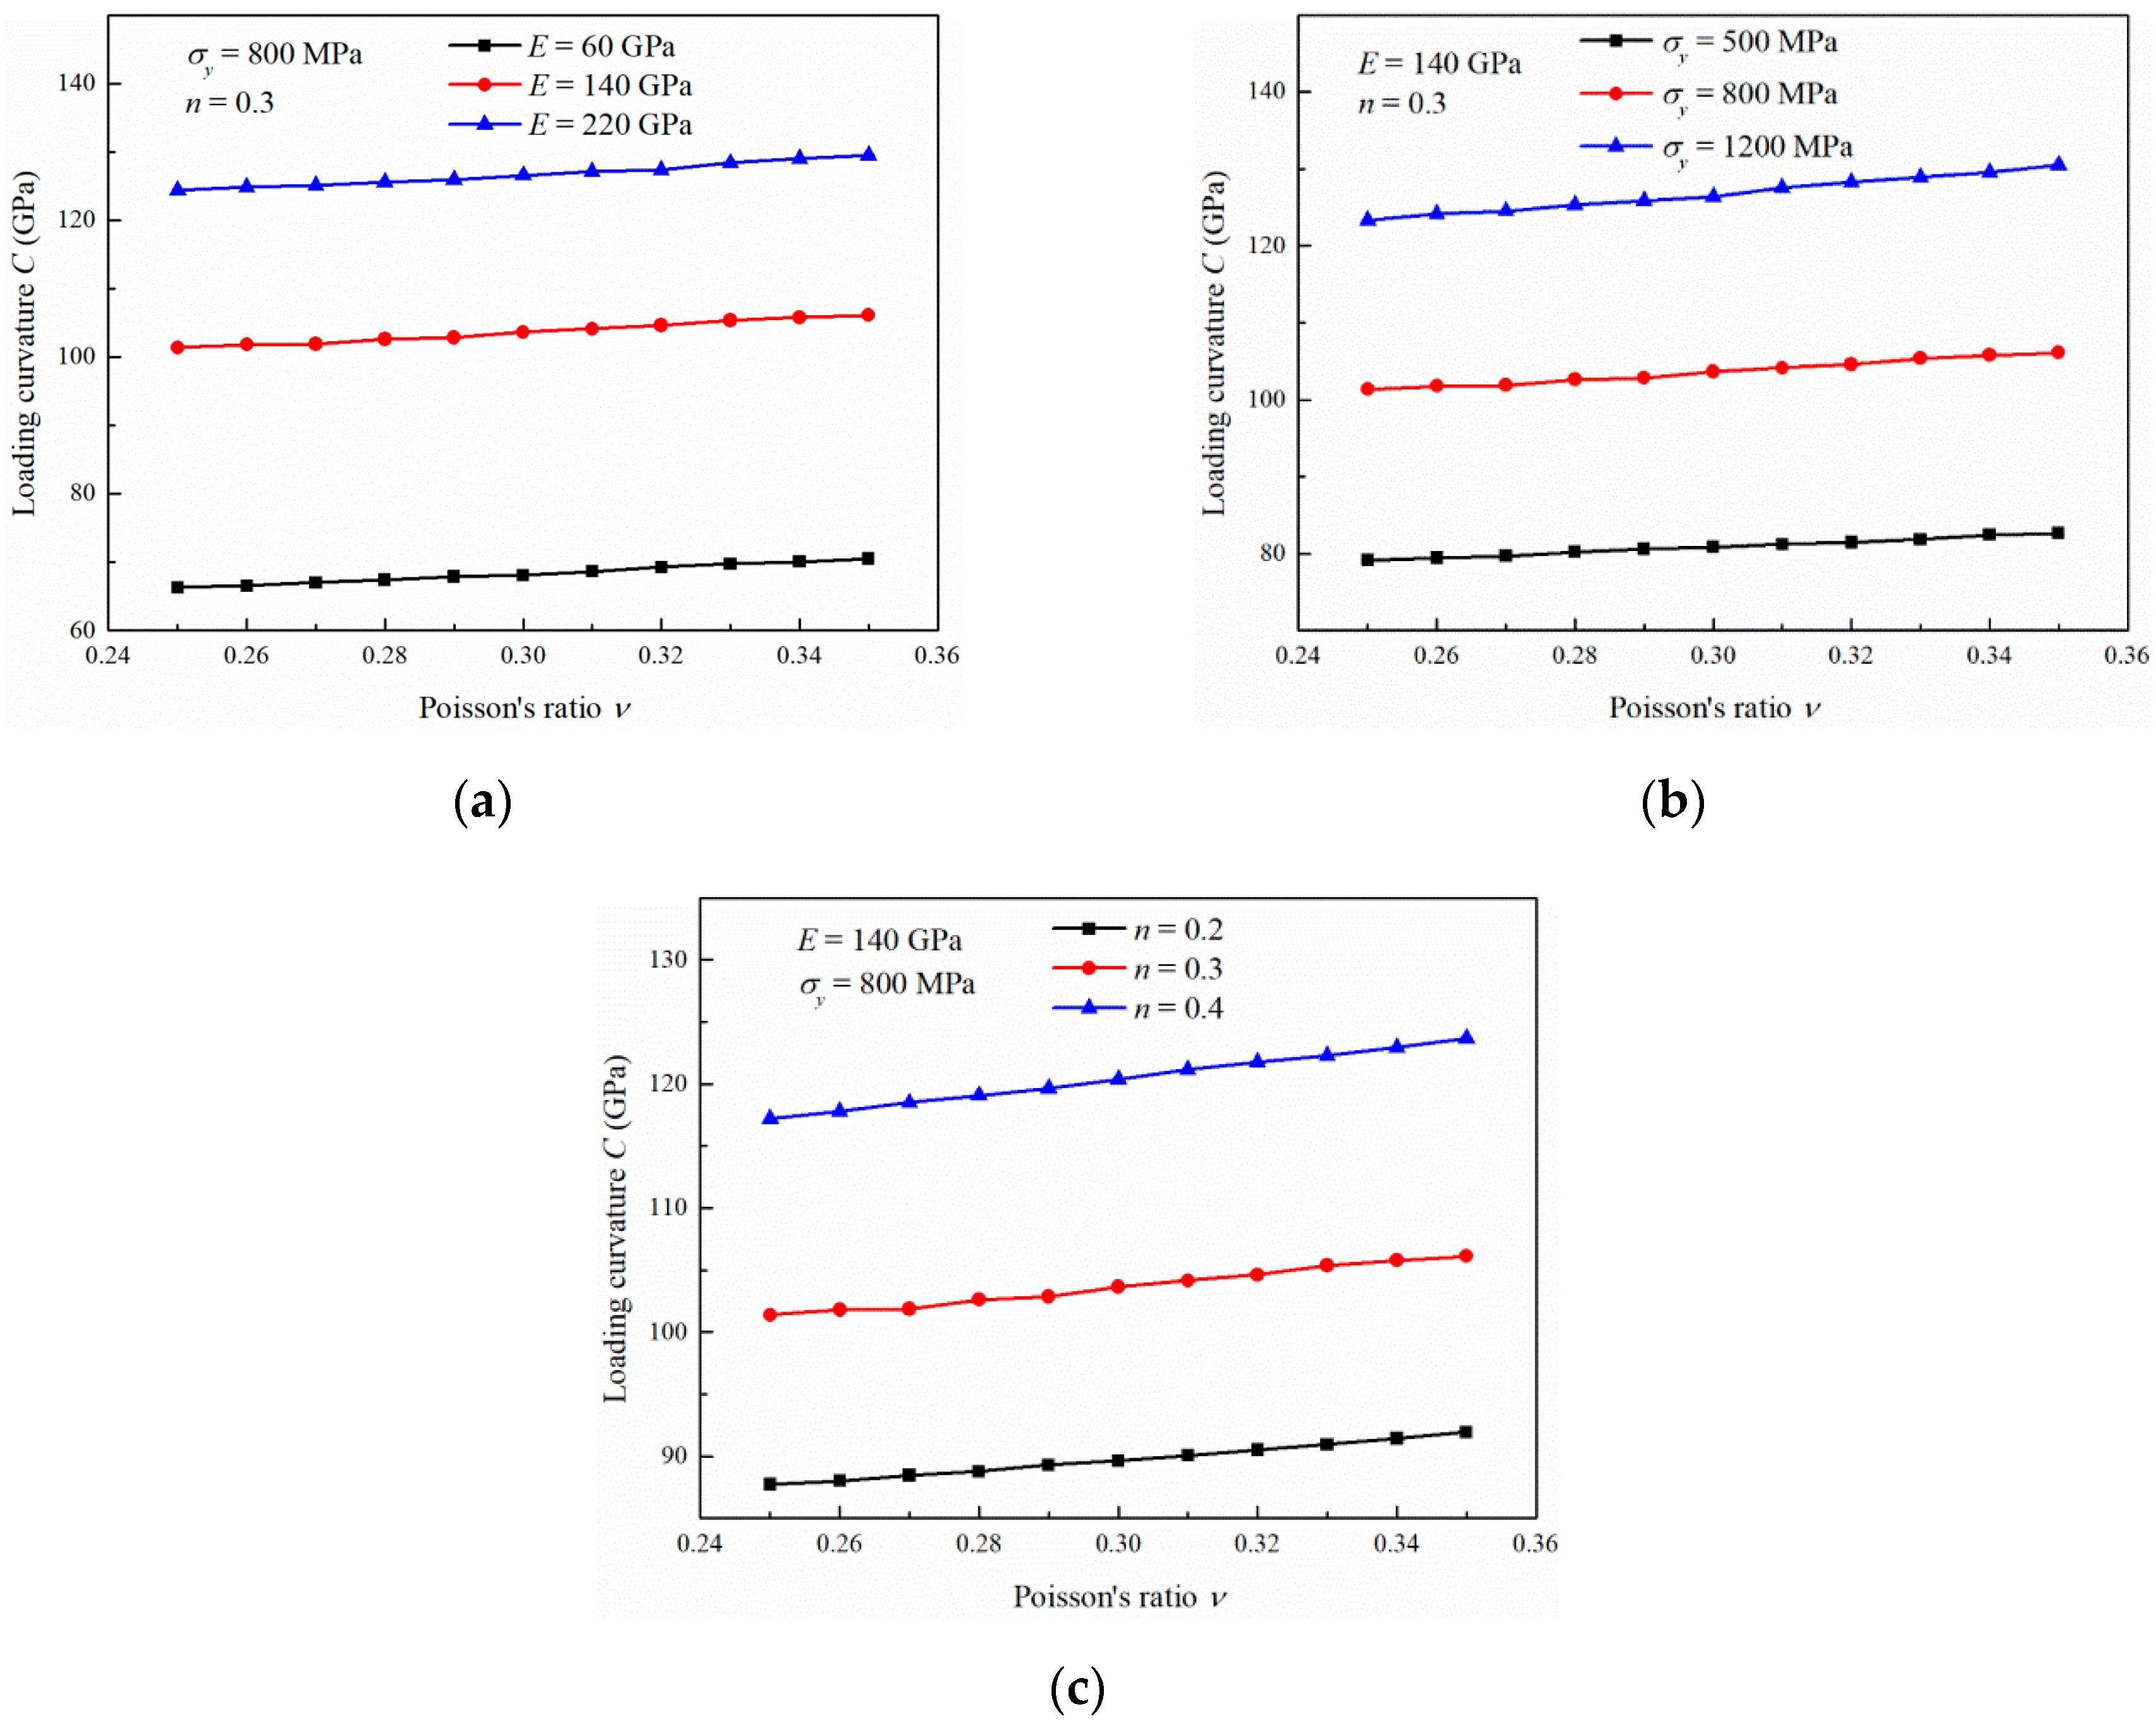
3.4. Influence of the Poisson’s Ratio
4. Discussion
5. Conclusions
- The equation proposed in the present study can quantitatively and reasonably describe the effects of the mechanical properties of elastoplastic materials on the nanoindentation loading curvature. The calculated results agreed well with the FEM simulations and experimental results in literature.
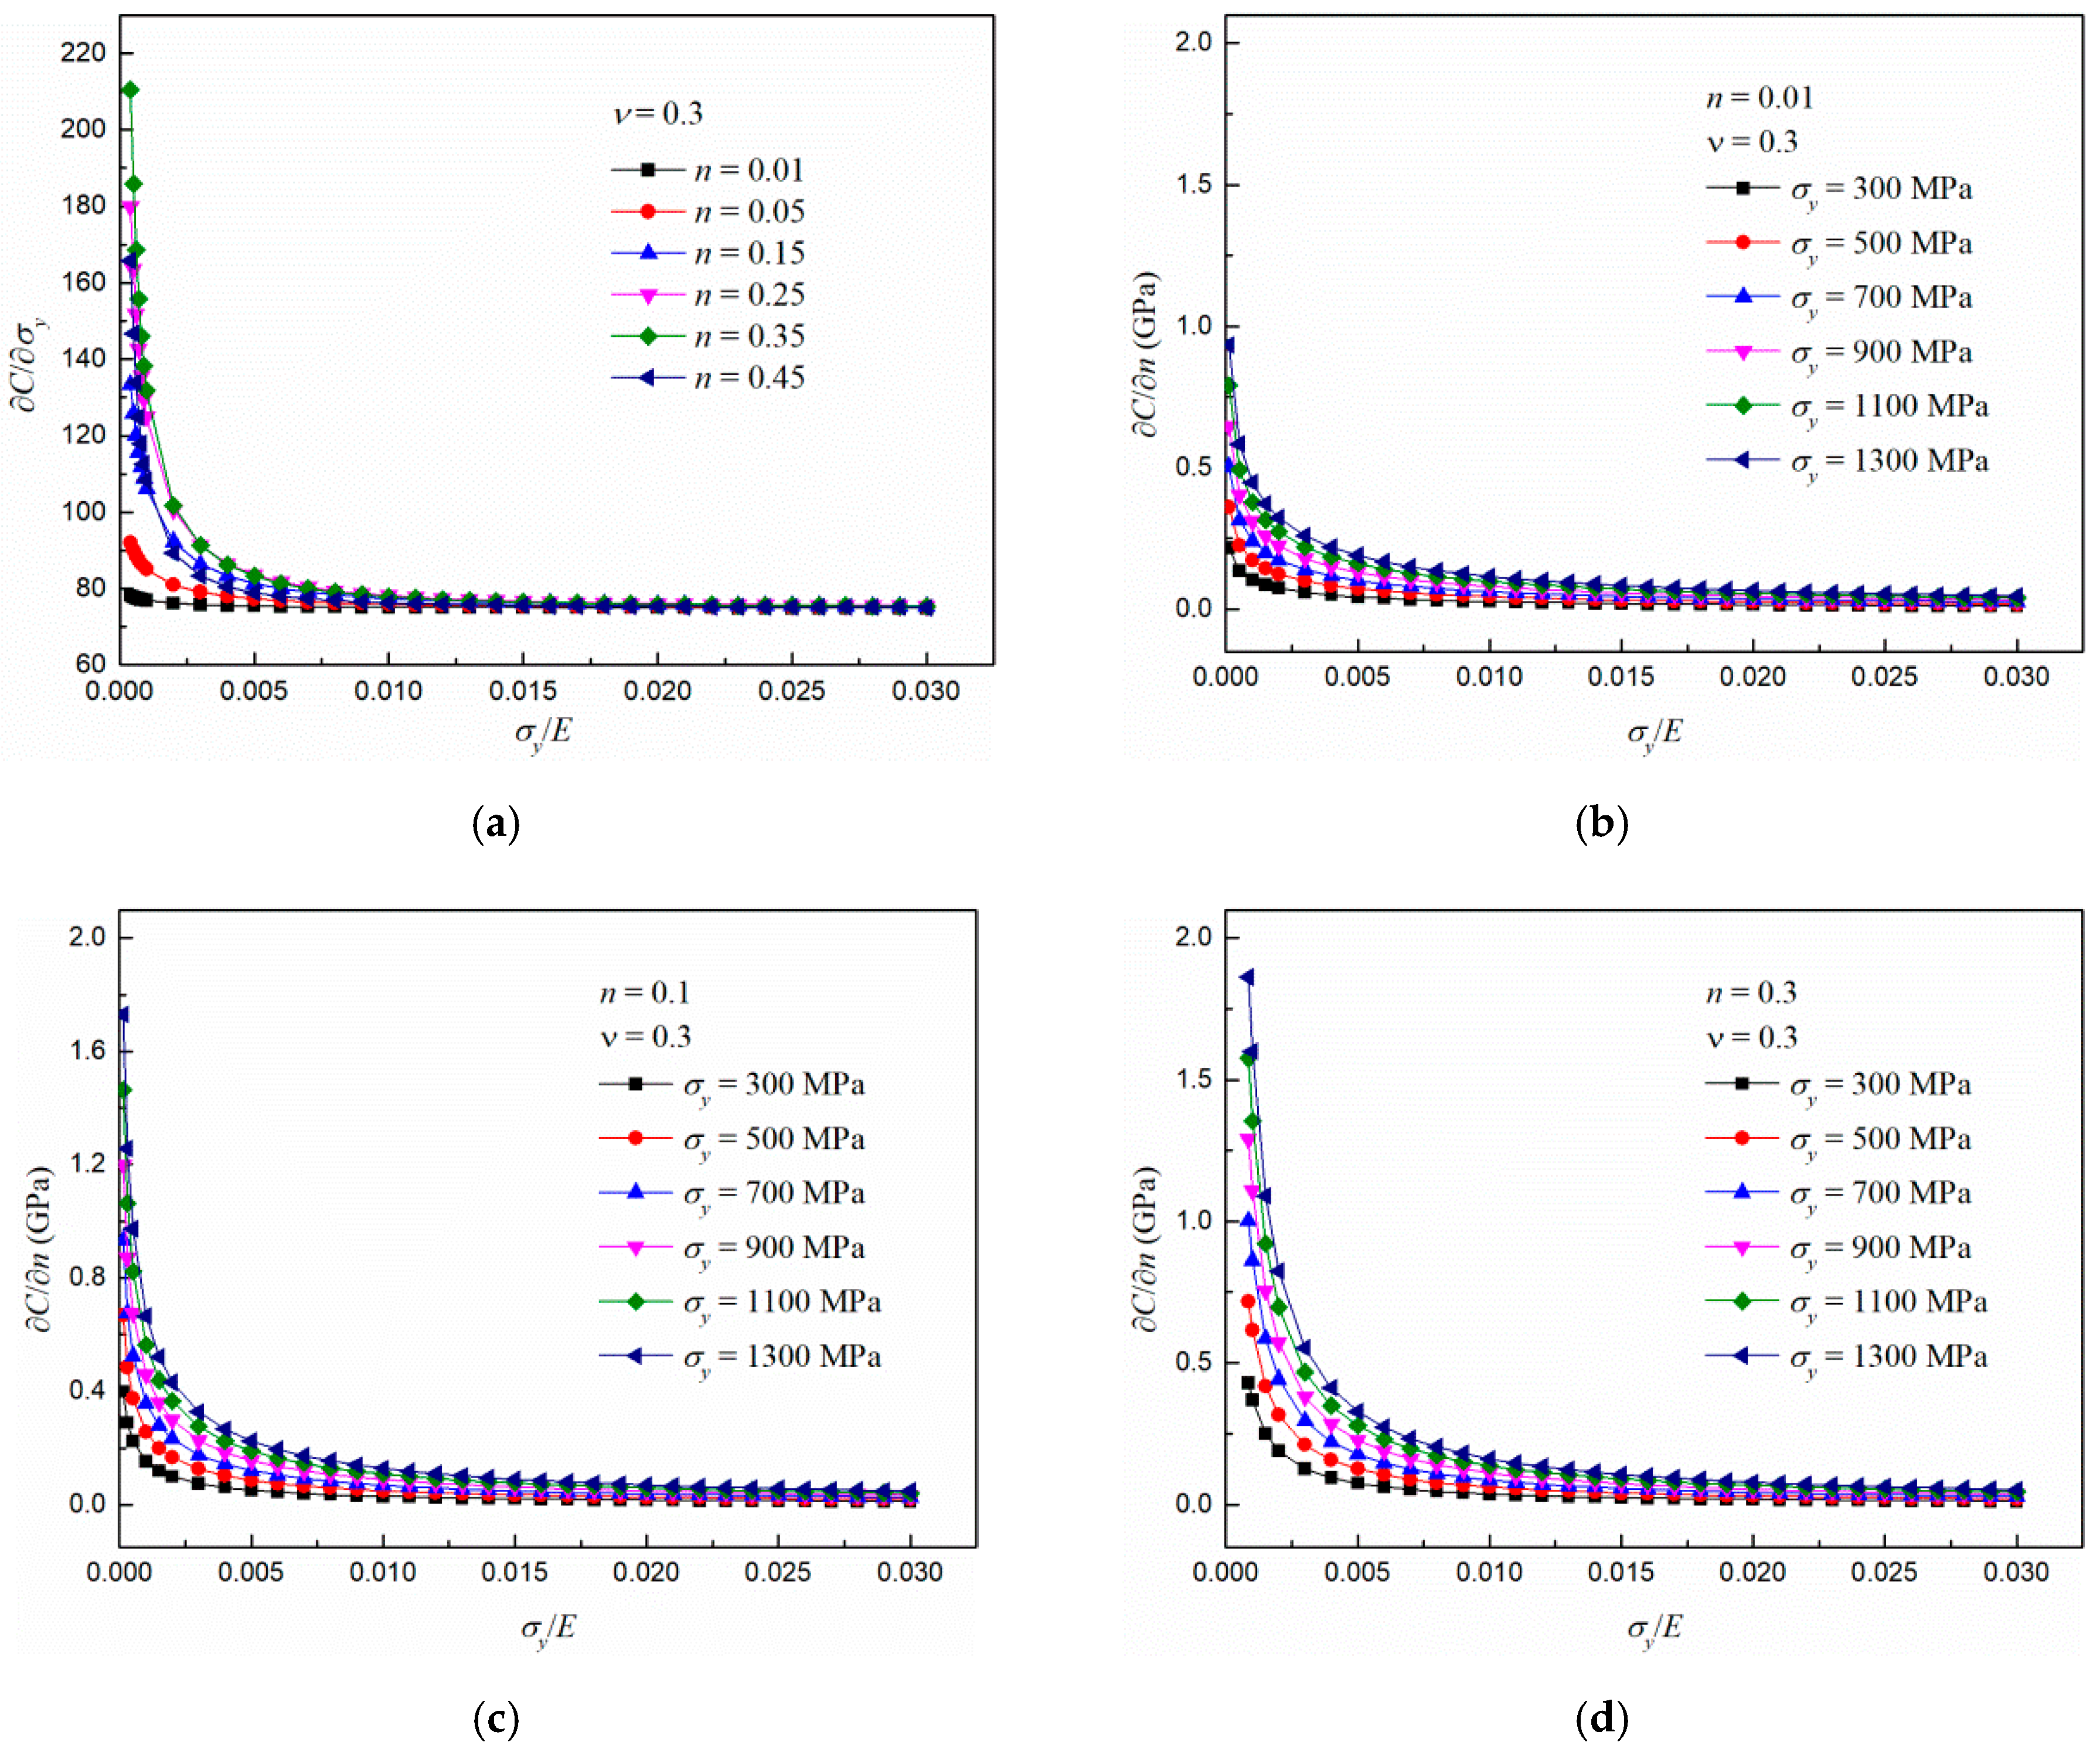
- The nanoindentation loading curvature C increases with increasing Young’s modulus E, yield stress , strain hardening exponent n and Poisson’s ratio because the equivalent stress increases. The increase rates and decrease gradually with increasing E and , respectively. The increase rate increases gradually with n, and the increase rate remains constant with increasing .
- The influence of E on C can be intensified with increasing , n and . The influence of on C can be intensified with increasing E and . n has little effect on the increase rate . The influence of n on C can be intensified with increasing E and . However, does not affect the increase rate . The influence of on C can be intensified with increasing E, , and n.
Author Contributions
Funding
Conflicts of Interest
References
- Li, X.; Bhushan, B. A review of nanoindentation continuous stiffness measurement technique and its applications. Mater. Charact. 2002, 48, 11–36. [Google Scholar] [CrossRef]
- Bull, S.J. Nanoindentation of coatings. J. Phys. D Appl. Phys. 2005, 38, R393–R413. [Google Scholar] [CrossRef]
- Kalidindi, S.R.; Mohan, S.; Rossi, A. Mechanical Characterization of Mesoscale Interfaces Using Indentation Techniques. JOM 2016, 69, 22–29. [Google Scholar] [CrossRef] [Green Version]
- Gou, R.-B.; Dan, W.-J.; Zhang, W.-G.; Yu, M. Research on flow behaviors of the constituent grains in ferrite–martensite dual phase steels based on nanoindentation measurements. Mater. Res. Express 2017, 4, 076510. [Google Scholar] [CrossRef]
- Yang, G.-Y.; Peng, H.; Guo, H.-B.; Gong, S.-K. Deposition of TiN/TiAlN multilayers by plasma-activated EB-PVD: Tailored microstructure by jumping beam technology. Rare Met. 2016, 36, 651–658. [Google Scholar] [CrossRef]
- Dhakar, B.; Chatterjee, S.; Sabiruddin, K. Measuring mechanical properties of plasma-sprayed alumina coatings by nanoindentation technique. Mater. Sci. Technol. 2016, 33, 285–293. [Google Scholar] [CrossRef]
- Liu, Y.; Zhao, X.; Wang, D. Determination of the plastic properties of materials treated by ultrasonic surface rolling process through instrumented indentation. Mater. Sci. Eng. A 2014, 600, 21–31. [Google Scholar] [CrossRef]
- Kim, S.-H.; Kim, Y.-C.; Lee, S.; Kim, J.-Y. Evaluation of tensile stress-strain curve of electroplated copper film by characterizing indentation size effect with a single nanoindentation. Met. Mater. Int. 2017, 23, 76–81. [Google Scholar] [CrossRef]
- Oliver, W.; Pharr, G. Measurement of hardness and elastic modulus by instrumented indentation: Advances in understanding and refinements to methodology. J. Mater. Res. 2004, 19, 3–20. [Google Scholar] [CrossRef]
- Cheng, Y.-T.; Cheng, C.-M. Scaling, dimensional analysis, and indentation measurements. Mater. Sci. Eng. R Rep. 2004, 44, 91–149. [Google Scholar] [CrossRef]
- Fischer-Cripps, A. Critical review of analysis and interpretation of nanoindentation test data. Surf. Coatings Technol. 2006, 200, 4153–4165. [Google Scholar] [CrossRef]
- Shim, S.; Jang, J.-I.; Pharr, G.M. Extraction of flow properties of single-crystal silicon carbide by nanoindentation and finite-element simulation. Acta Mater. 2008, 56, 3824–3832. [Google Scholar] [CrossRef]
- Kang, J.; Becker, A.; Sun, W. Determining elastic–plastic properties from indentation data obtained from finite element simulations and experimental results. Int. J. Mech. Sci. 2012, 62, 34–46. [Google Scholar] [CrossRef]
- Wang, Y.-M.; Zhuang, W.; Yang, H.-P.; Zhang, C.-H. Determination of mechanical properties of pure zirconium processed by surface severe plastic deformation through nanoindentation. Rare Met. 2019, 38, 824–831. [Google Scholar] [CrossRef]
- Lu, L.; Dao, M.; Kumar, P.; Ramamurty, U.; Karniadakis, G.E.; Suresh, S. Extraction of mechanical properties of materials through deep learning from instrumented indentation. Proc. Natl. Acad. Sci. USA 2020, 117, 7052–7062. [Google Scholar] [CrossRef] [PubMed] [Green Version]
- Qin, F.; Xiang, M.; Wu, W. The stress-strain relationship of TSV-Cu determined by nanoindentation. Acta Metall. Sin. 2014, 50, 722–726. [Google Scholar]
- Liu, X.; Zhao, X.; Yang, X.; Jia, J. Nanoindentation study on mechanical properties of commercially pure Ti processed by ECAP. Rare Met. Mater. Eng. 2017, 46, 669–674. [Google Scholar]
- Antunes, J.; Fernandes, J.; Menezes, L.; Chaparro, B. A new approach for reverse analyses in depth-sensing indentation using numerical simulation. Acta Mater. 2007, 55, 69–81. [Google Scholar] [CrossRef] [Green Version]
- Jha, K.K.; Suksawang, N.; Agarwal, A. Analytical method for the determination of indenter constants used in the analysis of nanoindentation loading curves. Scr. Mater. 2010, 63, 281–284. [Google Scholar] [CrossRef]
- Merle, B.; Maier, V.; Durst, K. Experimental and theoretical confirmation of the scaling exponent 2 in pyramidal load displacement data for depth sensing indentation. Scanning 2014, 36, 526–529. [Google Scholar] [CrossRef]
- Pham, T.-H.; Kim, J.J.; Kim, S.-E. Estimating constitutive equation of structural steel using indentation. Int. J. Mech. Sci. 2015, 90, 151–161. [Google Scholar] [CrossRef]
- Giannakopoulos, A.; Larsson, P.-L.; Vestergaard, R. Analysis of Vickers indentation. Int. J. Solids Struct. 1994, 31, 2679–2708. [Google Scholar] [CrossRef]
- Giannakopoulos, A.; Suresh, S. Determination of elastoplastic properties by instrumented sharp indentation. Scr. Mater. 1999, 40, 1191–1198. [Google Scholar] [CrossRef] [Green Version]
- Venkatesh, T.; Van Vliet, K.; Giannakopoulos, A.; Suresh, S. Determination of elasto-plastic properties by instrumented sharp indentation: Guidelines for property extraction. Scr. Mater. 2000, 42, 833–839. [Google Scholar] [CrossRef]
- Dao, M.; Chollacoop, N.; Van Vliet, K.; Venkatesh, T.; Suresh, S. Computational modeling of the forward and reverse problems in instrumented sharp indentation. Acta Mater. 2001, 49, 3899–3918. [Google Scholar] [CrossRef] [Green Version]
- Chen, H.; Cai, L.-X. Theoretical model for predicting uniaxial stress-strain relation by dual conical indentation based on equivalent energy principle. Acta Mater. 2016, 121, 181–189. [Google Scholar] [CrossRef]
- Cheng, Y.-T.; Cheng, C.-M. Analysis of indentation loading curves obtained using conical indenters. Philos. Mag. Lett. 1998, 77, 39–47. [Google Scholar] [CrossRef]
- Zeng, K.; Shen, L. A new analysis of nanoindentation load-displacement curves. Philos. Mag. A 2002, 82, 2223–2229. [Google Scholar] [CrossRef]
- Malzbender, J.; de With, G. Indentation load–displacement curve, plastic deformation, and energy. J. Mater. Res. 2002, 17, 502–511. [Google Scholar] [CrossRef]
- Lichinchi, M.; Lenardi, C.; Haupt, J.; Vitali, R. Simulation of Berkovich nanoindentation experiments on thin films using finite element method. Thin Solid Films 1998, 312, 240–248. [Google Scholar] [CrossRef] [Green Version]
- Khan, M.K.; Hainsworth, S.; Fitzpatrick, M.; Edwards, L. A combined experimental and finite element approach for determining mechanical properties of aluminium alloys by nanoindentation. Comput. Mater. Sci. 2010, 49, 751–760. [Google Scholar] [CrossRef]
- Lee, J.; Lee, C.; Kim, B. Reverse analysis of nano-indentation using different representative strains and residual indentation profiles. Mater. Des. 2009, 30, 3395–3404. [Google Scholar] [CrossRef]
- Akatsu, T.; Numata, S.; Demura, T.; Shinoda, Y.; Wakai, F. Representative indentation elastic modulus evaluated by unloading of nanoindentation made with a point sharp indenter. Mech. Mater. 2015, 83, 66–71. [Google Scholar] [CrossRef]


| Material | Mechanical Property | C (GPa) | |||||||
|---|---|---|---|---|---|---|---|---|---|
| E (GPa) | σy (MPa) | n | ν | Experiment | Calculation | ||||
| Present Equation | Venkatesh et al. [24] | Dao et al. [25] | Chen et al. [26] | ||||||
| Al 6061-T6511 [25] | 66.8 | 284 | 0.08 | 0.33 | 27.4 a | 25.8 | 19.0 | 27.8 | 28.1 |
| Al 7075-T651 [25] | 70.1 | 500 | 0.122 | 0.33 | 42.7 a | 46.1 | 31.8 | 43.8 | 42.3 |
| Al 6061-T6 [31] | 70.6 | 331.7 | 0.081 | 0.33 b | 33.9 c | 30.0 | 21.7 | 31.6 | 31.8 |
| AISI 1010 [31] | 209.6 | 210.6 | 0.249 | 0.3 d | 46.9 c | 47.0 | 38.4 | 46.3 | 47.5 |
| AISI 1045 [31] | 210.3 | 337.1 | 0.202 | 0.3 d | 59.3 c | 52.1 | 42.8 | 55.6 | 57.7 |
| Al 2024-T351 [32] | 68 | 360 | 0.08 | 0.33 | 36.0 e | 32.0 | 22.7 | 33.1 | 33.0 |
Publisher’s Note: MDPI stays neutral with regard to jurisdictional claims in published maps and institutional affiliations. |
© 2020 by the authors. Licensee MDPI, Basel, Switzerland. This article is an open access article distributed under the terms and conditions of the Creative Commons Attribution (CC BY) license (http://creativecommons.org/licenses/by/4.0/).
Share and Cite
Yang, H.; Zhuang, W.; Yan, W.; Wang, Y. Influence of the Mechanical Properties of Elastoplastic Materials on the Nanoindentation Loading Response. Materials 2020, 13, 4842. https://doi.org/10.3390/ma13214842
Yang H, Zhuang W, Yan W, Wang Y. Influence of the Mechanical Properties of Elastoplastic Materials on the Nanoindentation Loading Response. Materials. 2020; 13(21):4842. https://doi.org/10.3390/ma13214842
Chicago/Turabian StyleYang, Huanping, Wei Zhuang, Wenbin Yan, and Yaomian Wang. 2020. "Influence of the Mechanical Properties of Elastoplastic Materials on the Nanoindentation Loading Response" Materials 13, no. 21: 4842. https://doi.org/10.3390/ma13214842