3.3.1. Determination of Critical Temperature and Strain Rate
Generally, Zener–Hollomon parameter can be considered as a criterion of DRX. Many researchers [
23,
24] reported that the lower lnZ is, the easier the occurrence of DRX is. For determining lnZ, the logarithmic equation for describing the relationship between lnZ and the deformation parameters was adopted, as shown in Equation (1) [
10]:
where,
is the strain rate (S
−1),
T is the temperature (K),
Q denotes the activation energy (J mol
−1), and
R is a constant (8.314 J mol
−1 K
−1). In order to get lnZ under different deformation conditions, the Arrhenius constitutive equation was employed, as described by Equation (2) [
26]:
where [
26]:
Therein,
is the flow stress (MPa),
n1,
β, α,
n are material constants and
α = β/n1. Substituting Equation (3) into Equation (2), then taking the natural logarithms of both sides, then Equations (4)–(6) are obtained:
By transforming the Equations (4)–(6) and taking partial differentiation, the following expression are obtained:
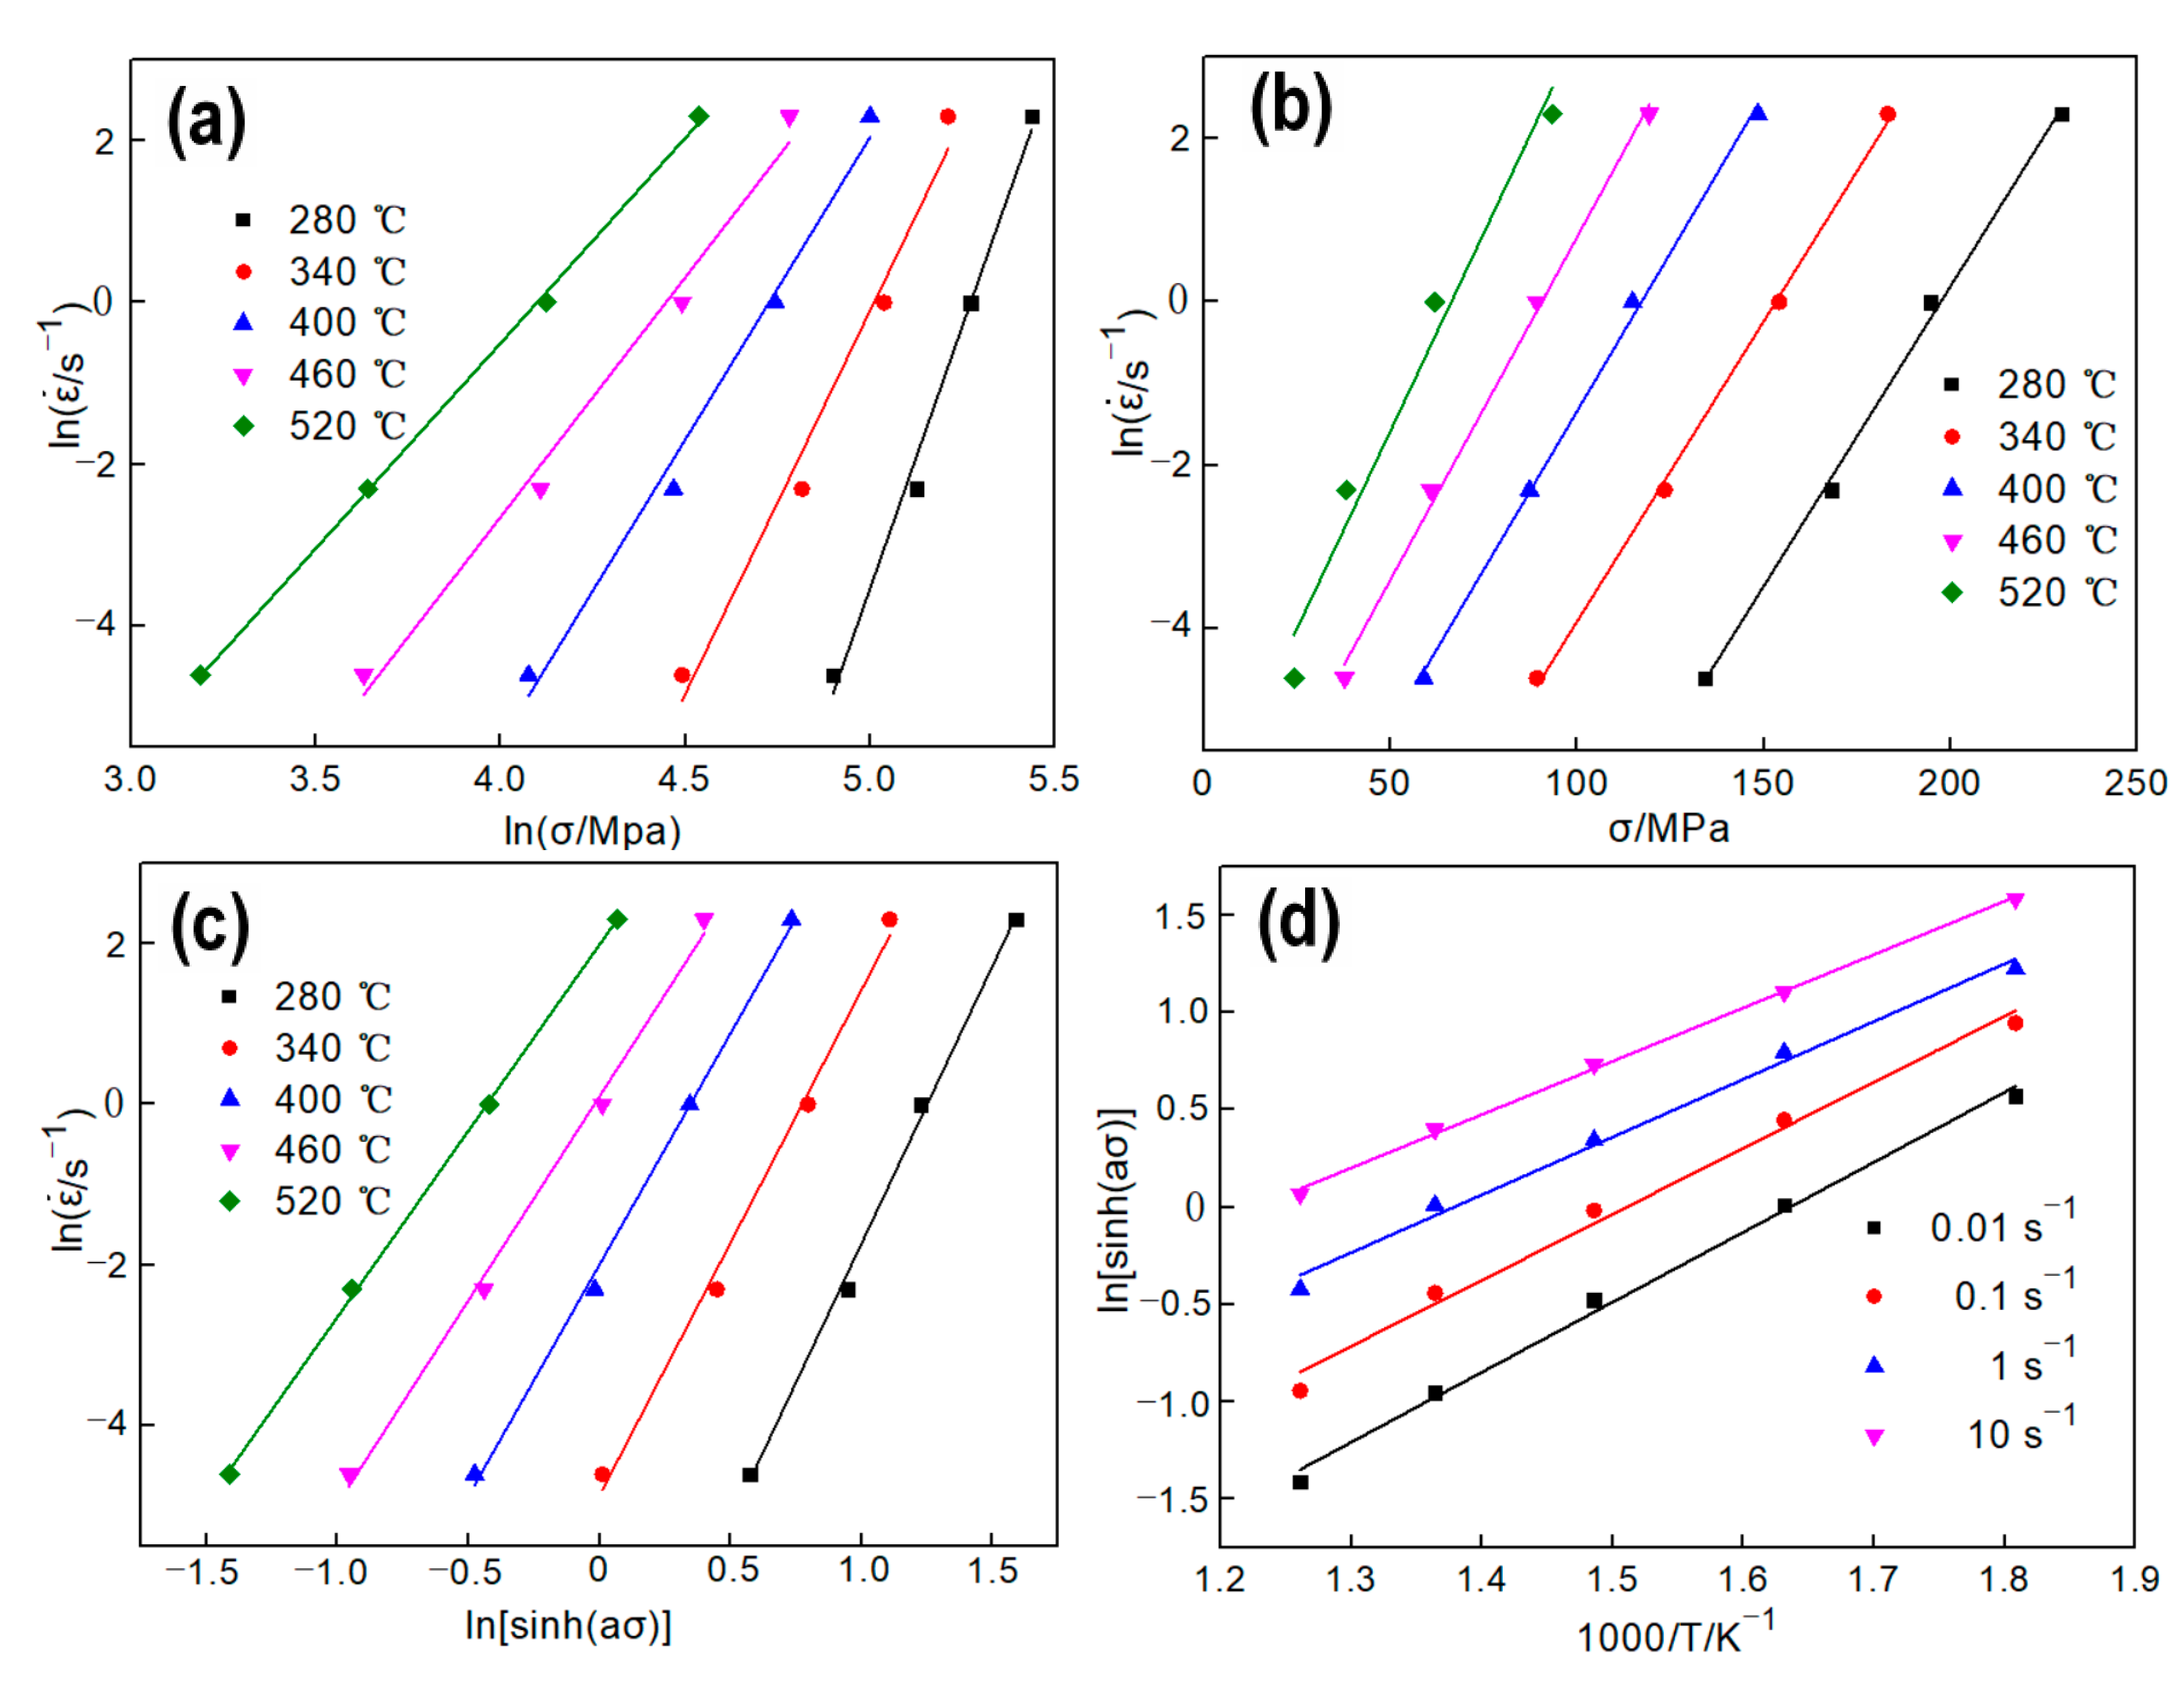
Substituting the peak flow stress data at various deformation conditions into Equations (7) and (8), as shown in
Figure 4a,b,
and
β can be calculated through the mean slopes by plotting
and
under difference deformation temperatures, respectively. Thus,
= 8.197,
β = 0.0817, and
α =
β/ = 0.00997. similarly,
n and
S can be obtained from
Figure 4c and
Figure 4d, respectively. Thus,
n = 3.4519 and
S = 6.0886. Substituting the above material coefficients into Equation (10), the average value of
Q = 174.7 KJ/mol can be got, which is close to the result (168.61 KJ/mol) of Ref. [
10]. As reported in Refs. [
20,
22], the average Q is usually employed into Equation (3) to calculate the lnZ at different deformation conditions.
Table 2 shows the lnZ of the experimental samples in each condition of this paper. It can be found in
Table 2 that the value of lnZ decreases with the increasing of deformation temperature and increases with the increasing of strain rate. According to
Table 1 and
Table 2, it is not the lower lnZ is, the easier the occurrence of DRX is. For example, DRX occurs in the samples under deformation condition of 340 °C/10s
−1, but no DRX occurs in the 400 °C/0.01 s
−1, and their lnZ equals to 36.6 and 26.6, respectively. These results are inconsistent with results of 99.99% polycrystalline aluminum reported by [
24]. In [
24], there is an obvious relationship between Z parameter and DRX, DRX takes place when lnZ < 28, and only DRV takes place when lnZ > 28.
It is generally believed that increasing temperature is beneficial to atom migration and dislocation movement, whereas increasing strain rate is beneficial to energy accumulation in the samples during hot deformation processing. The coupling effects of the deformation temperature and strain rate is complex. When describing the critical conditions of DRX, Z parameter reflects the sum of the contribution of strain rate and deformation temperature to DRX, however, it is a general relationship, and the weighting factors of deformation temperature and strain rate that contribute to DRX are not considered. Additionally, lnZ in
Table 2 was calculated using the average Q of the whole experimental range, which affected the accuracy of calculation. Therefore, in a wide range of process parameters, due to the complexity of the coupling effects between strain rate and deformation temperature, it is not appropriate to use the value of lnZ in
Table 2 to describe the critical conditions of DRX.
Generally, deformation activation energy Q is an important physical parameter for hot deformation processing. The higher the Q is, the more difficult of the sample is to be deformed, and vice versa. When DRX occurs, deformation is easy to perform. Therefore, Q may be more suitable than lnZ to determine the critical deformation temperature and critical strain rate:
Then, Equation (10) can be expressed as:
where,
n is the slope of the curve of
to ln[sinh(ασ)] at different temperature as shown in
Figure 4c, and
S is the slope of the curve of ln[sinh(ασ)] to 1/T at various strain rate as shown in
Figure 4d.
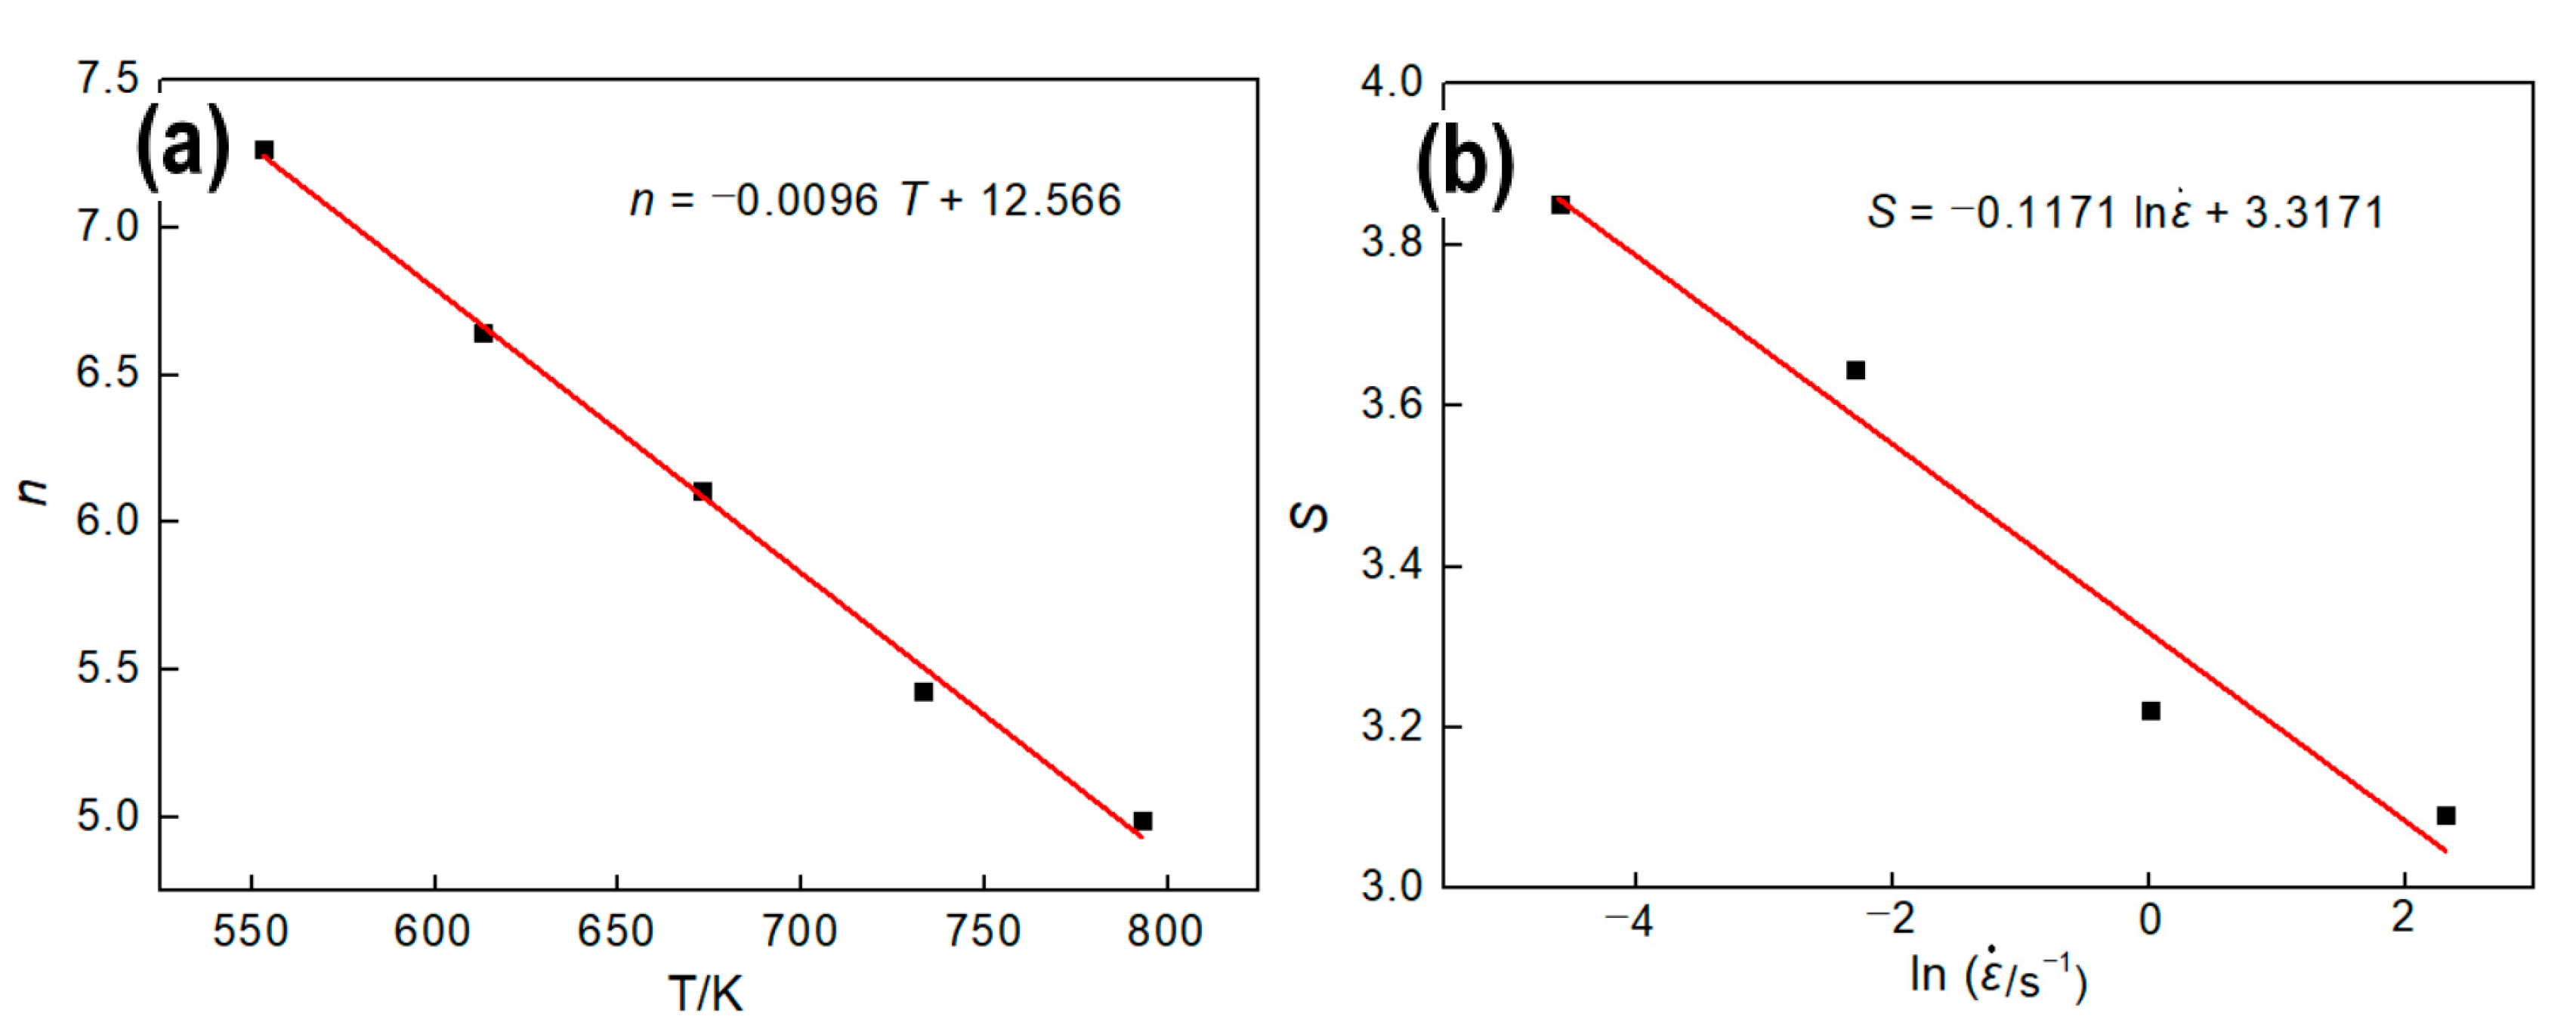
Figure 5 shows the relationship between
n and
T,
S and
.
Obviously,
n and
S can be described as Equation (13) by linear fitting:
Substitute Equation (13) to Equation (12),
Q can be written as Equation (14):
Equation (14) can be used to calculate the value of
Q under the whole deformation conditions, and the results are shown in
Table 3. Combining the microstructures of the samples and
Q of each deformation conditions, we can find that DRX occurred in the samples when the value of
Q is below 183.9 KJ/mol, and when
Q is higher than 183.9 KJ/mol, only DRV takes place. Therefore, Q can be used to describe critical temperature and strain rate of DRX.
As shown in
Table 3, Q value is significantly affected by deformation conditions, and taking the average Q to calculate lnZ under various deformation conditions will greatly affect the calculation accuracy. In order to obtain the exact value of lnZ, Equation (14) is substituted into Equation (1) and the calculation results are shown in
Table 4. Obviously, the value of lnZ changed a lot compared with
Table 2. As reported in [
20,
22] or in
Table 2 of this paper, lnZ decreases with the increasing of temperature or decreasing of strain rate since the lnZ is calculated by average Q. However, lnZ in
Table 4 of this paper decreases with the increasing of strain rate at 280~400℃ while increases at 460~520 °C when it is calculated by various Q. This indicates that in a wide deformation range, the calculation of lnZ by using average Q will not only affect the calculation results, but even fail to accurately reflect the variation rules of lnZ under different deformation conditions. Additionally, it can be found that lnZ is 35.5 under deformation condition of 340 °C/10s
−1 in
Table 4 and no DRX occurs in
Table 1, but lnZ equals 30.04 at 340 °C/10 s
−1 and DRX takes place in
Table 1. This indicates again that lnZ is not suitable as the temperature and strain rate coupled DRX critical conditions for Al-4.8Mg alloy, even though the lnZ was calculated by various Q. Compared with pure aluminum in Ref [
24], the added elements (Mg, Mn, Cr, etc.) of Al-4.8Mg alloy may have an great influence on DRX critical conditions of studied materials and change the critical conditions of dynamic recrystallization. This should be investigated in future research.
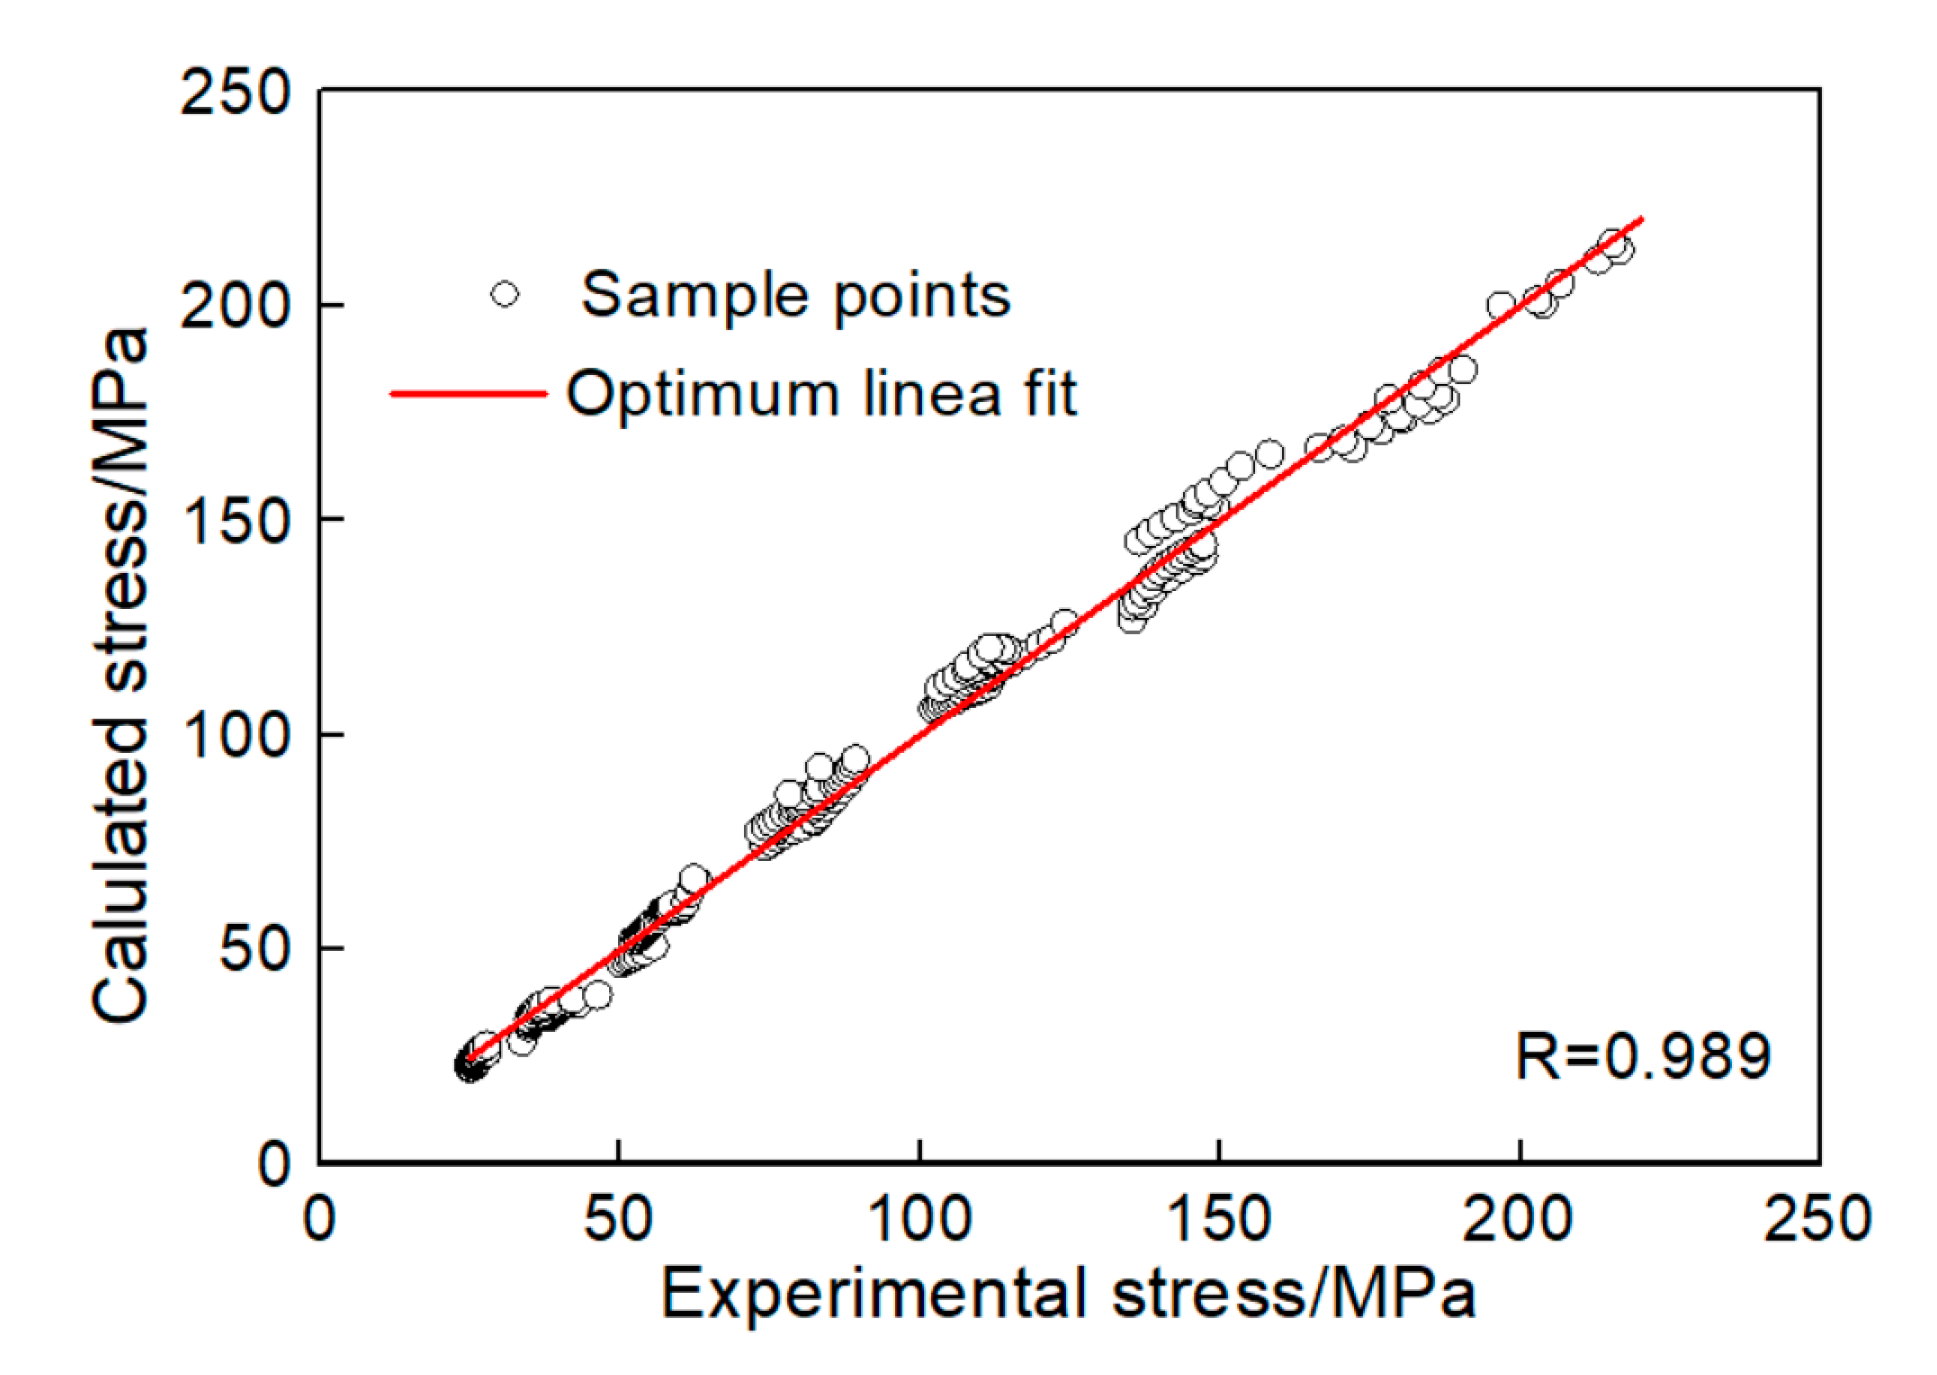
According to the above comparative analysis, it can be judged that the temperature and strain rate coupled DRX critical conditions of Al-4.8Mg alloy can be described by Q as Equation (15):
3.3.2. Determination of Critical Strain
Equation (15) can be used to determine the critical temperature and strain rate of DRX occurrence. However, during the deformation process, even if the temperature and strain rate conform to Equation (15), DRX will occur in the samples only when the strain meets a critical value [
20,
22]. Generally, the work-hardening rate
(
) was used to describe special point of stress-strain curve and determine the critical strain of DRX [
21,
22].
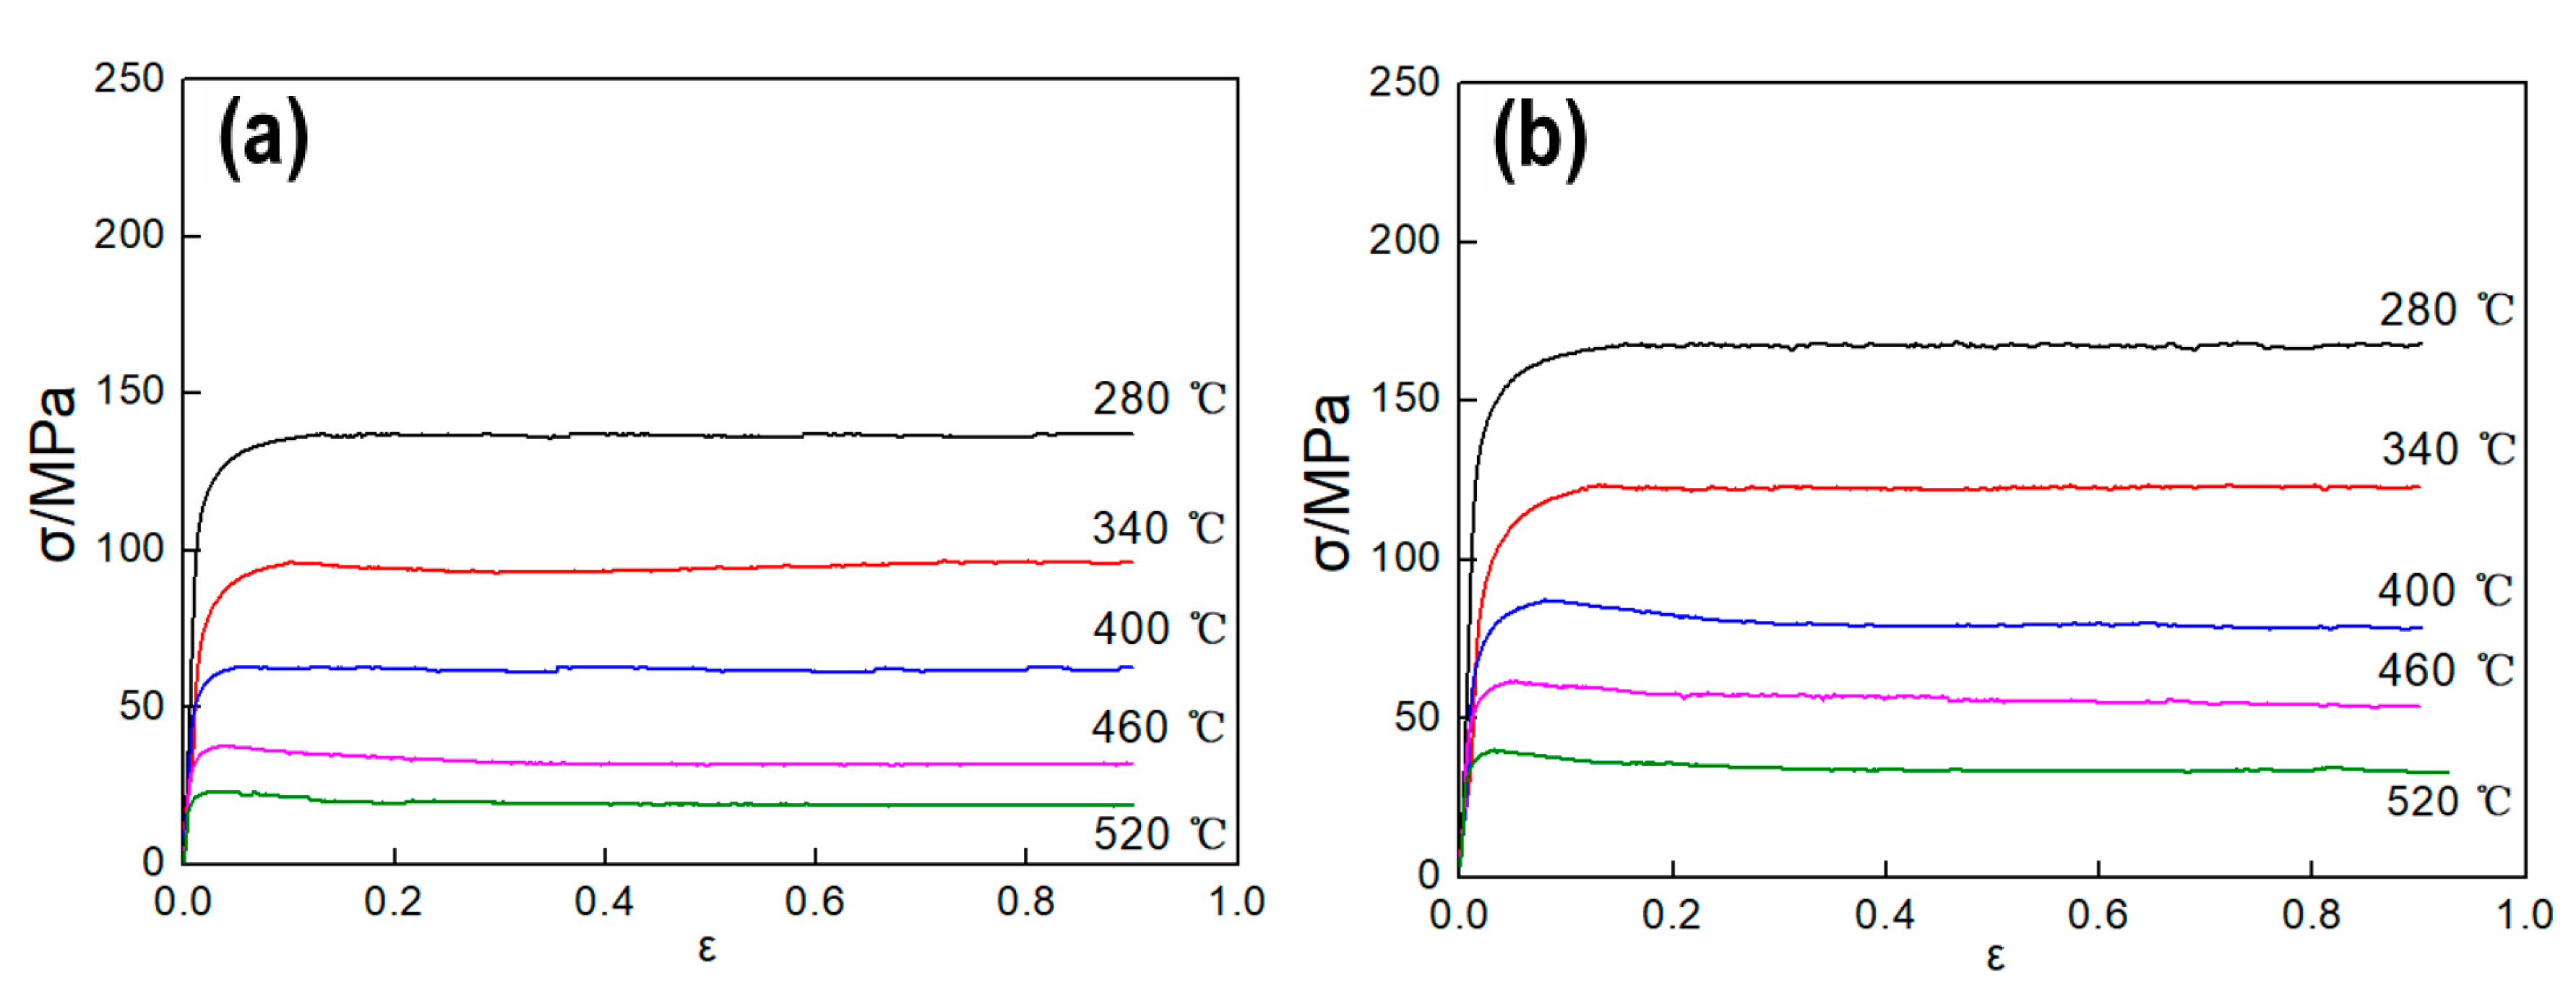
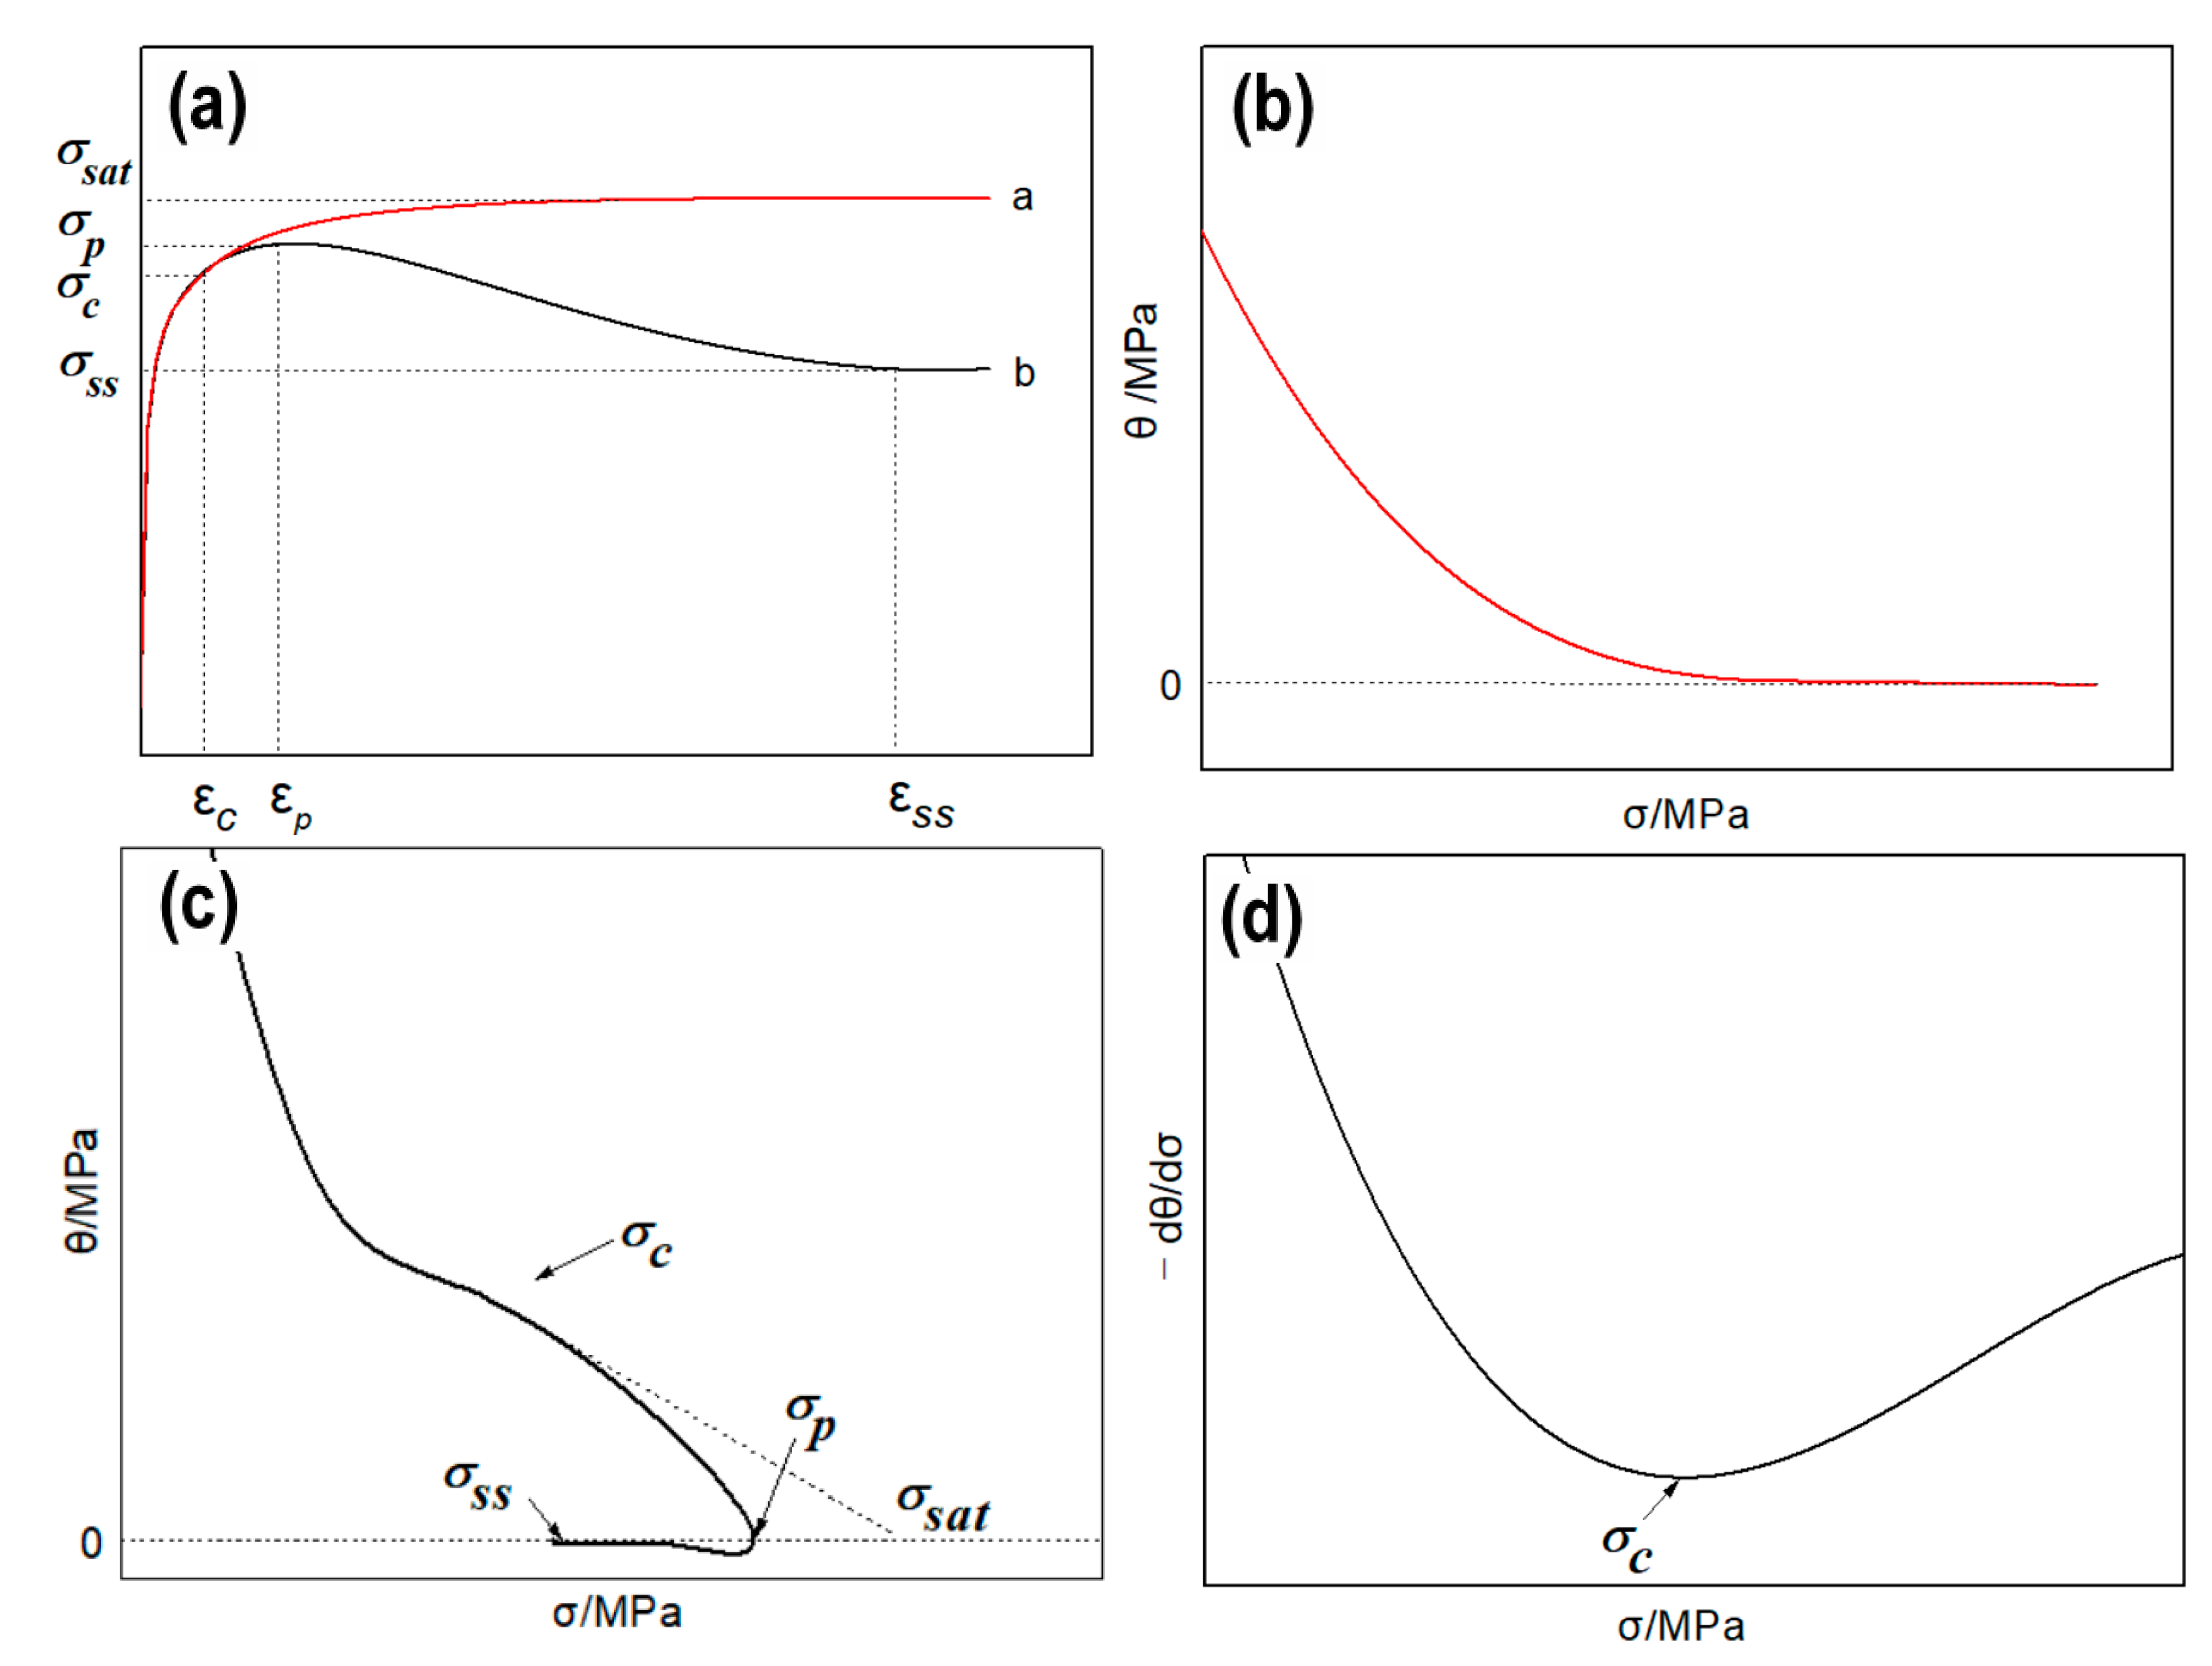
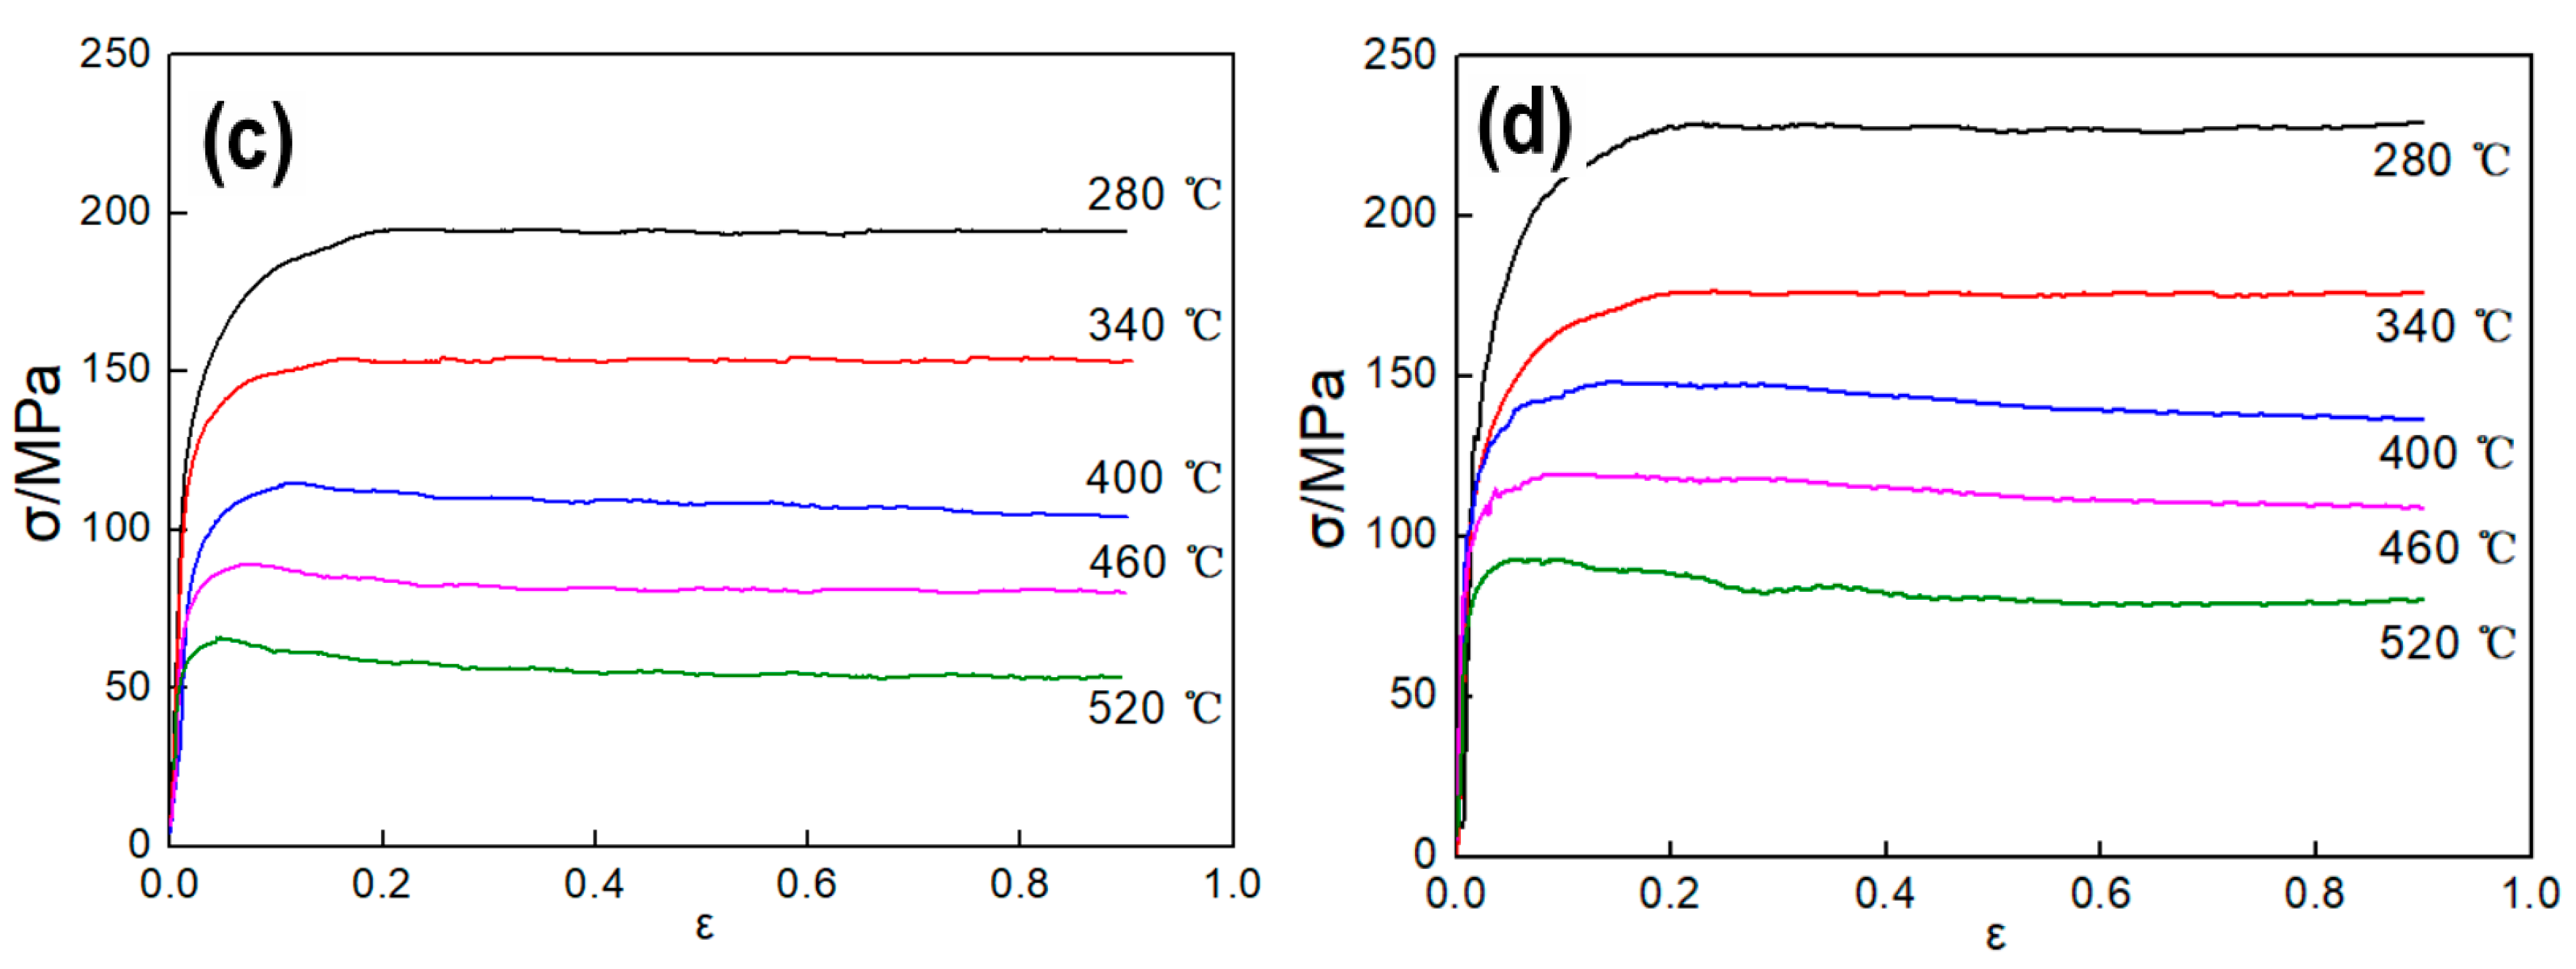
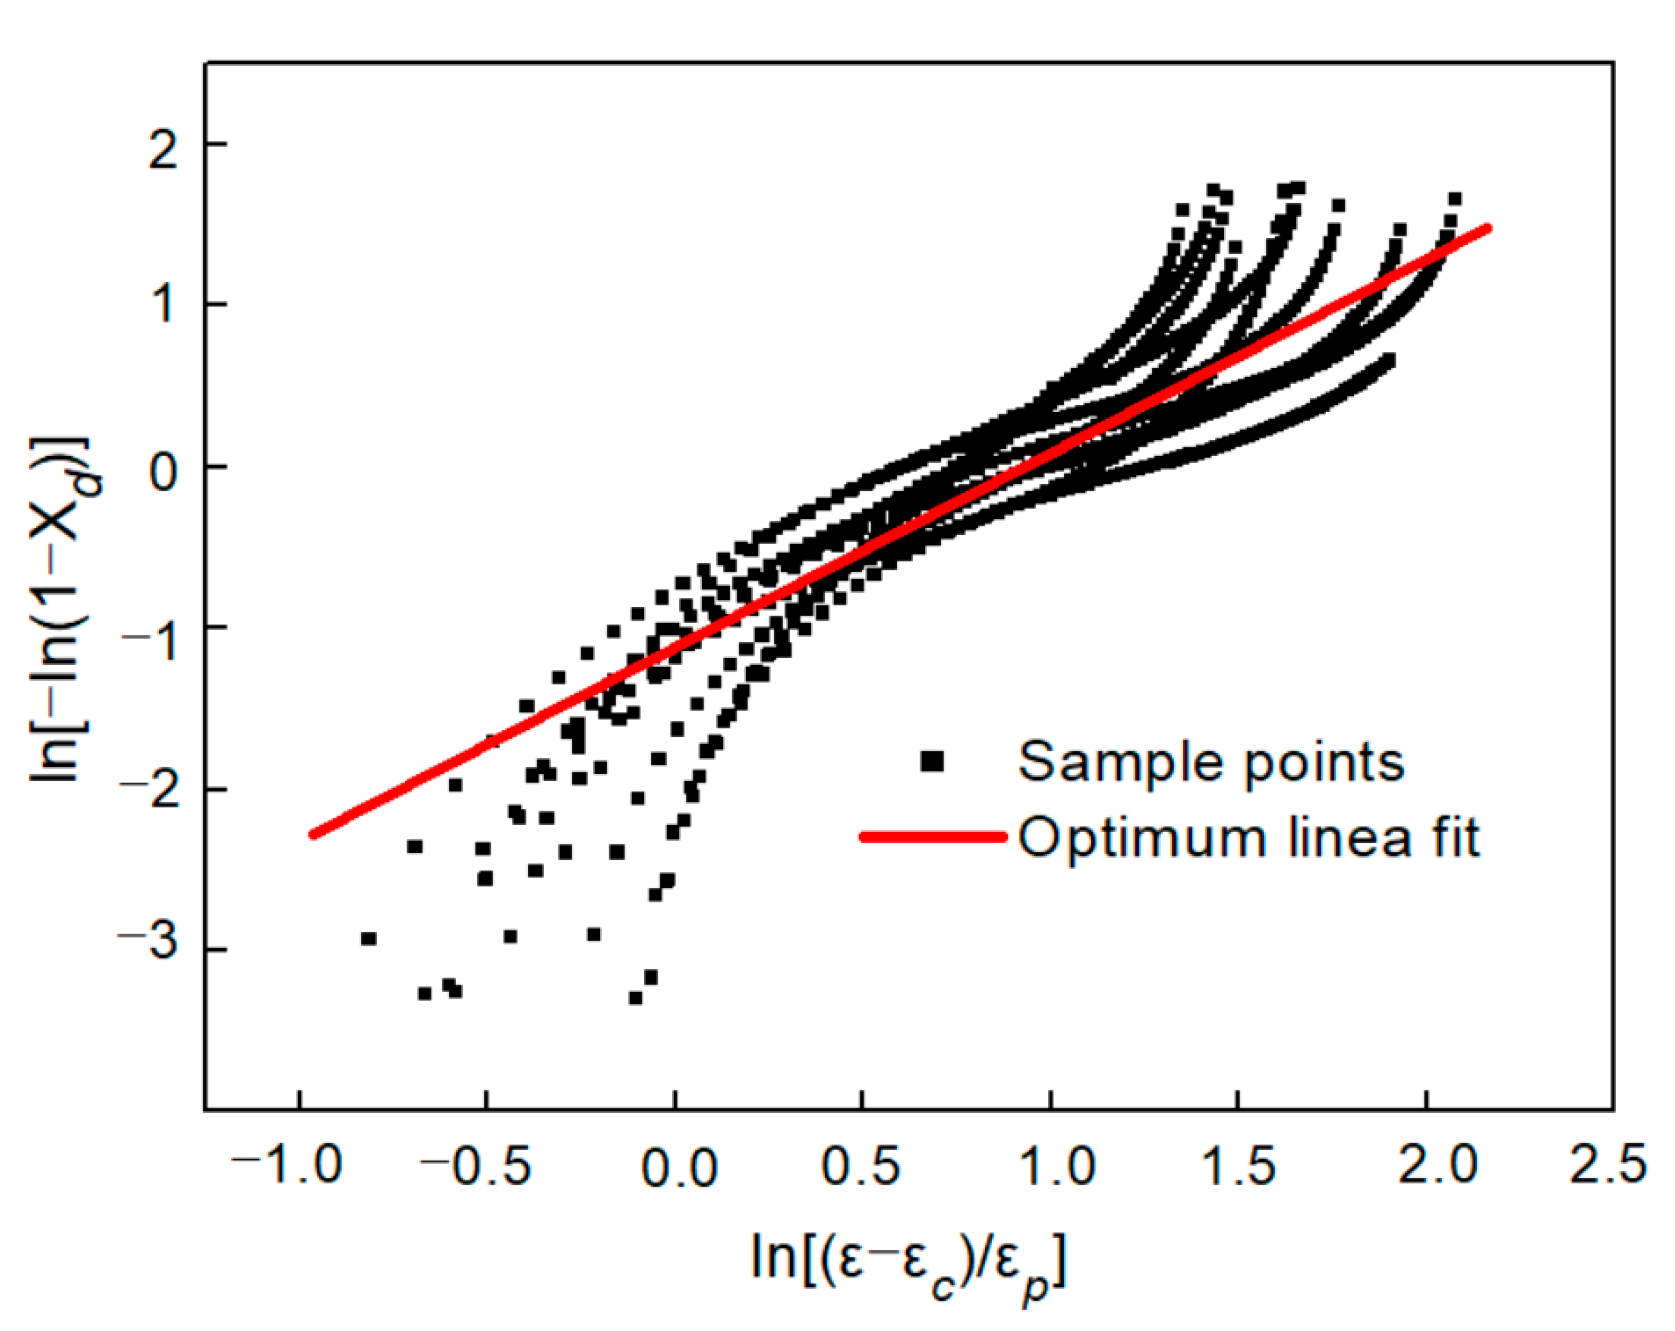
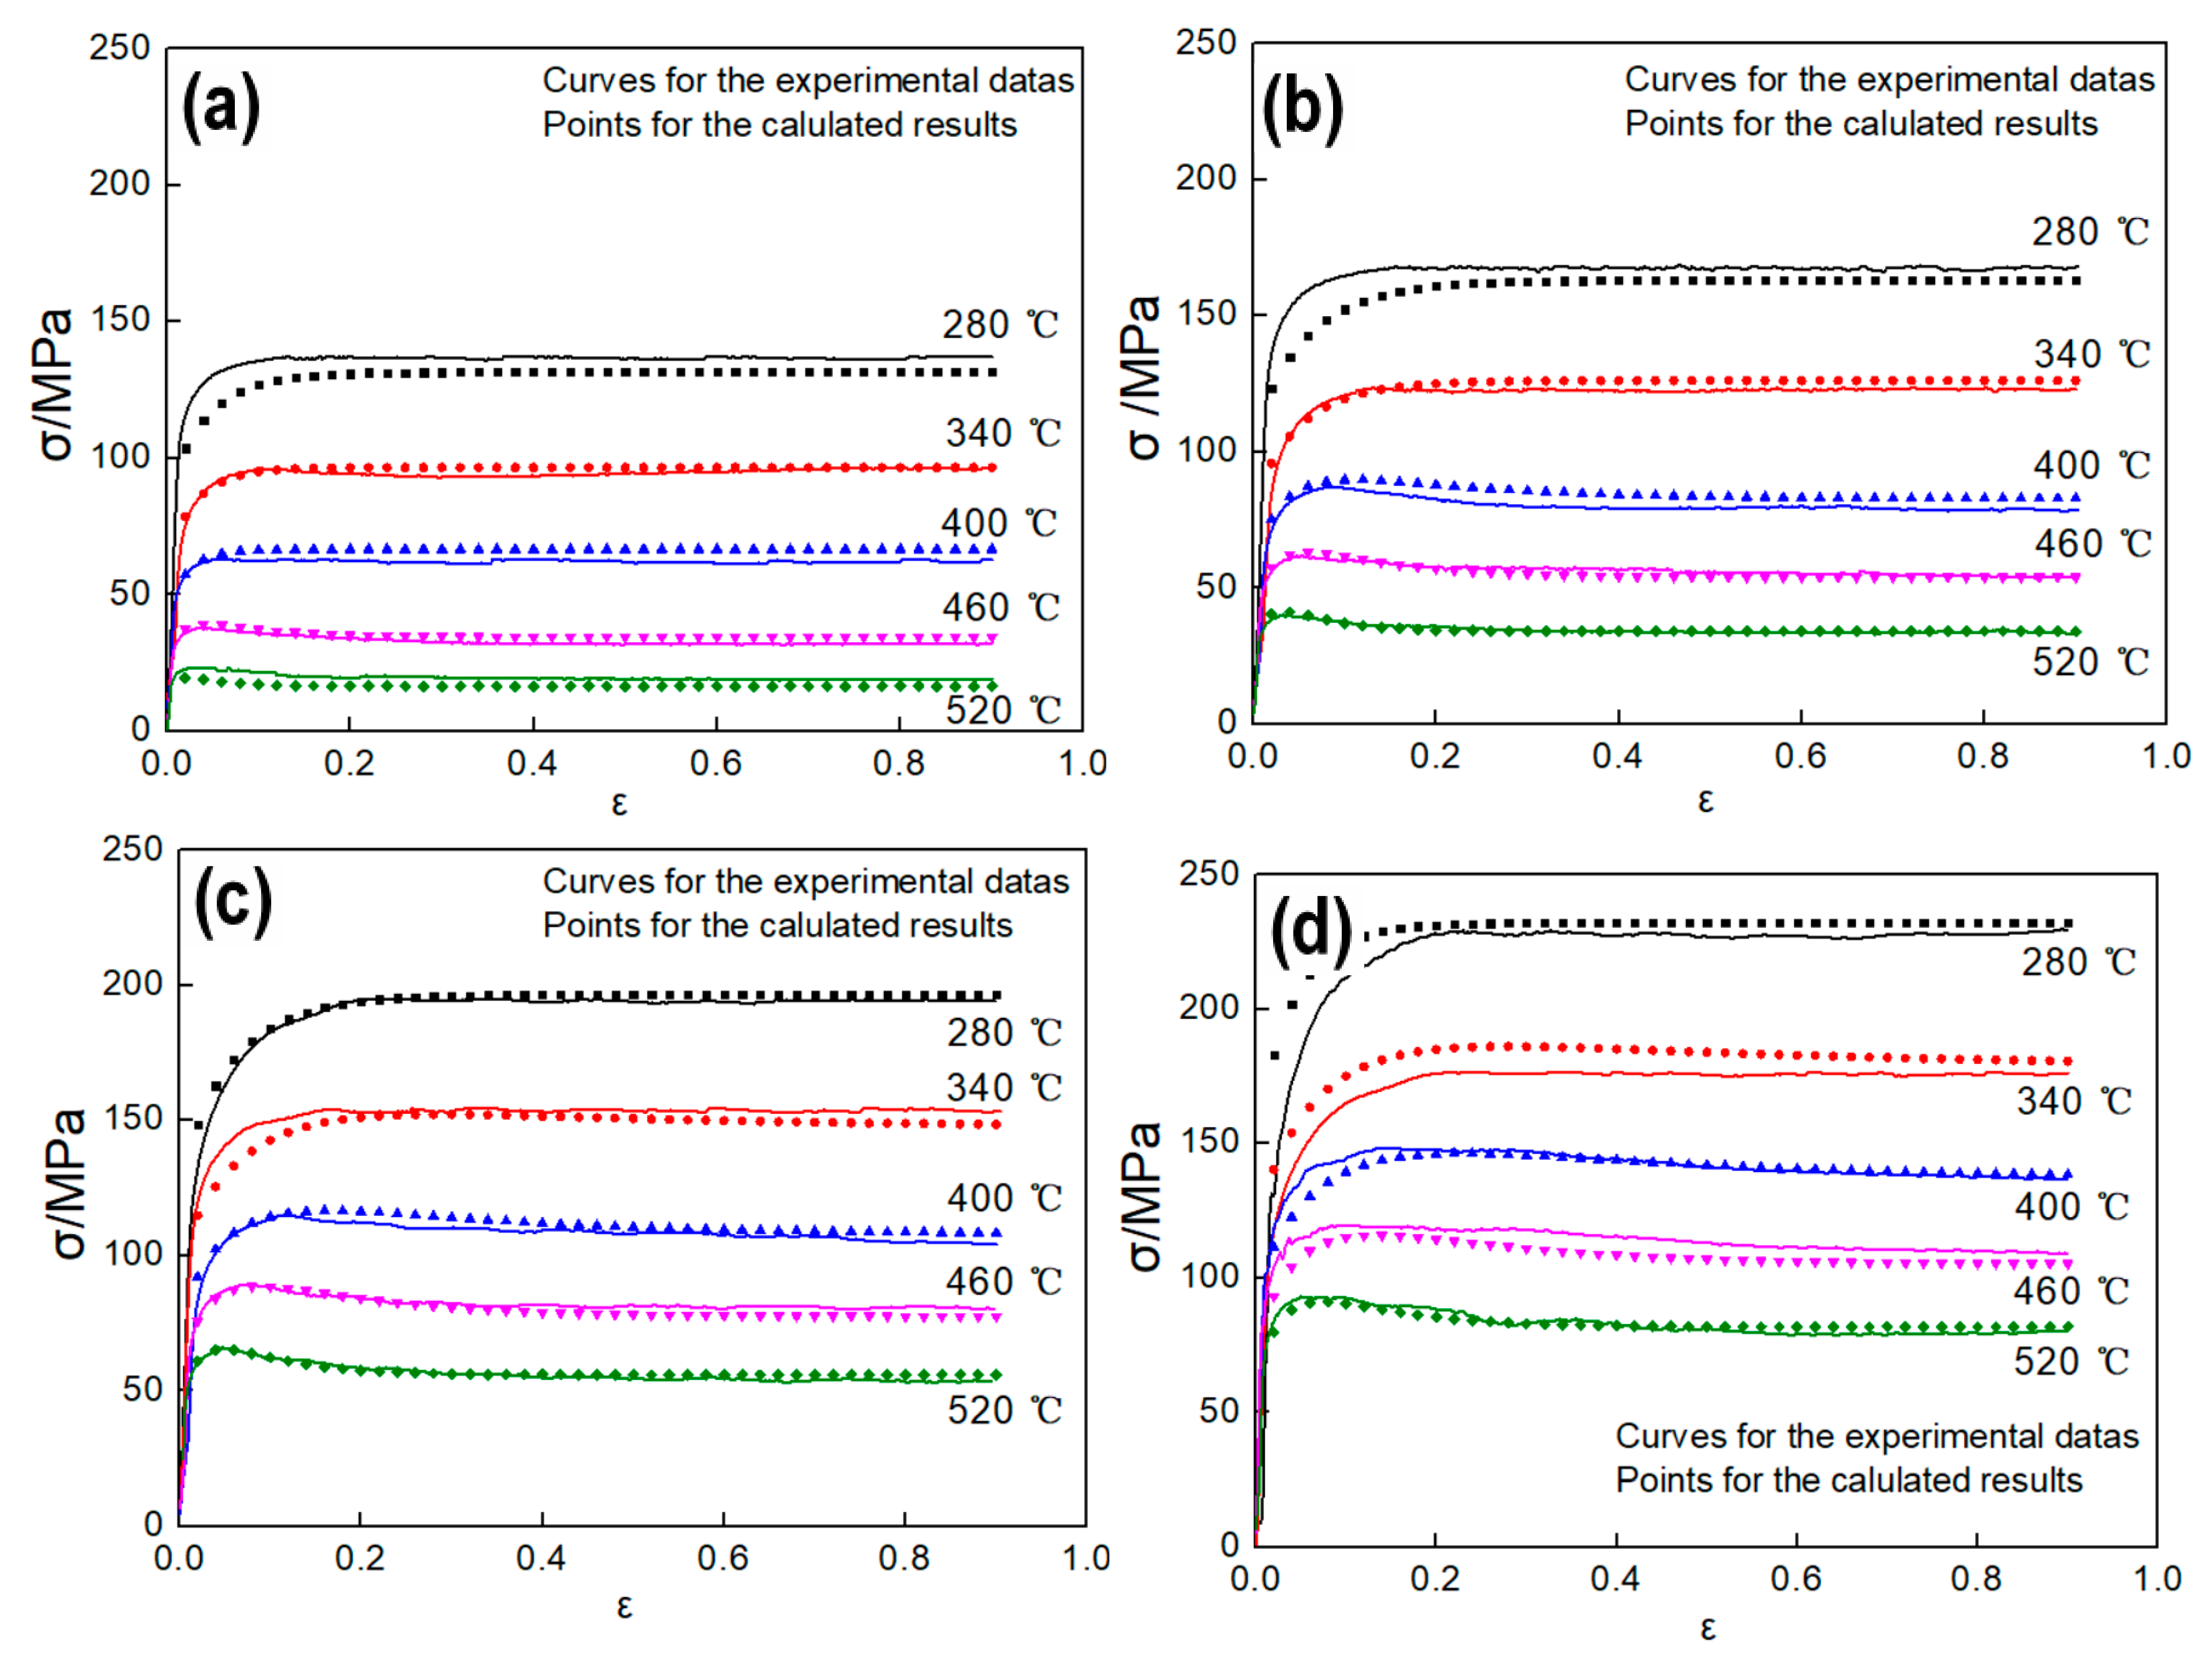
As shown in
Figure 6a, the stress curves can be divided into two different types. The ‘a’ curve is attributed to DRV dominated softening mechanism. The flow stress rapidly increases at the initial stage of the deformation due to the higher WH. When a balance between WH and DRV is reached, a saturation value (
) appears and remains constant. Therefore, as shown in the corresponding
curve (
Figure 6b),
gradually decreases to 0 with the increase of
. The ‘b’ curve marked is considered that DRX is the main softening mechanism. In WH stage, the flow stress rapidly increases to a critical stress (
) at the initial deformation stage due to the higher work-hardening. Once the strain exceeds the critical strain (
), DRX occurs and the flow stress step into softening stage. The flow stress continues to slowly increase to the peak stress (
), then begins to decrease until it reaches a steady stress (
). It can be seen from
Figure 6c, after a sharp decline,
decreases slowly until it reaches 0 (
). With the continuous development of deformation, the strain decreases further to the lowest value and then slowly rises to 0 (
). The turning point on the curve before the peak stress is considered as the critical stress point of DRX (
), which can be get from the lowest value of the
curve (
Figure 6d), then the corresponding
can be got directly from stress-strain curves of
Figure 2. Besides, the intersection between the tangent at the
and the abscissa is the
.
Based on the above analysis, the minimum value of the
curve under each deformation condition was calculated as shown in
Figure 7. Thus, the corresponding critical strain of DRX can be obtained according to the flow stress curves shown of
Figure 2, and the value of critical strain are shown in
Table 5.
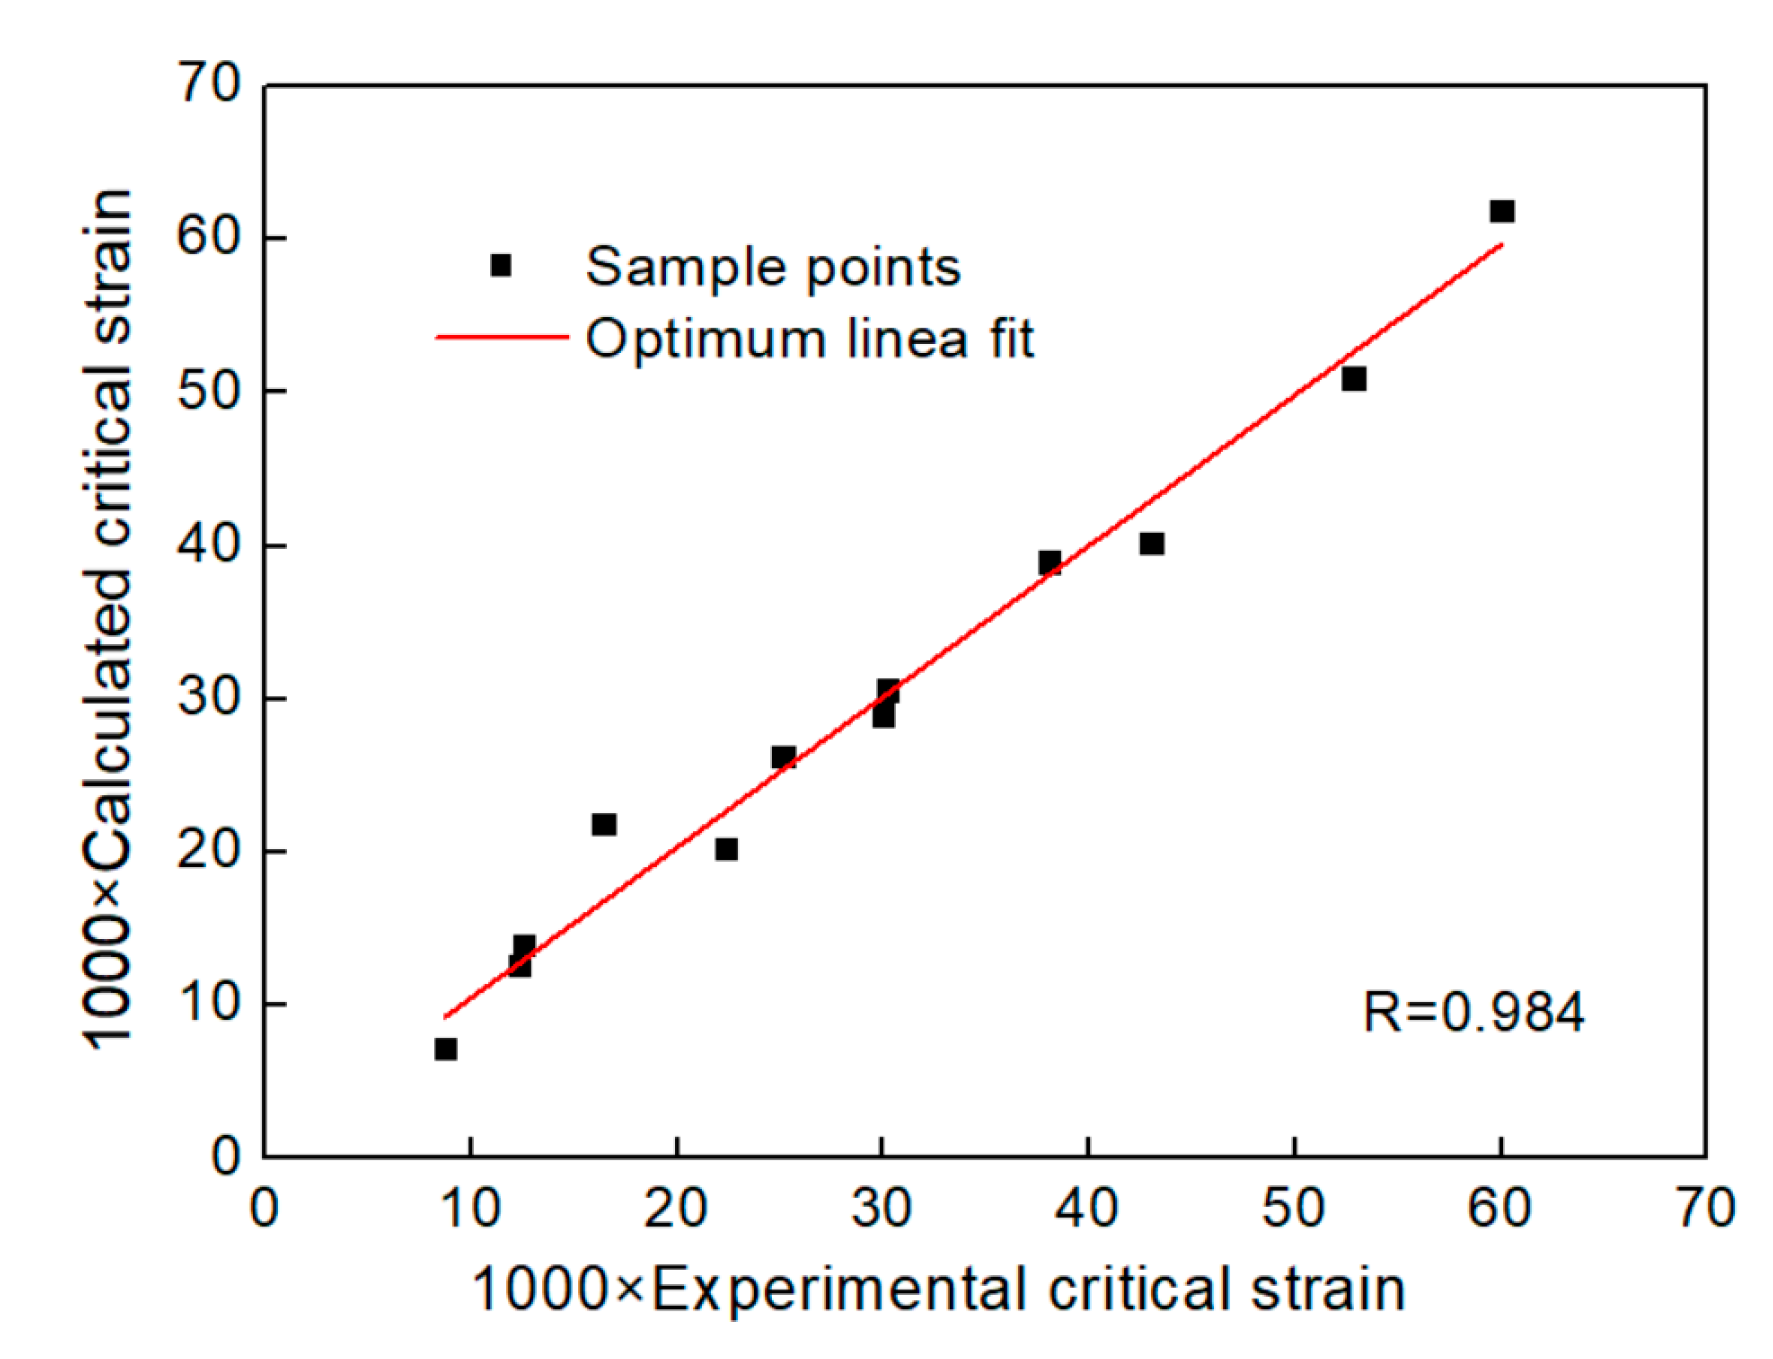
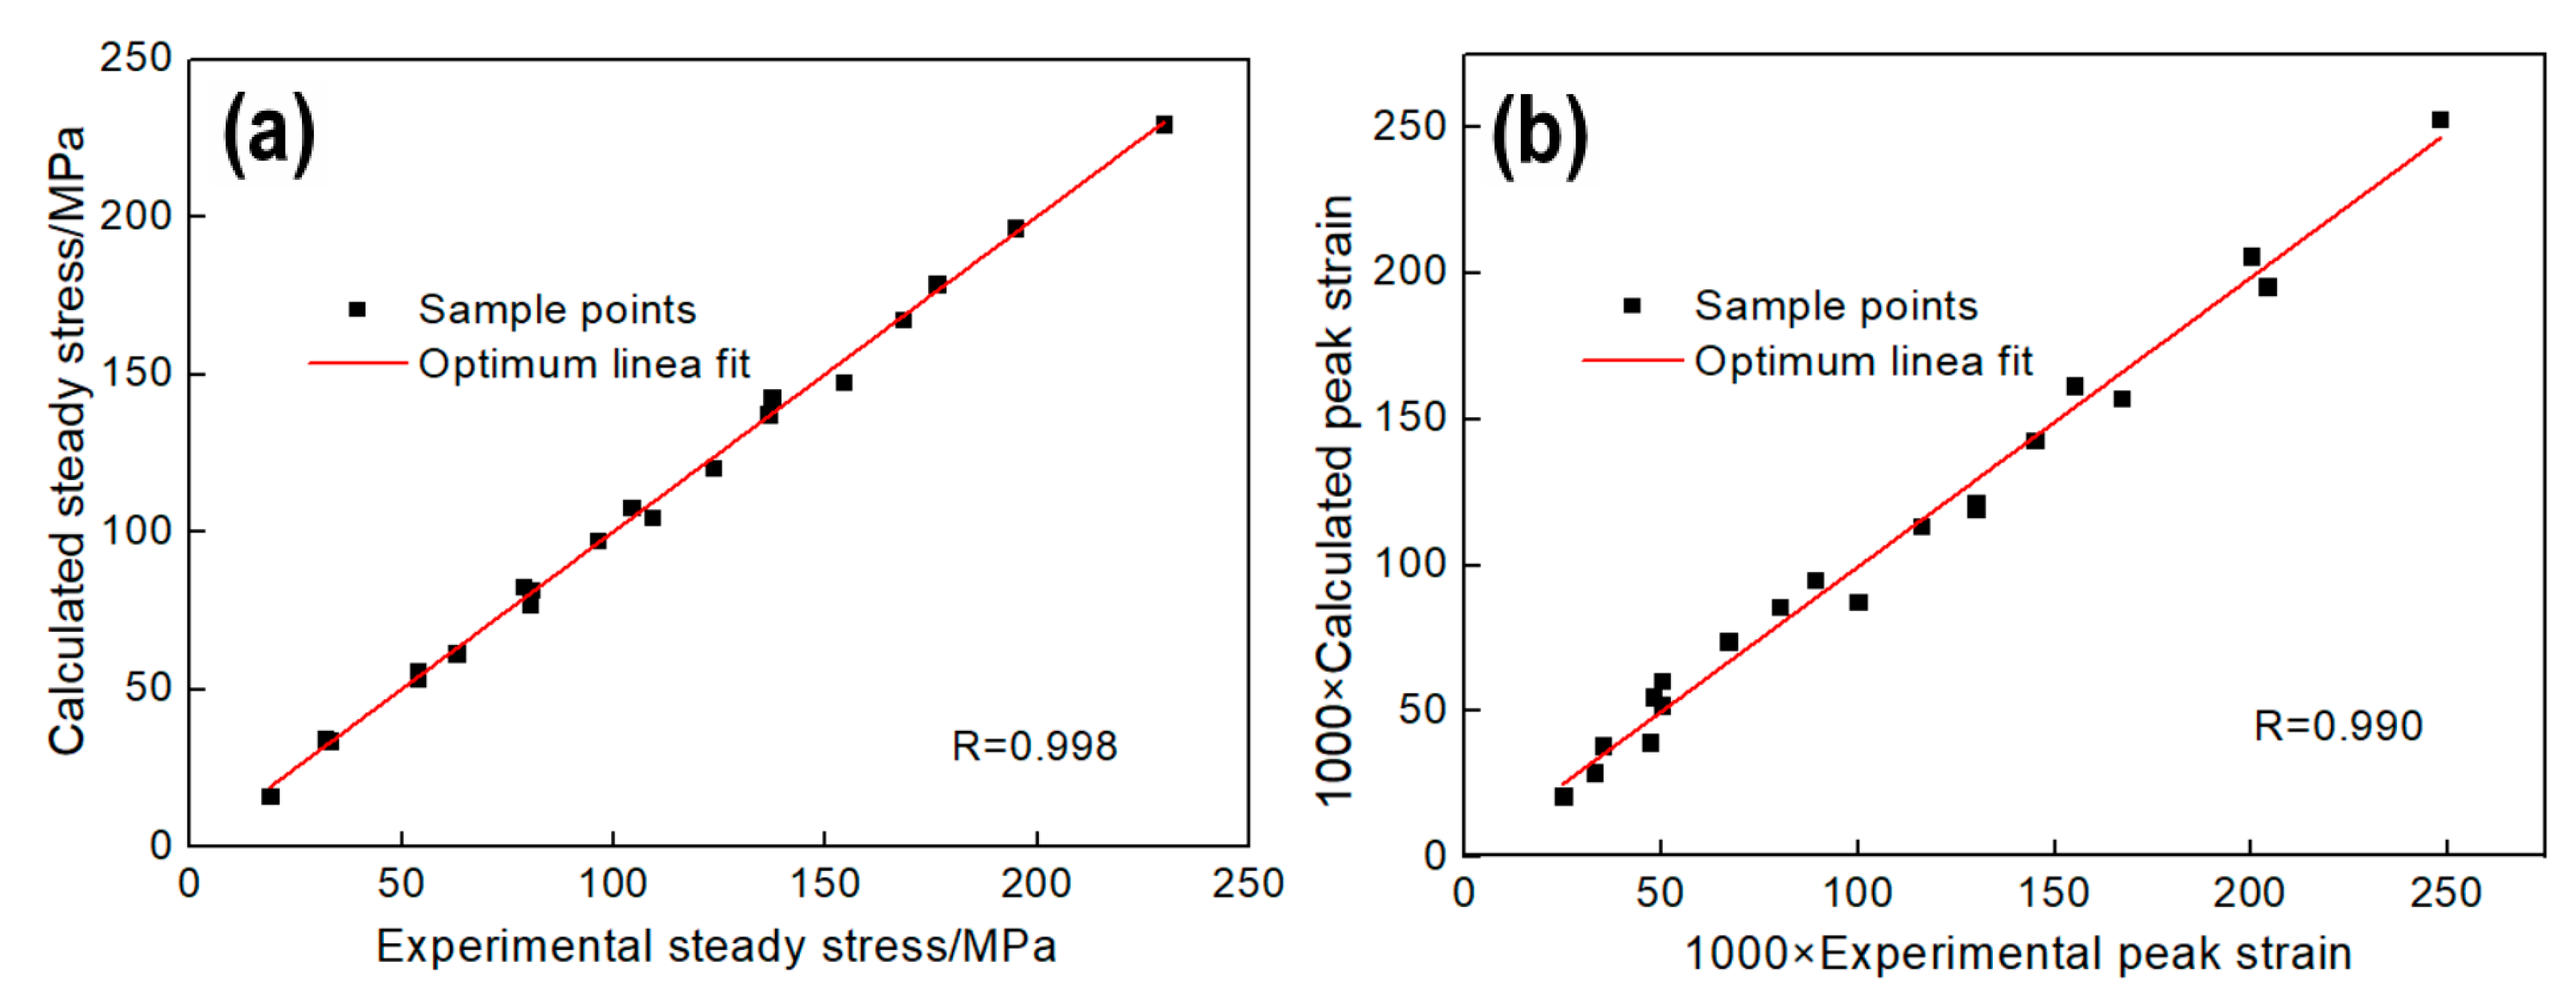
By analyzing the data in
Table 5,
can be described by the temperature and strain rate, as Equation (16) shows.
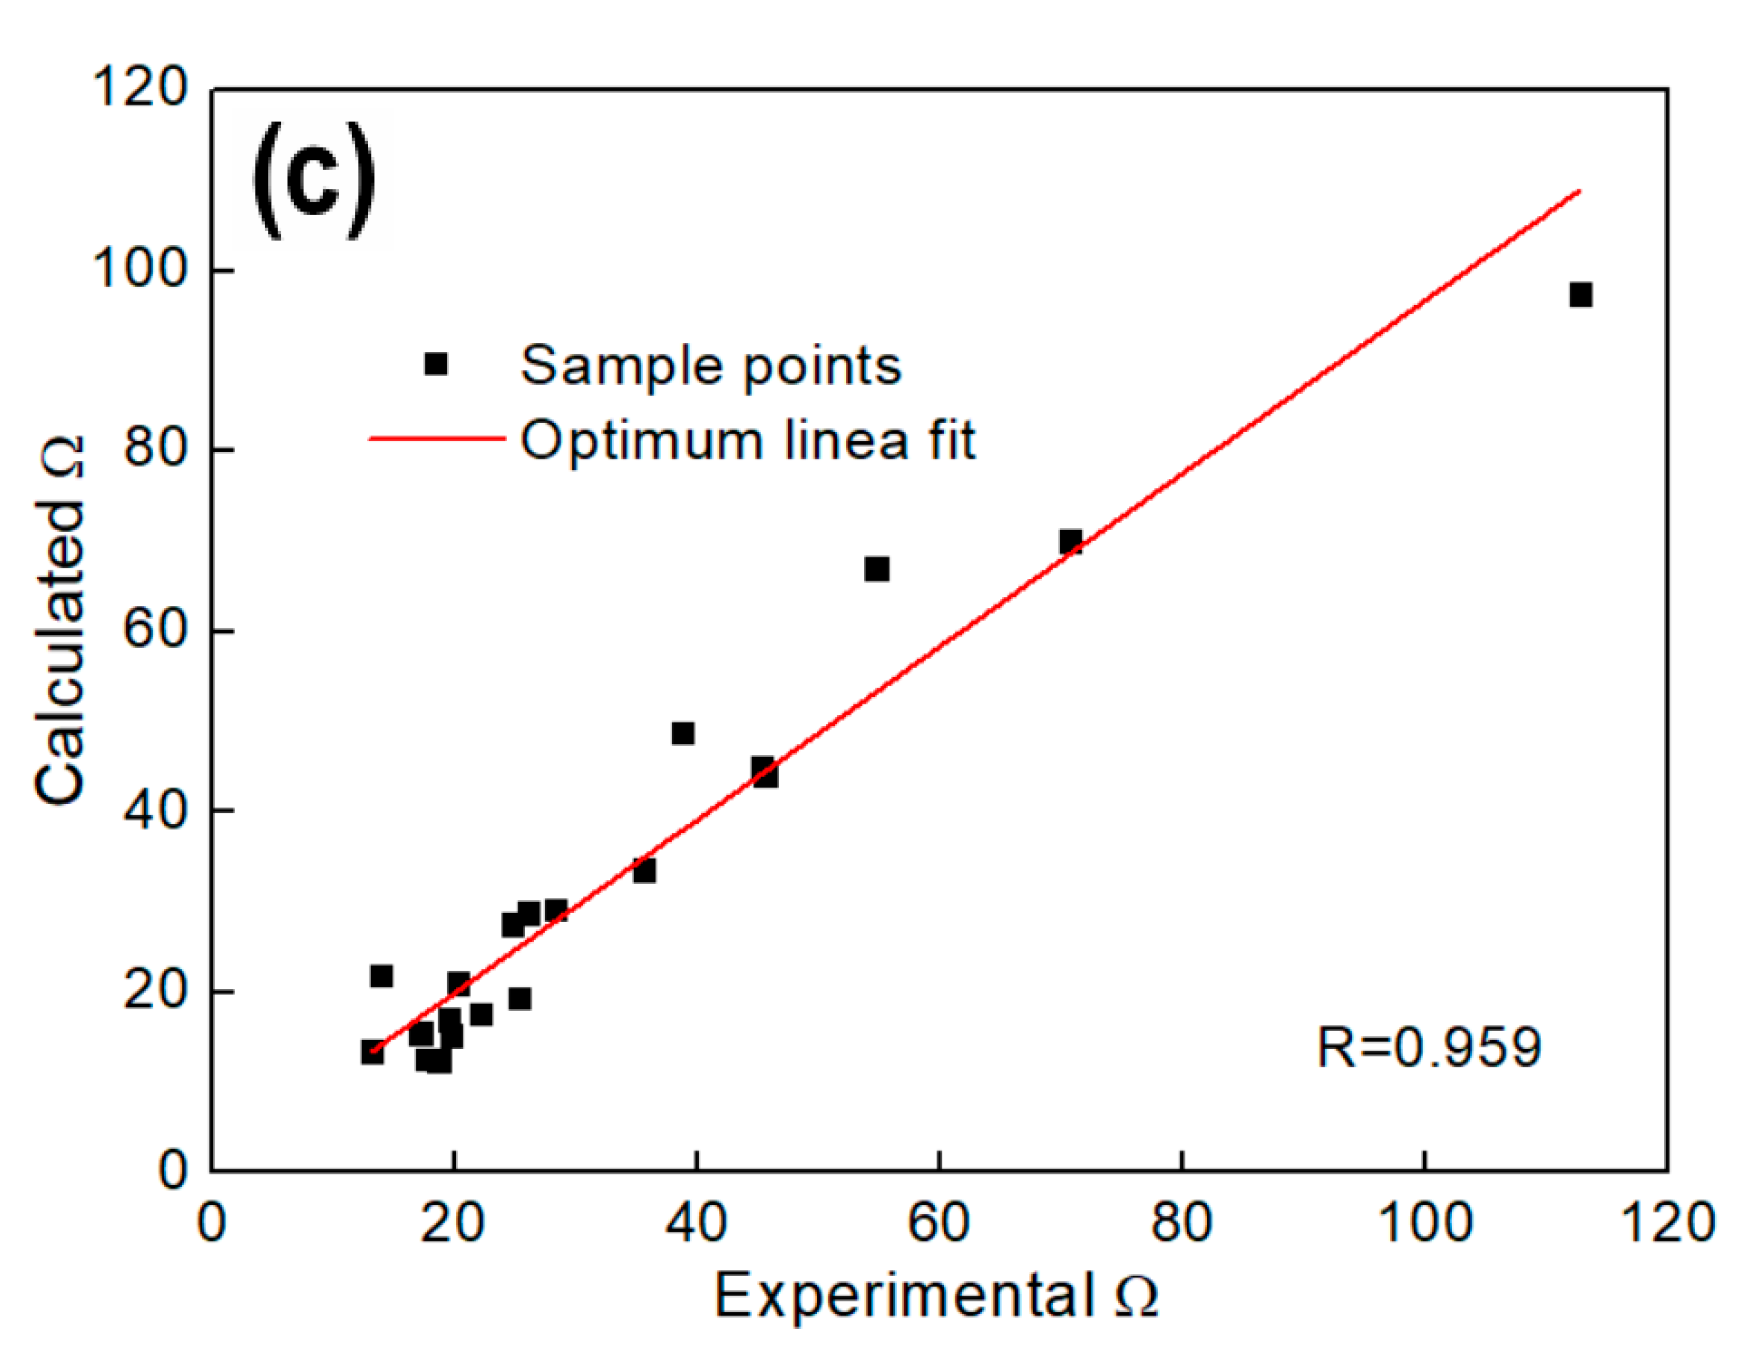
The correlation coefficient between experimental value in
Table 5 and calculated value by Equation (16) is 0.984 as shown in
Figure 8, which shows that Equation (16) can accurately describe the critical strain of Al-4.8Mg alloy at various deformation conditions.
Thus, the DRX critical conditions of sample under the whole deformation conditions in this paper can be established based on the deformation activation energy and work-hardening rate, as shown in Equation (17):


