Thermo-Optical Switching Effect Based on a Tapered Optical Fiber and Higher Alkanes Doped with ZnS:Mn

 ,
,  ,
, 
Abstract
:1. Introduction
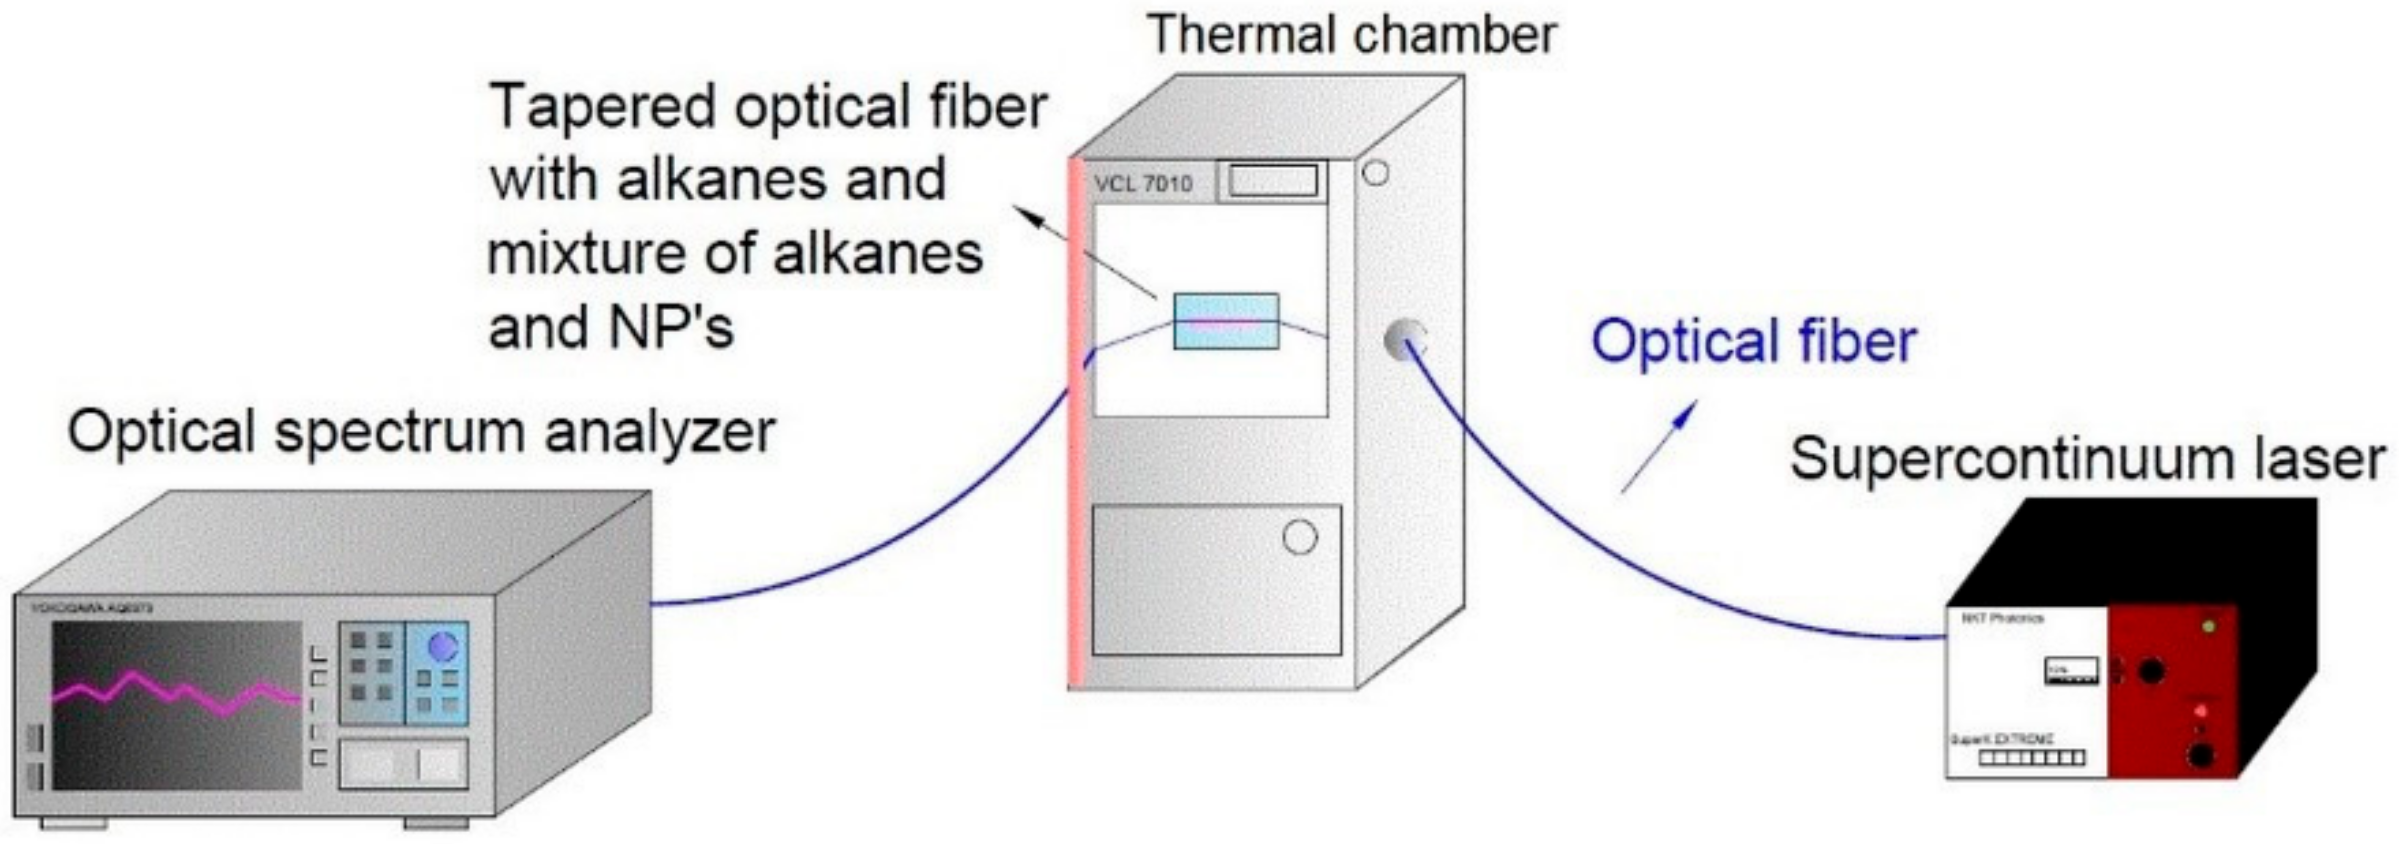
2. Materials and Methods
2.1. Alkanes as Phase Change Materials (PCM)
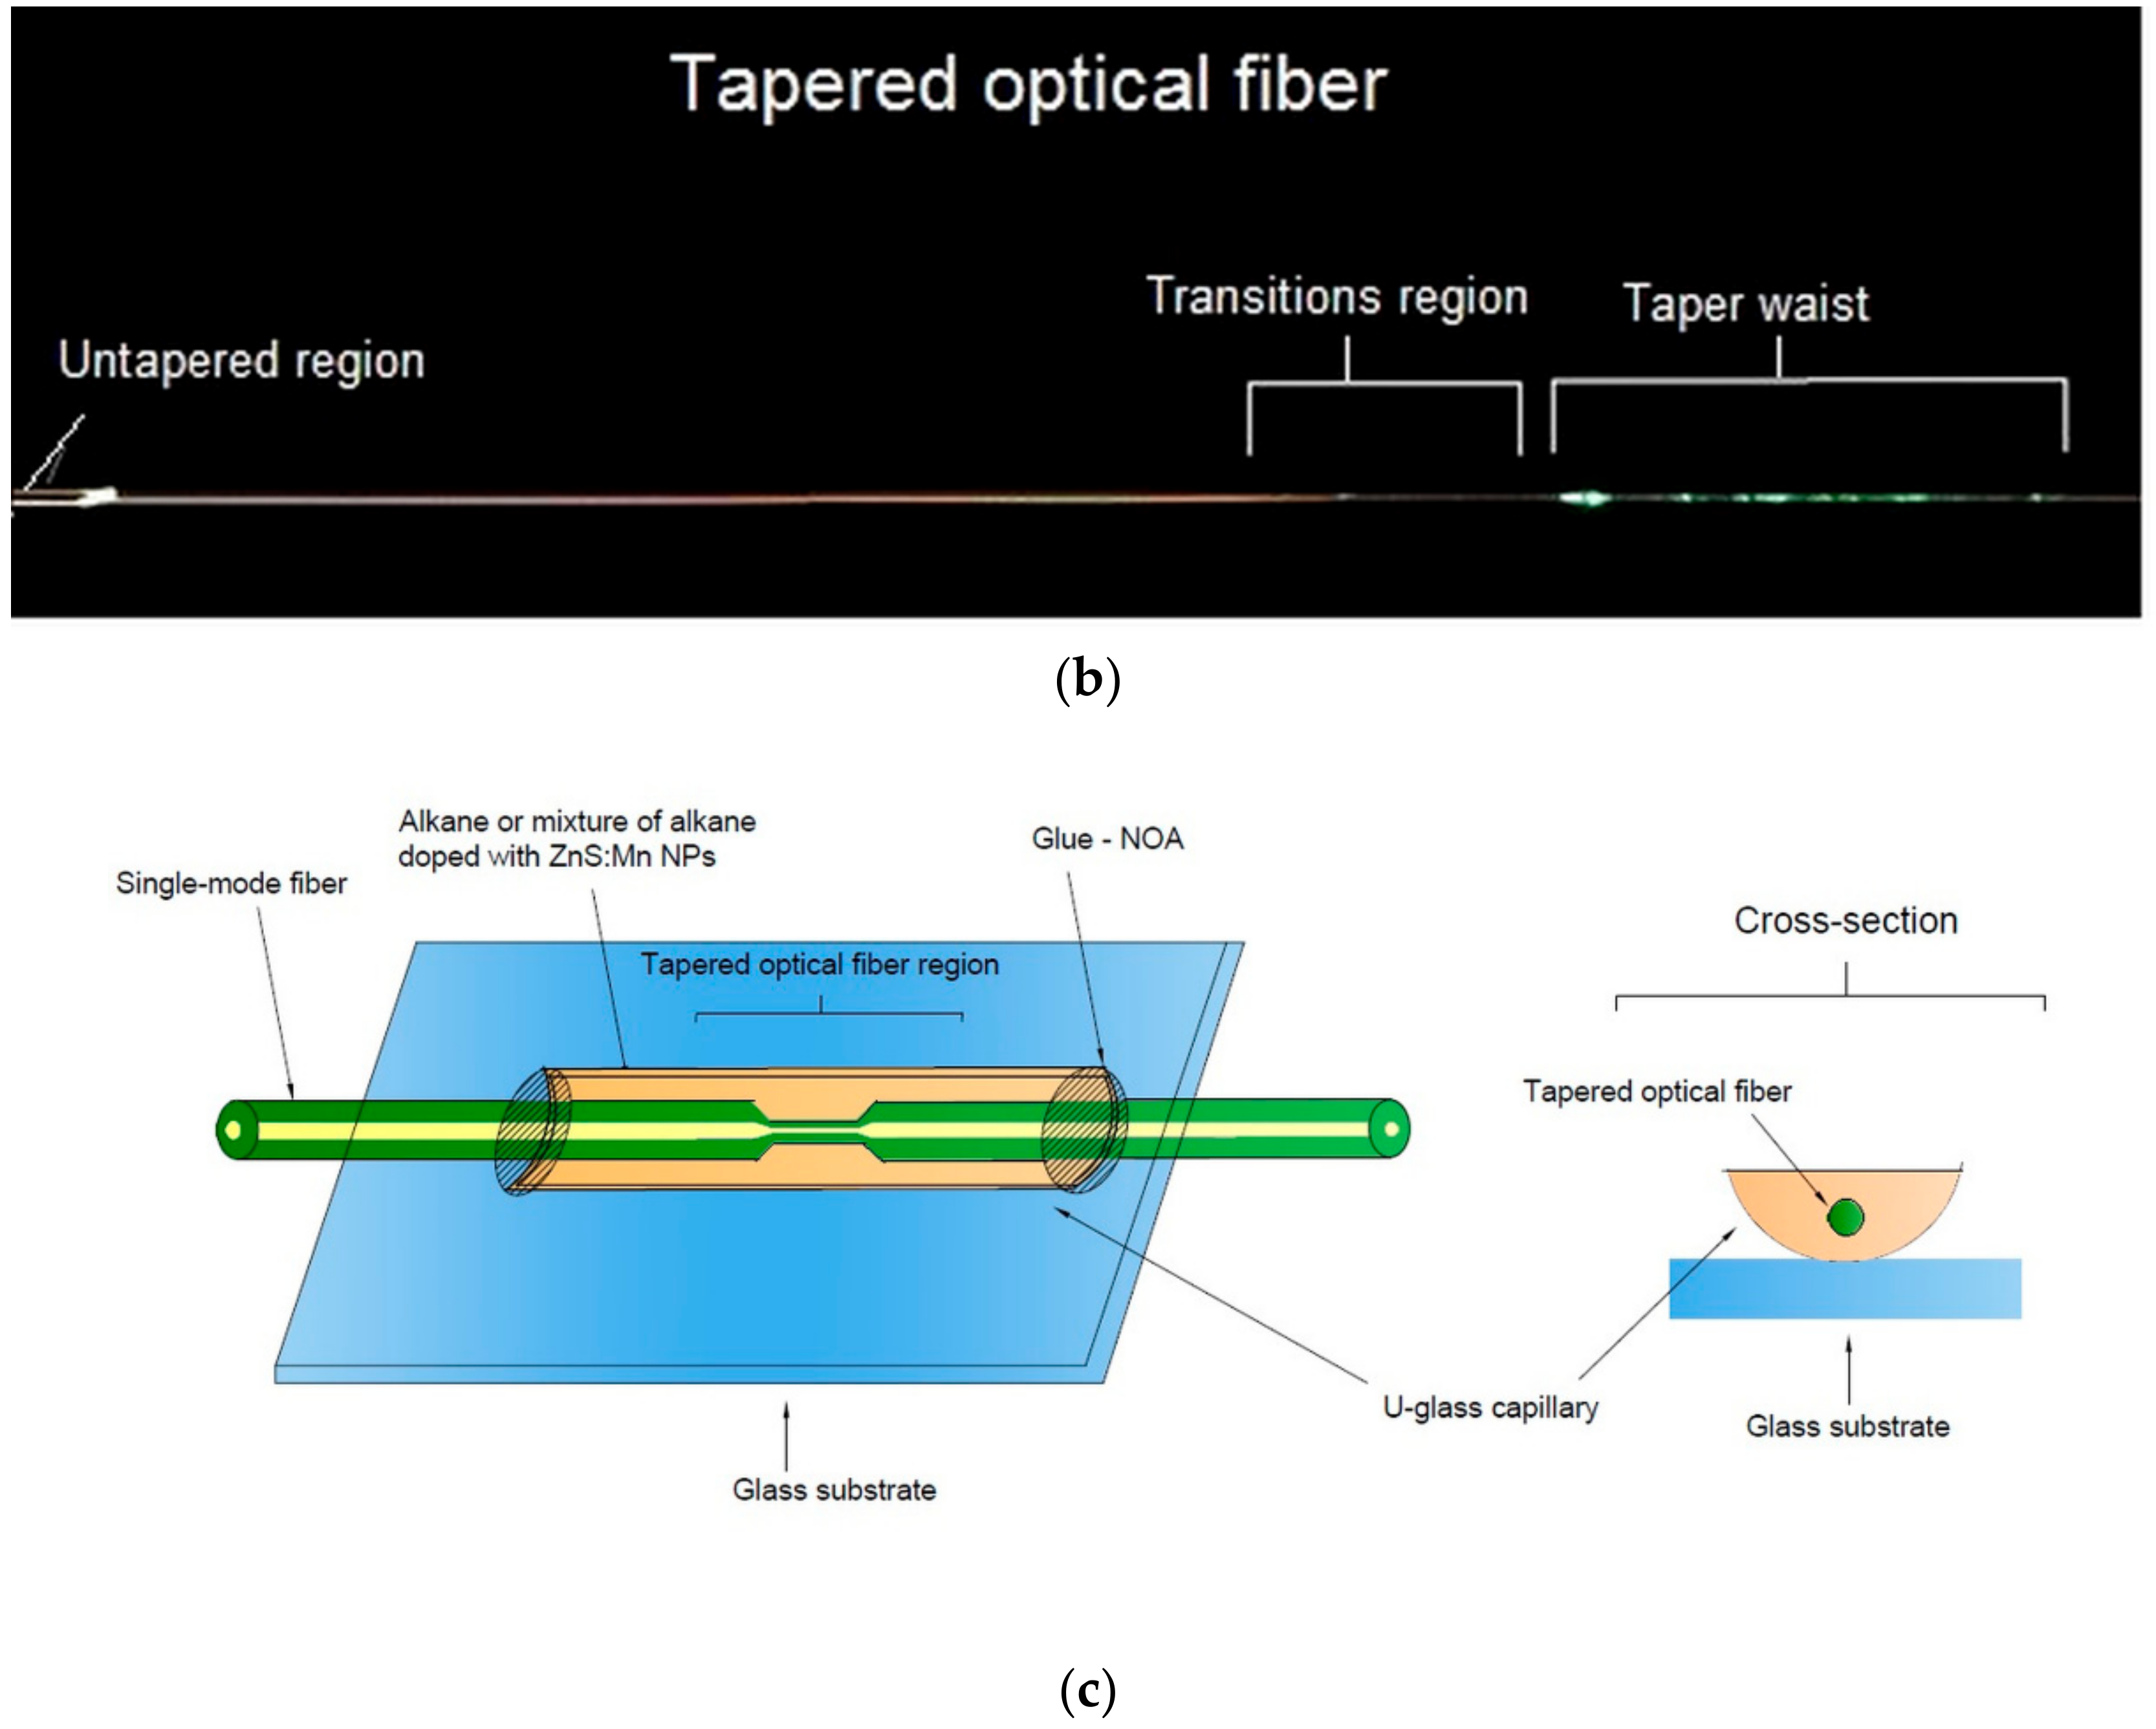
2.2. Properties of Used Alkanes and TOF Technology
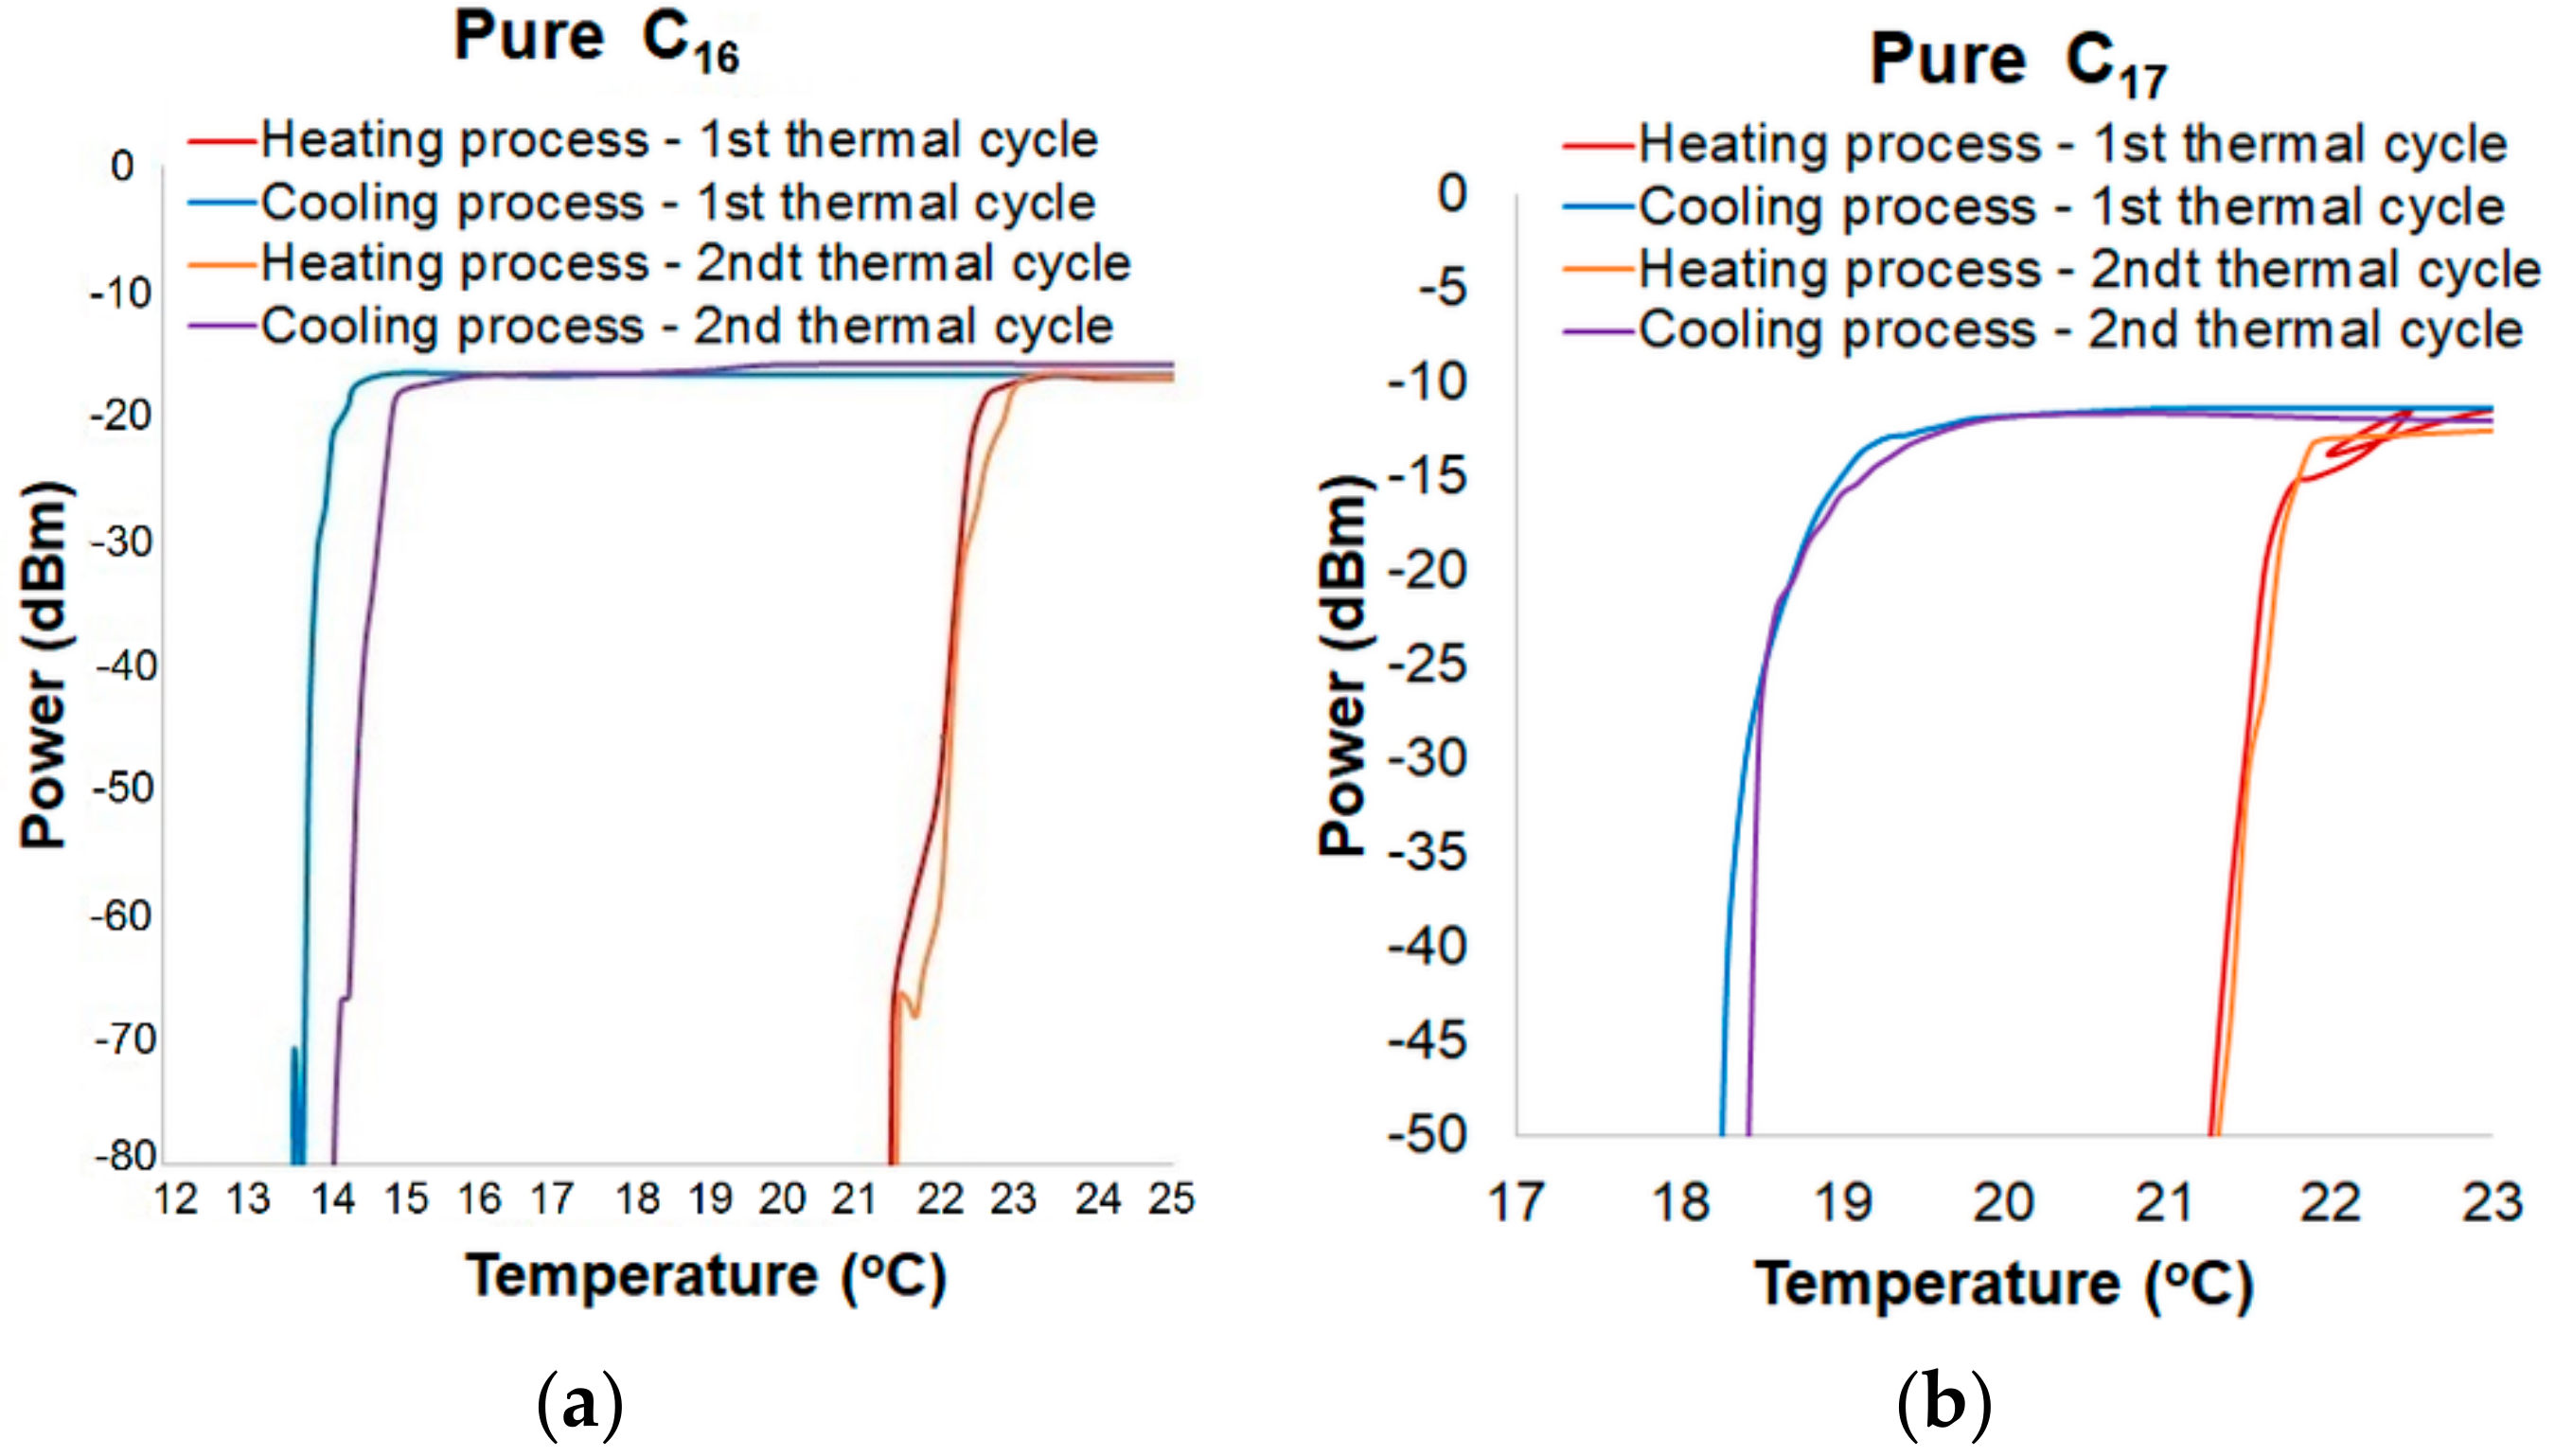
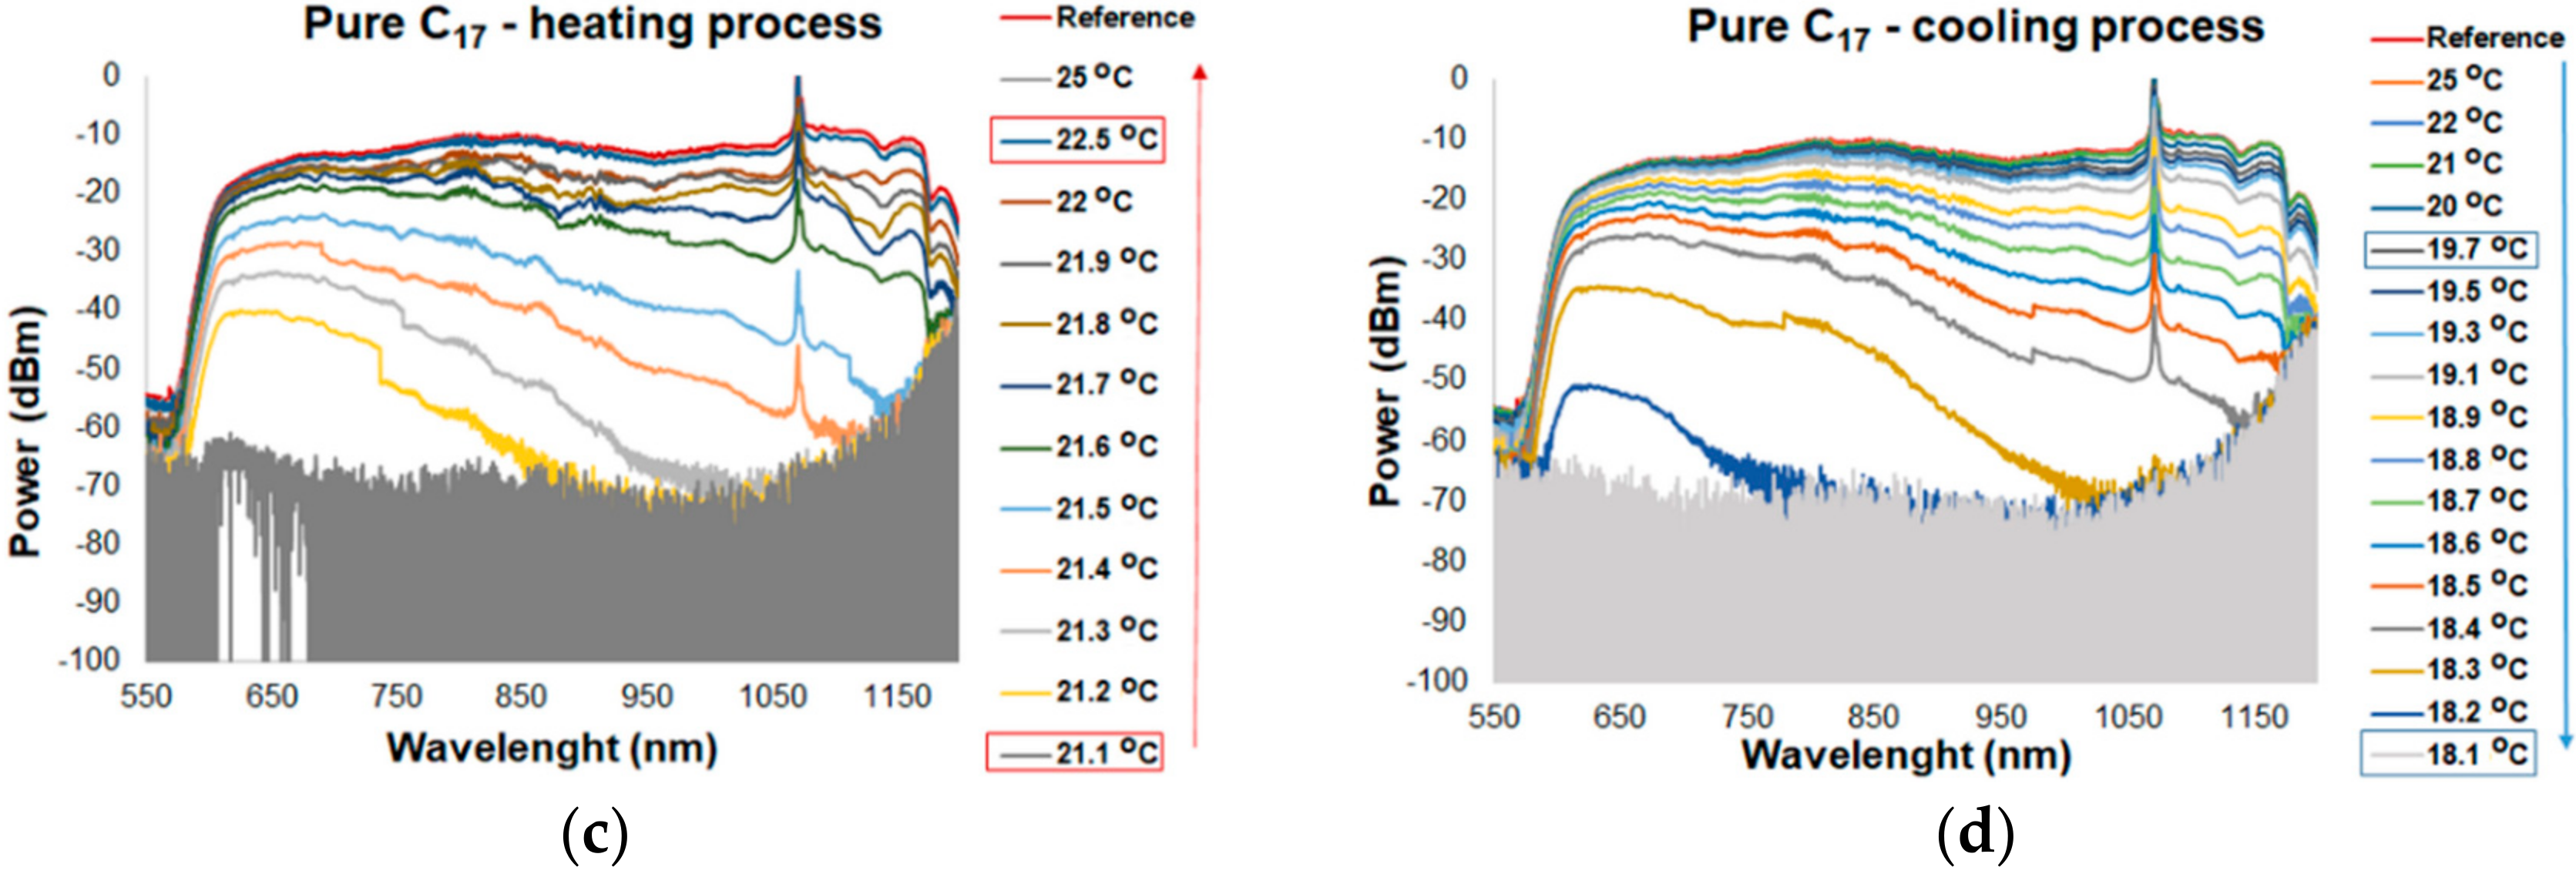
3. Results
4. Conclusions
Author Contributions
Funding
Conflicts of Interest
References
- Wang, P.; Zhao, H.; Wang, X.; Farrell, G.; Brambilla, G. A Review of Multimode Interference in Tapered Optical Fibers and Related Applications. Sensors 2018, 18, 858. [Google Scholar] [CrossRef] [PubMed] [Green Version]
- Korposh, S.; James, S.W.; Lee, S.-W.; Tatam, R.P. Tapered Optical Fibre Sensors: Current Trends and Future Perspectives. Sensors 2019, 19, 2294. [Google Scholar] [CrossRef] [PubMed] [Green Version]
- Mehrvar, M.; Bis, C.; Scharer, J.M.; Young, M.M.; Luong, J.H. Fiber-Optic Biosensors. Trends and Advances. Anal. Sci. 2000, 16, 677–692. [Google Scholar] [CrossRef] [Green Version]
- Takeo, T.; Hattori, H. Optical Fiber Sensor for Measuring Refractive Index. Jpn. J. Appl. Phys. 1982, 21, 1509–1512. [Google Scholar] [CrossRef]
- Tian, Z.; Yam, S.S.-H.; Loock, H.-P. Refractive index sensor based on an abrupt taper Michelson interferometer in a single-mode fiber. Opt. Lett. 2008, 33, 1105–1107. [Google Scholar] [CrossRef] [PubMed]
- Tong, L. Micro/Nanofibre Optical Sensors: Challenges and Prospects. Sensors 2018, 18, 903. [Google Scholar] [CrossRef] [Green Version]
- Zakrzewski, A.; Pięta, A.; Patela, S. Simple method for manufacturing and optical characterization of tapered optical fibres. Opto-Electron. Rev. 2016, 24, 216–222. [Google Scholar] [CrossRef] [Green Version]
- Stasiewicz, K.A.; Moś, J. Influence of a thin metal layer on a beam propagation in a biconical optical fibre taper. Opto-Electron. Rev. 2016, 24, 196–208. [Google Scholar] [CrossRef] [Green Version]
- Ahmad, M.; Hench, L.L. Effect of taper geometries and launch angle on evanescent wave penetration depth in optical fibers. Biosens. Bioelectron. 2005, 20, 1312–1319. [Google Scholar] [CrossRef]
- Talataisong, W.; Ismaeel, R.; Brambilla, G. A Review of Microfiber-Based Temperature Sensors. Sensors 2018, 18, 461. [Google Scholar] [CrossRef] [Green Version]
- Sumetsky, M.; Tong, L. Subwavelenght and Nanometer Diameter Optical Fibers; Springer Science & Business Media: Berlin, Germany, 2010. [Google Scholar]
- Zhang, L.; Tang, Y.; Tong, L. Micro-/Nanofiber Optics: Merging Photonics and Material Science on Nanoscale for Advanced Sensing Technology. iScience 2020, 23, 100810. [Google Scholar] [CrossRef] [PubMed] [Green Version]
- Tian, Y.; Wang, W.; Wu, N.; Zou, X.; Wang, X. Tapered Optical Fiber Sensor for Label-Free Detection of Biomolecules. Sensors 2011, 11, 3780–3790. [Google Scholar] [CrossRef] [Green Version]
- Monzon-Hernandez, D.; Luna-Moreno, D.; Escobar, D.M.; Villatoro, J. Optical microfibers decorated with PdAu nanoparticles for fast hydrogen sesnsing. Sens. Actuators B Chem. 2010, 151, 219–222. [Google Scholar] [CrossRef]
- Wang, S.; Feng, S.; Wu, S.; Wang, Q.; Zhang, L. Hight Sensitive Temperature Sensor Based on Gain Competition Mechanism Using Graphene Coated Microfiber. IEEE Photonics J. 2018, 10, 6802008. [Google Scholar] [CrossRef]
- Tiwari, D.; Mullaney, K.; Korposh, S.; James, S.W.; Lee, S.-W.; Tatam, R.P. An ammonia sensor based on Lossy Mode Resonances on a tapered optical fibre coated with porphyrin-incorporated titanium dioxide. Sensors Actuators B: Chem. 2017, 242, 645–652. [Google Scholar] [CrossRef] [Green Version]
- Moś, J.E.; Korec, J.; Stasiewicz, K.A.; Jankiewicz, B.; Bartosewicz, B.; Jaroszewicz, L.R. Research on Optical Properties of Tapered Optical Fibers with Liquid Crystal Cladding Doped with Gold Nanoparticles. Crystals 2019, 9, 306. [Google Scholar] [CrossRef] [Green Version]
- Semenova, Y.; Panarin, Y.; Farrell, G.; Dovgalets, S.; Semenova, Y. Liquid crystal based optical switches. Mol. Cryst. Liq. Cryst. 2004, 413, 385–398. [Google Scholar] [CrossRef] [Green Version]
- Liu, C.; Wang, D.; Yao, L.-X.; Li, L.; Wang, Q.-H. Electrowetting-actuated optical switch based on total internal reflection. Appl. Opt. 2015, 54, 2672–2676. [Google Scholar] [CrossRef]
- Sun, P.; Reano, R.M. Submilliwatt thermo-optic switches using free-standing silicon-on-insulator strip waveguides. Opt. Express 2010, 18, 8406–8411. [Google Scholar] [CrossRef] [PubMed]
- Coppola, G.; Sirleto, L.; Remdina, I.; Iodice, M. Advance in thermos-optical switchers: Principles, materials, design, and device structure. Opt. Eng. 2011, 50, 071112. [Google Scholar] [CrossRef]
- Said, A.; Salah, A.; Fattah, G.A. Enhanced Thermo-Optical Switching of Paraffin-Wax Composite Spots under Laser Heating. Materials 2017, 10, 525. [Google Scholar] [CrossRef] [Green Version]
- Gu, L.; Jiang, W.; Chen, X.; Chen, R.T. Thermooptically tuned photonic crystal waveguide silicon-on-insulator Mach-Zehner interferometers. IEEE Photon. Technol. Lett. 2007, 19, 342–344. [Google Scholar] [CrossRef]
- Hauffe, R.; Petermann, K. Thermo-Optic Switching. In Optical Switching; El‑Bawab, T.S., Ed.; Springer: Berlin, Germany, 2006. [Google Scholar]
- Stegmaier, M.; Ríos, C.; Bhaskaran, H.; Pernice, W.H.P. Thermo-optical Effect in Phase-Change Nanophotonics. ACS Photonics 2016, 3, 828–835. [Google Scholar] [CrossRef]
- Marc, P.; Przybysz, N.; Molska, A.; Jaroszewicz, L.R. Photonic Crystal Fiber Transducers for an Optical Fiber Multilevel Temperature Threshold Sensor. J. Light. Technol. 2017, 36, 898–903. [Google Scholar] [CrossRef]
- Stasiewicz, K.A.; Musial, J. Threshold temperature optical fibre sensors. Opt. Fiber Technol. 2016, 32, 111–118. [Google Scholar] [CrossRef]
- Freund, M.; Csikos, R.; Keszthelyi, S.; Mozes, G.Y. Paraffin products. In Properties Technologies, Applications; Elsevier: Amsterdam, The Netherlands, 1982; Volume 14, pp. 90–123. [Google Scholar]
- Melcer, A.; Klugmann‑Radziemska, E.; Lewandowski, W.M. Phase change materials. Properties, Classification, Advantages And Disadvantage. Przemysl Chem. 2012, 91, 1335–1346. [Google Scholar]
- Ukrainczyk, N.; Kurajica, S.; Šipušić, J. Thermophysical Comparison of Five Commercial Paraffin Waxes as Latent Heat Storage Materials. Chem. Biochem. Eng. 2010, 24, 129–137. [Google Scholar]
- He, B.; Martin, V.; Setterwall, F. Phase transition temperature ranges and storage density of paraffin wax phase change materials. Energy 2004, 29, 1785–1804. [Google Scholar] [CrossRef]
- Sharma, A.; Tyagi, V.V.; Chen, C.R.; Buddhi, D. Review on thermal energy storage with phase changematerials and applications. Renew. Sustain. Energy Rev. 2009, 13, 318–345. [Google Scholar] [CrossRef]
- Vakhshouri, A.R. Paraffin as Phase Change Material. Paraffin Overview 2020, 1–23. [Google Scholar] [CrossRef] [Green Version]
- Farid, M.M.; Khudhair, A.M.; Razack, S.A.K.; Al-Hallaj, S. A review on phase change energy storage: Materials and applications. Energy Convers. Manag. 2004, 45, 1597–1615. [Google Scholar] [CrossRef]
- Li, M. A nano-graphite/paraffin phase change material with high thermal conductivity. Appl. Energy 2013, 106, 25–30. [Google Scholar] [CrossRef]
- Zaidan, M.; Alhamdo, A.H. Improvement in Heat Transfer Inside a phase change Energy System. Int. J. Mech. Mechatron. Eng. 2018, 18, 33–46. [Google Scholar]
- Johnson, J.F. Phase Transformations in Commercial Paraffin Waxes. Ind. Eng. Chem. 1954, 46, 1046–1048. [Google Scholar] [CrossRef]
- Stasiewicz, K.A.; Krajewski, R.; Świłło, R.; Jaroszewicz, L.R.; Kujawińska, M. Influence of tapering process on changes of optical fiber refractive index distribution along a structure. Opto-Electron. Rev. 2010, 18, 102–109. [Google Scholar] [CrossRef]
- Corning SMF-28 Ultra Optical Fiber Product Specification Sheets. Available online: https://www.corning.com/optical-communications/in/en/home/products/fiber/optical-fiber-products/smf-28-ultra.html (accessed on 8 September 2020).
- A10322 n-Hexadecane, 99%. Available online: https://www.alfa.com/en/catalog/A10322/ (accessed on 9 June 2020).
- 31551 n-Heptadecane, 99%. Available online: https://www.alfa.com/en/catalog/031551/ (accessed on 9 June 2020).
- n-Heksadekan. Available online: http://www.dthc.eu/uploads/files/n-heksadekan.pdf (accessed on 19 October 2020).
- n-Heptadekan. Available online: http://www.dthc.eu/uploads/files/n-heptadekan.pdf (accessed on 19 October 2020).
- Matras, K.; Bredol, M.; Bogdal, D. Synthesis of nanocomposites of poly(vinylidene fluoride) (PVDF) with manganese-doped ZnS. In Modern Polymeric Materials for Environmental Applications: Proceedings of the 3rd International Seminar, Kraków, Poland, 14–16 May 2008; Pielichowski, K., Ed.; Cracow University of Technology: Cracow, Poland, 2008; Volume 3, pp. 131–135. [Google Scholar]
- Sesa, E.; Sahala, S.; Kade, A. Optimization of Optical Properties of ZnS:Mn Thin Films Deposited by Co-evaporation Electron Beam. Asian J. Sci. Res. 2019, 12, 60–64. [Google Scholar] [CrossRef] [Green Version]
- Zinc Sulphide FLIR (Zinc Sulfide) (ZnS). Available online: https://www.crystran.co.uk/optical-materials/zinc-sulphide-flir-zinc-sulfide-zns (accessed on 8 June 2020).
- Jakubowska, I.; Korec, J.; Moś, J.; Stasiewicz, K.A.; Matras-Postołek, K.; Jaroszewicz, L.R. Optical fiber taper sensor with a nanoparticles’ mixture cladding. Opt. Fibers Their Appl. 2018 2019, 11045, 110450F. [Google Scholar] [CrossRef]


| Symbol | Alkane | Melting Point (°C) | n (20 °C, 589.3 nm) | Thermal Conductivity (W/mK) | Latent Heat (kJ/kg) | Specific Heat (kJ/kg) | Kinematic Viscosity (mm2/s) |
|---|---|---|---|---|---|---|---|
| C16 | n-hexadecane (C16H34) | 18 | 1.4345 | 0.2 | 237 | 2.078 | (20 °C) 4.51 |
| C17 | n-heptadecane (C17H36) | 22 | 1.4369 | 0.145 | 213 | 2.078 | (40 °C) 3.47 |
| C16 | C16 + 1 wt.% ZnS:MnNPs | C16 + 5 wt.% ZnS:MnNPs | C17 | C17 + 1 wt.% ZnS:MnNPs | C17 + 5 wt.% ZnS:MnNPs | |
|---|---|---|---|---|---|---|
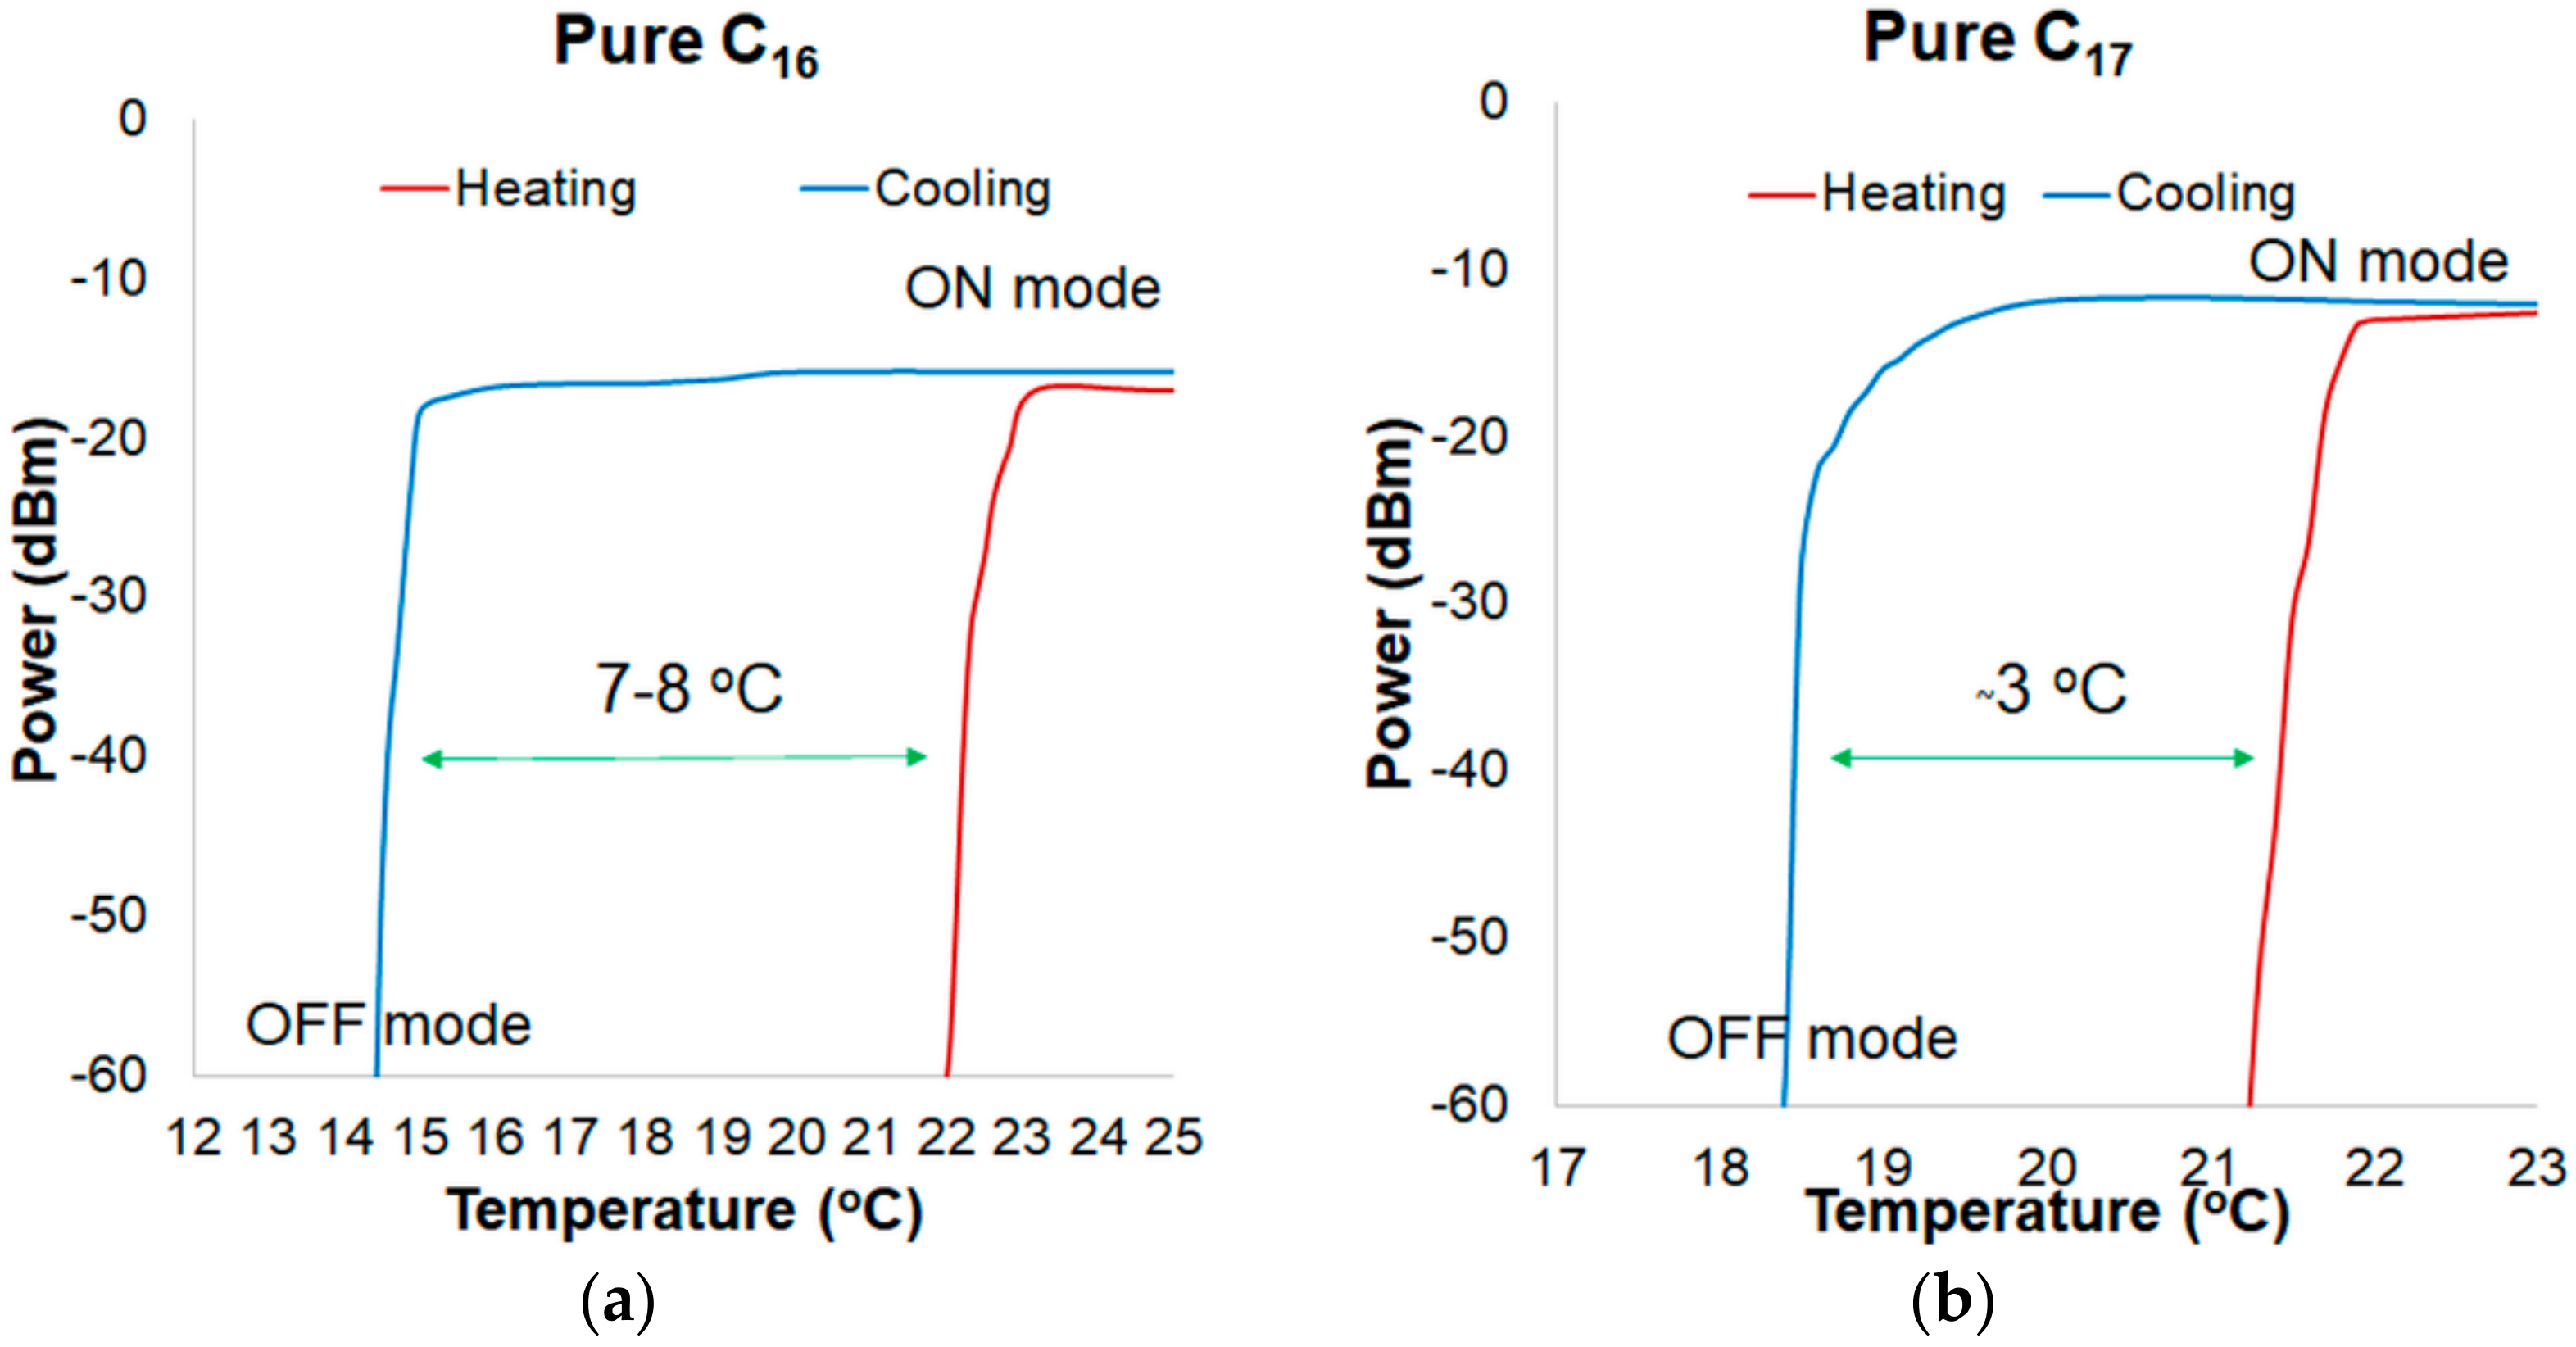
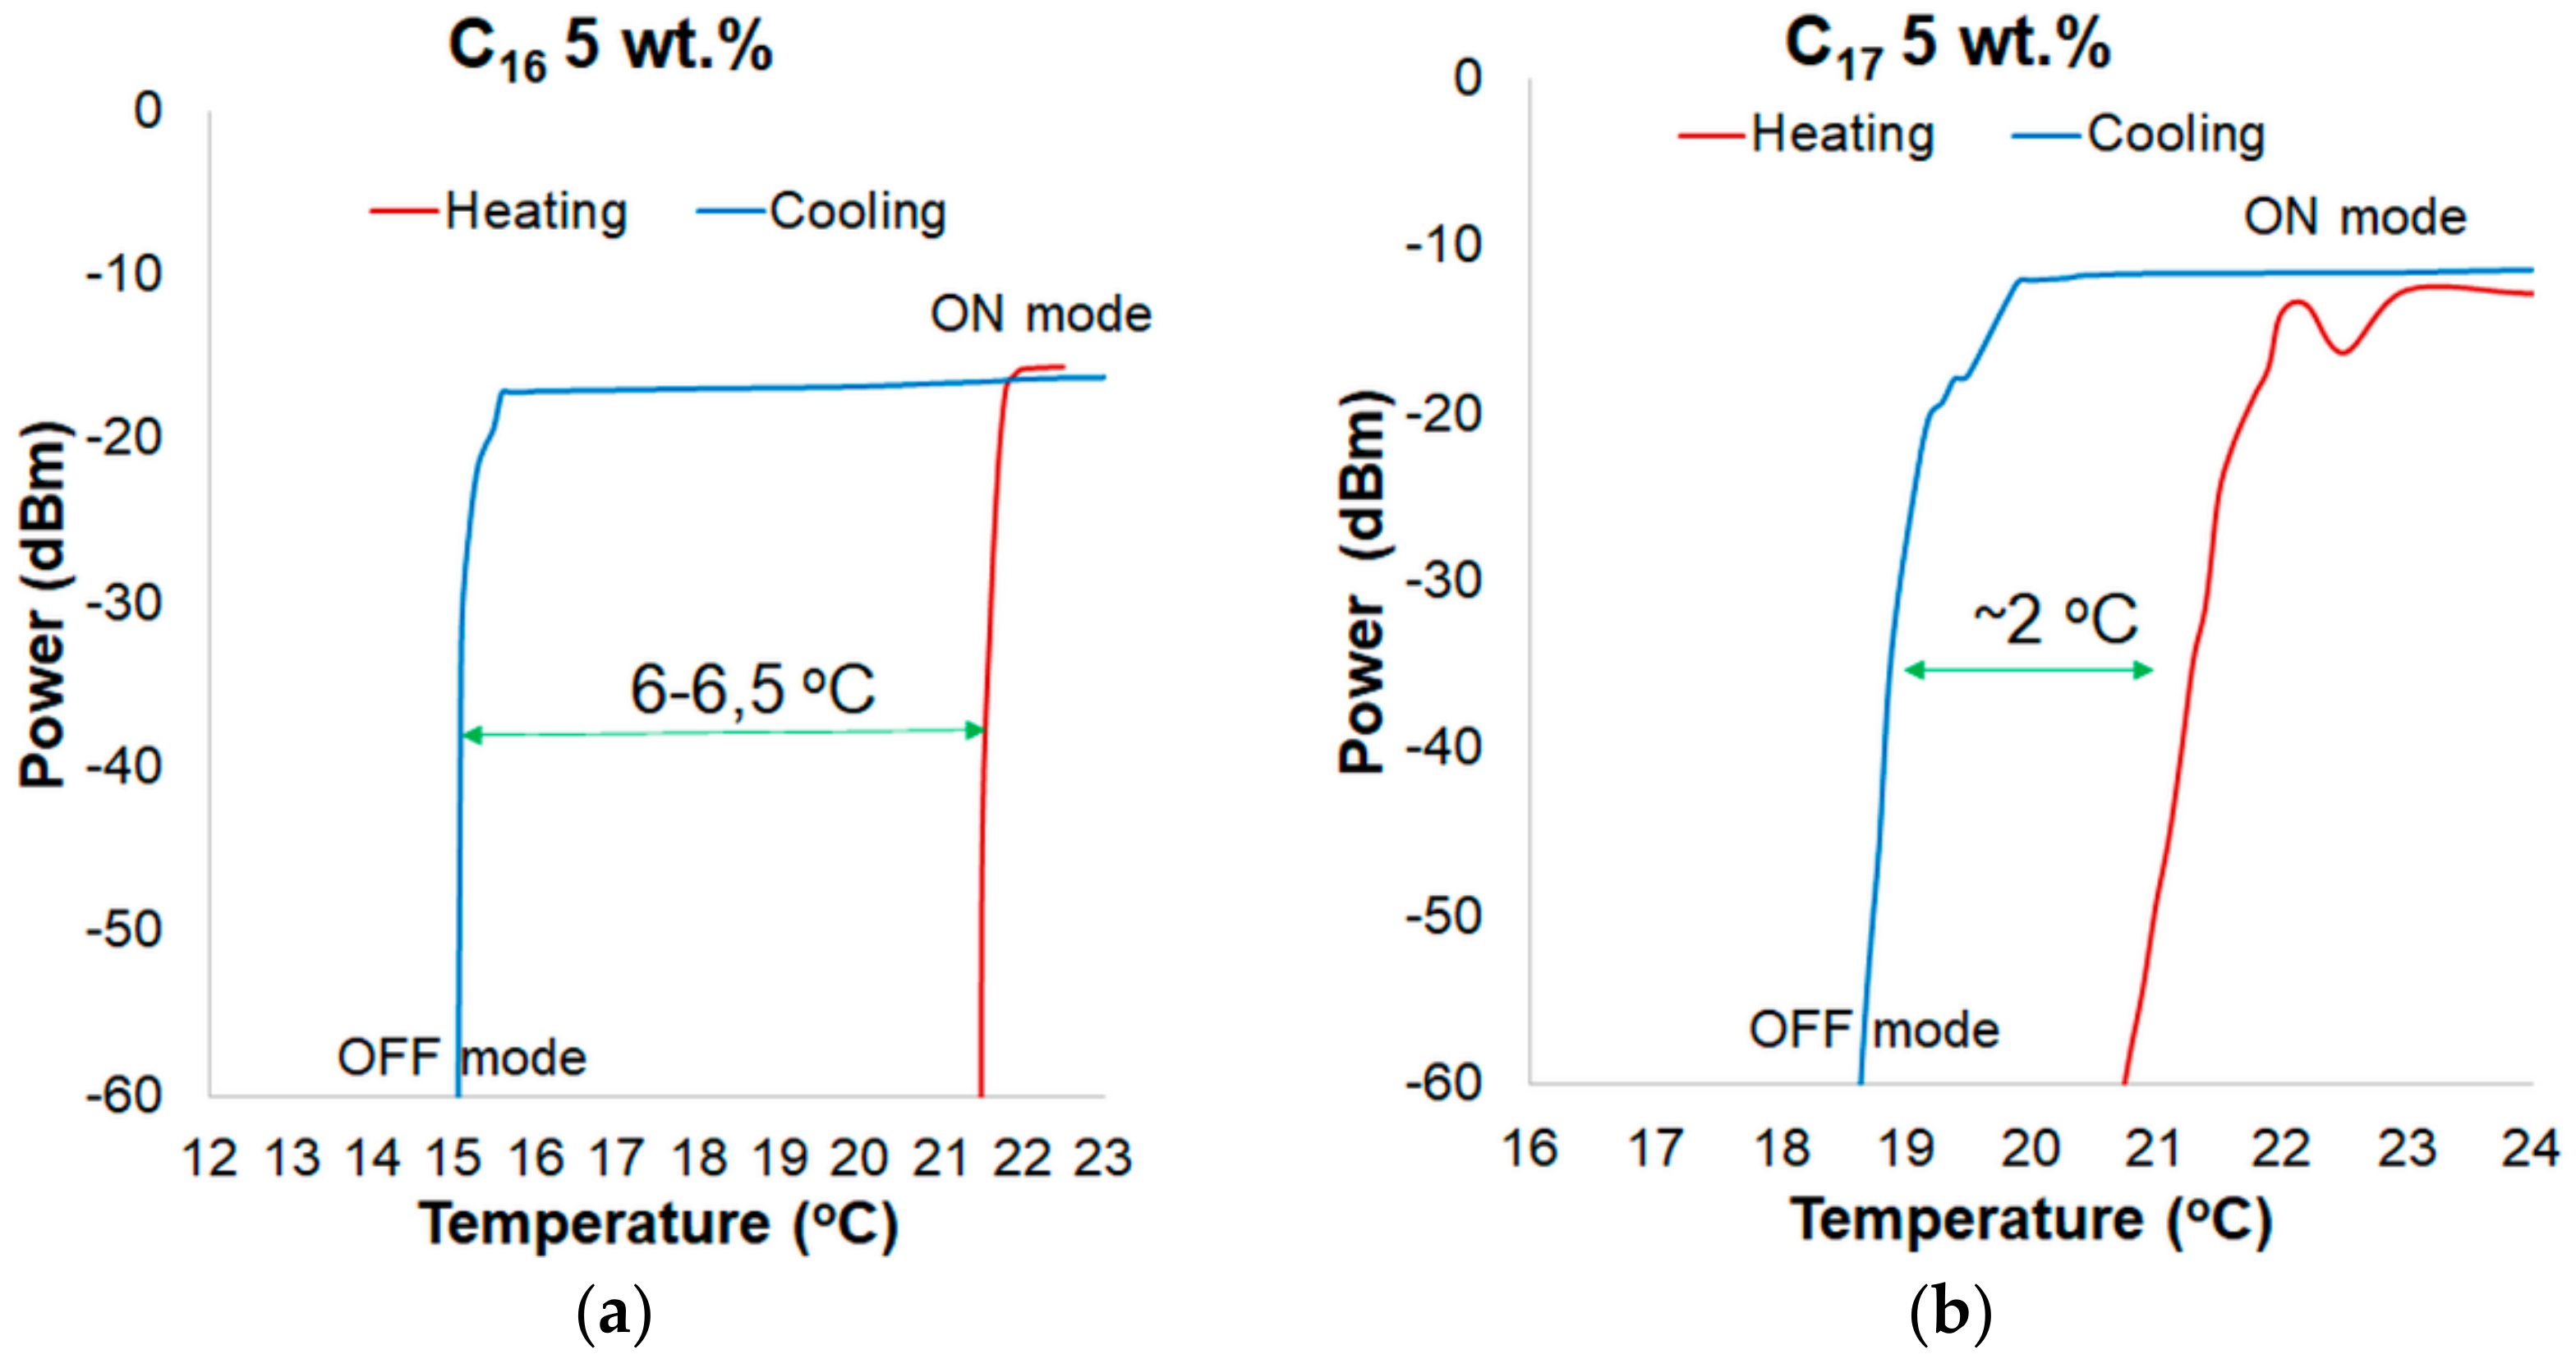
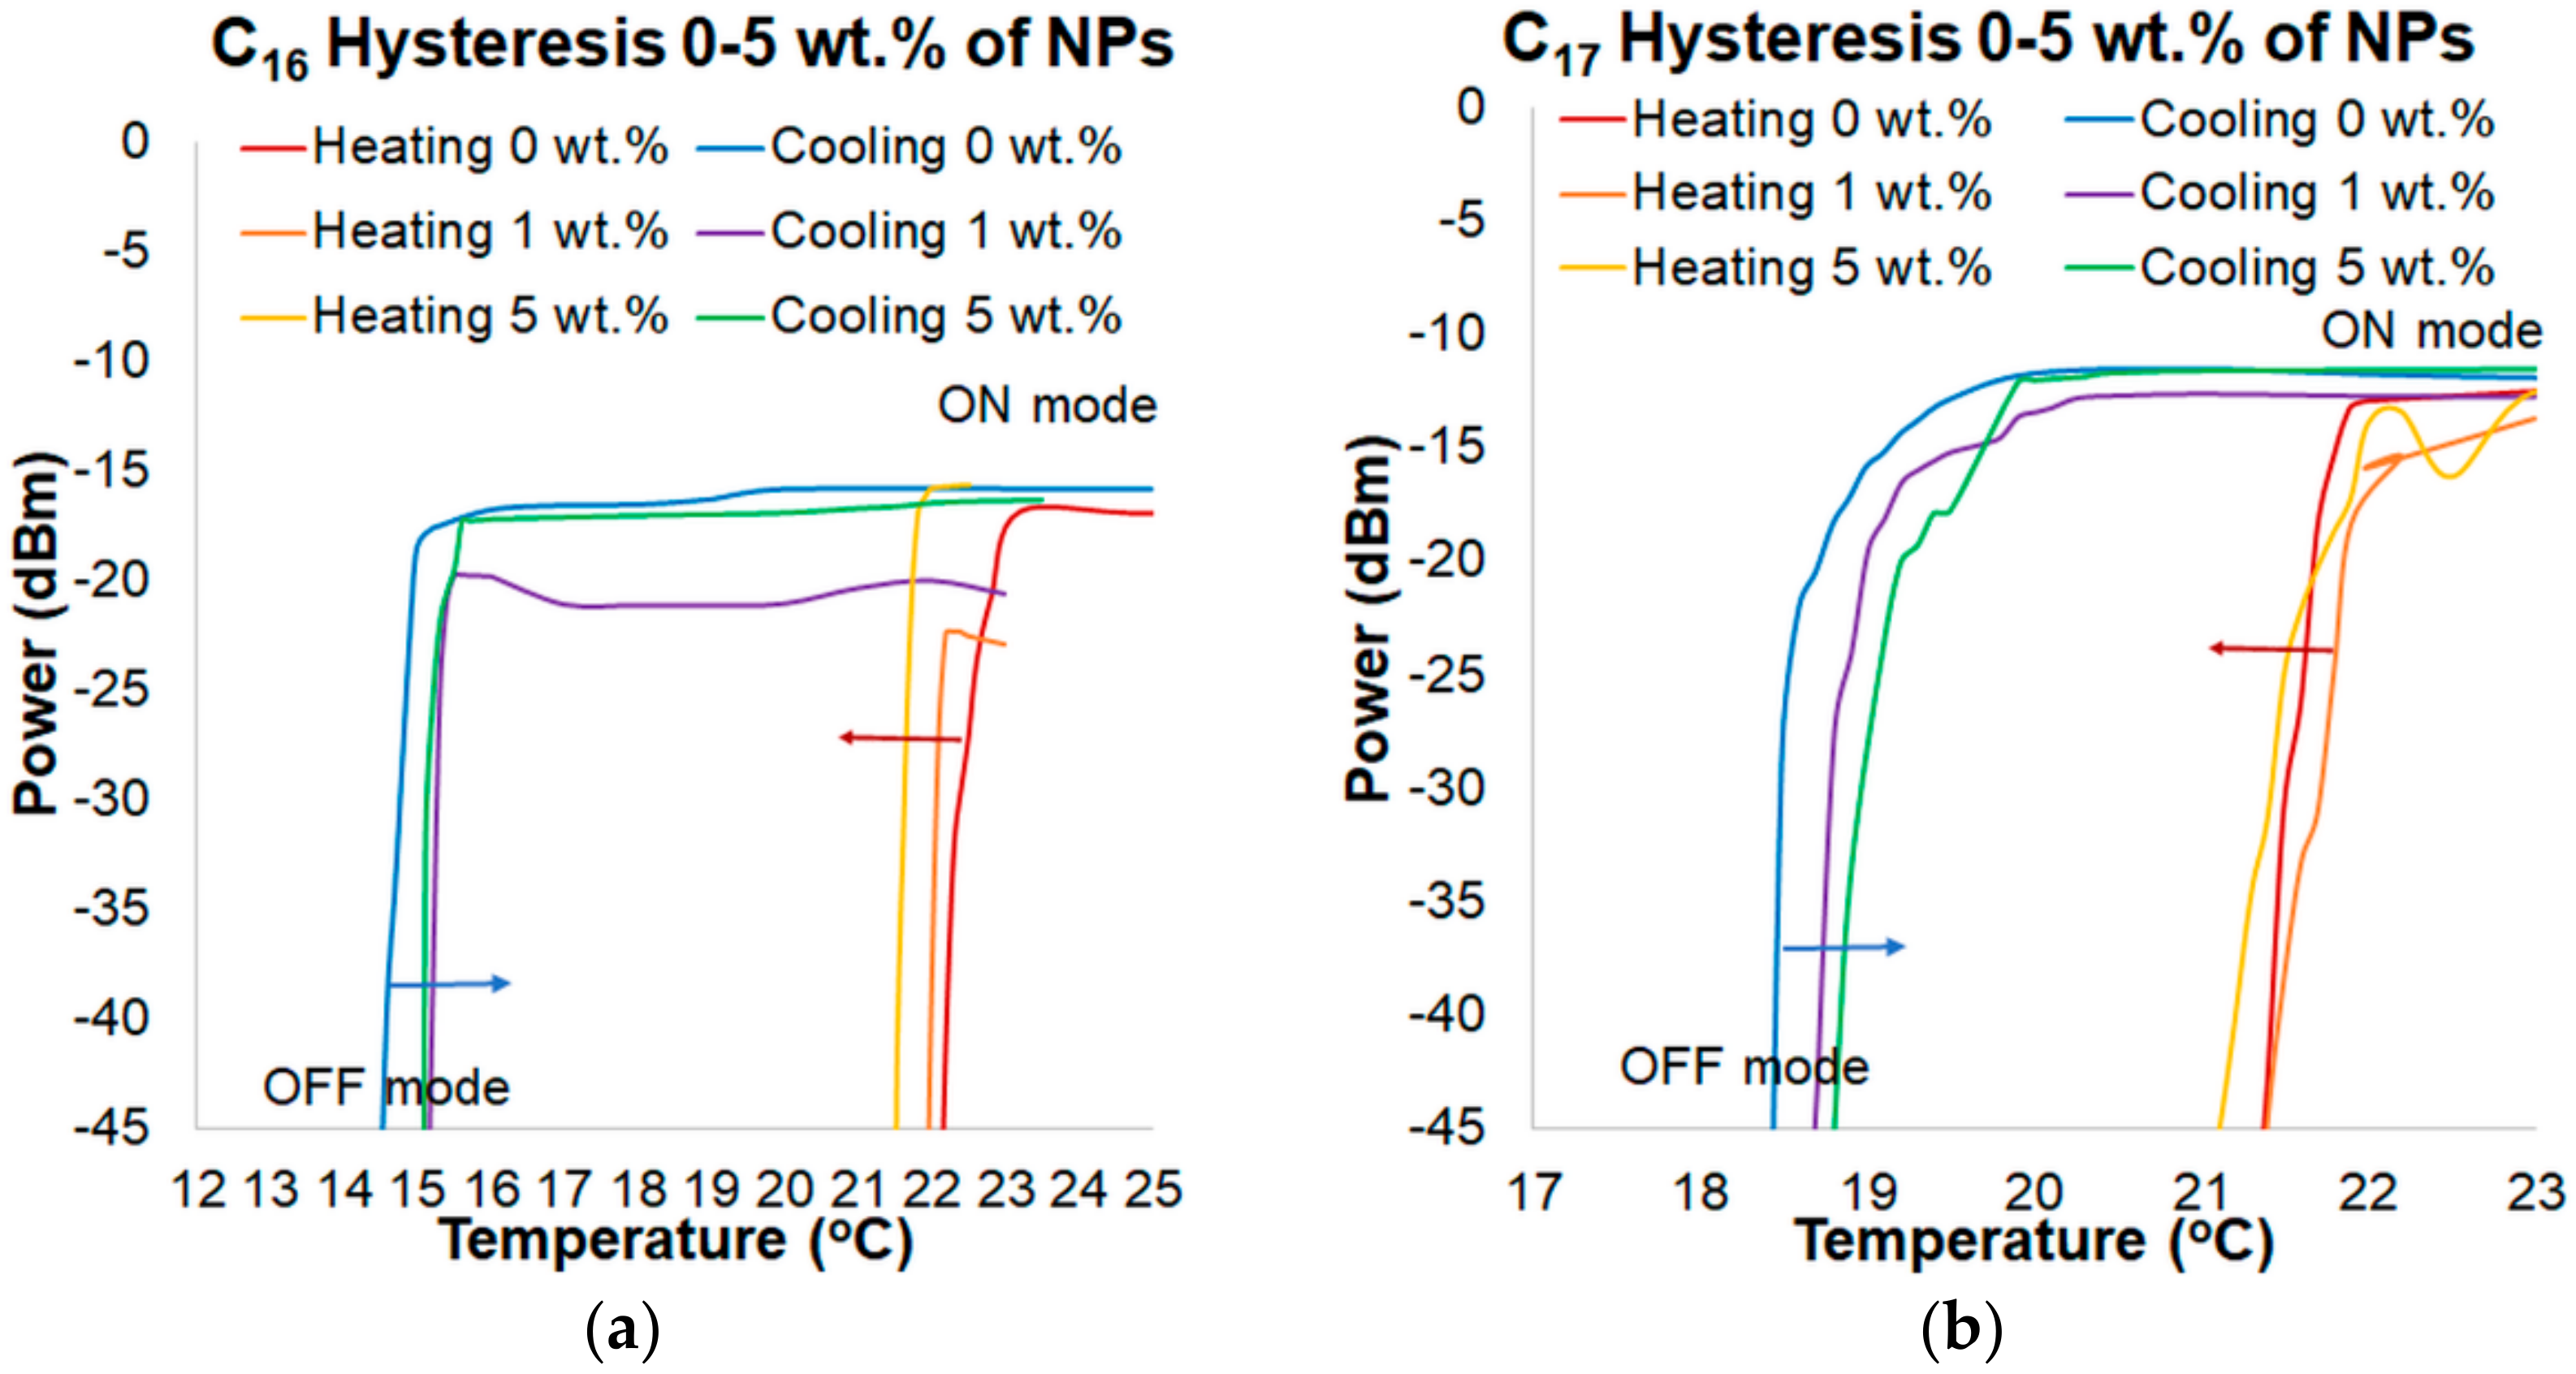
| Hysteresis (°C, 810 nm) | 7–8 | 6–7 | 6 | 3 | 2.5 | 2 |
| ΔTexpand (°C) * | 1.1–1.5 | 0.8–1 | 0.5 | 1.5 | 1.1. | 1 |
| ΔTnarrow (°C) ** | 1–1.5 | 0.3–0.4 | 0.5 | 1.5 | 1.3 | 1 |
Publisher’s Note: MDPI stays neutral with regard to jurisdictional claims in published maps and institutional affiliations. |
© 2020 by the authors. Licensee MDPI, Basel, Switzerland. This article is an open access article distributed under the terms and conditions of the Creative Commons Attribution (CC BY) license (http://creativecommons.org/licenses/by/4.0/).
Share and Cite
Moś, J.E.; Stasiewicz, K.A.; Matras-Postołek, K.; Jaroszewicz, L.R. Thermo-Optical Switching Effect Based on a Tapered Optical Fiber and Higher Alkanes Doped with ZnS:Mn. Materials 2020, 13, 5044. https://doi.org/10.3390/ma13215044
Moś JE, Stasiewicz KA, Matras-Postołek K, Jaroszewicz LR. Thermo-Optical Switching Effect Based on a Tapered Optical Fiber and Higher Alkanes Doped with ZnS:Mn. Materials. 2020; 13(21):5044. https://doi.org/10.3390/ma13215044
Chicago/Turabian StyleMoś, Joanna E., Karol A. Stasiewicz, Katarzyna Matras-Postołek, and Leszek R. Jaroszewicz. 2020. "Thermo-Optical Switching Effect Based on a Tapered Optical Fiber and Higher Alkanes Doped with ZnS:Mn" Materials 13, no. 21: 5044. https://doi.org/10.3390/ma13215044