Experimental and Numerical Analysis of 60-Year-Old Sluice Gate Affected by Long-Term Operation


Abstract
:1. Introduction
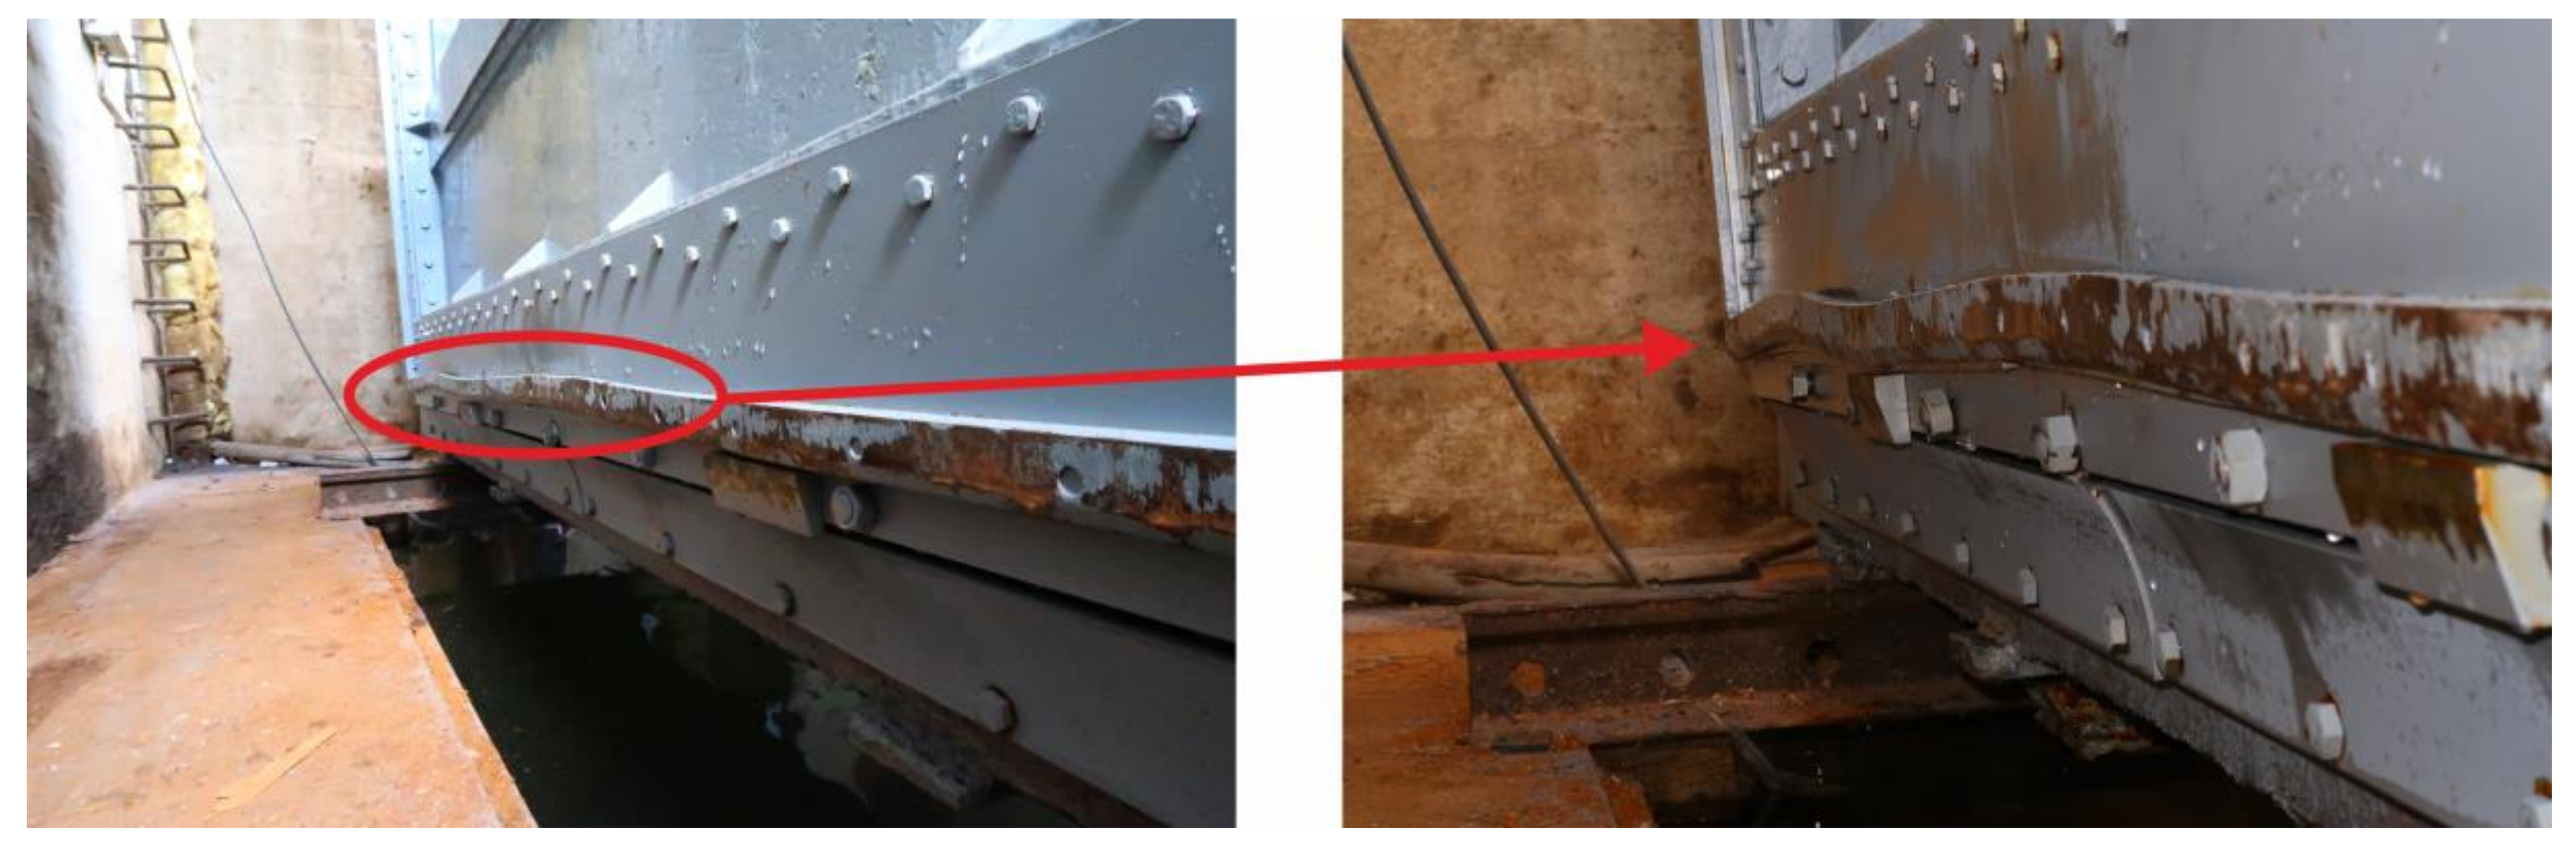
- assessment of material loss due to corrosion;
- determination of material properties;
- assessment of mechanical properties of the construction material due to its degradation after long-term operation, especially in structures affected by temperature, i.e., mainly in structures made from materials with creeping tendency;
- computational verification of strength, deformations and stability of structures;
- experimental determination of deformation and strength properties of structures in operating conditions, evaluation and analysis of data indicating technical condition of the structure;
- experimental determination of residual stresses taking into account production technology of the structure and the effect of operational overload; and
- experimental-computational assessment of fatigue damage accumulation and estimation of residual life.
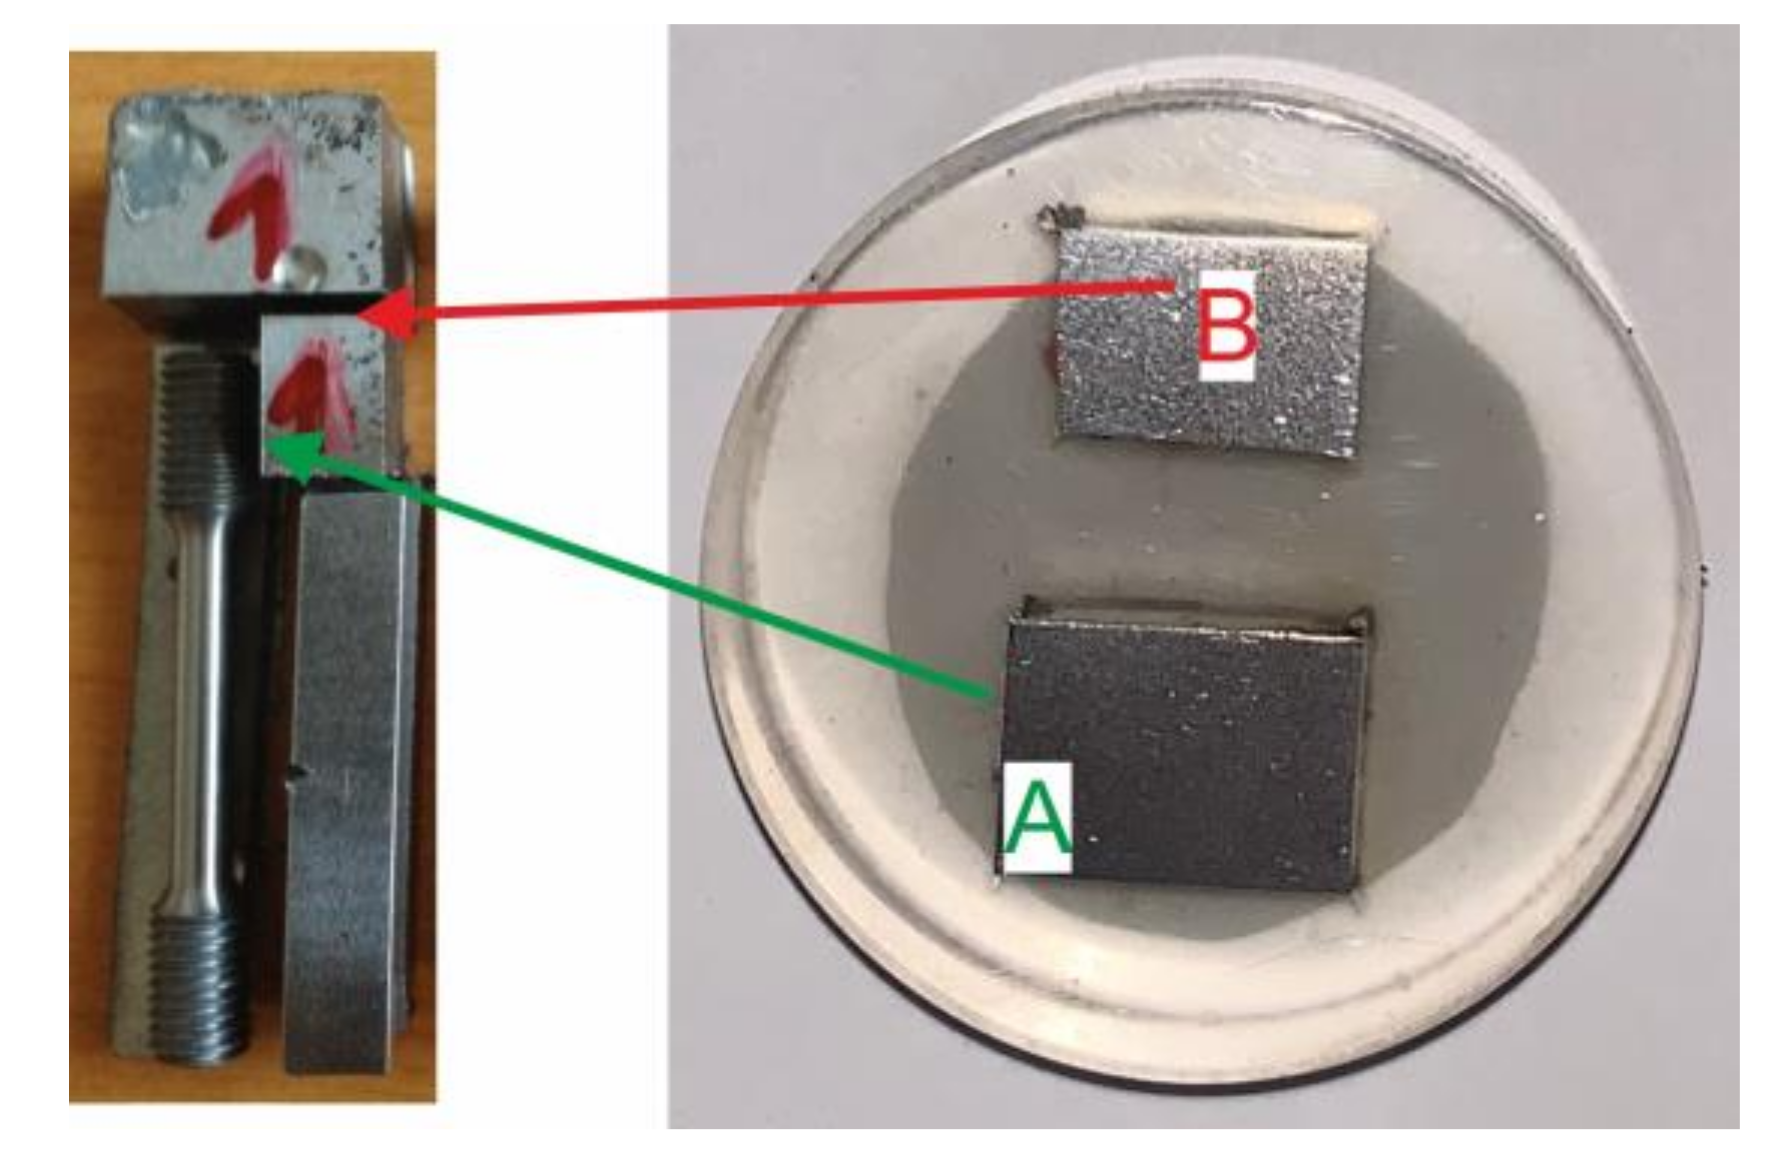
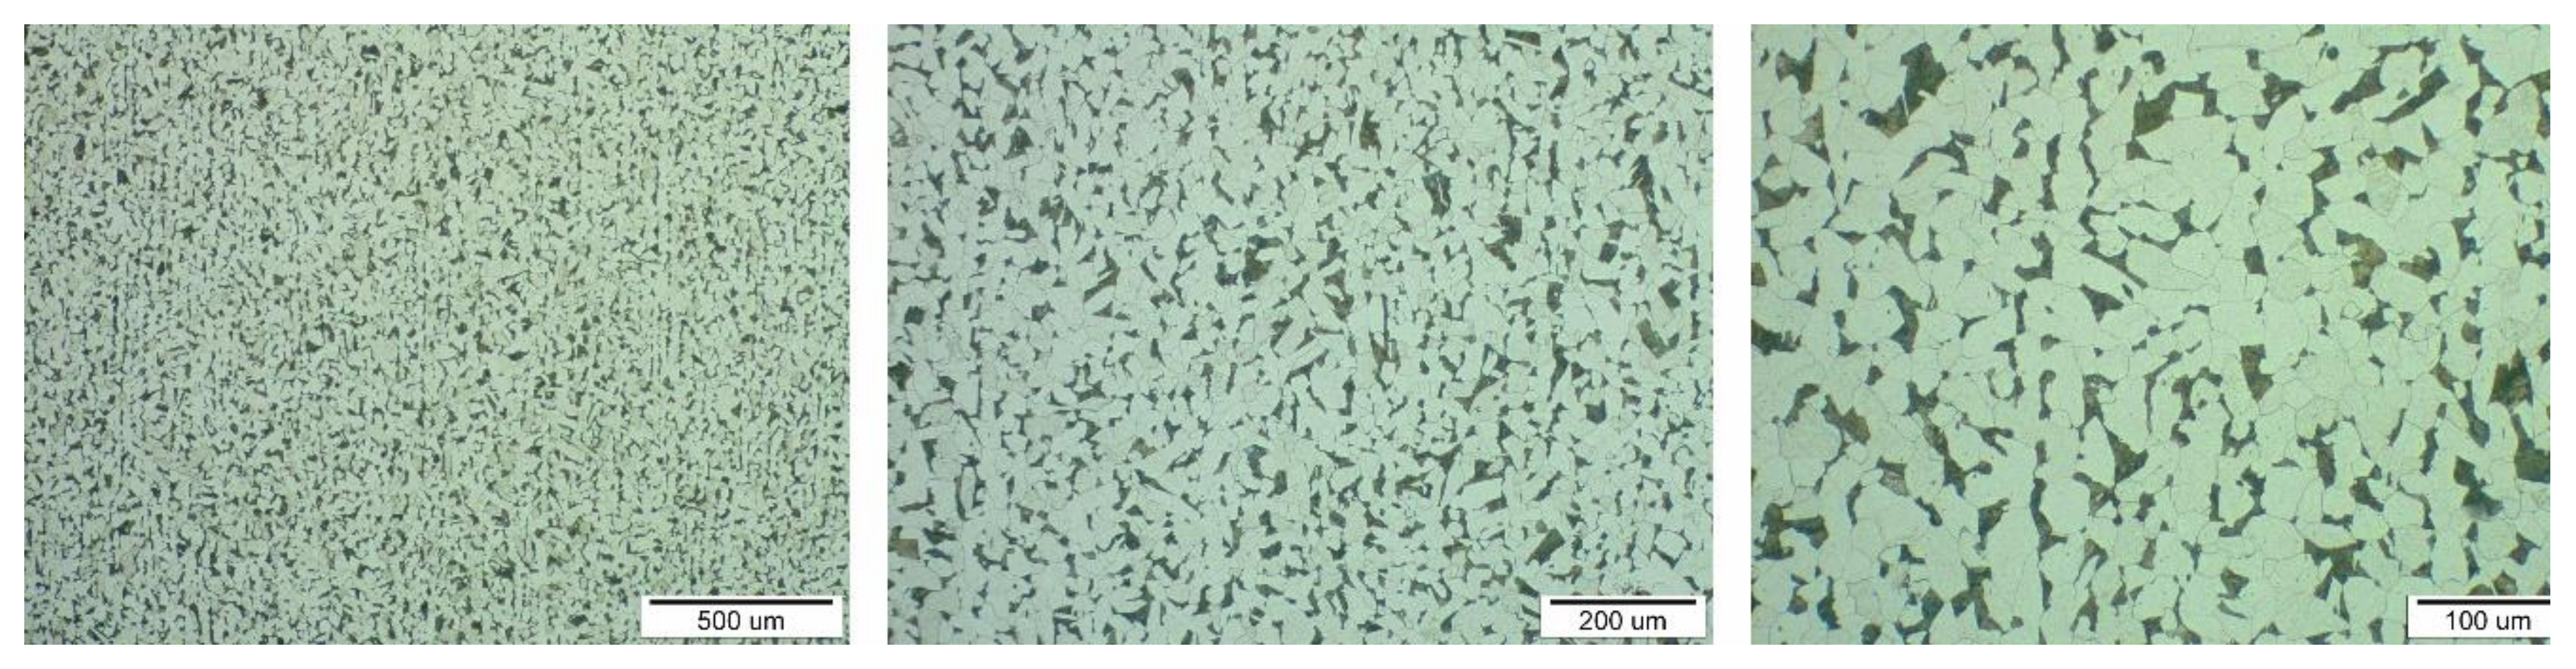
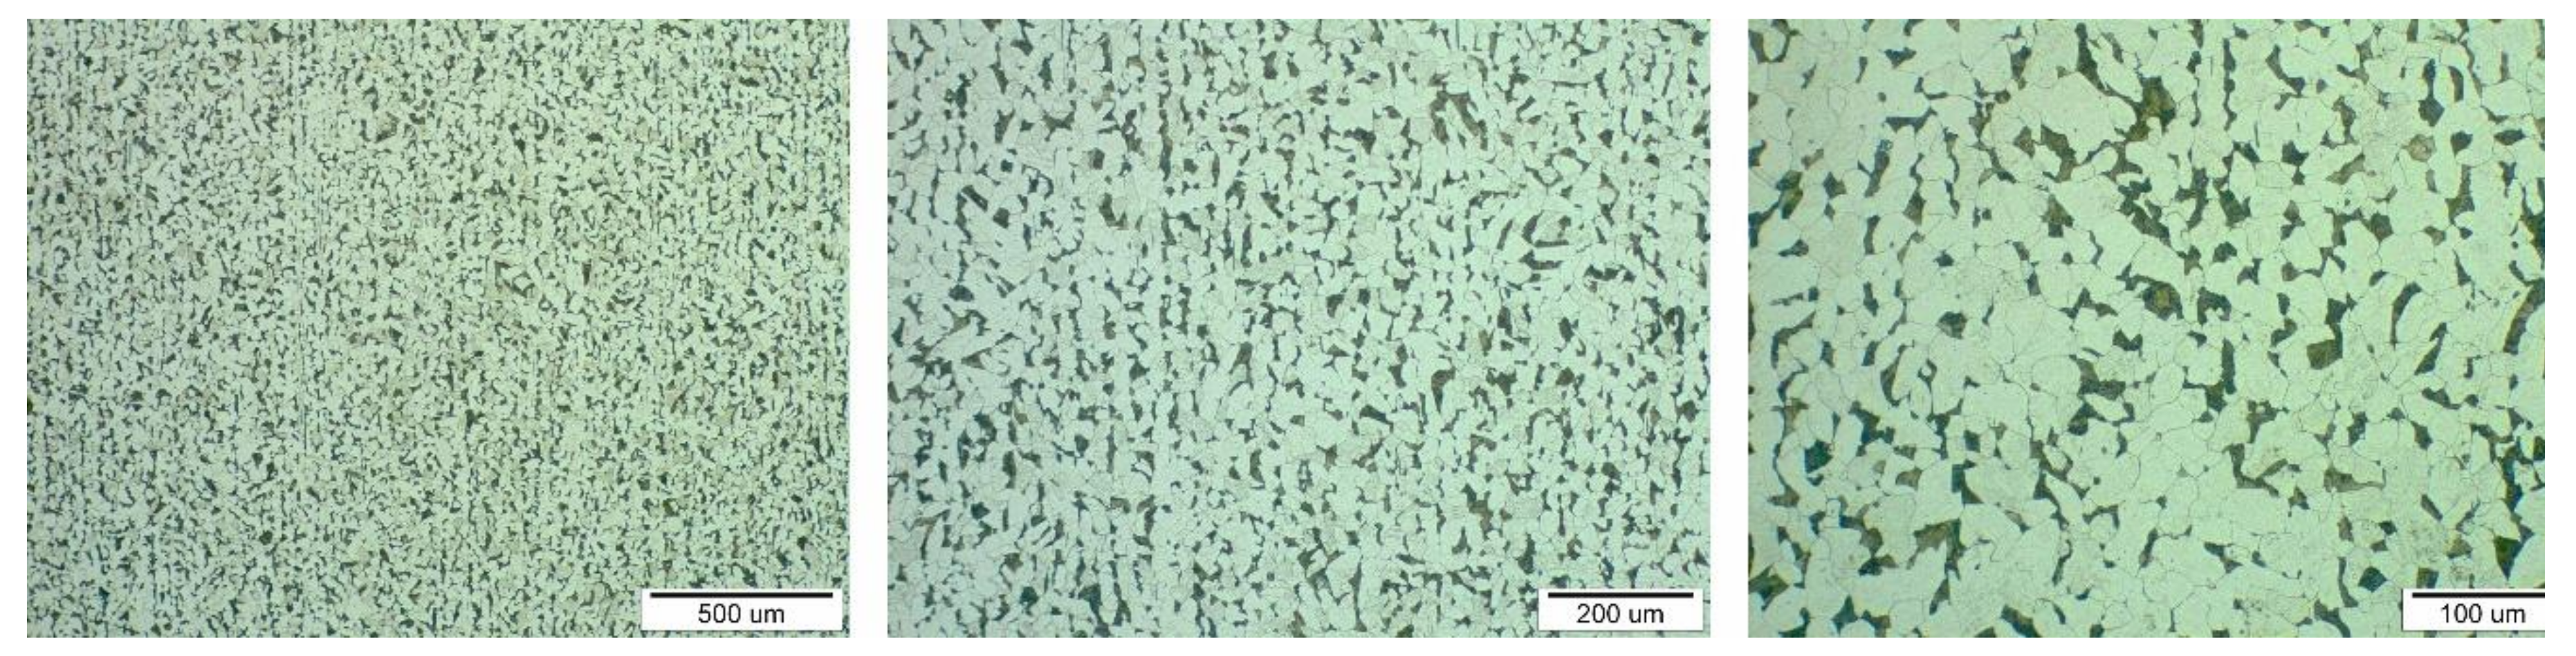
2. Determination of Mechanical Properties
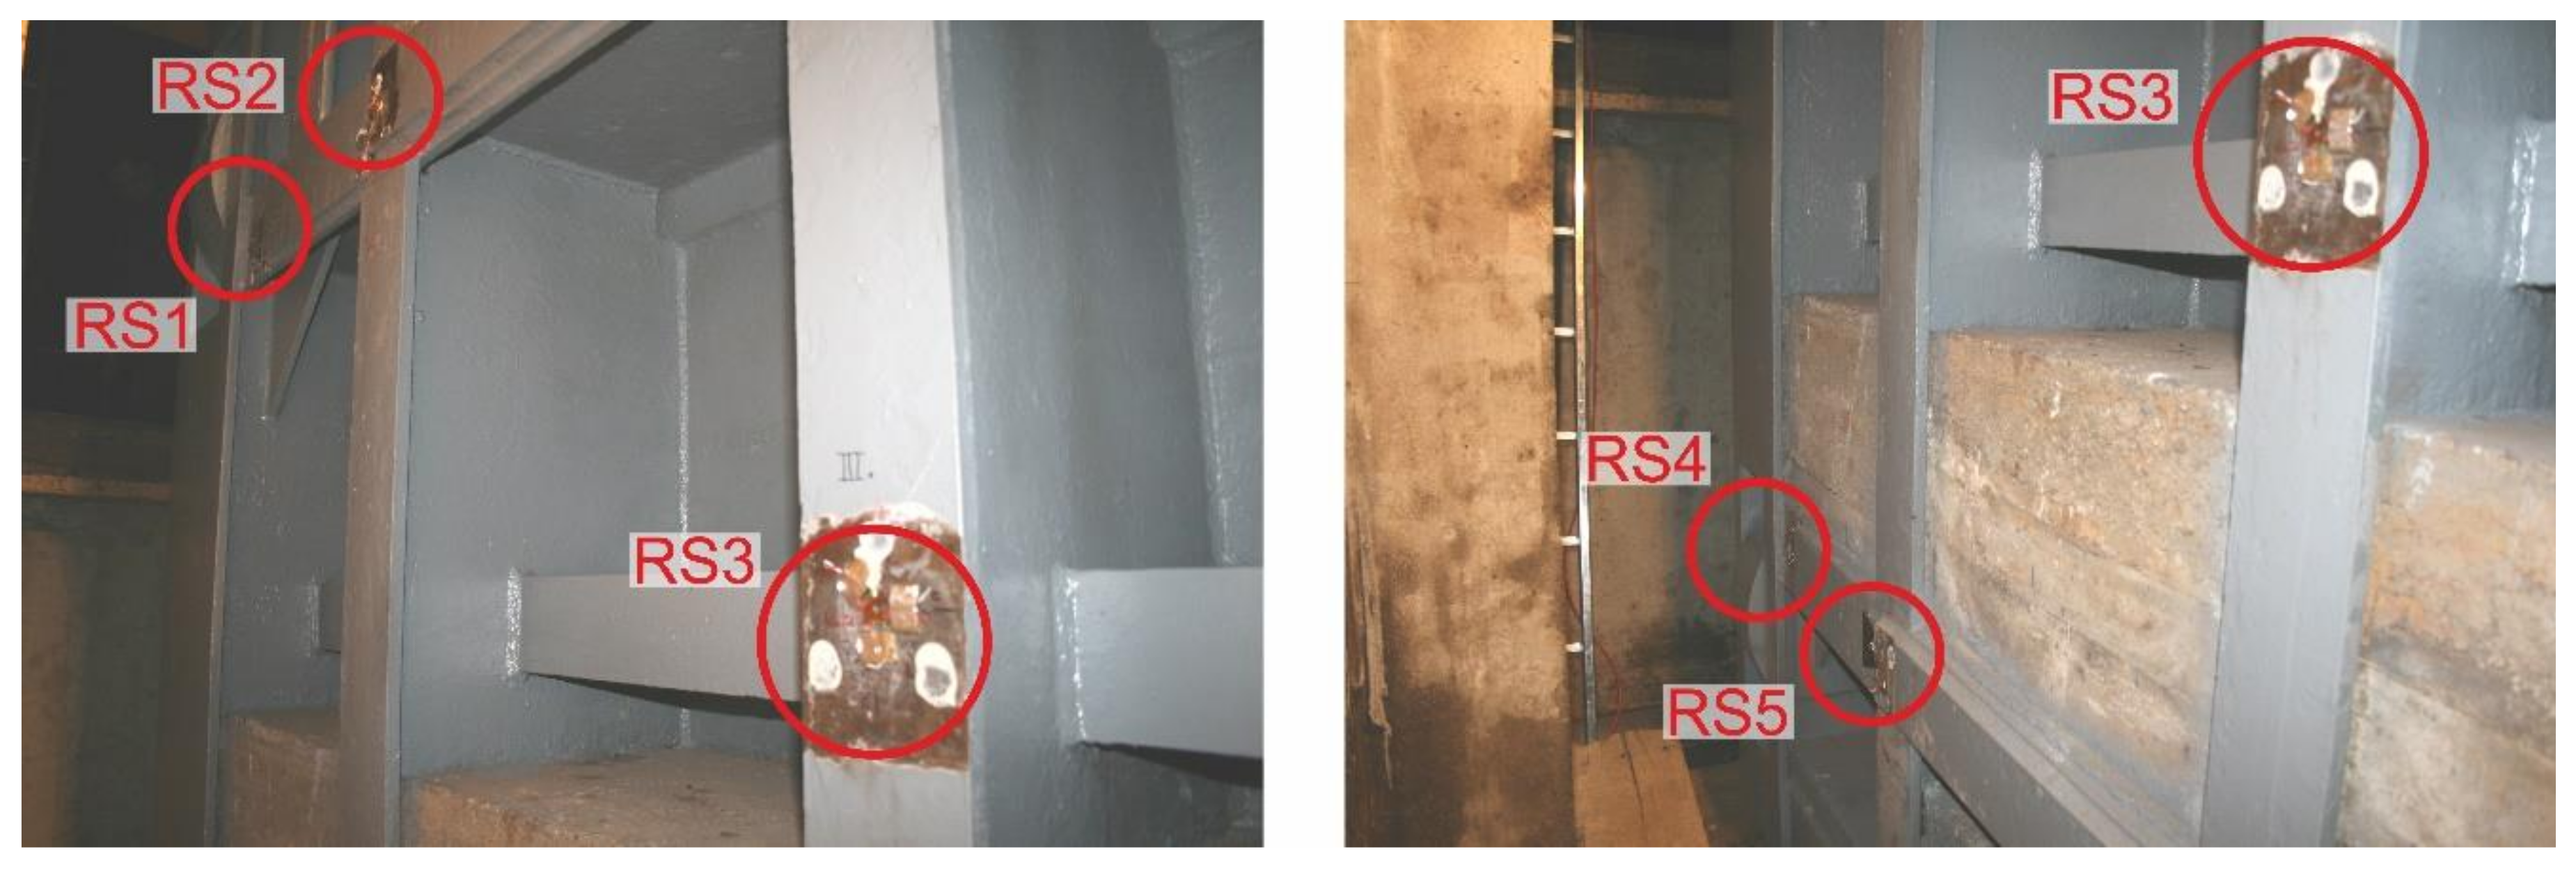
3. Determination of Residual Stresses on Sluice Gate
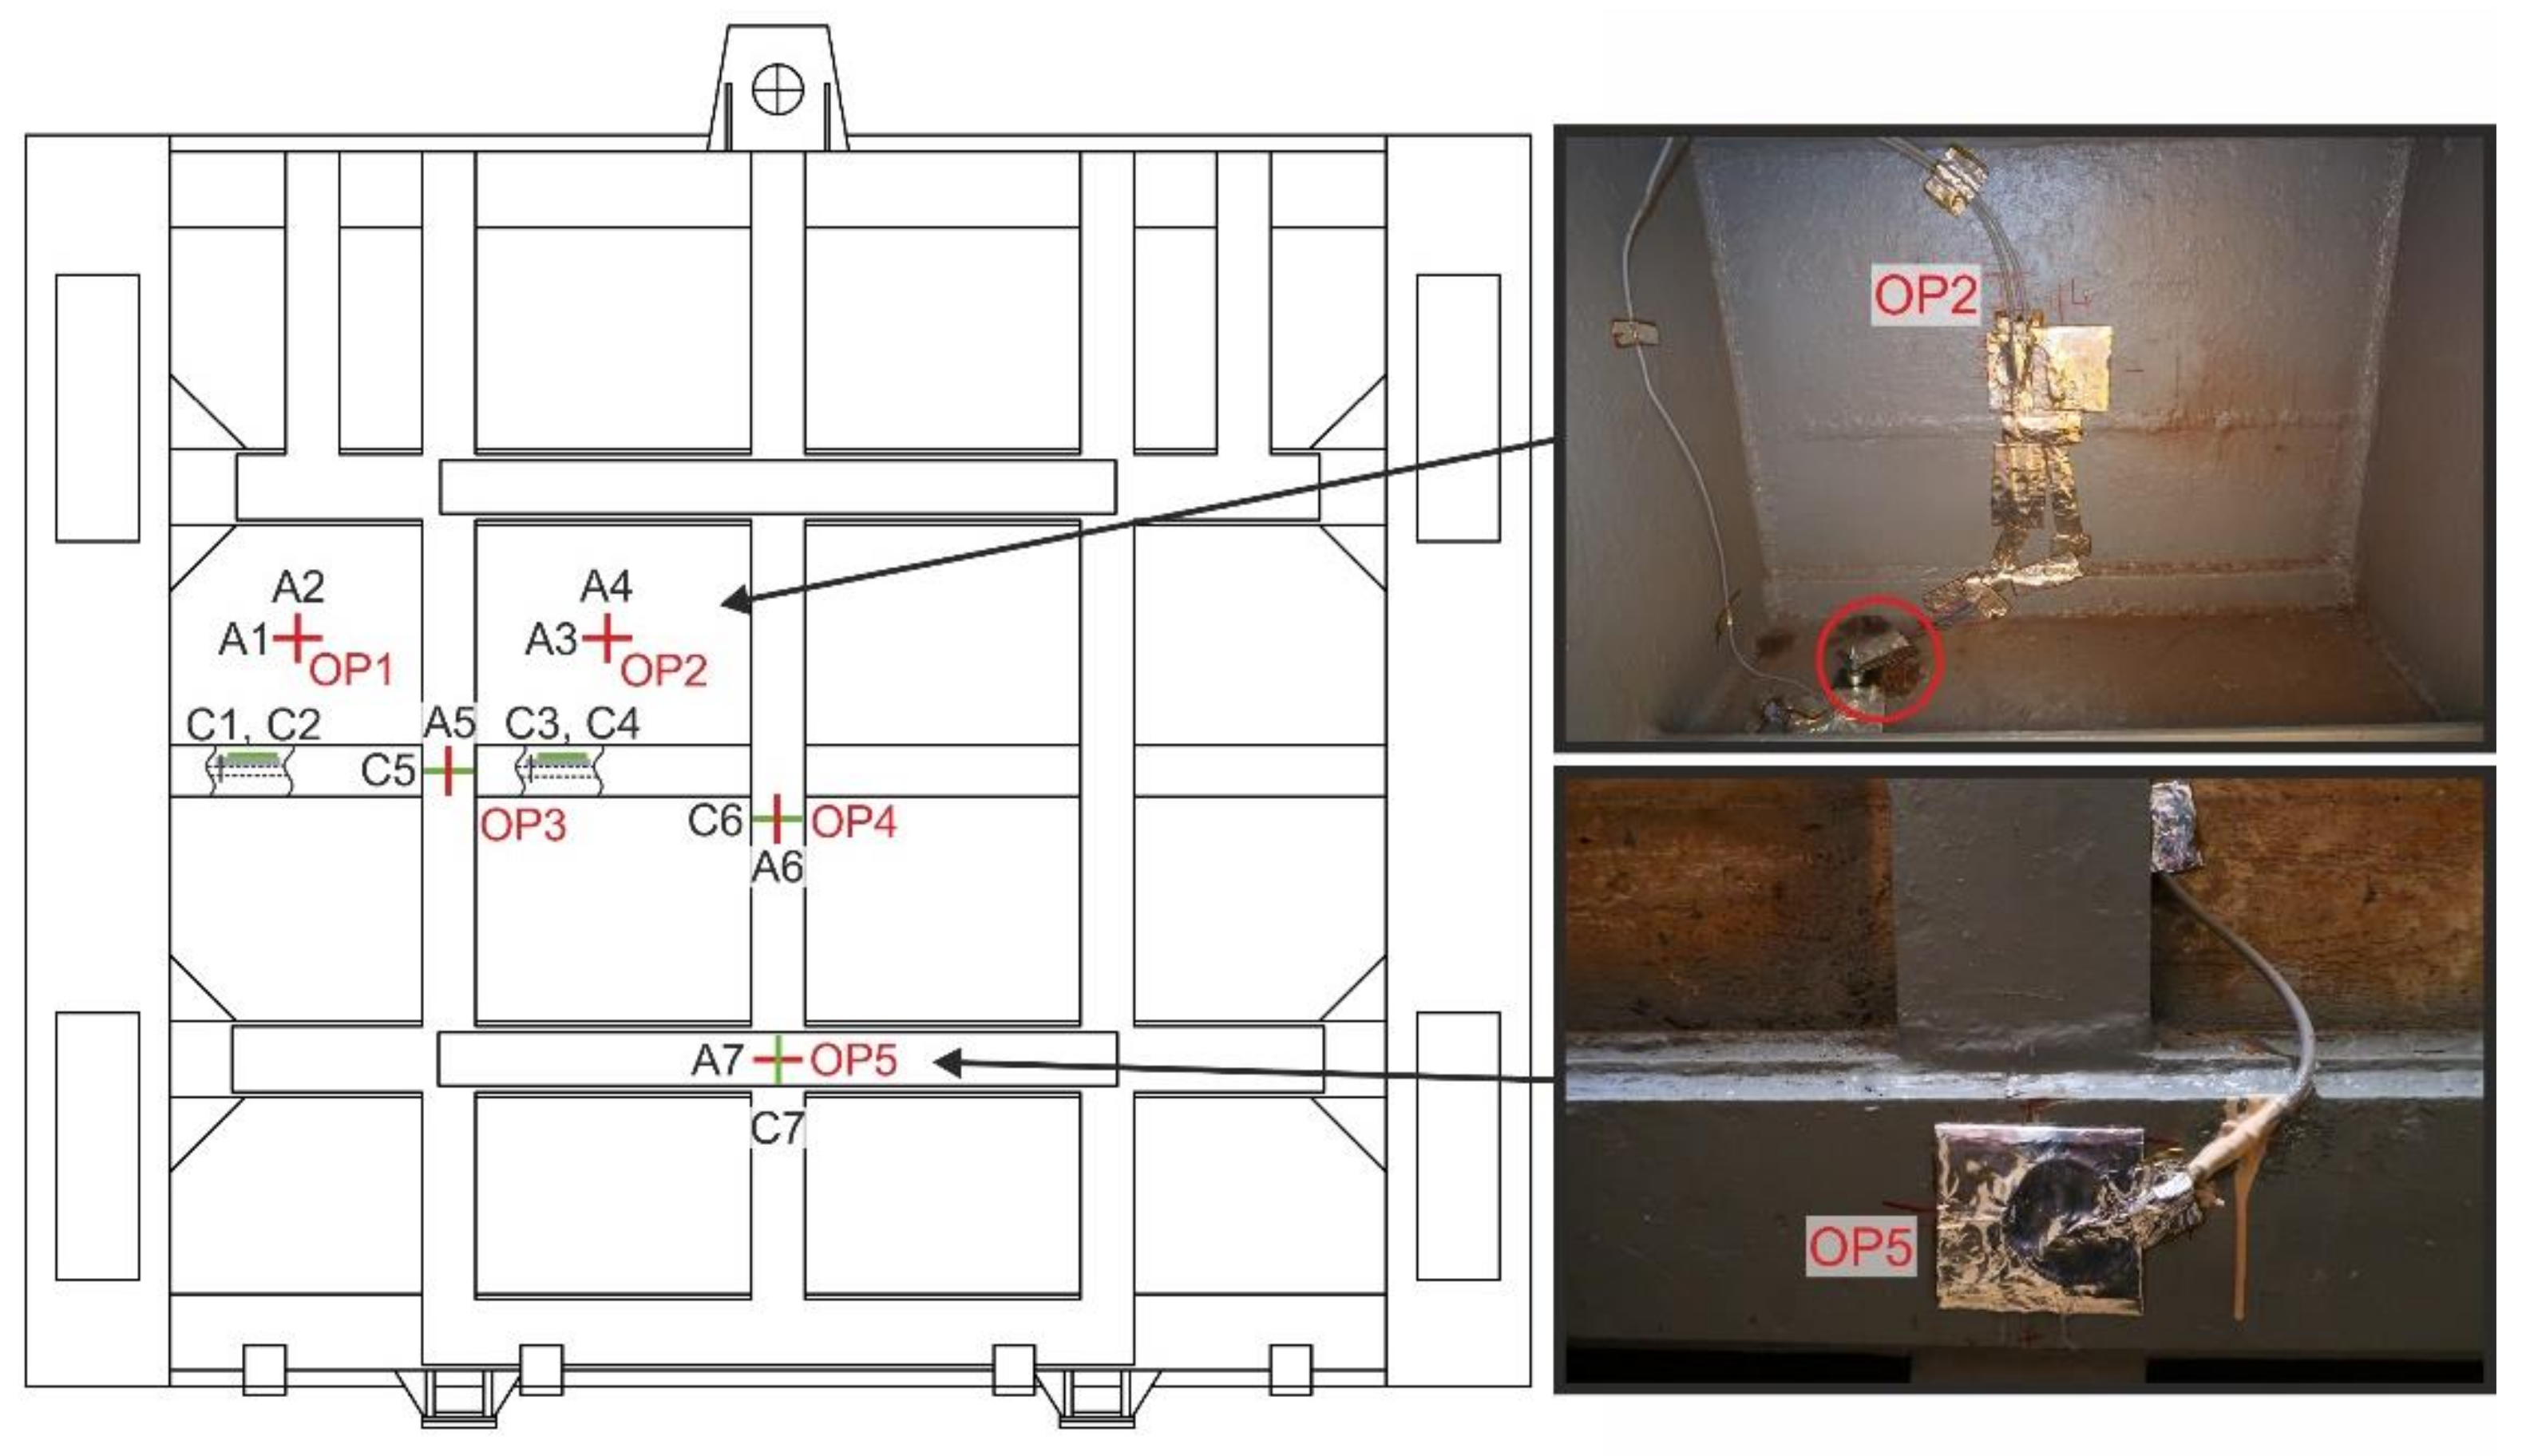
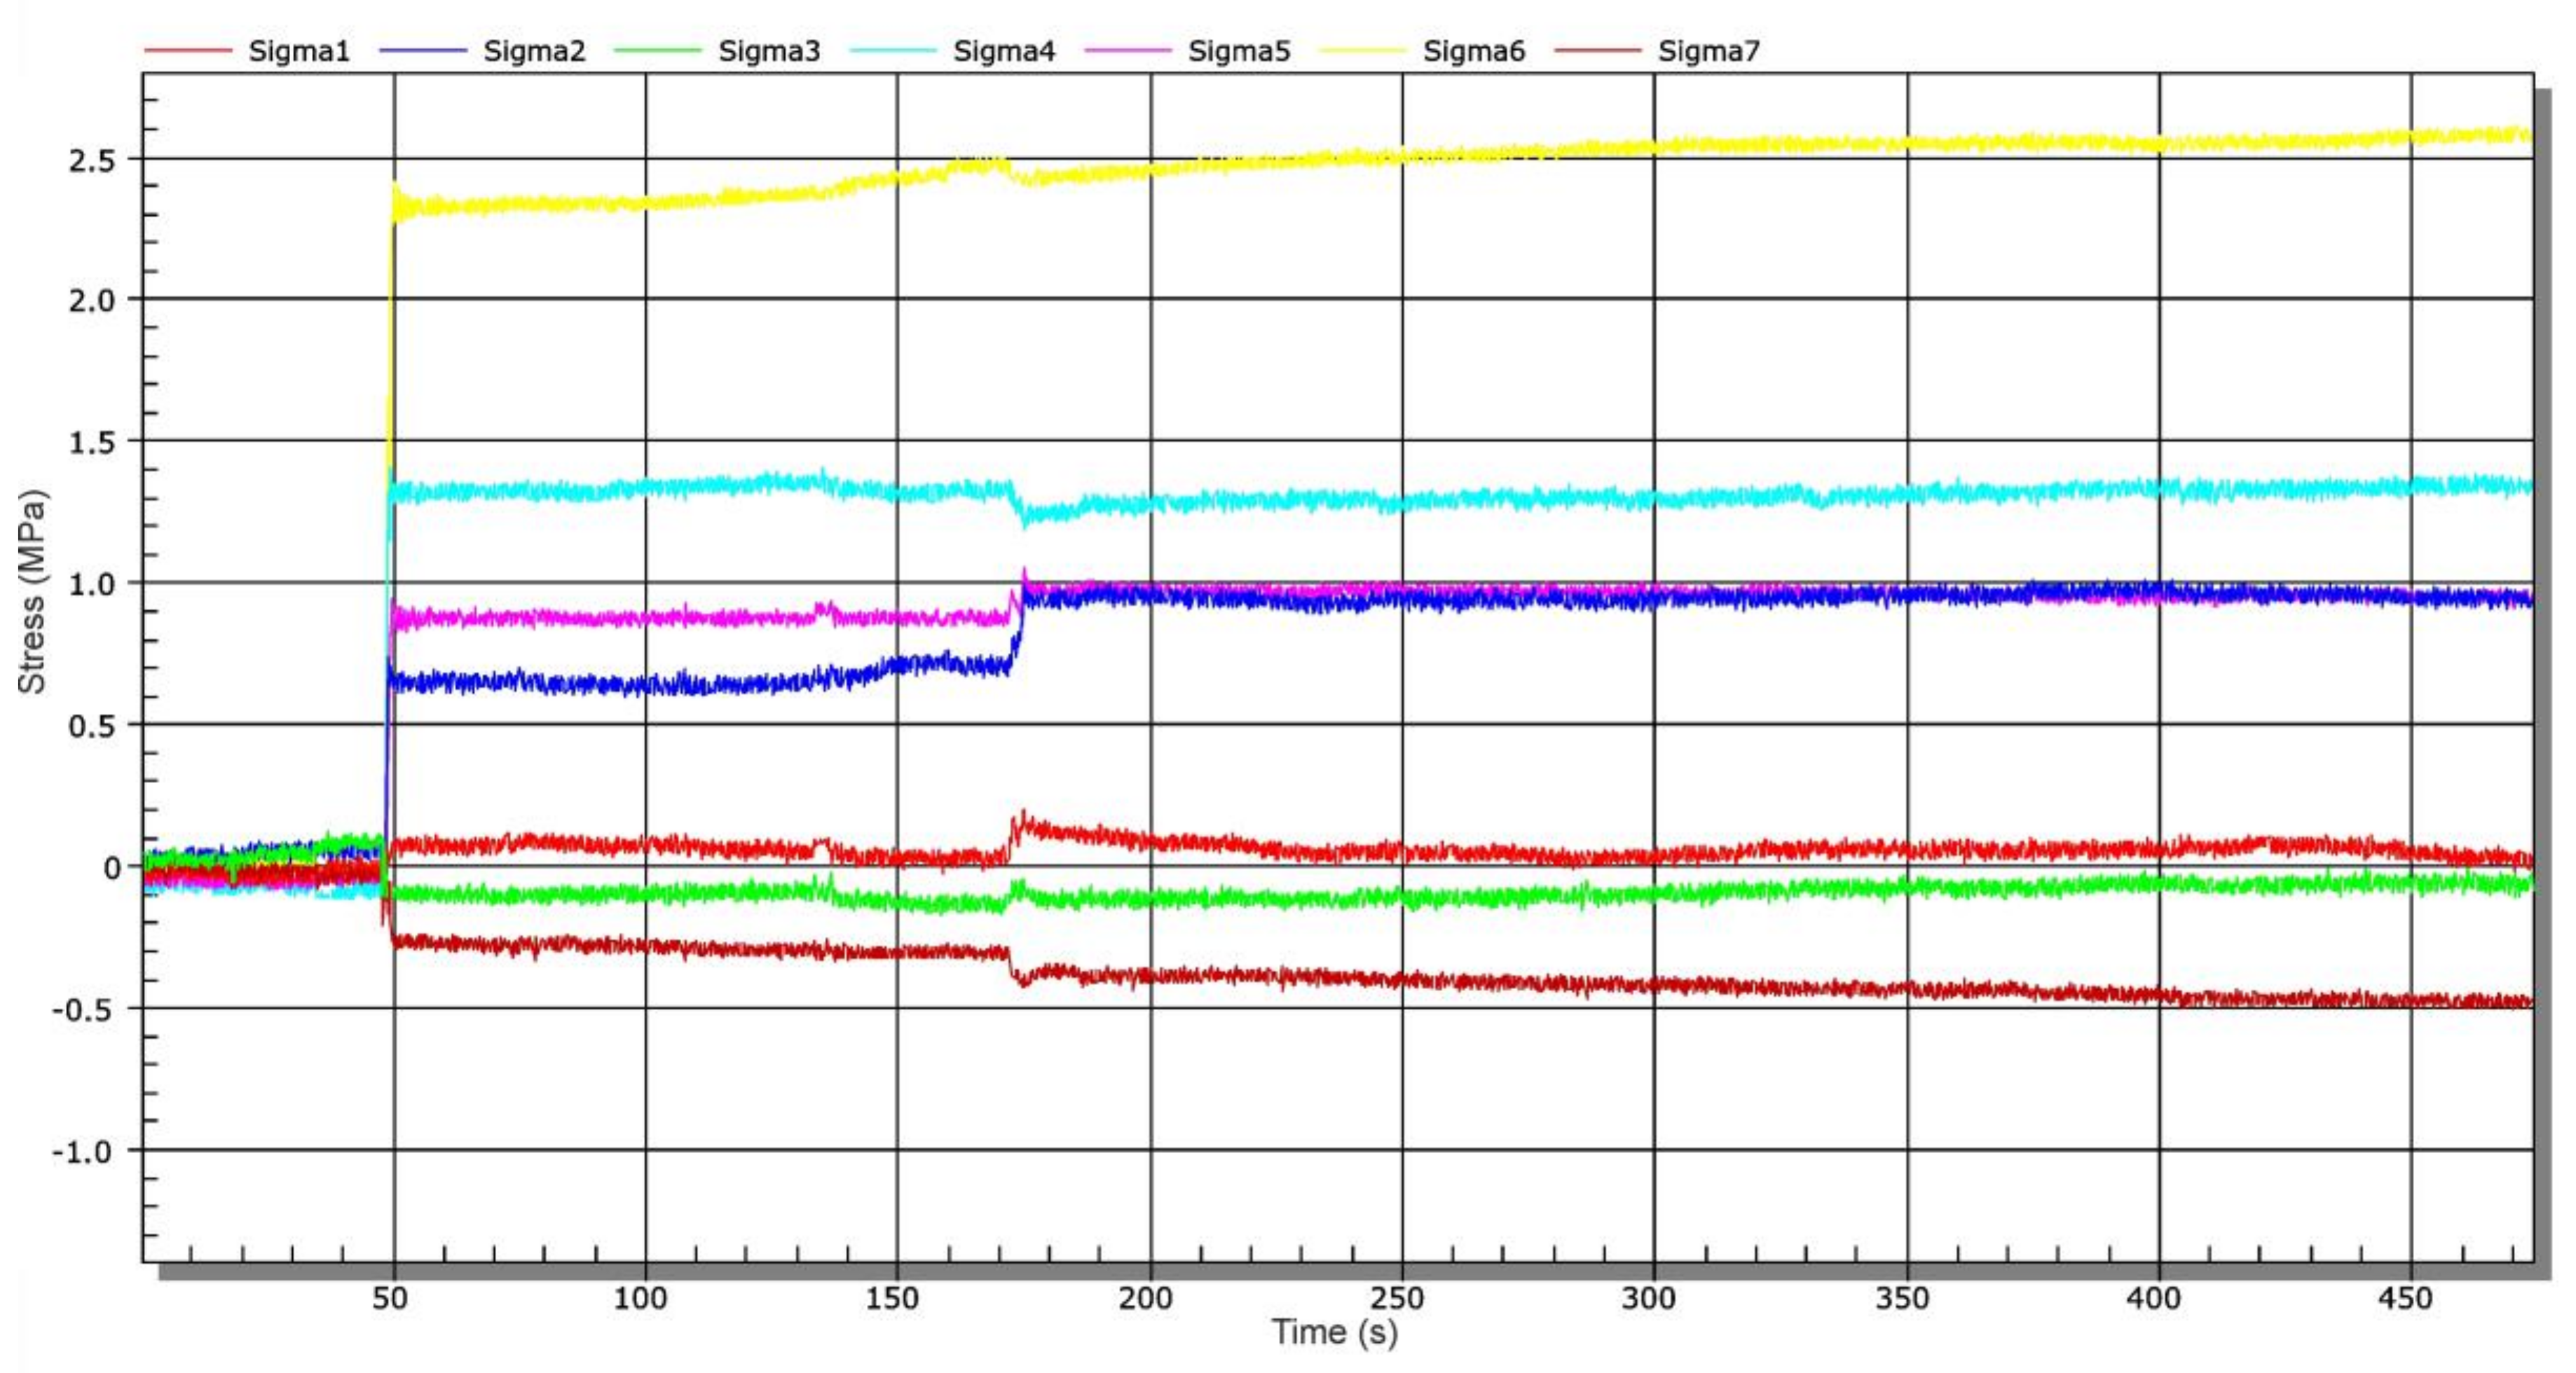
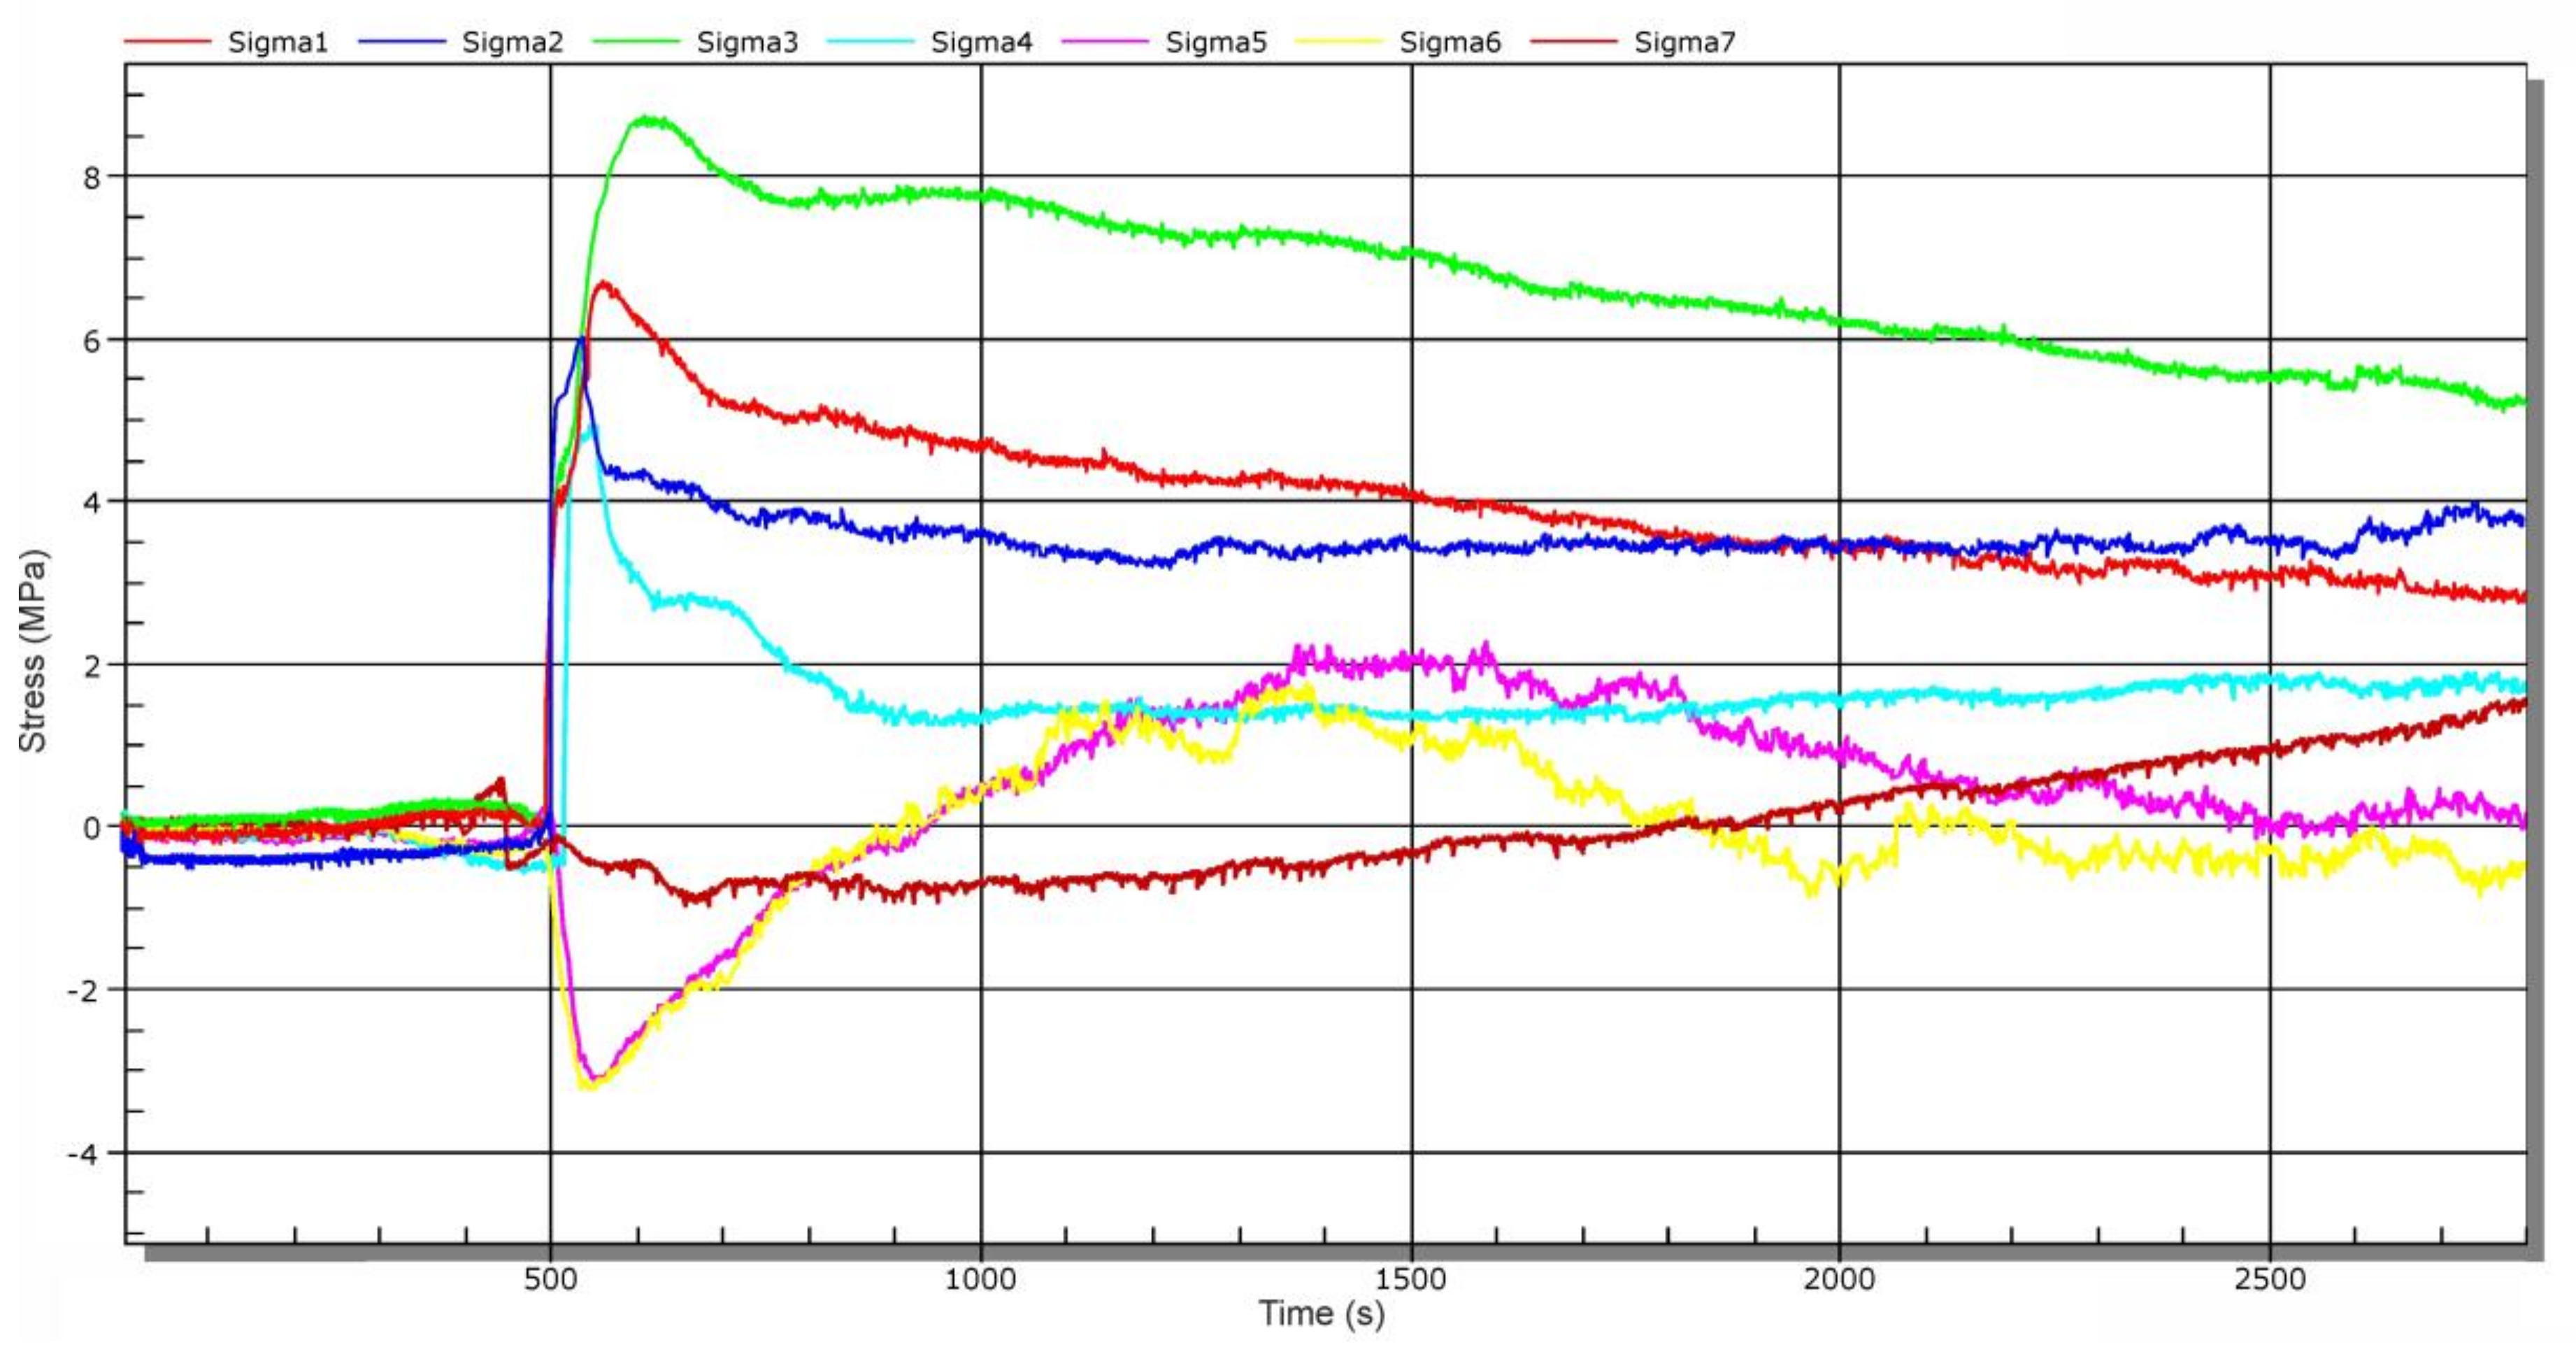
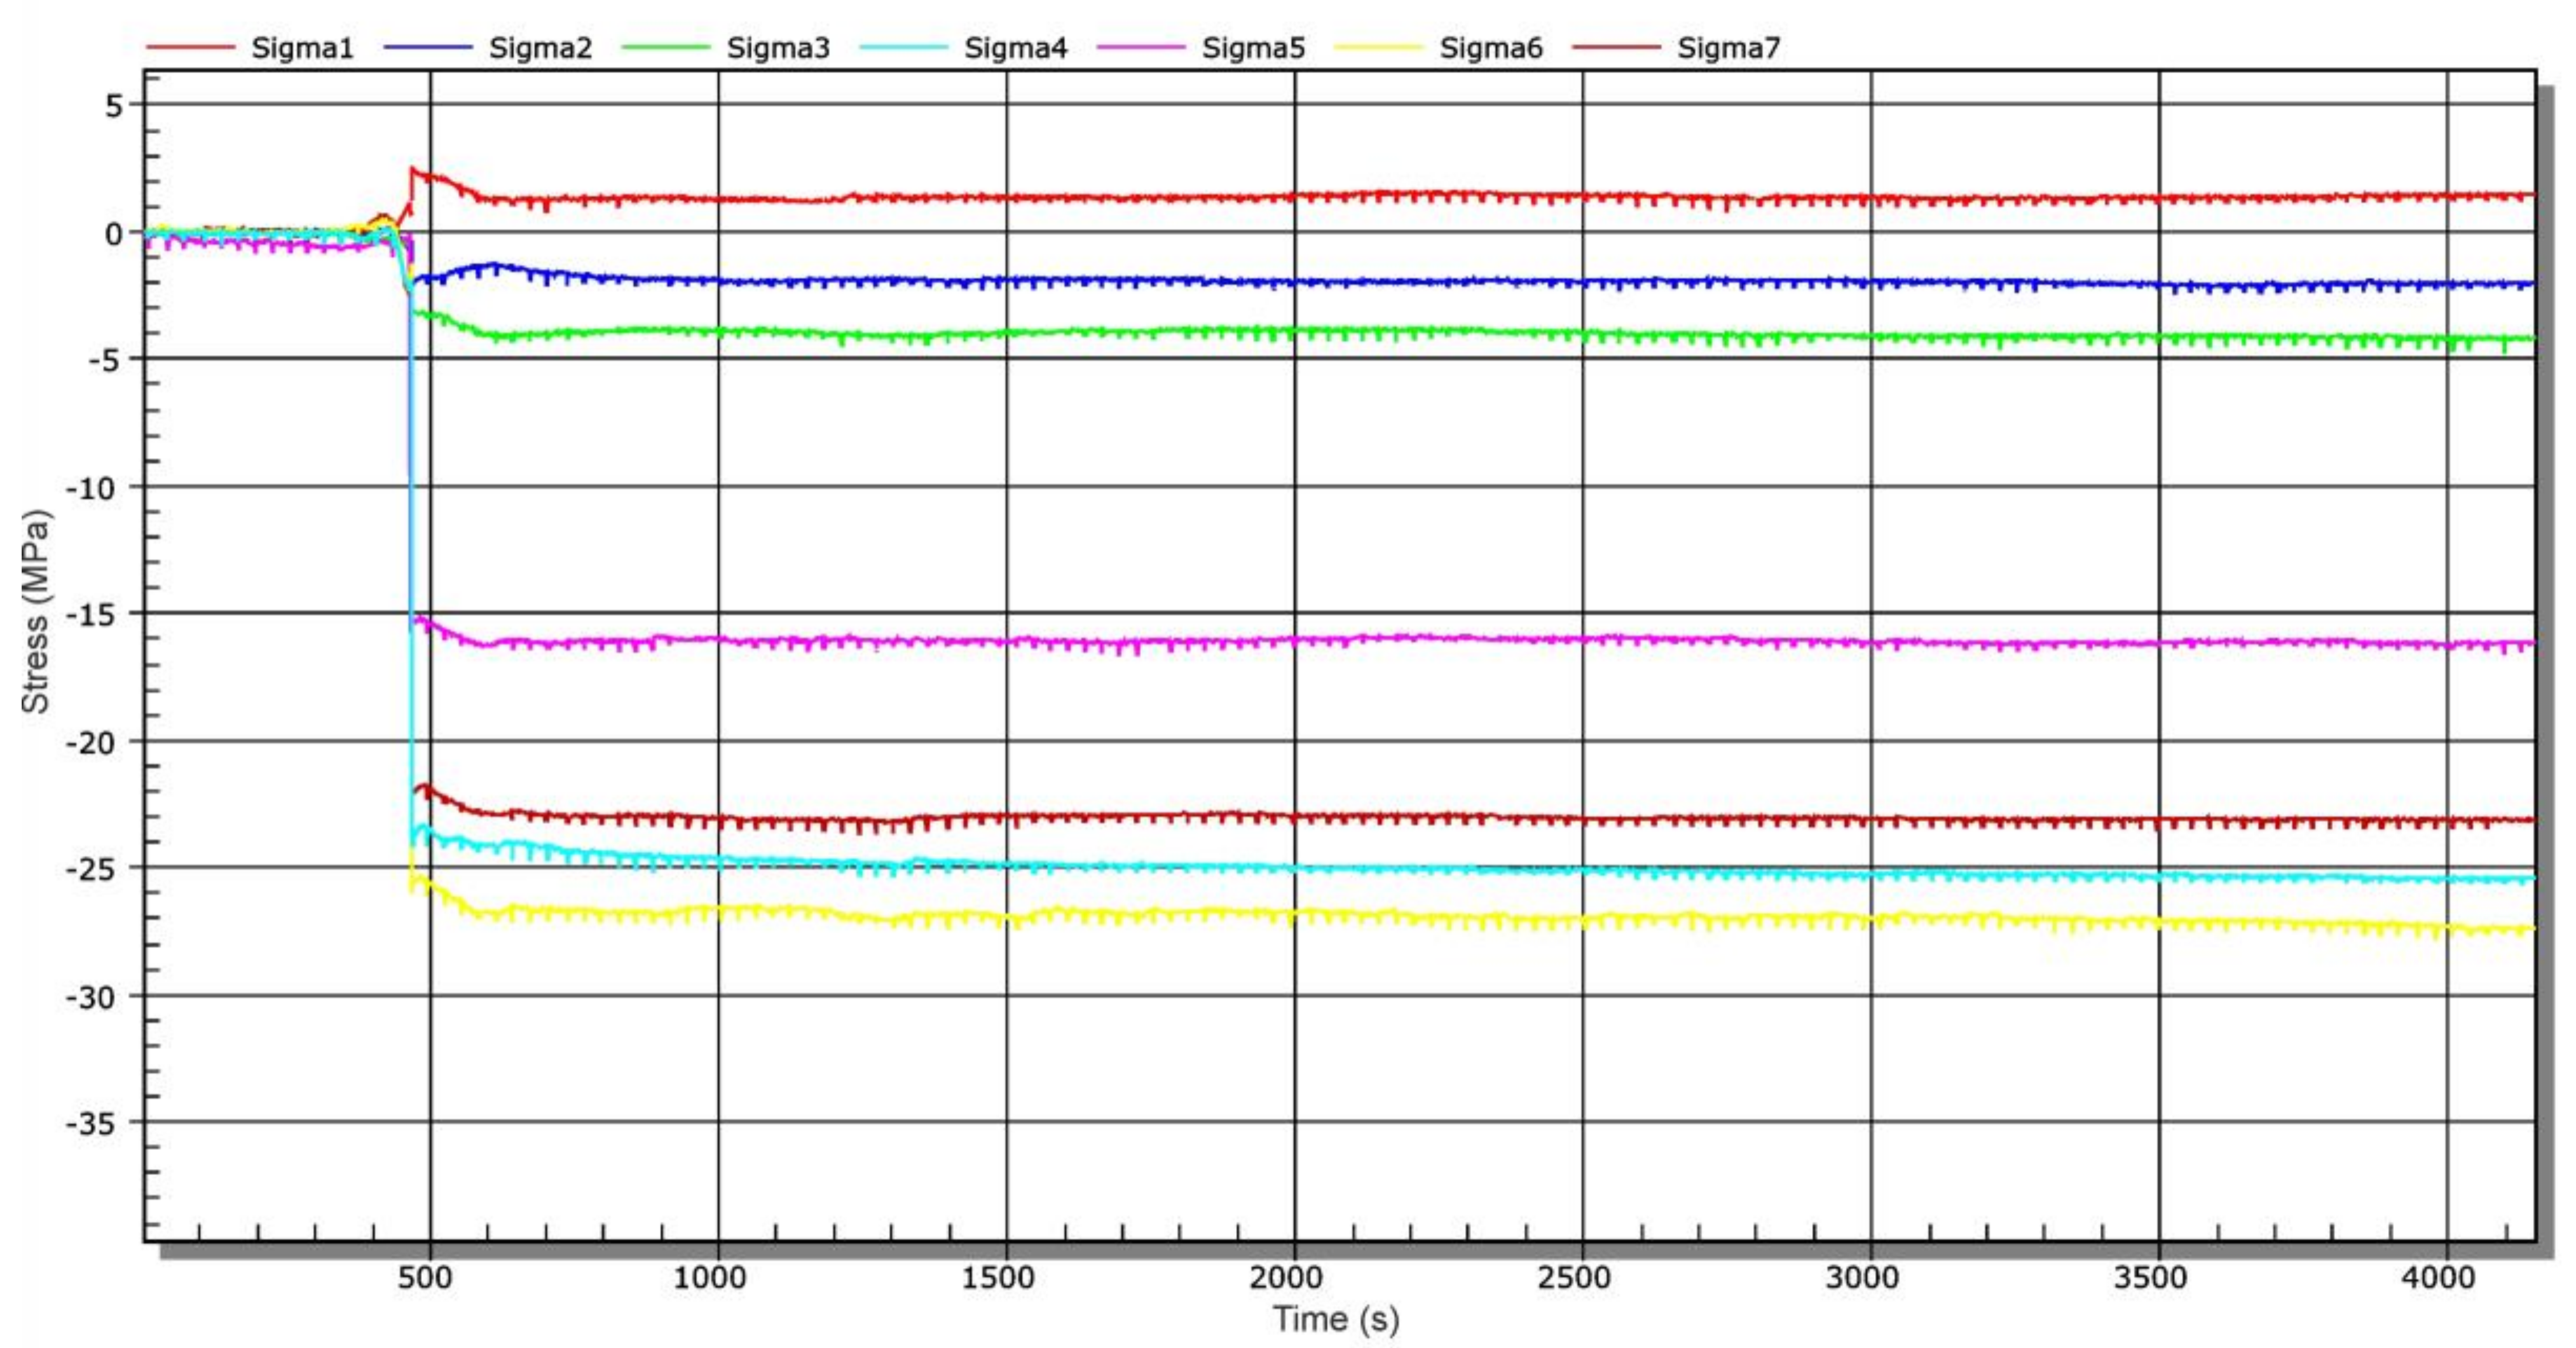
4. Experimental Determination of Time Changes of Stresses in Selected Places of Sluice Gate during Operation
5. Determination of Stress Ratios in Load-Bearing Elements of the Sluice Gate by the Finite Element Method
- The numerical calculation takes into account the most unfavourable stress.
- In the computational model, passive relationships between the threshold and the sluice gate were not considered.
- In the experimental verification, the boundary conditions take into account flexibility of the boundaries as well as all local real contact pressures, which is not possible in numerical modelling. Ideal stiff bonds are considered in numerical modelling in contrast to experimental measurements on a real object.
6. Conclusions
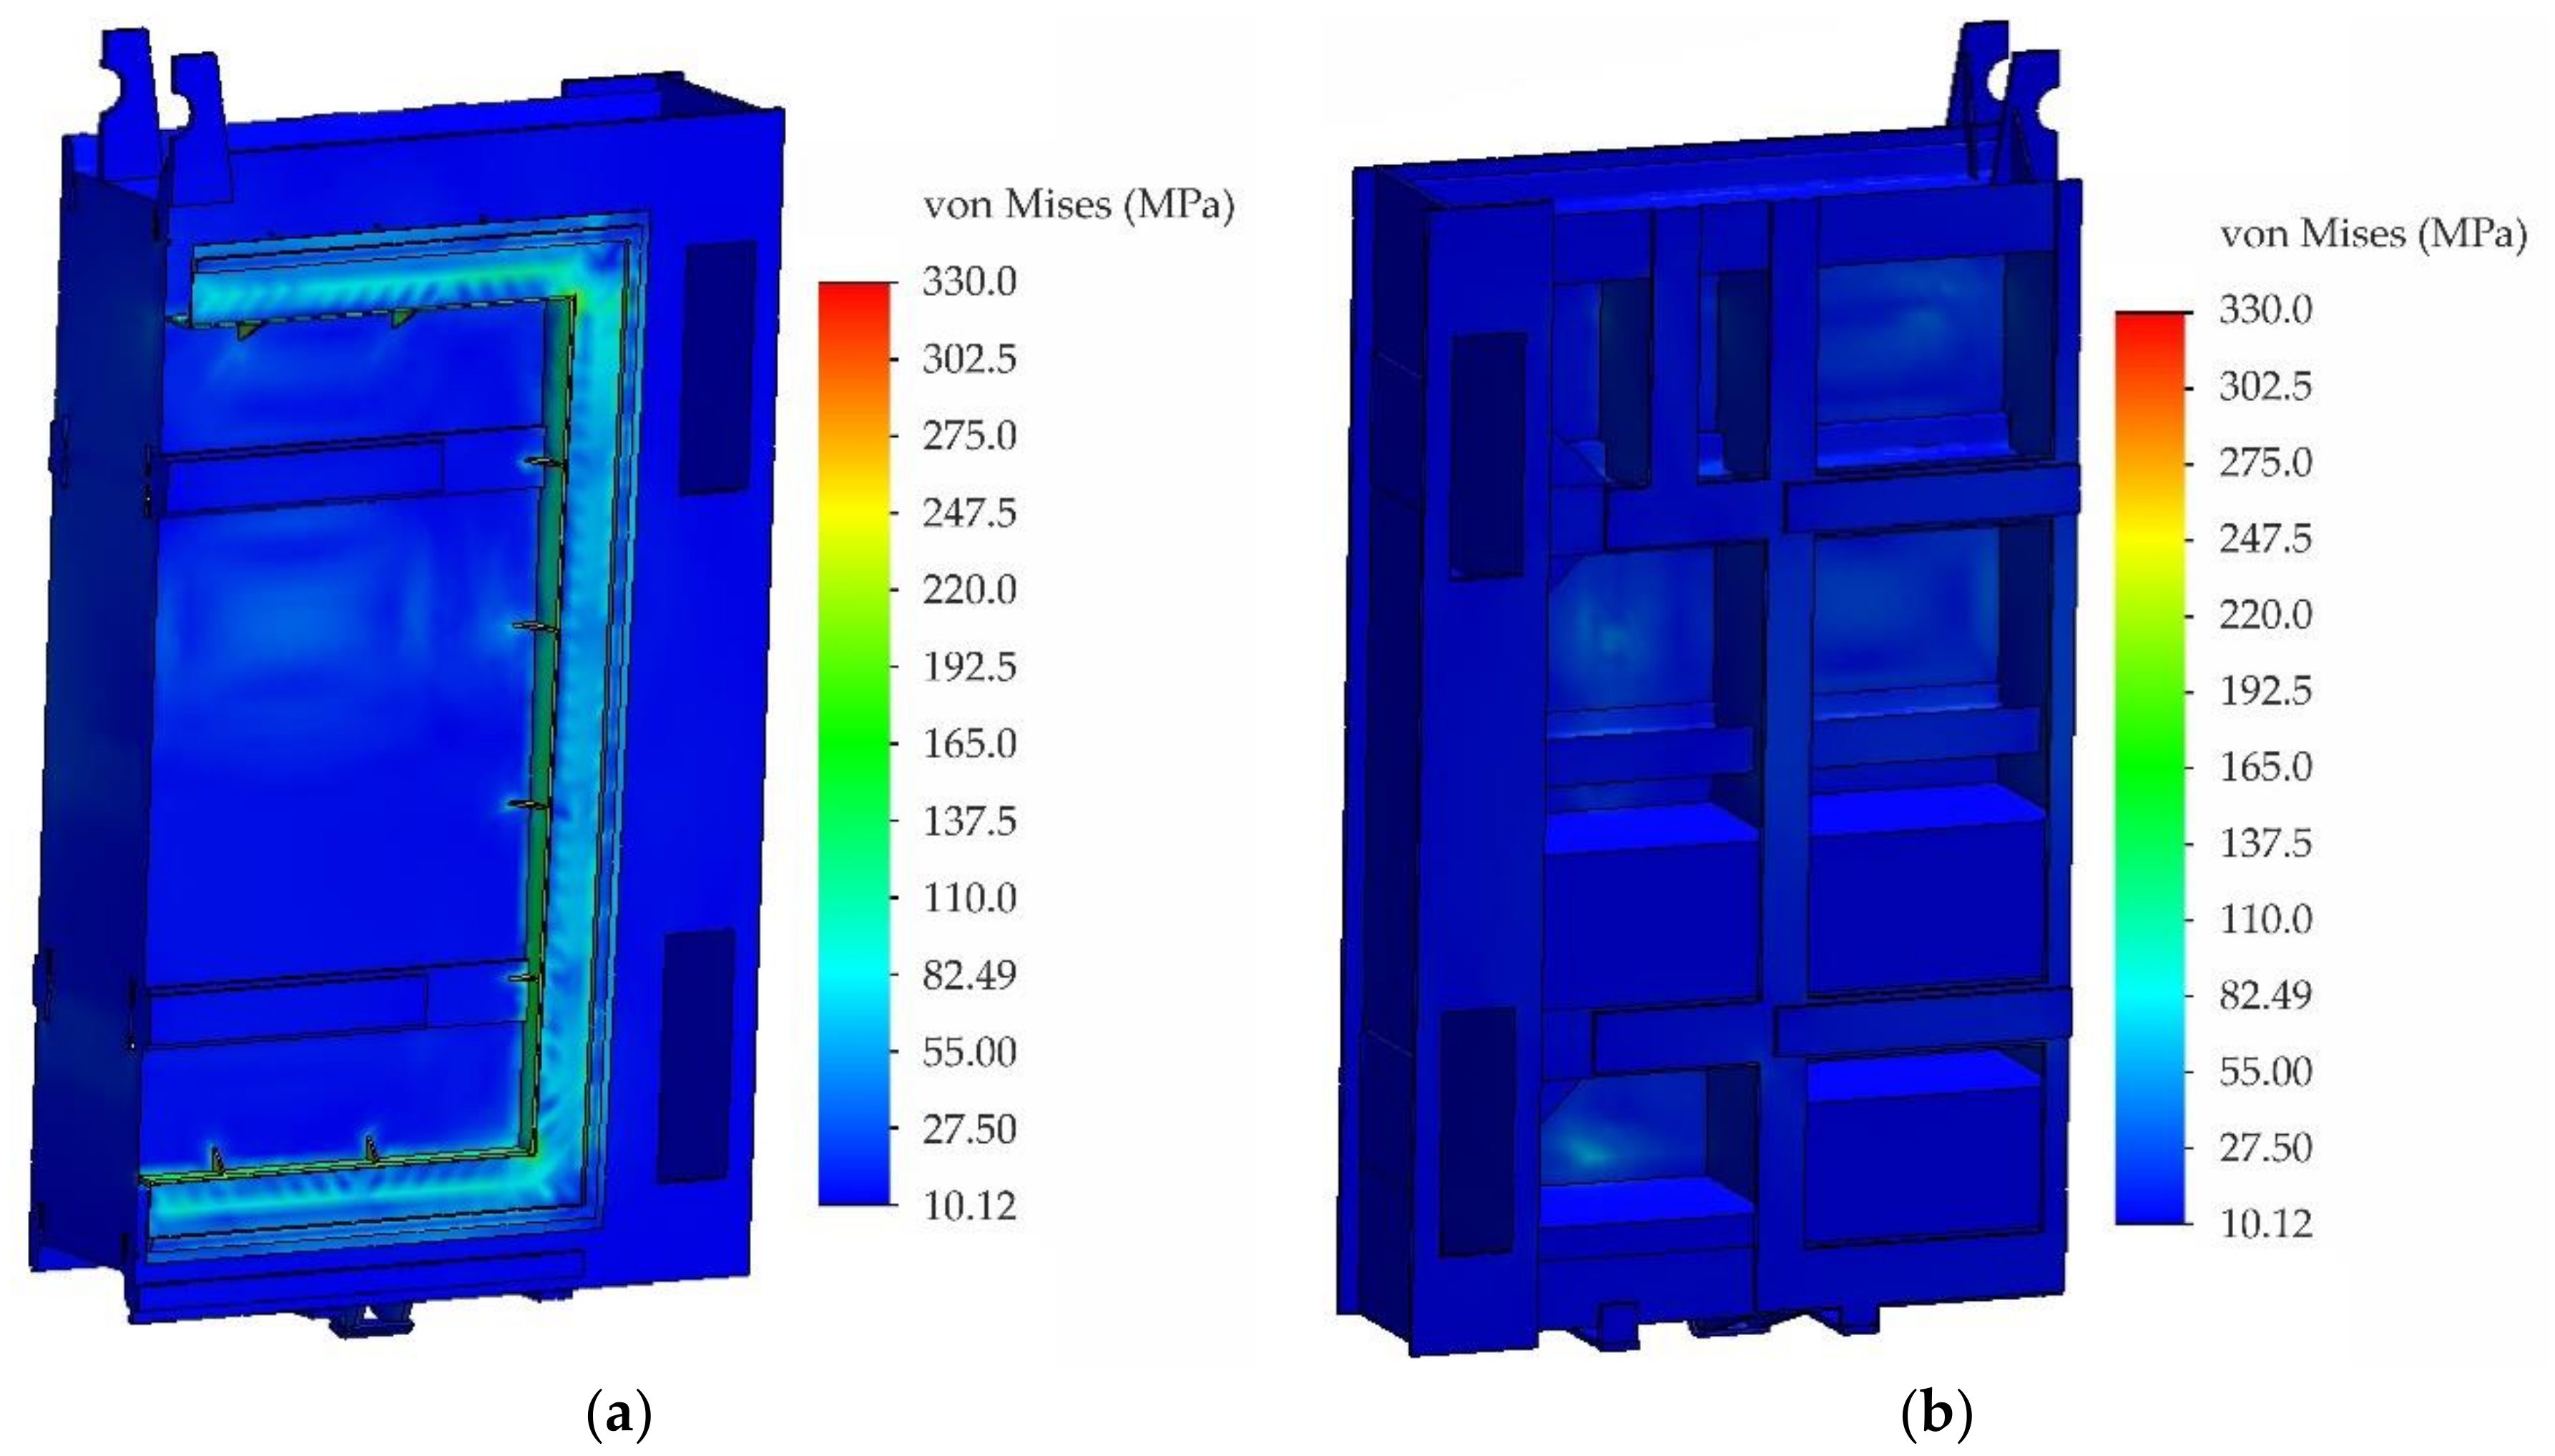
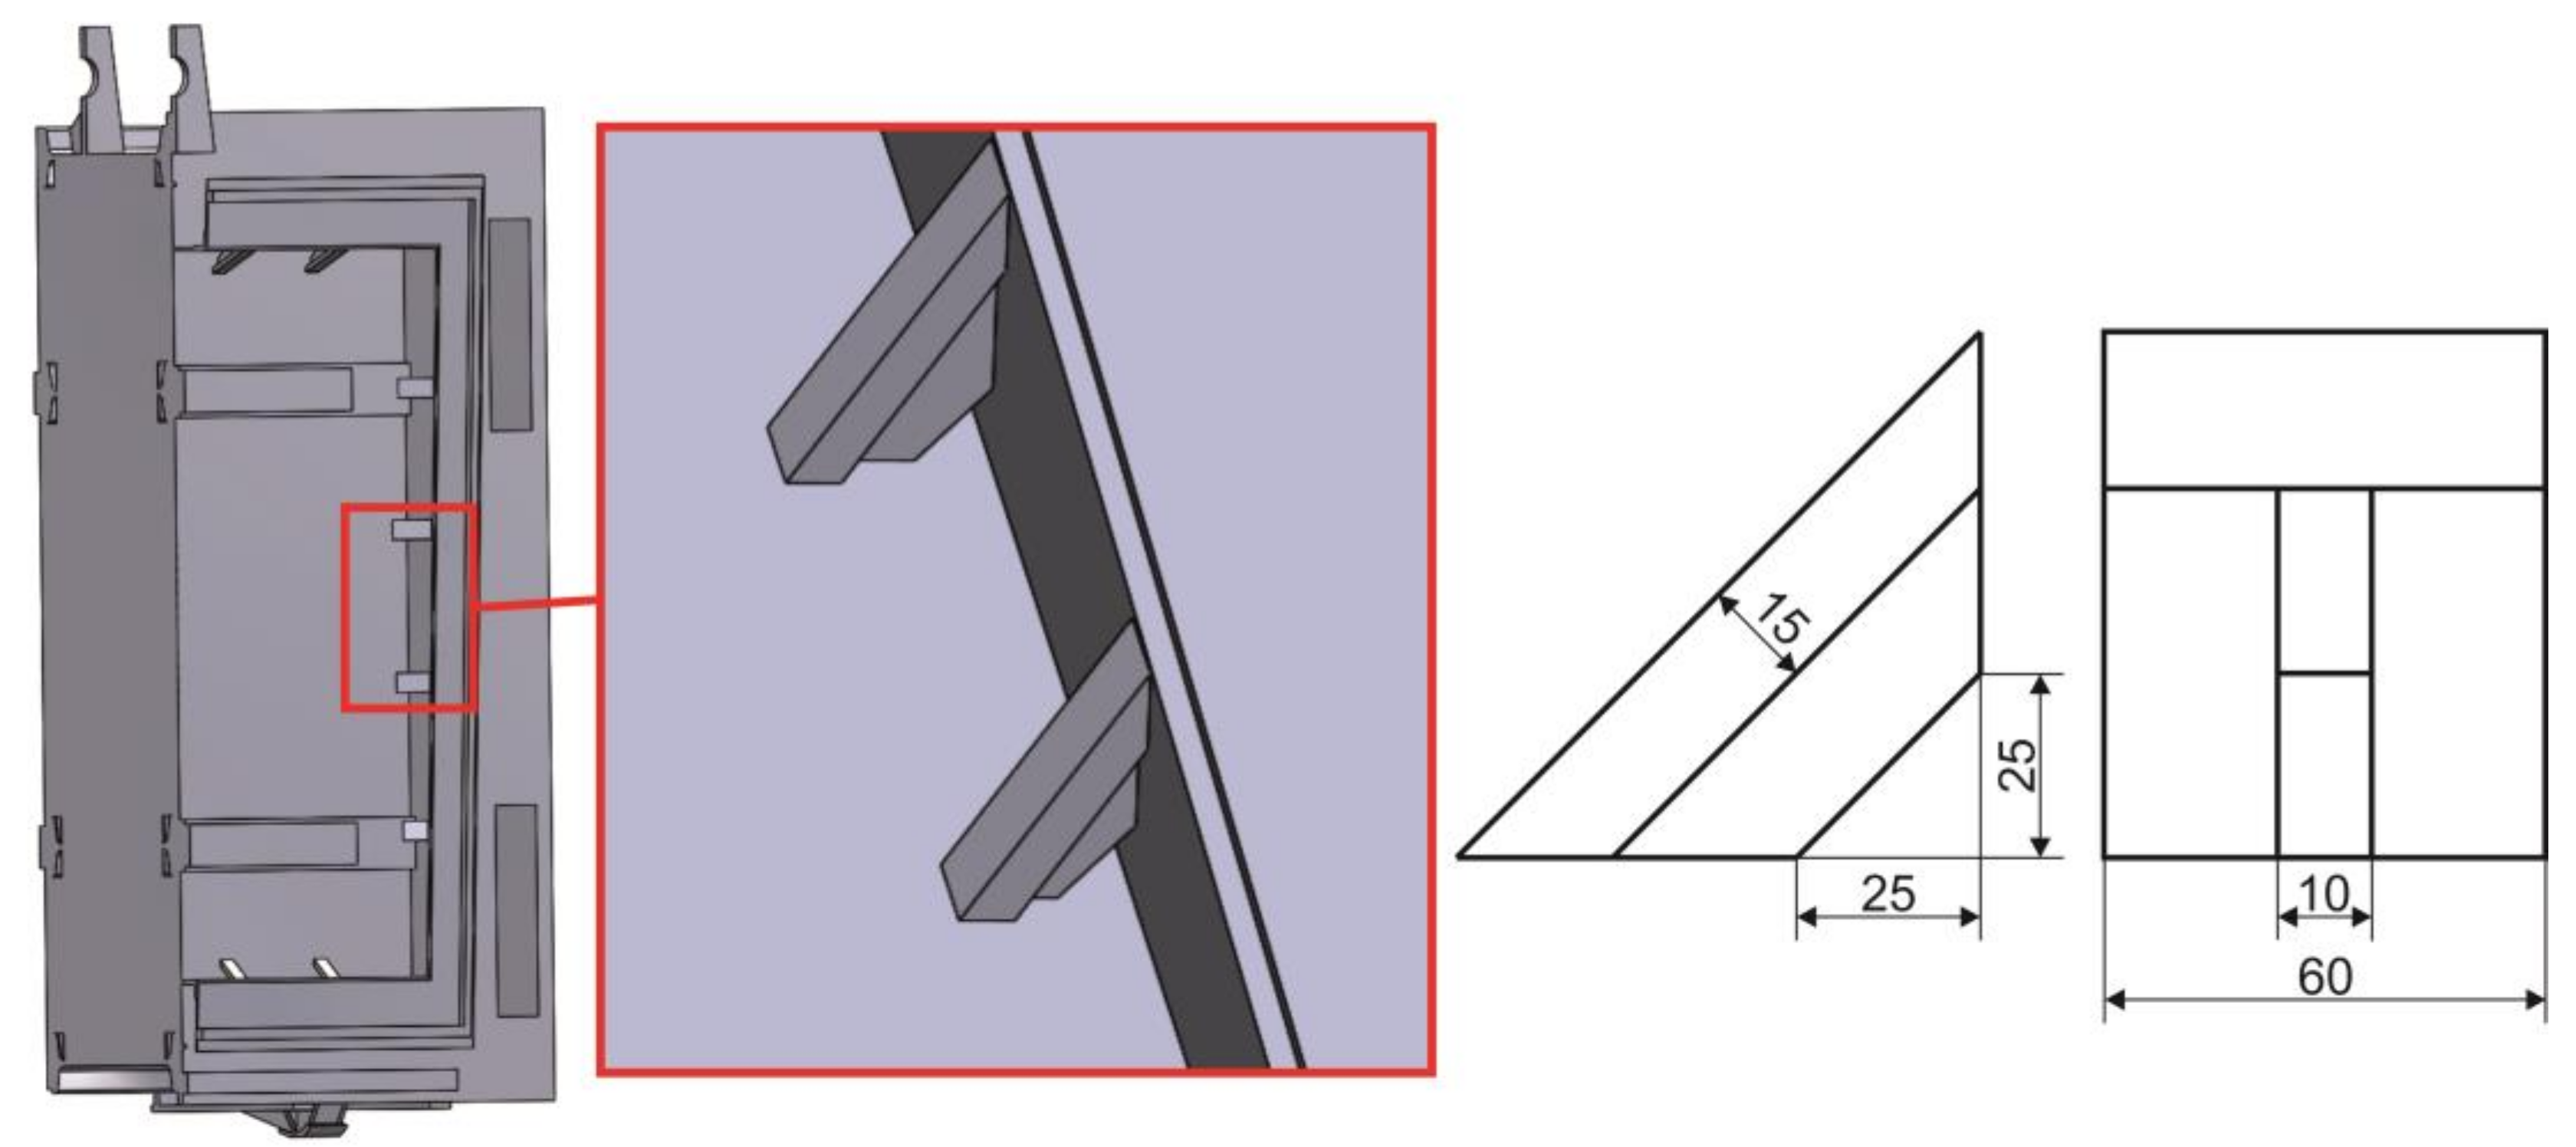
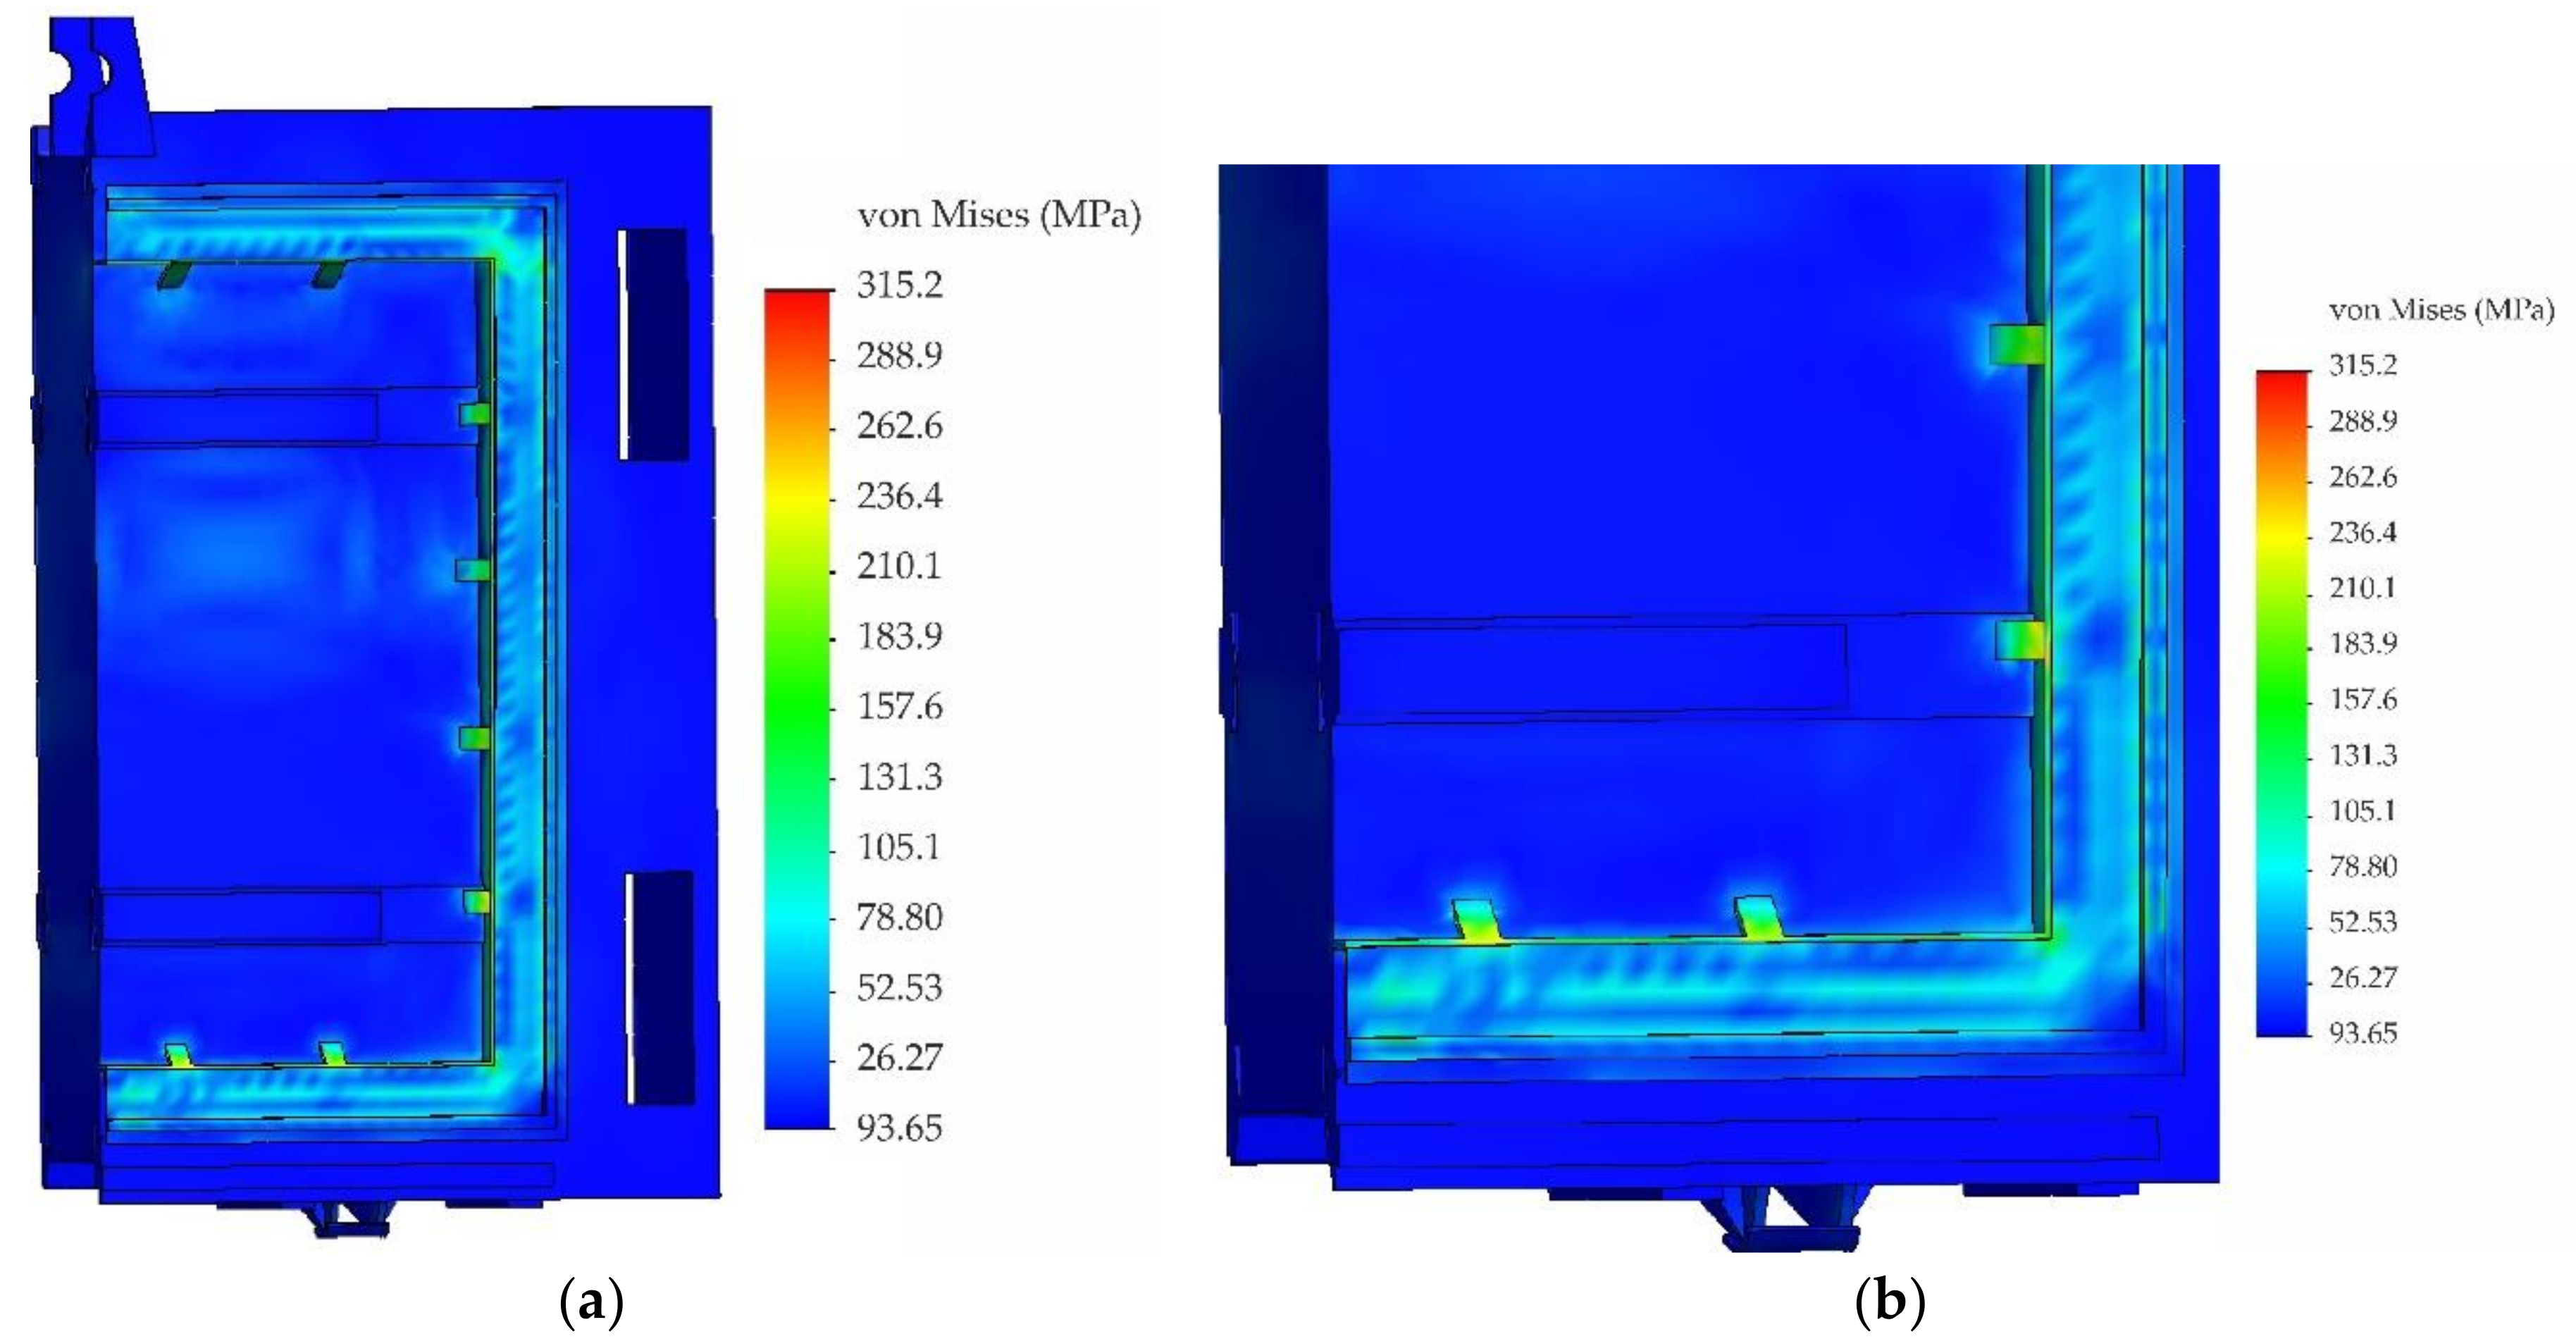
- On a simplified model of the sluice gate, the finite element analysis was performed with boundary conditions corresponding to the most unfavourable scenario, i.e., operation at the highest water level in the water reservoir. Numerical modelling identified critical points located in the area of reinforcing elements where the levels of equivalent stresses reached almost 360 MPa. Values at these critical points exceeded the yield strength of the used material used, but permanent deformations were not detected during visual inspection. Nevertheless, a structural modification of these critical points was proposed, which reduced the stress values by about 15%.
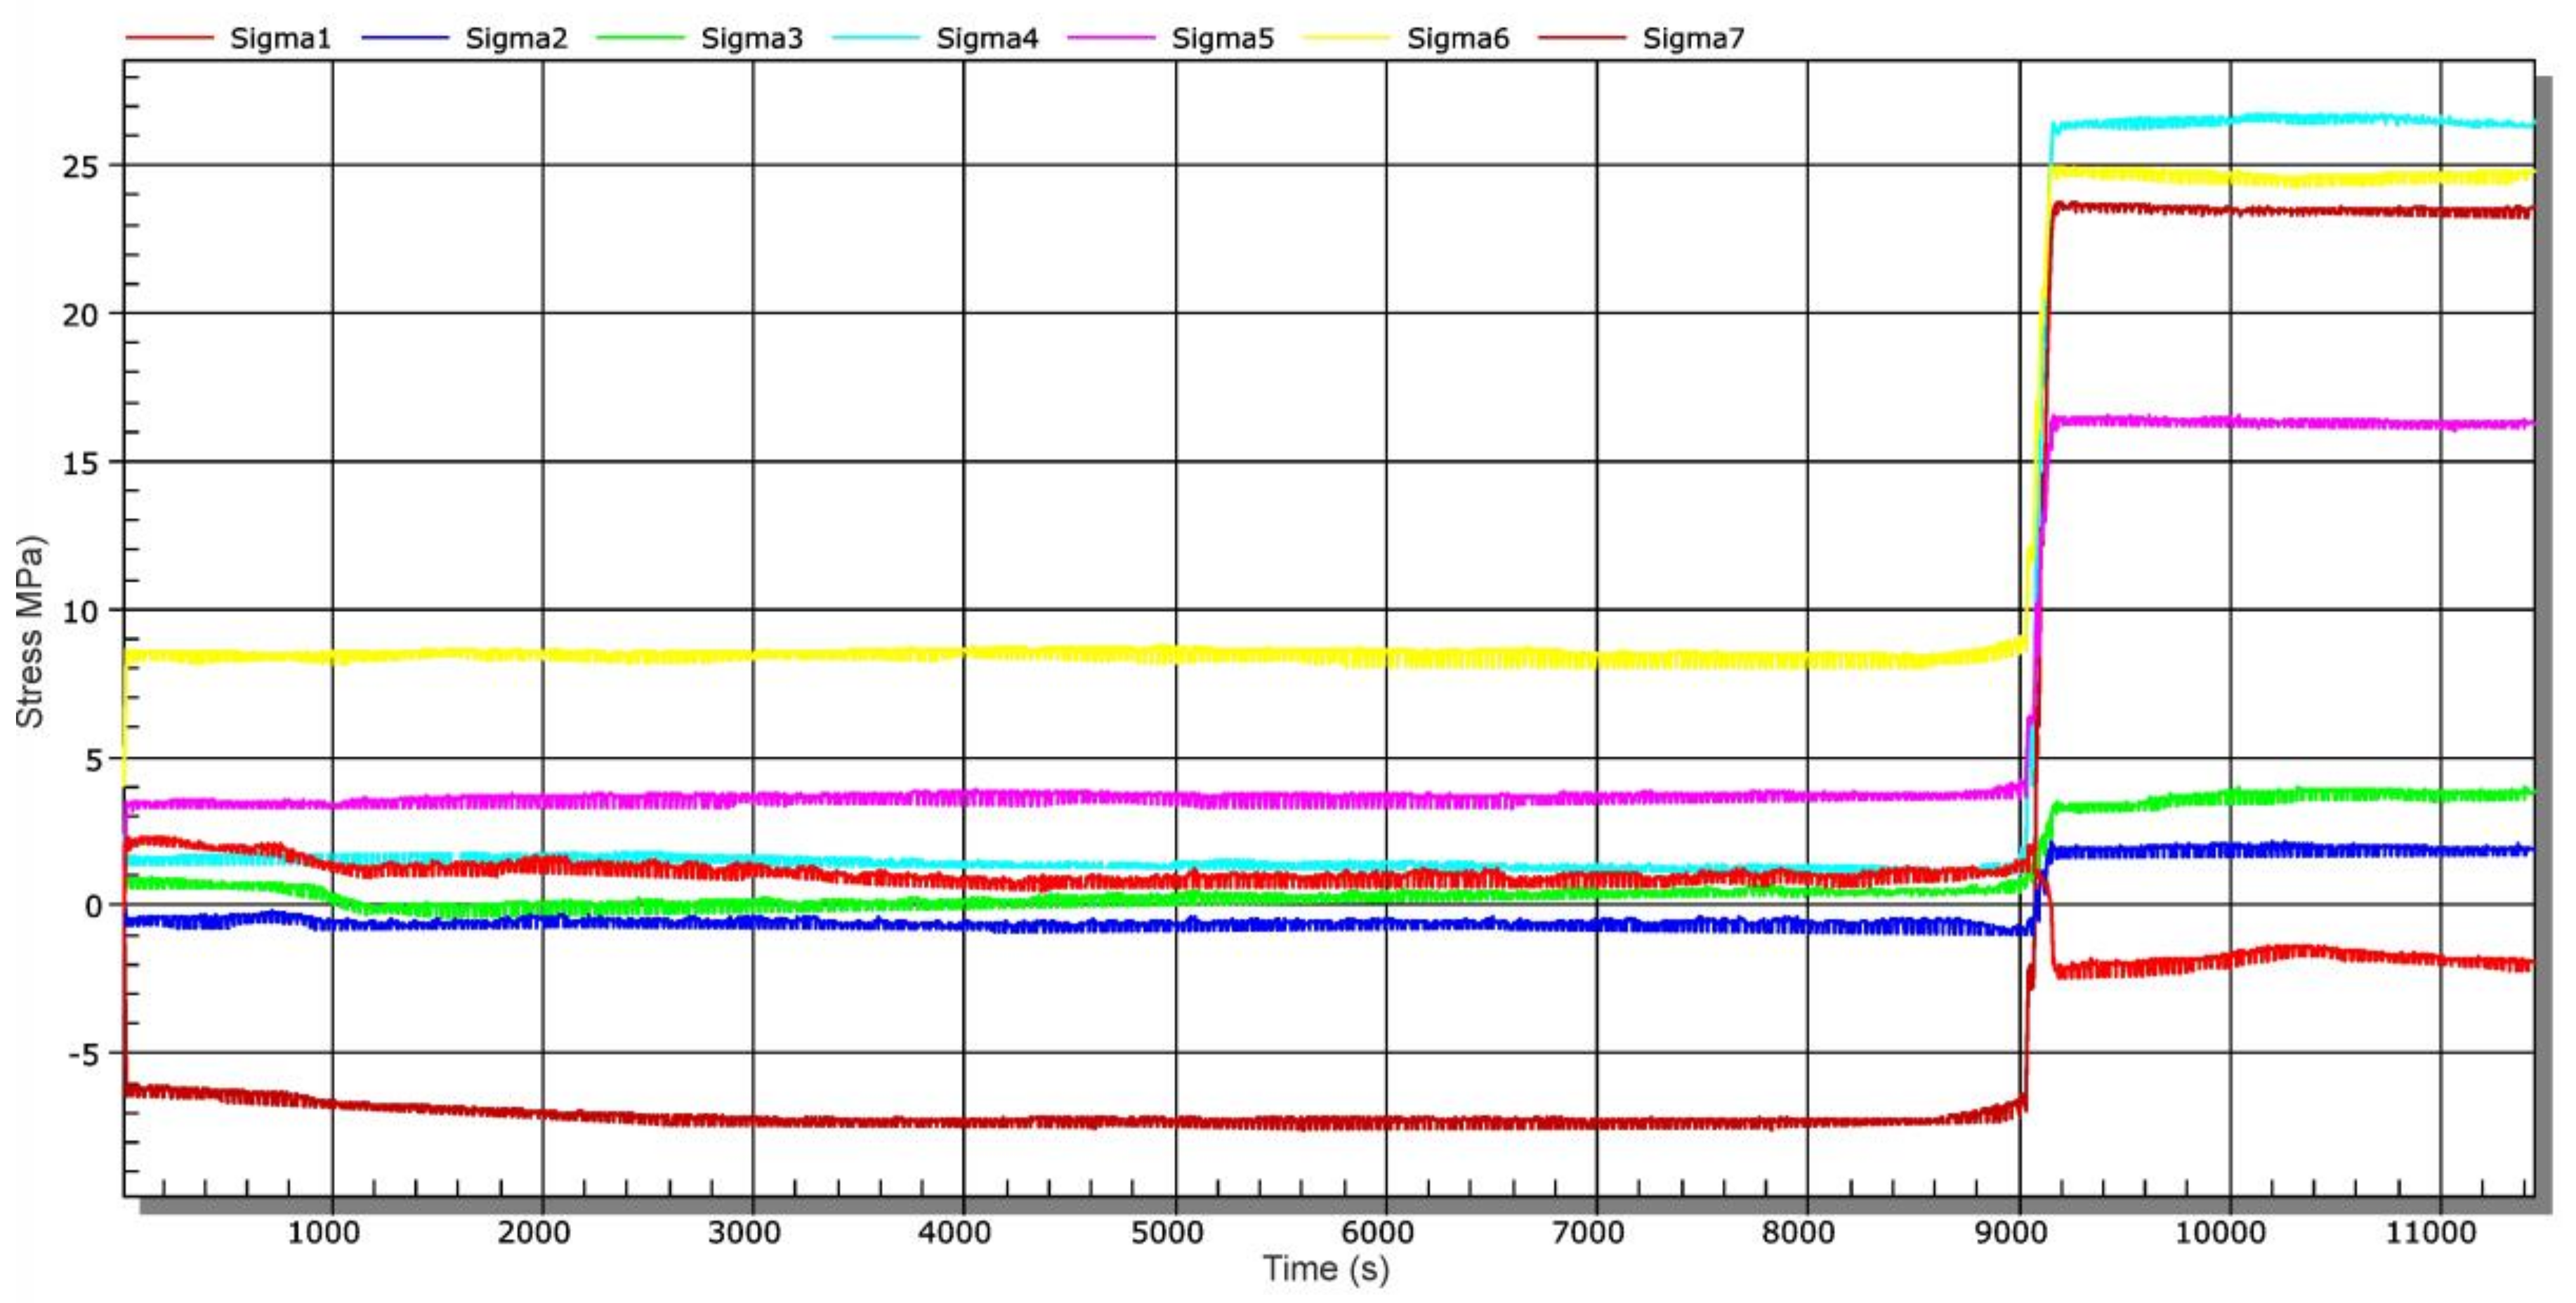
- The results of numerical modelling were verified at selected locations of the analysed sluice gate by operational experimental measurements using strain gauges. The maximum values of normal stresses in the assessed places reached about 27 MPa. The advantage of operational measurement is identification of the real behaviour of the structure. In this case, the registered shock was probably caused by an imperfect settlement of the sluice gate in the desired position. Since this shock was not expected during the operational measurement, the measurement was performed with a sampling frequency of only 50 Hz. At this frequency value, it was not possible to evaluate maximum stress peaks measured at the analysed locations. Numerical modelling by the finite element method did not analyse this state, as the exact definition of an unexpected (unknown) load in boundary conditions is practically impossible. Among other things, this is a condition that should not occur if handled correctly.
- When assessing safe operation, the levels of experimentally measured residual stresses were also considered, which in some places reached up to 190 MPa. Although the levels of resulting (superimposed) stresses are higher than is usually allowed in such structures, it can be stated that, in the current state of structure, the sluice gate can be operated safely.
- Carry out a structural modification of the reinforcing elements (triangles).
- Gradual step lowering of the sluice gate, which should be realised in the last quarter of the closure with a step downwards by approx. 100 mm and subsequent slight lift to eliminate any jamming of the sluice gate. If this principle is fulfilled, the operation of the sluice gate can be considered safe.
- When manufacturing a new sluice gate, use a material with minimum strength of 500 MPa and remove residual stresses after.
Author Contributions
Funding
Conflicts of Interest
References
- EN 1993-1 12. Eurocode 3: Design of Steel Structures—Part 1–12: General High Strength Steels; BSI: London, UK, 2007. [Google Scholar]
- Department of Army: U.S. Army Corps of Engineers. Design of Hydraulic Steel Structures; BiblioGov: Colombus, OH, USA, 2013.
- Inspection, Evaluation and Repair of Hydraulic Steel Structures. 2001. Available online: https://www.publications.usace.army.mil/Portals/76/Publications/EngineerManuals/EM_1110-2-6054.pdf (accessed on 13 November 2020).
- Chen, B.-Q.; Soares, C.G. Effect of welding sequence on temperature distribution, distortions, and residual stress on stiffened plates. Int. J. Adv. Manuf. Technol. 2016, 86, 3145–3156. [Google Scholar] [CrossRef]
- Fu, G.; Lourenço, M.I.; Duan, M.; Estefen, S.F. Influence of the welding sequence on residual stress and distortion of fillet welded structures. Mar. Struct. 2016, 46, 30–55. [Google Scholar] [CrossRef]
- Giętka, T.; Ciechacki, K.; Kik, T. Numerical Simulation of Duplex Steel Multipass Welding. Arch. Met. Mater. 2016, 61, 1975–1984. [Google Scholar] [CrossRef] [Green Version]
- Kik, T.; Slovácek, M.; Moravec, J.; Vanek, M. Numerical Analysis of Residual Stresses and Distortions in Aluminium Alloy Welded Joints. Appl. Mech. Mater. 2015, 809, 443–448. [Google Scholar] [CrossRef]
- Perić, M.; Seleš, K.; Tonković, Z.; Lovrenić-Jugović, M. Numerical simulation of welding distortions in large structures with a simplified engineering approach. Open Phys. 2019, 17, 719–730. [Google Scholar] [CrossRef]
- Wu, C.; Kim, J.-W. Review on Mitigation of Welding-Induced Distortion Based on FEM Analysis. J. Weld. Join. 2020, 38, 56–66. [Google Scholar] [CrossRef] [Green Version]
- Gabáni, Ľ.; Trebuňa, F.; Šimčák, F.; Bocko, J.; Pástor, M. Using Experimental Methods of Mechanics for Failure Prediction of Casting Pedestal. Acta. Mechanica. Slov. 2015, 19, 42–50. [Google Scholar] [CrossRef]
- Hobbacher, A.F. Recommendations for Fatigue Design of Welded Joints and Components; Springer Science and Business Media LLC: Berlin, Germany, 2016. [Google Scholar]
- Sága, M.; Blatnická, M.; Blatnický, M.; Dižo, J.; Gerlici, J. Research of the Fatigue Life of Welded Joints of High Strength Steel S960 QL Created Using Laser and Electron Beams. Materials 2020, 13, 2539. [Google Scholar] [CrossRef] [PubMed]
- Stephens, R.I.; Fatemi, A.; Stephens, R.R.; Fuchs, H.O. Metal Fatigue in Engineering; Wiley Interscience: New York, NY, USA, 2001; p. 496. [Google Scholar]
- Kim, M.-Y.; Chu, D.-J.; Lee, Y.-K.; Shim, J.-H.; Jung, W.-S. Residual lifetime assessment of cold-reheater pipe in coal-fired power plant through accelerated degradation test. Reliab. Eng. Syst. Saf. 2019, 188, 330–335. [Google Scholar] [CrossRef]
- Akid, R. Corrosion fatigue. In Shears Corrosion; Graham, M., Richardson, T., Eds.; Elsevier Science: Amsterdam, The Netherlands, 2010; Volume 2, pp. 928–953. [Google Scholar]
- Bocko, J.; Buršák, M.; Pástor, M.; Sivák, P.; Šarga, P.; Lengvarský, P. Comprehensive Assessment of the Stop Gate of the Inlet Building of the Palcmanská Maša Reservoir; Final Research Report; TU: Košice, Slovakia, 2018; p. 84. (In Slovak) [Google Scholar]
- ISO 6892-1:2019 Metallic Materials. Tensile testing. Part 1: Method of Test at Room Temperature. Available online: https://www.iso.org/standard/78322.html (accessed on 20 October 2020).
- ISO 6506-1:2014 Metallic Materials—Brinell Hardness Test: Part 1: Test Method. Available online: https://www.iso.org/standard/59671.html (accessed on 20 October 2020).
- ISO 148-1:2016 Metallic Materials—Charpy Pendulum Impact Test—Part 1: Test Method. Available online: https://www.iso.org/standard/63802.html (accessed on 20 October 2020).
- Furbacher, I.; Macek, K.; Steidl, J. Lexicon of Technical Materials; Verlag Dashöfer: Prague, Czech Republic, 2005. [Google Scholar]
- Hu, X.; Jiang, H.-Y.; Luo, Y.; Jin, Q.; Peng, W.; Yi, C. A Study on Microstructure, Residual Stresses and Stress Corrosion Cracking of Repair Welding on 304 Stainless Steel: Part II-Effects of Reinforcement Height. Materials 2020, 13, 2434. [Google Scholar] [CrossRef] [PubMed]
- Sun, J.; Hensel, J.; Nitschke-Pagel, T.; Dilger, K. Influence of Restraint Conditions on Welding Residual Stresses in H-Type Cracking Test Specimens. Materials 2019, 12, 2700. [Google Scholar] [CrossRef] [PubMed] [Green Version]
- Pástor, M.; Lengvarský, P.; Trebuňa, F.; Čarák, P. Prediction of failures in steam boiler using quantification of residual stresses. Eng. Fail. Anal. 2020, 118, 104808. [Google Scholar] [CrossRef]
- Pástor, M.; Čarák, P.; Hagara, M. Development of the Device with a High Positioning Accuracy Serving for Residual Stress Quantification using Optical Methods. Acta. Mechanica. Slov. 2019, 23, 24–29. [Google Scholar] [CrossRef]
- Xin, H.; Veljkovic, M. Residual stress effects on fatigue crack growth rate of mild steel S355 exposed to air and seawater environments. Mater. Des. 2020, 193, 108732. [Google Scholar] [CrossRef]
- Xin, H.; Correia, J.A.; Veljkovic, M. Three-dimensional fatigue crack propagation simulation using extended finite element methods for steel grades S355 and S690 considering mean stress effects. Eng. Struct. 2021, 227, 111414. [Google Scholar] [CrossRef]
- ASTM E 837-13a Standard Test Method for Determining Residual Stresses by the Hole-Drilling Strain-Gage Method; Standard: New York, NY, USA, 2001.
- Trebuňa, F.; Šimčák, F.; Buršák, M.; Bocko, J.; Šarga, P.; Pástor, M.; Trebuňa, P. Quantification of residual stresses in hot rolled steel sheets by the hole-drilling method. Metalurgija 2007, 46, 41–46. [Google Scholar]
- Trebuňa, F.; Šimčák, F.; Bocko, J.; Trebuňa, P.; Pástor, M.; Šarga, P. Analysis of crack initiation in the press frame and innovation of the frame to ensure its further operation. Eng. Fail. Anal. 2011, 18, 244–255. [Google Scholar] [CrossRef]
- Trebuňa, F.; Šimčák, F.; Gašinec, J.; Šarga, P.; Bobovský, Z. Verification of Safe Operation of Hydraulic Power Station Stop Logs. In Proceedings of the Experimental Stress Analysis, 49th International Scientific Conference, Znojmo, Czech Republic, 6–9 June 2011; pp. 397–402. [Google Scholar]
- Zhang, M.; Qiu, B.; Zhu, M.; Qu, X. Novel computation method of reducing ill-posedness for structural static distributed load identification by optimising strain gauge locations. Mech. Syst. Signal Process. 2019, 124, 83–110. [Google Scholar] [CrossRef]


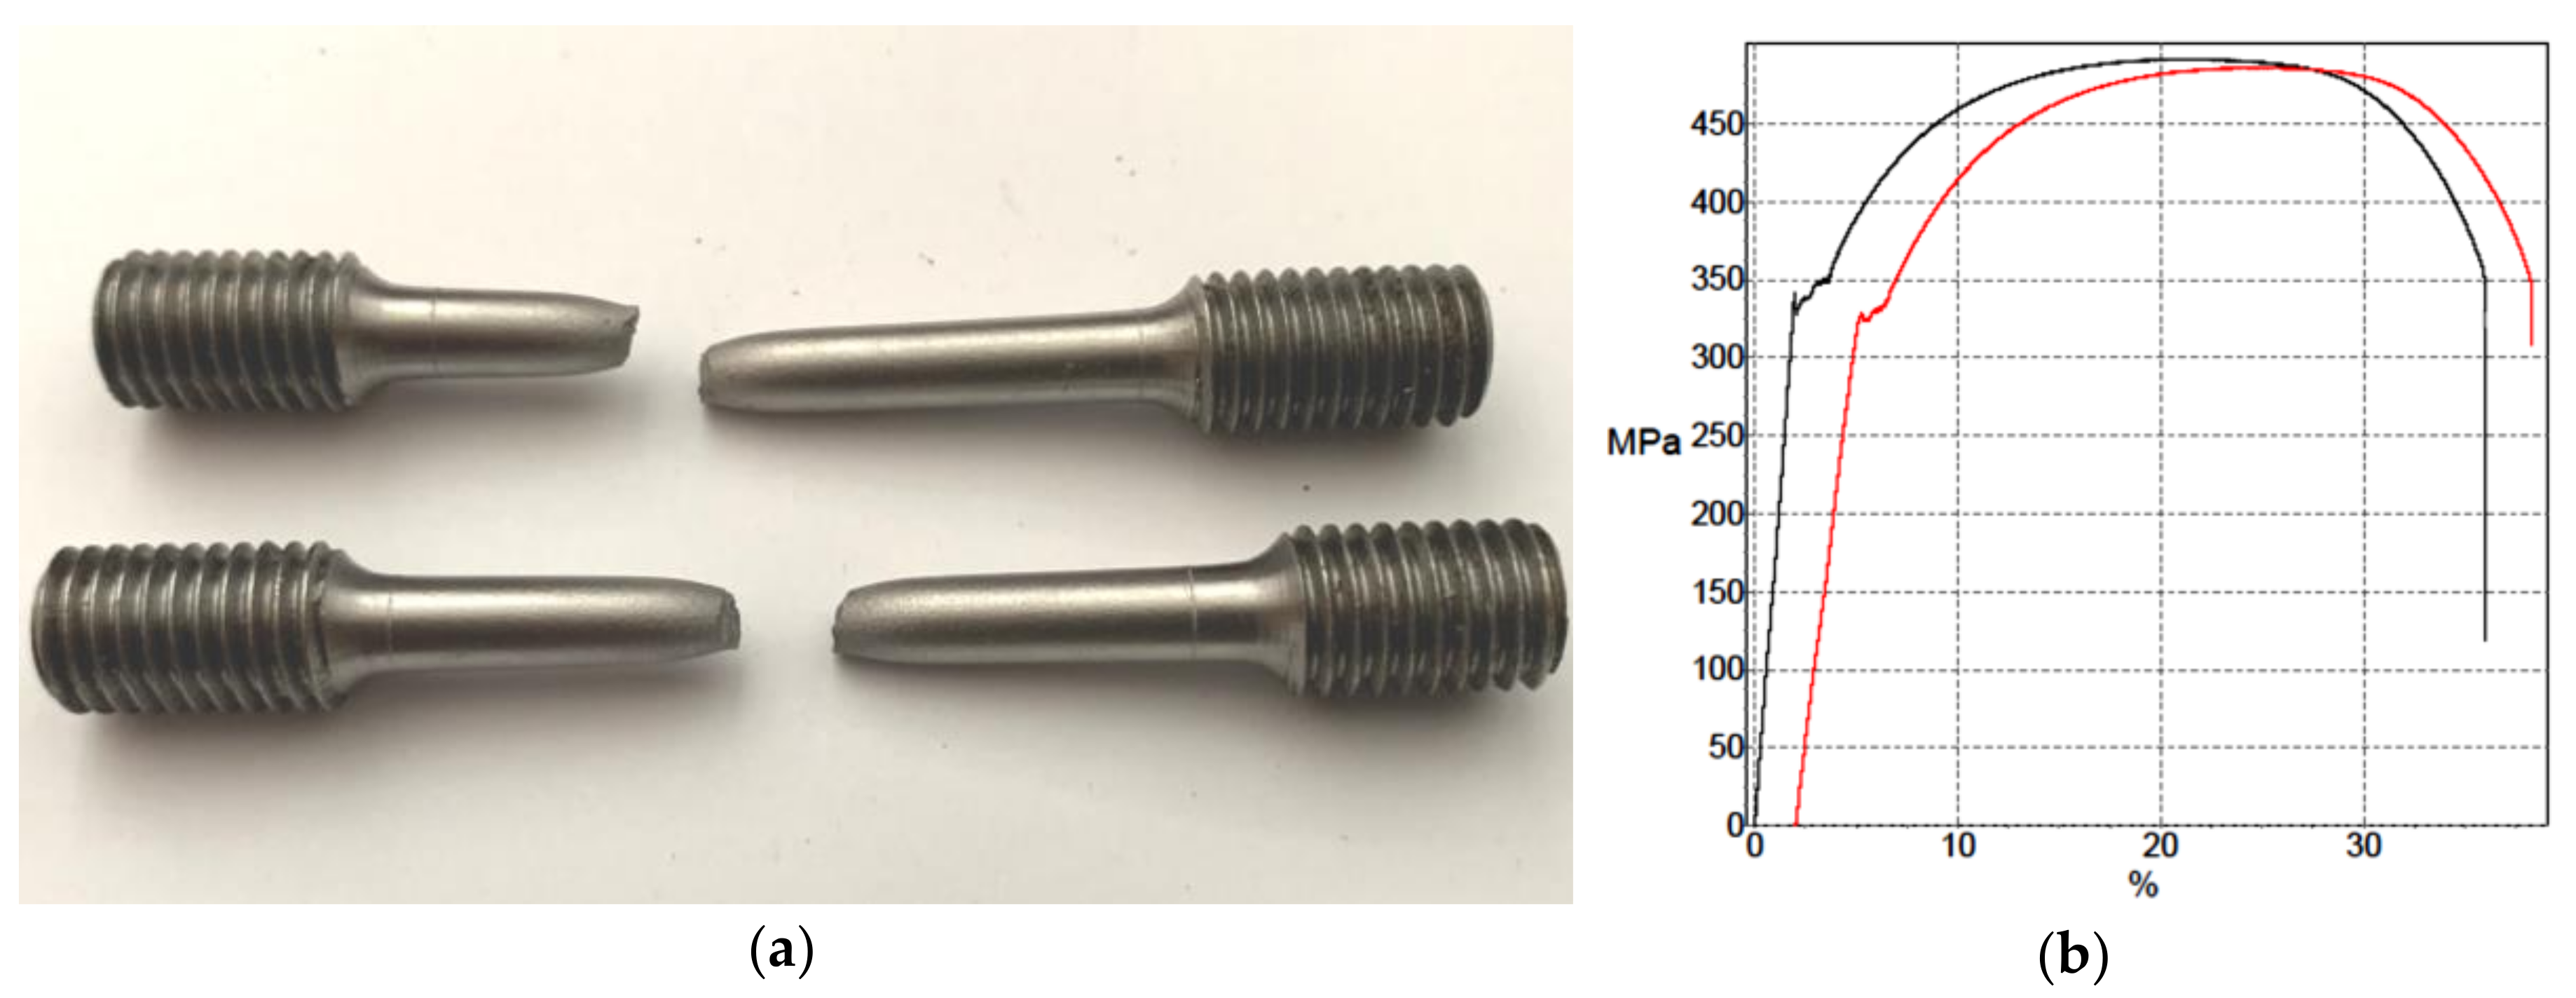
| Sample | Rp0,2 (MPa) | Rm (MPa) |
|---|---|---|
| 1 | 332 | 491 |
| 2 | 328 | 486 |
| Nr. | Fe | C | Si | Mn | P | S | Cu | Al | Cr | Mo | Ni | V | Ti | Nb | Co |
|---|---|---|---|---|---|---|---|---|---|---|---|---|---|---|---|
| 1. | 98.98 | 0.127 | 0.201 | 0.491 | <0.002 | <0.002 | 0.137 | <0.002 | 0.020 | 0.005 | 0.024 | <0.002 | <0.002 | <0.002 | <0.002 |
| 2. | 98.97 | 0.121 | 0.211 | 0.494 | <0.002 | 0.003 | 0.136 | <0.002 | 0.022 | 0.007 | 0.022 | <0.002 | <0.002 | <0.002 | 0.009 |
| 3. | 98.93 | 0.158 | 0.209 | 0.479 | <0.002 | <0.002 | 0.137 | <0.002 | 0.021 | 0.020 | 0.026 | <0.002 | <0.002 | 0.004 | 0.013 |
| Mean value | 98.96 | 0.135 | 0.207 | 0.488 | <0.002 | <0.002 | 0.137 | <0.002 | 0.021 | 0.011 | 0.024 | <0.002 | <0.002 | 0.003 | 0.007 |
| Sample | HBW | KC (J) | KCV (J⋅cm−2) |
|---|---|---|---|
| 1 | 132; 134; 137 | 72 | 90 |
| 2 | 132; 135; 137 | 77 | 96 |
| Location | σmax (MPa) | σmin (MPa) | Angle β (°) | σred (MPa) |
|---|---|---|---|---|
| RS1 | 119 | −67 | −75 | 163.17 |
| RS2 | 184 | 65 | 0 | 161.62 |
| RS3 | 185 | 141 | 32 | 167.39 |
| RS4 | 54 | −126 | −78 | 159.99 |
| RS5 | 134 | 84 | 42 | 117.29 |
| Operational Measurement | σmax (MPa) for Location | ||||||
|---|---|---|---|---|---|---|---|
| OP1/A1 | OP1/A2 | OP2/A3 | OP2/A4 | OP3/A5 | OP4/A6 | OP5/A7 | |
| stage 1 | 0.1 | 1.0 | −0.1 | 1.3 | 1.0 | 2.5 | −0.5 |
| stage 2 | 6.6 | 6.0 | 8.7 | 4.9 | −3.1 | −3.1 | −0.9 |
| stage 3 | 1.5 | −2.2 | −4.1 | −25.0 | −16.2 | −27.2 | −23.0 |
| stage 4 | −2.1 | 1.9 | 3.9 | 26.5 | 16.2 | 24.8 | 23.8 |
| stage 5 | −1.1 | −1.6 | −4.9 | −26.2 | −18.1 | −24.5 | −20.5 |
| stage 6 | −0.5 | 1.1 | 4.1 | 26.3 | 18.7 | 27.3 | 19.3 |
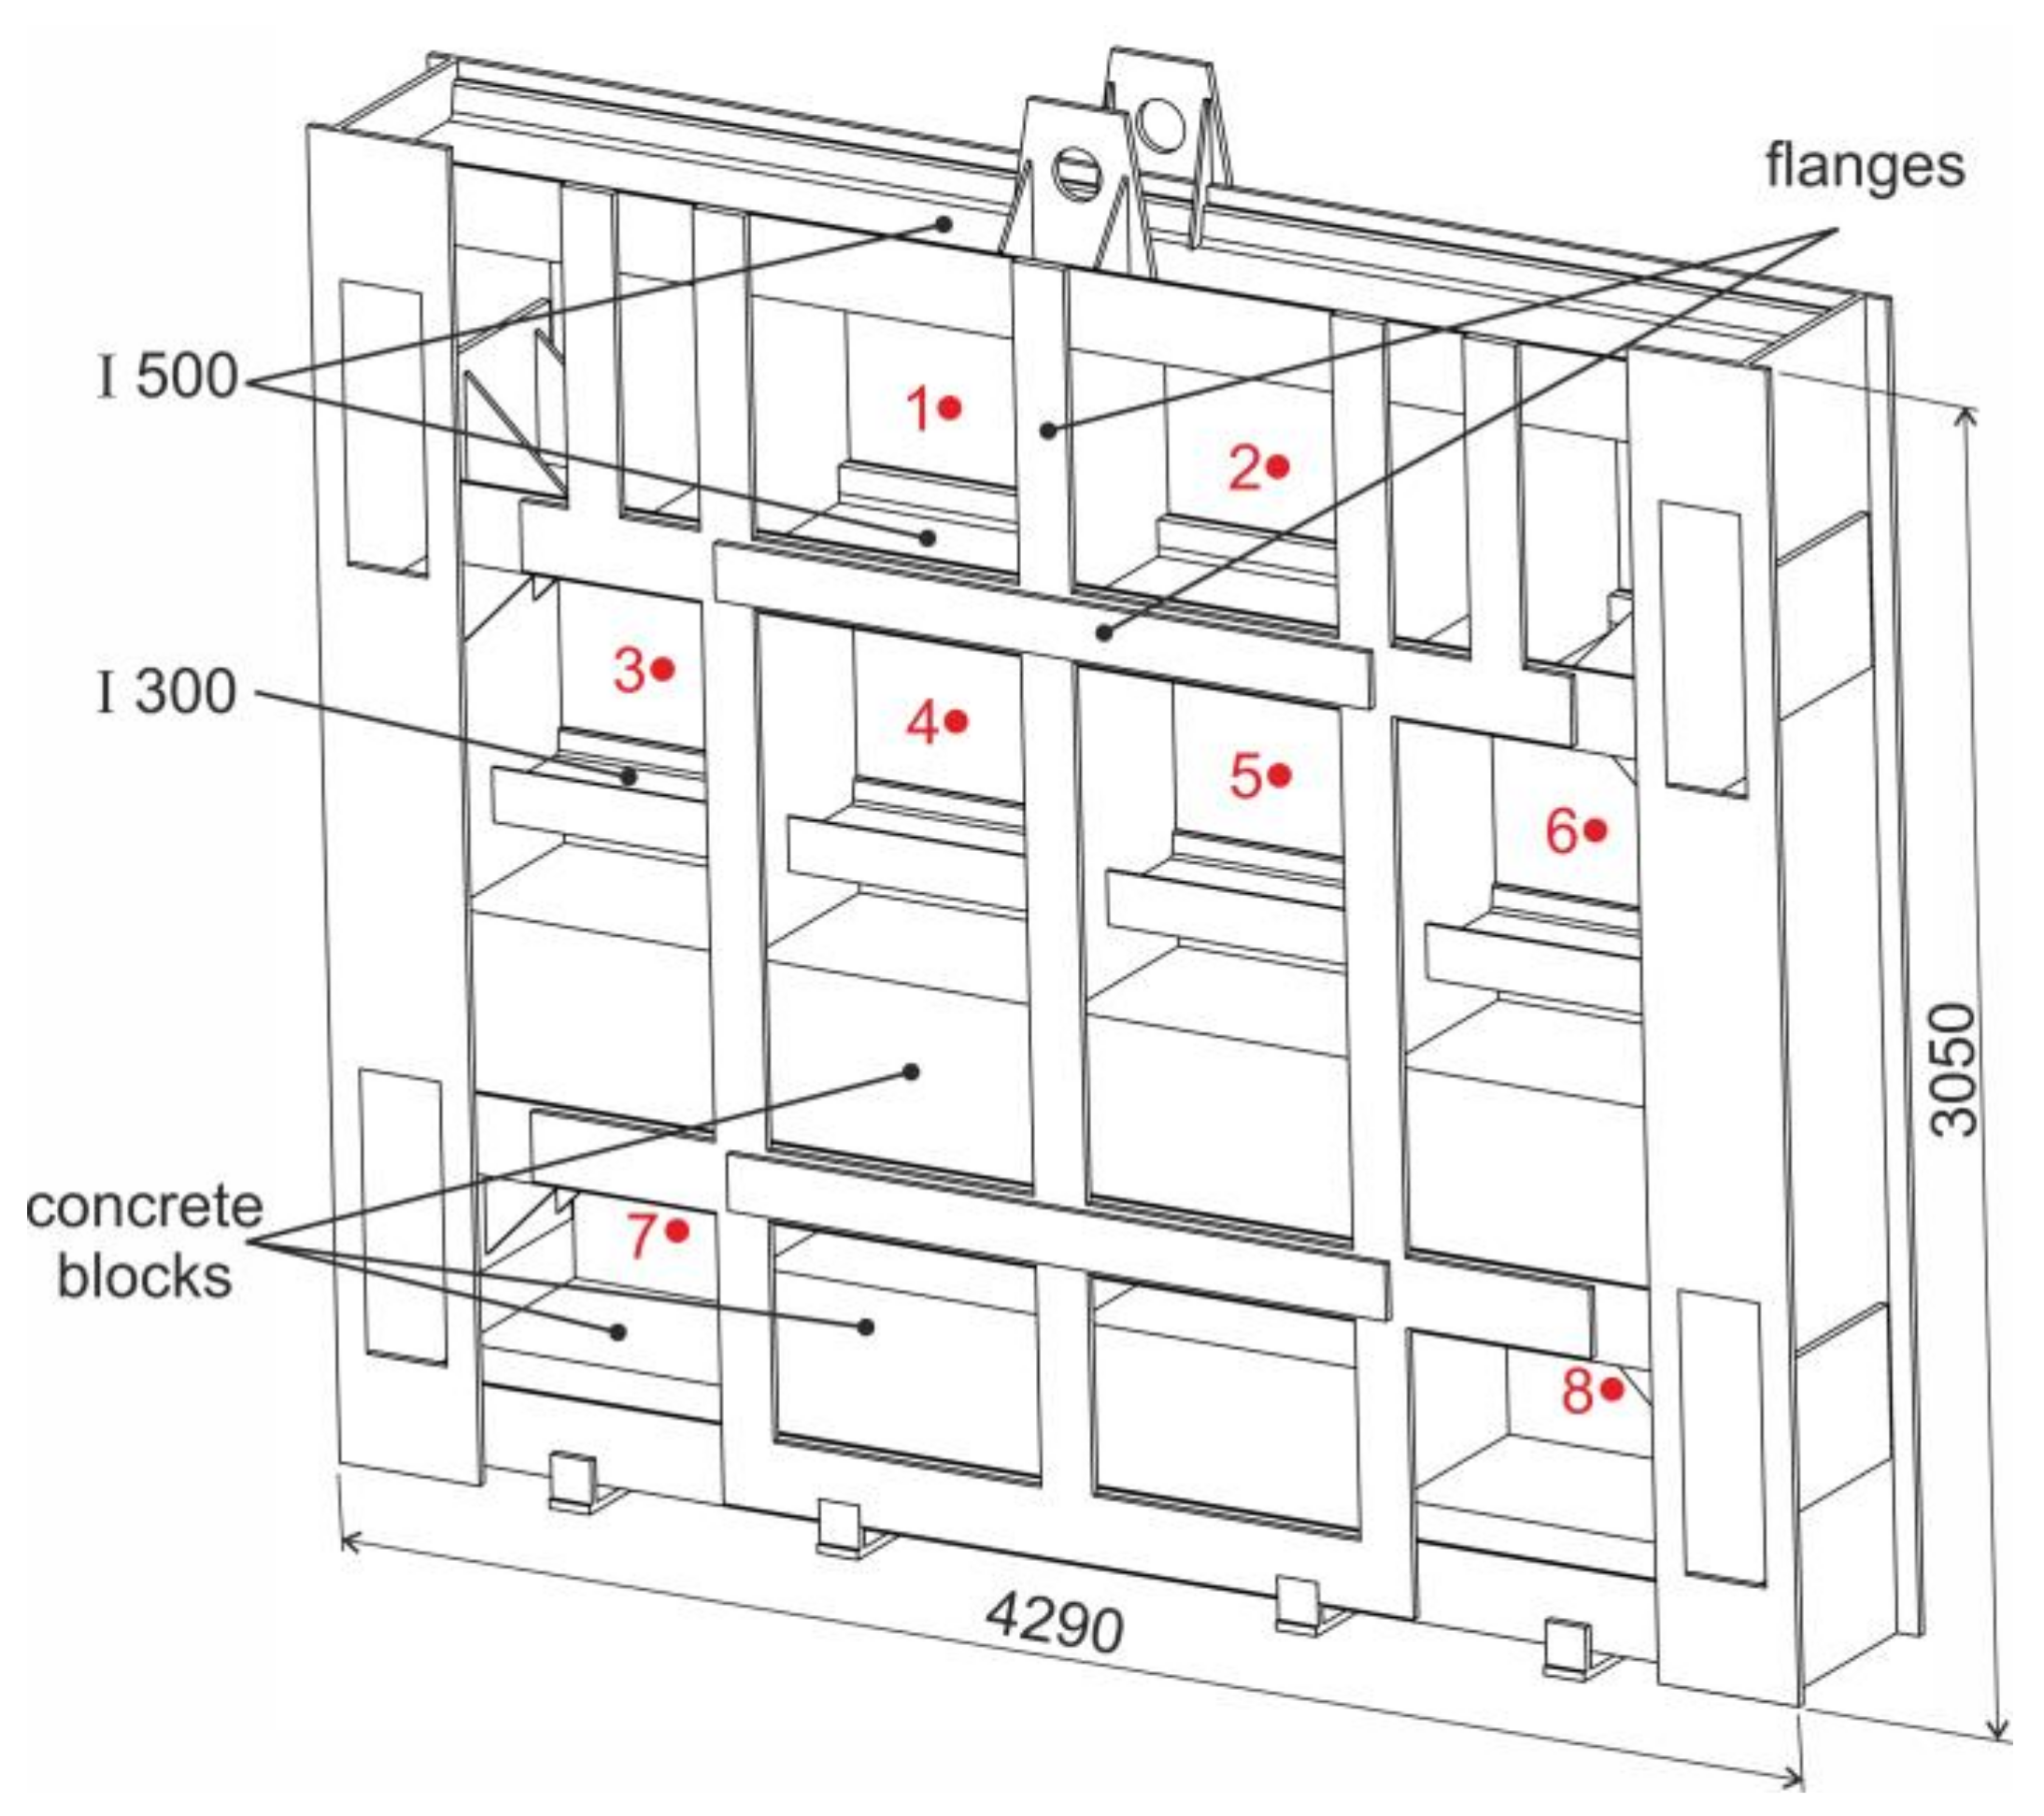
| Evaluated Element | Number of Measuring Points | Average Thickness (mm) | Thickness Applied in the FEM Model (mm) |
|---|---|---|---|
| rear plate | 8 | 19.75 | 19.70 |
| side elements | 8 | 20.09 | 20.00 |
| profile I 500 | 6 | 18.01 | 18.00 |
| profile I 300 | 4 | 10.82 | 10.80 |
| reinforcing elements | 6 | 15.35 | 15.30 |
| flanges | 12 | 19.27 | 19.20 |
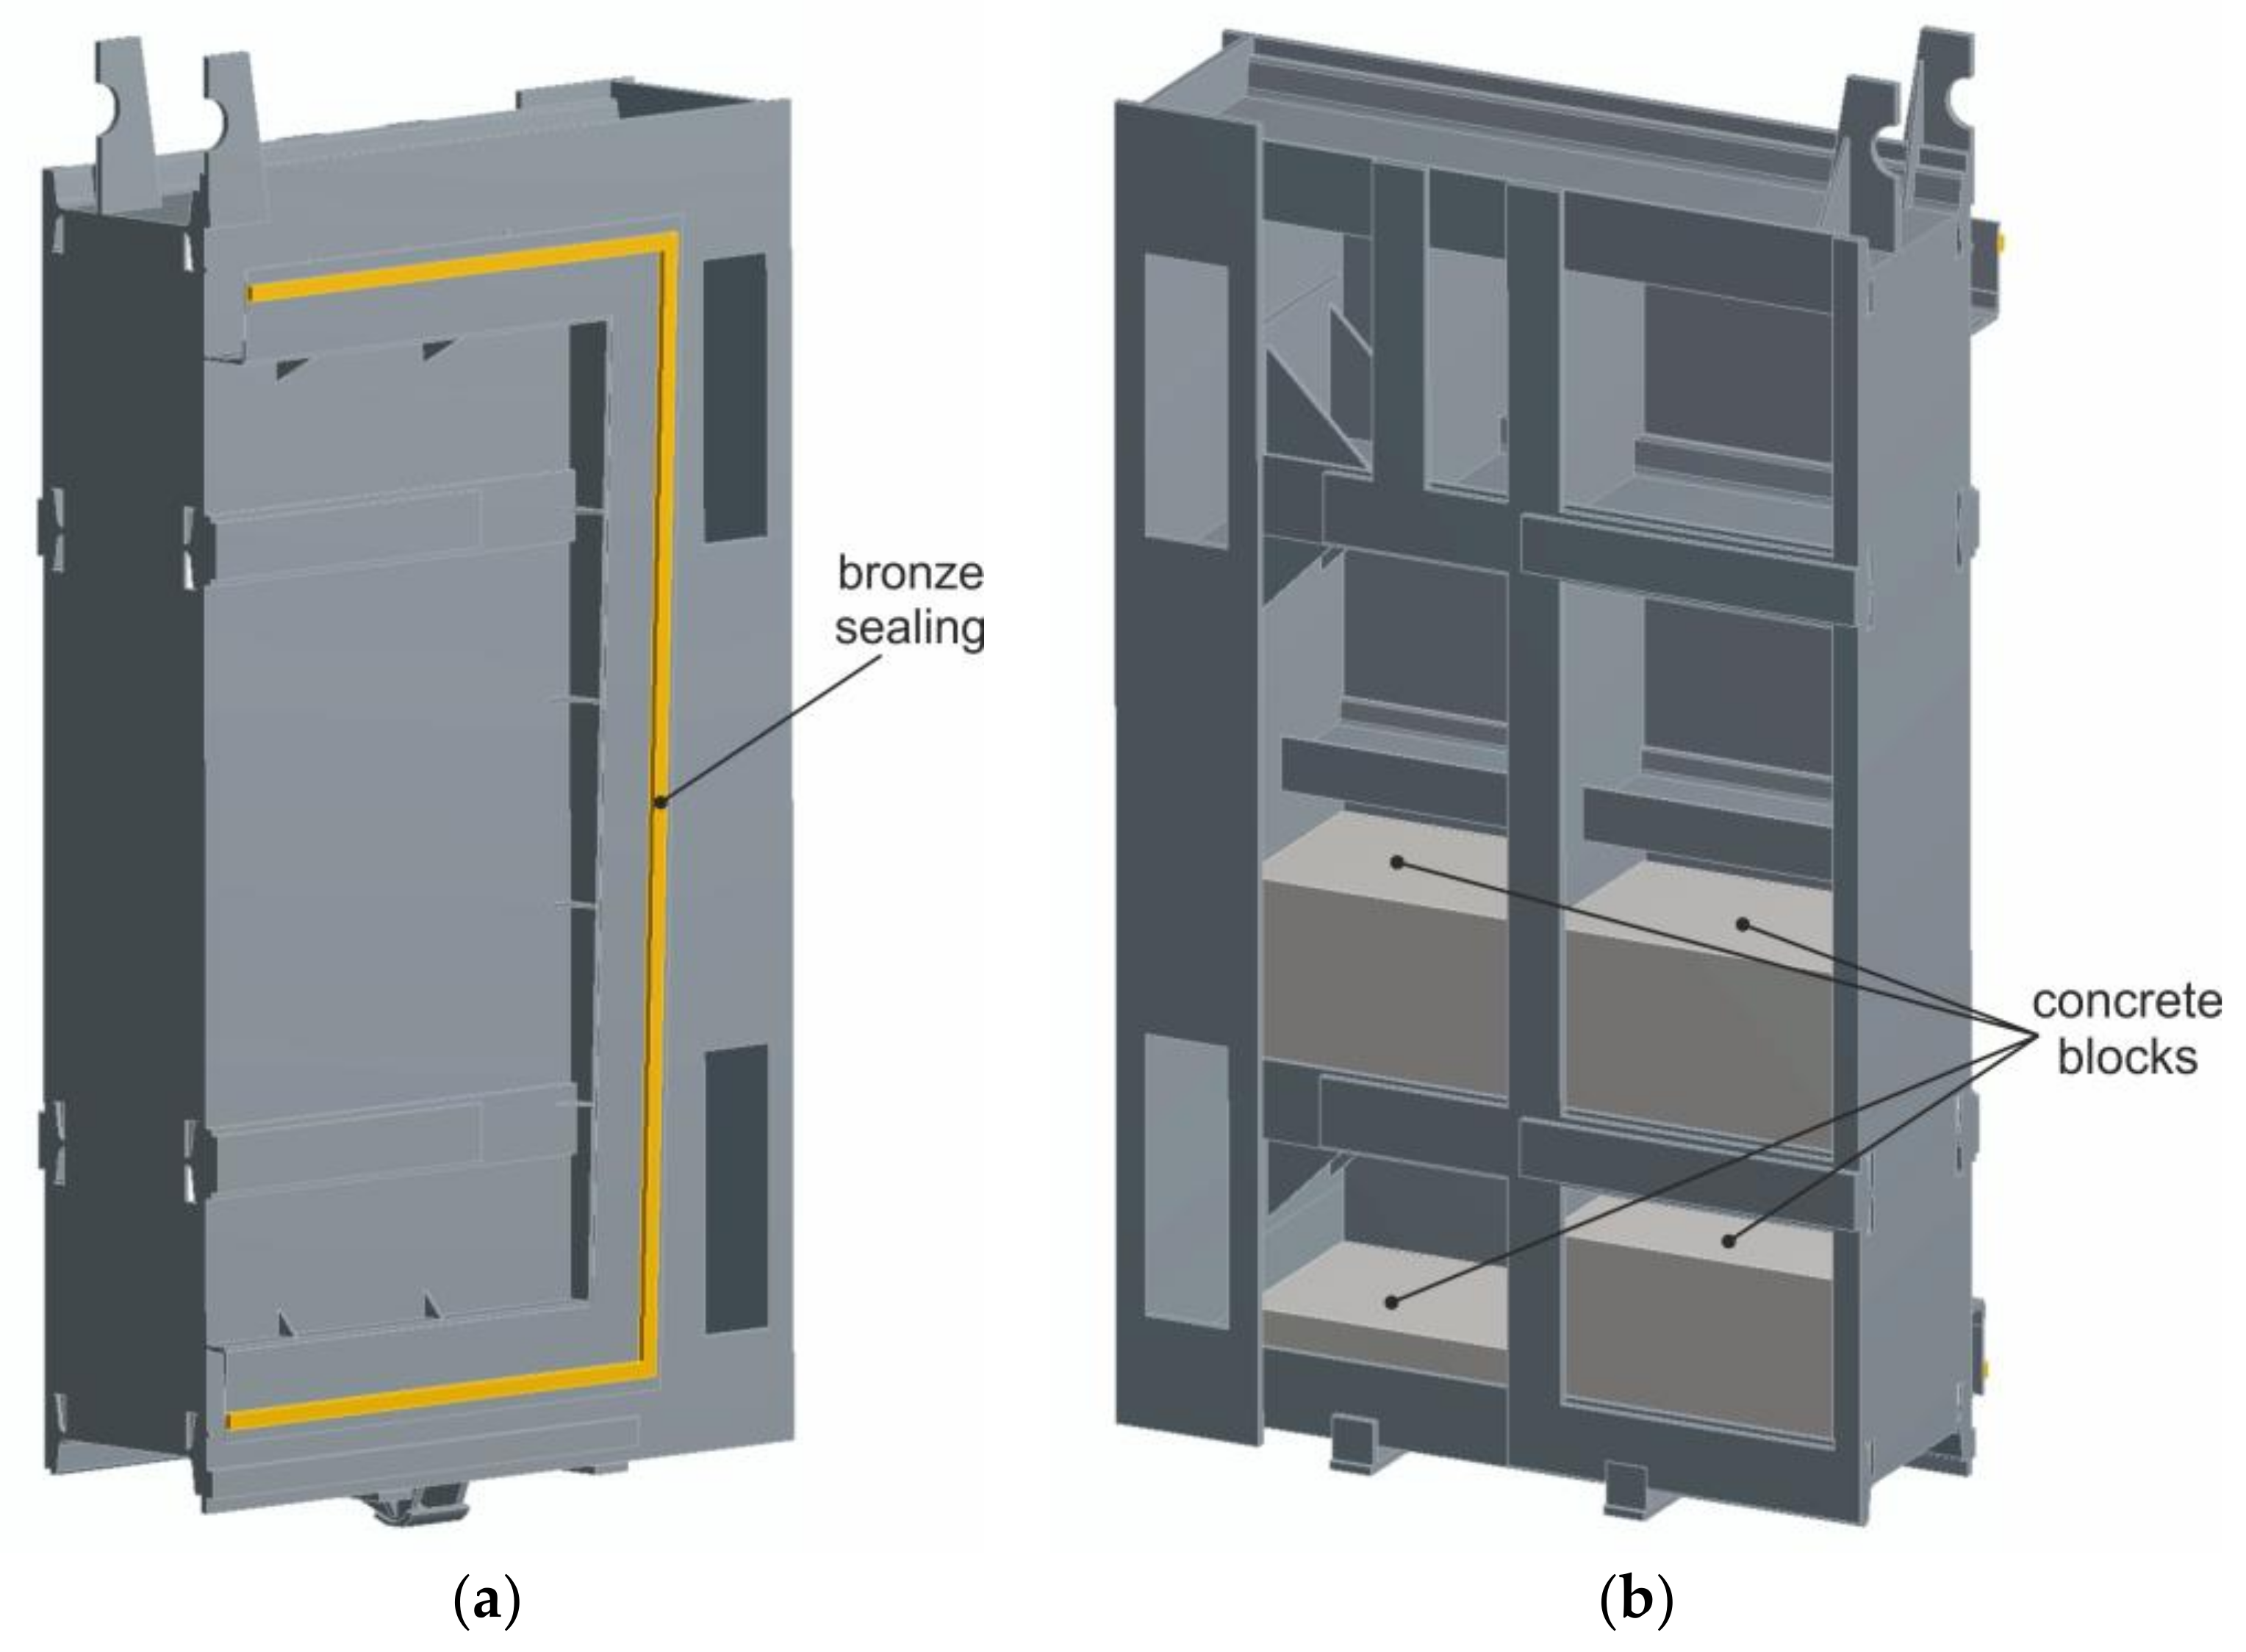
| Element | Young’s Modulus E (MPa) | Poisson’s Ratio μ (¬–) | Density ρ (kg⋅m−3) |
|---|---|---|---|
| welded element (sluice gate) | 2.06⋅105 | 0.3 | 7.900 |
| concrete | 3⋅105 | 0.2 | 2.300 |
| bronze sealing | 1.11⋅105 | 0.34 | 8.800 |
| Type of Analysis | σmax (MPa) for Location | ||||||
|---|---|---|---|---|---|---|---|
| OP1/A1 | OP1/A2 | OP2/A3 | OP2/A4 | OP3/A5 | OP4/A6 | OP5/A7 | |
| FEM | −4.2 | −1.1 | −14.7 | −29.7 | −24.4 | −33.2 | −20.8 |
| operational measurement—stage 3 | 1.5 | −2.2 | −4.1 | −25.0 | −16.2 | −27.2 | −23.0 |
| operational measurement—stage 5 | −1.1 | −1.6 | −4.9 | −26.2 | −18.1 | −24.5 | −20.5 |
| Type of Analysis | σred (MPa) for Location | ||||
|---|---|---|---|---|---|
| RS1 | RS2 | RS3 | RS4 | RS5 | |
| Hole drilling method | 163.17 | 161.62 | 167.39 | 159.99 | 117.29 |
| FEM | 7.8 | 4.4 | 31.5 | 3.1 | 6.3 |
Publisher’s Note: MDPI stays neutral with regard to jurisdictional claims in published maps and institutional affiliations. |
© 2020 by the authors. Licensee MDPI, Basel, Switzerland. This article is an open access article distributed under the terms and conditions of the Creative Commons Attribution (CC BY) license (http://creativecommons.org/licenses/by/4.0/).
Share and Cite
Pástor, M.; Bocko, J.; Lengvarský, P.; Sivák, P.; Šarga, P. Experimental and Numerical Analysis of 60-Year-Old Sluice Gate Affected by Long-Term Operation. Materials 2020, 13, 5201. https://doi.org/10.3390/ma13225201
Pástor M, Bocko J, Lengvarský P, Sivák P, Šarga P. Experimental and Numerical Analysis of 60-Year-Old Sluice Gate Affected by Long-Term Operation. Materials. 2020; 13(22):5201. https://doi.org/10.3390/ma13225201
Chicago/Turabian StylePástor, Miroslav, Jozef Bocko, Pavol Lengvarský, Peter Sivák, and Patrik Šarga. 2020. "Experimental and Numerical Analysis of 60-Year-Old Sluice Gate Affected by Long-Term Operation" Materials 13, no. 22: 5201. https://doi.org/10.3390/ma13225201
APA StylePástor, M., Bocko, J., Lengvarský, P., Sivák, P., & Šarga, P. (2020). Experimental and Numerical Analysis of 60-Year-Old Sluice Gate Affected by Long-Term Operation. Materials, 13(22), 5201. https://doi.org/10.3390/ma13225201