Influence of ns-Laser Cleaning Parameters on the Removal of the Painted Layer and Selected Properties of the Base Metal

Abstract
:1. Introduction
2. Experimental Procedure
2.1. Materials
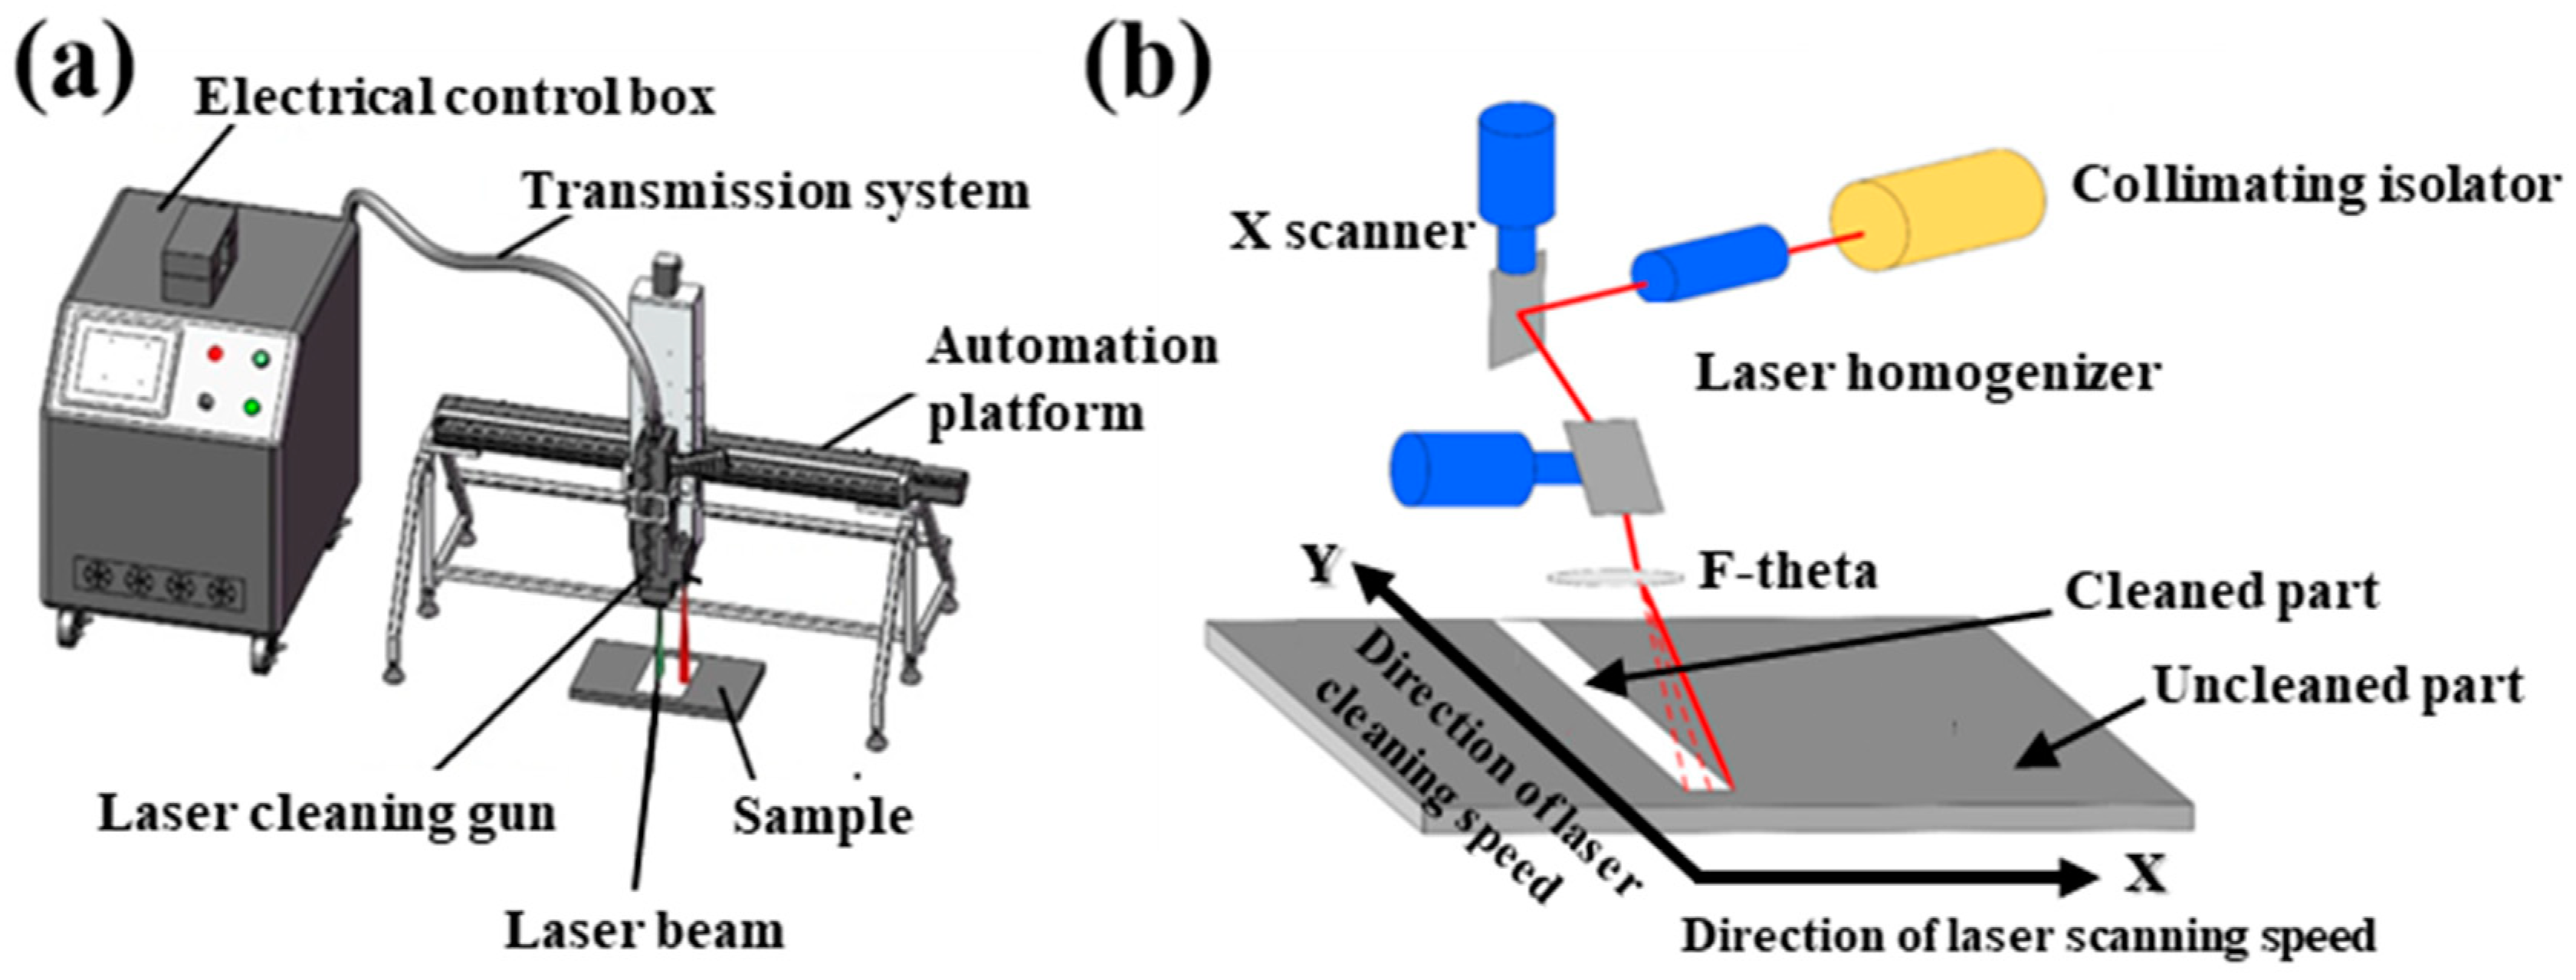
2.2. Experiment
3. Results and Discussion
3.1. Surface Morphology of the Cleaned Material
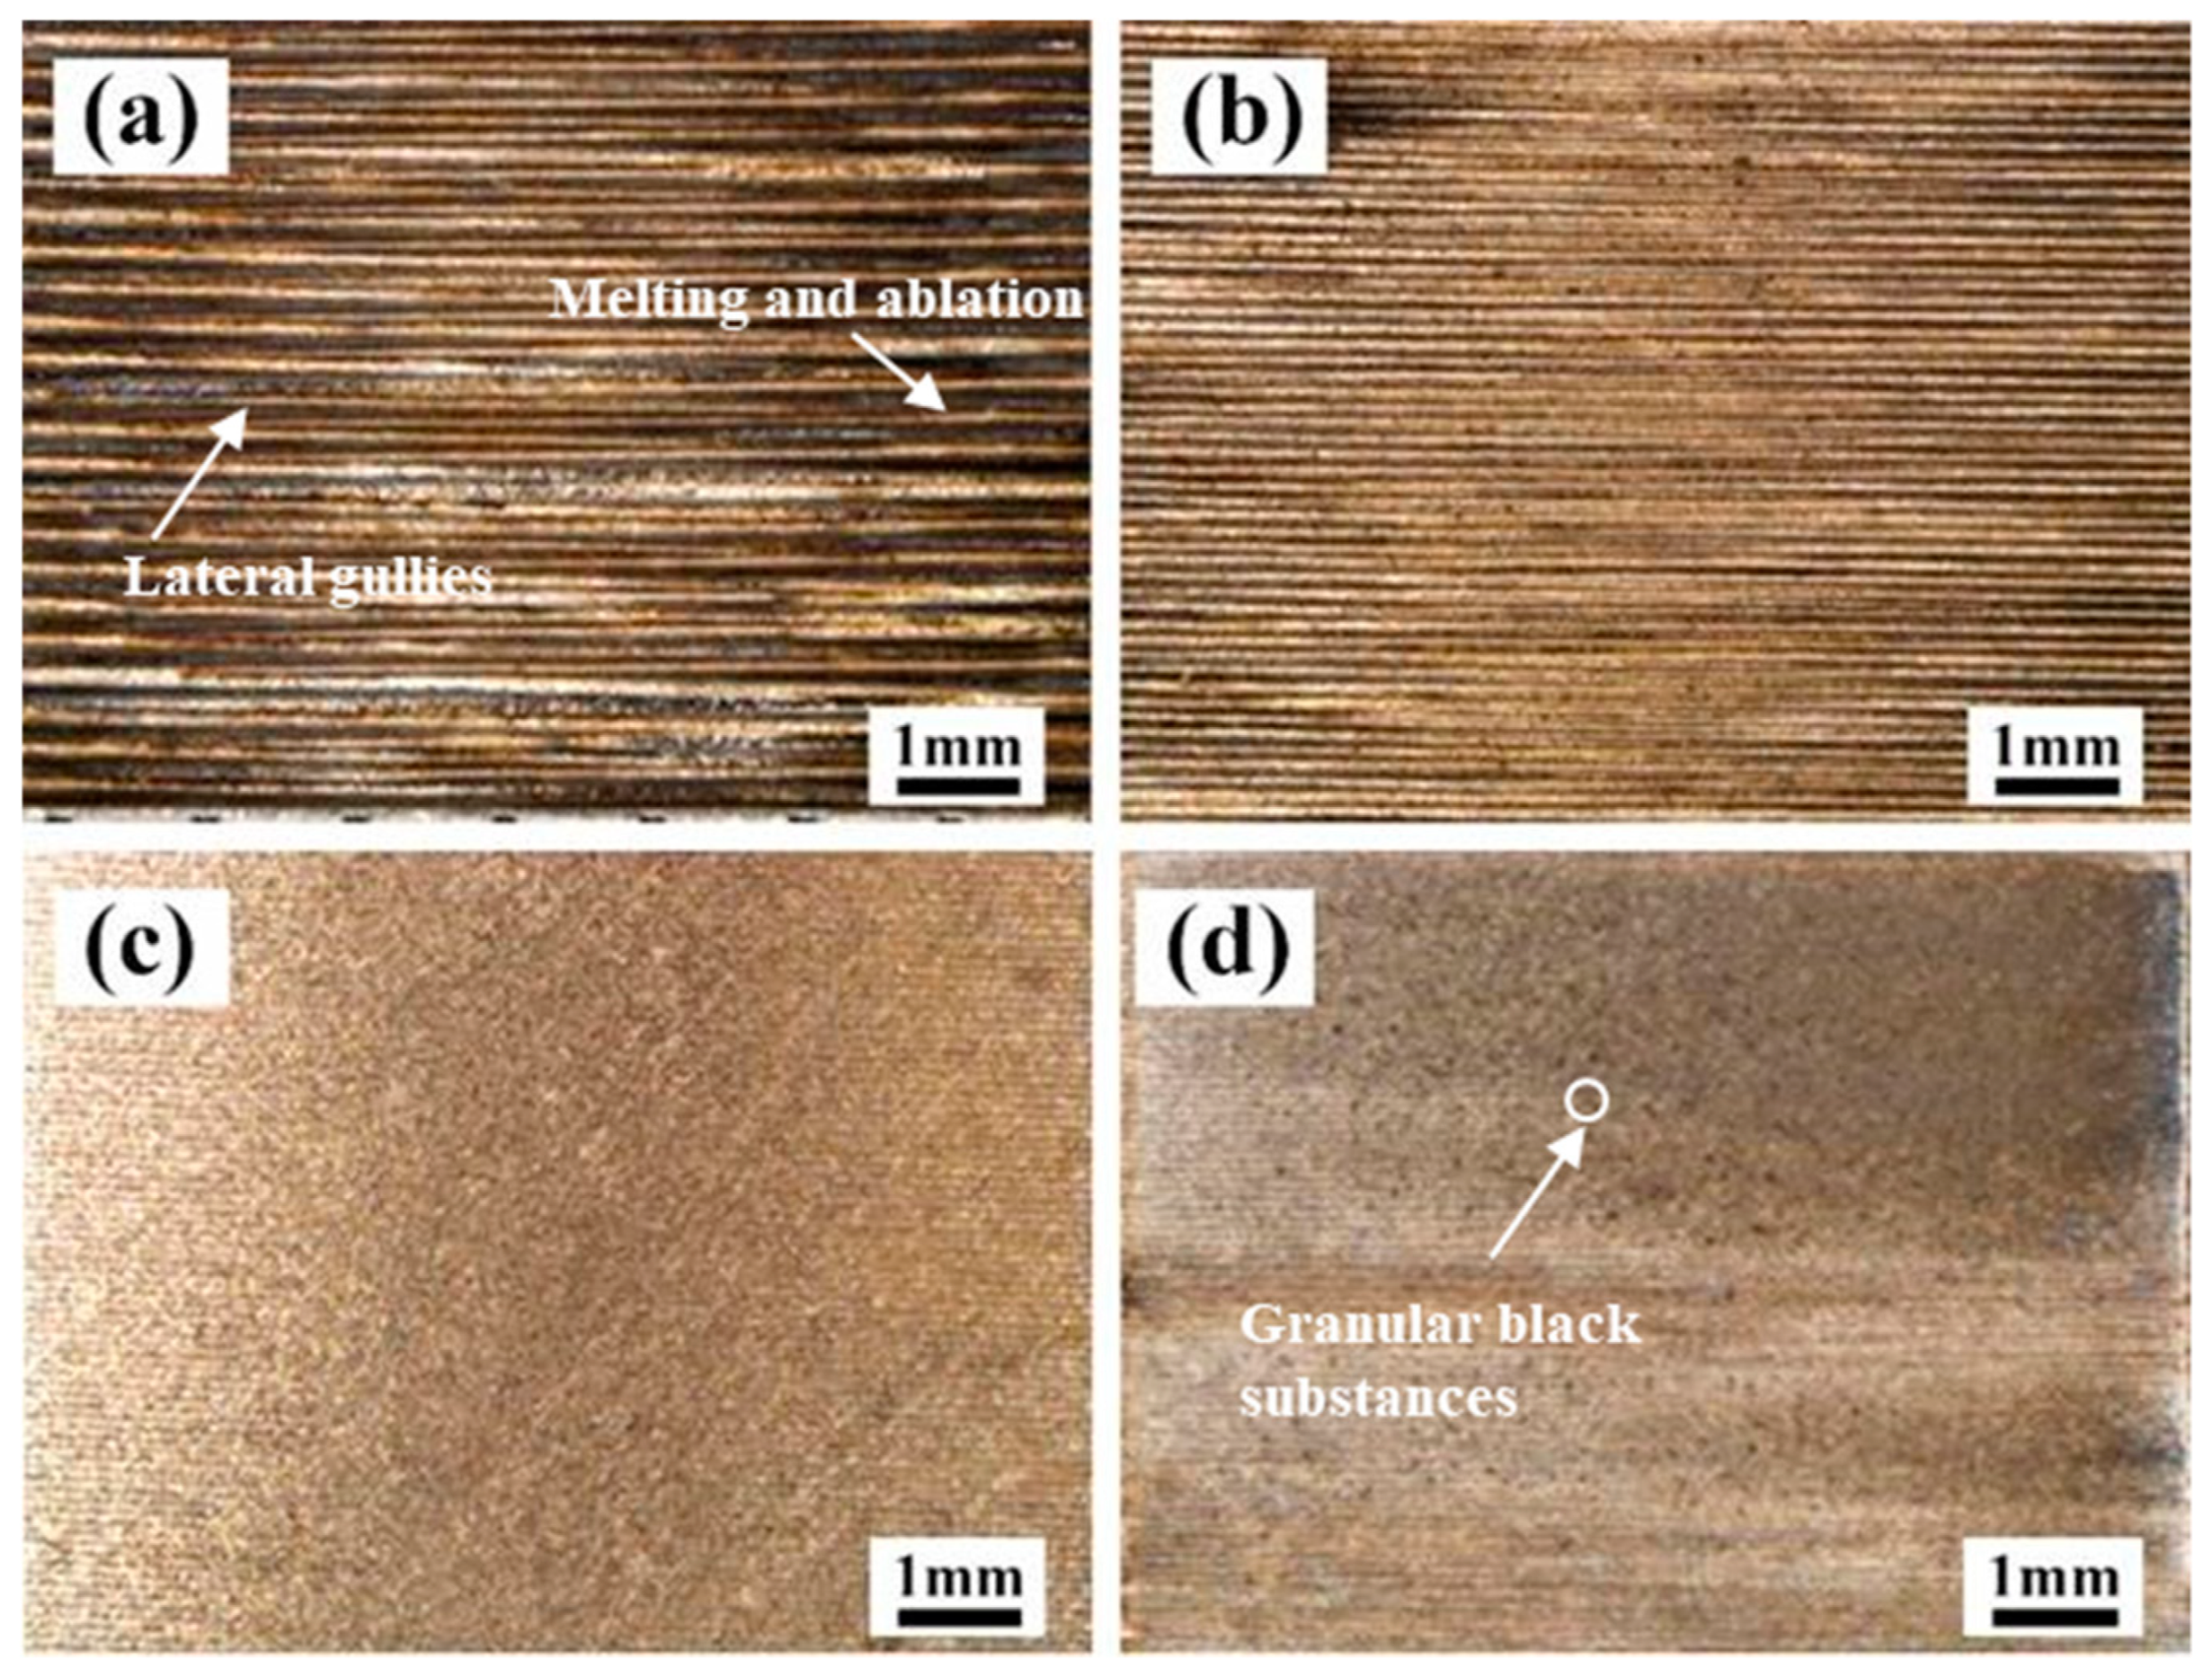
3.1.1. The Effect of Laser X-Scanning Speed
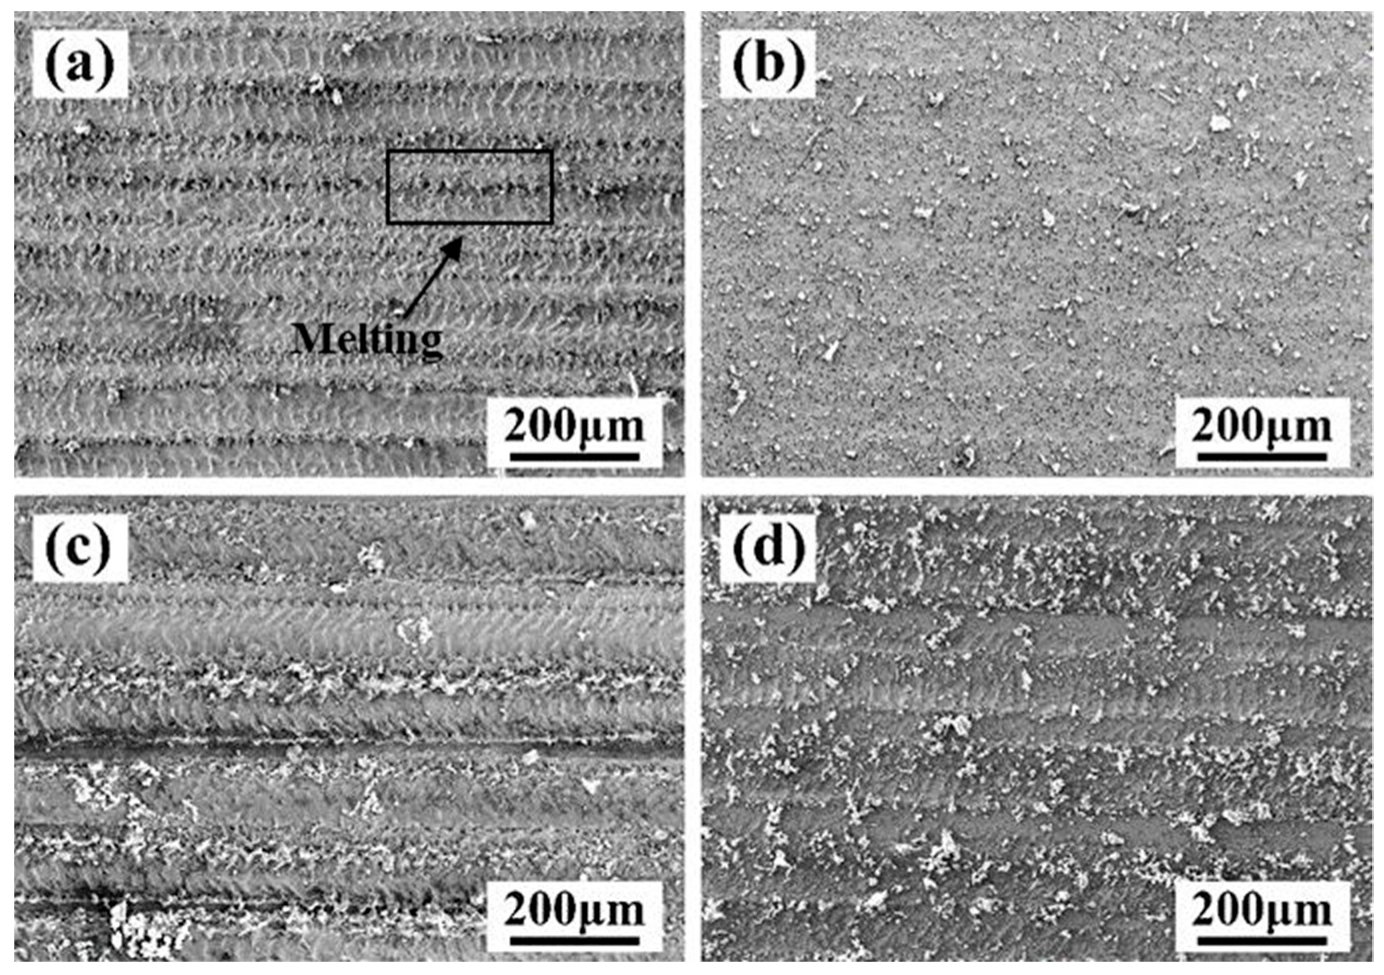
3.1.2. The Effect of Laser Y-Moving Speed
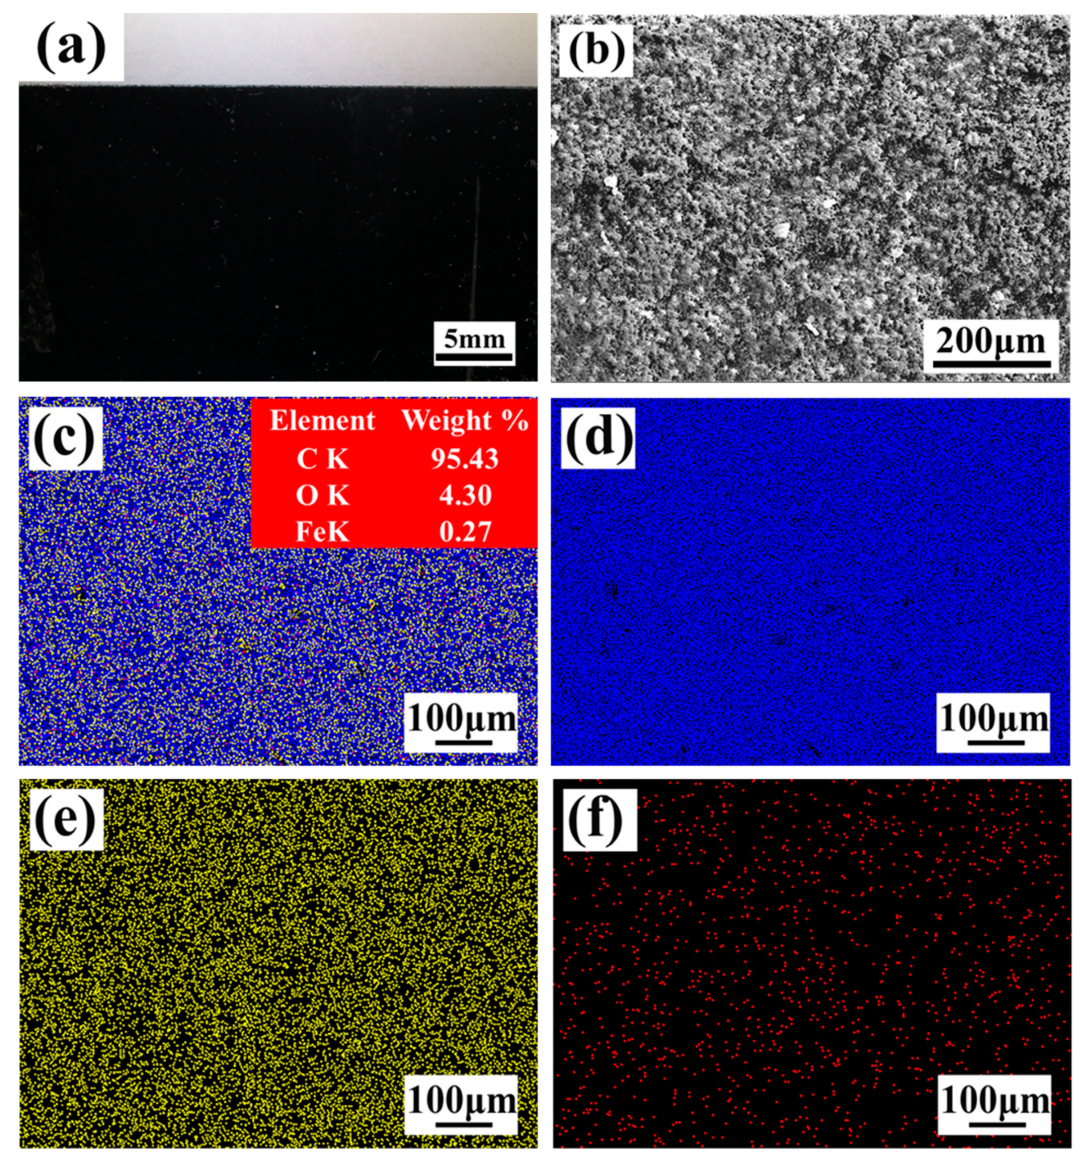
3.2. Distribution of Element on the Surface of the Cleaned Material
3.2.1. The Effect of Laser X-Scanning Speed
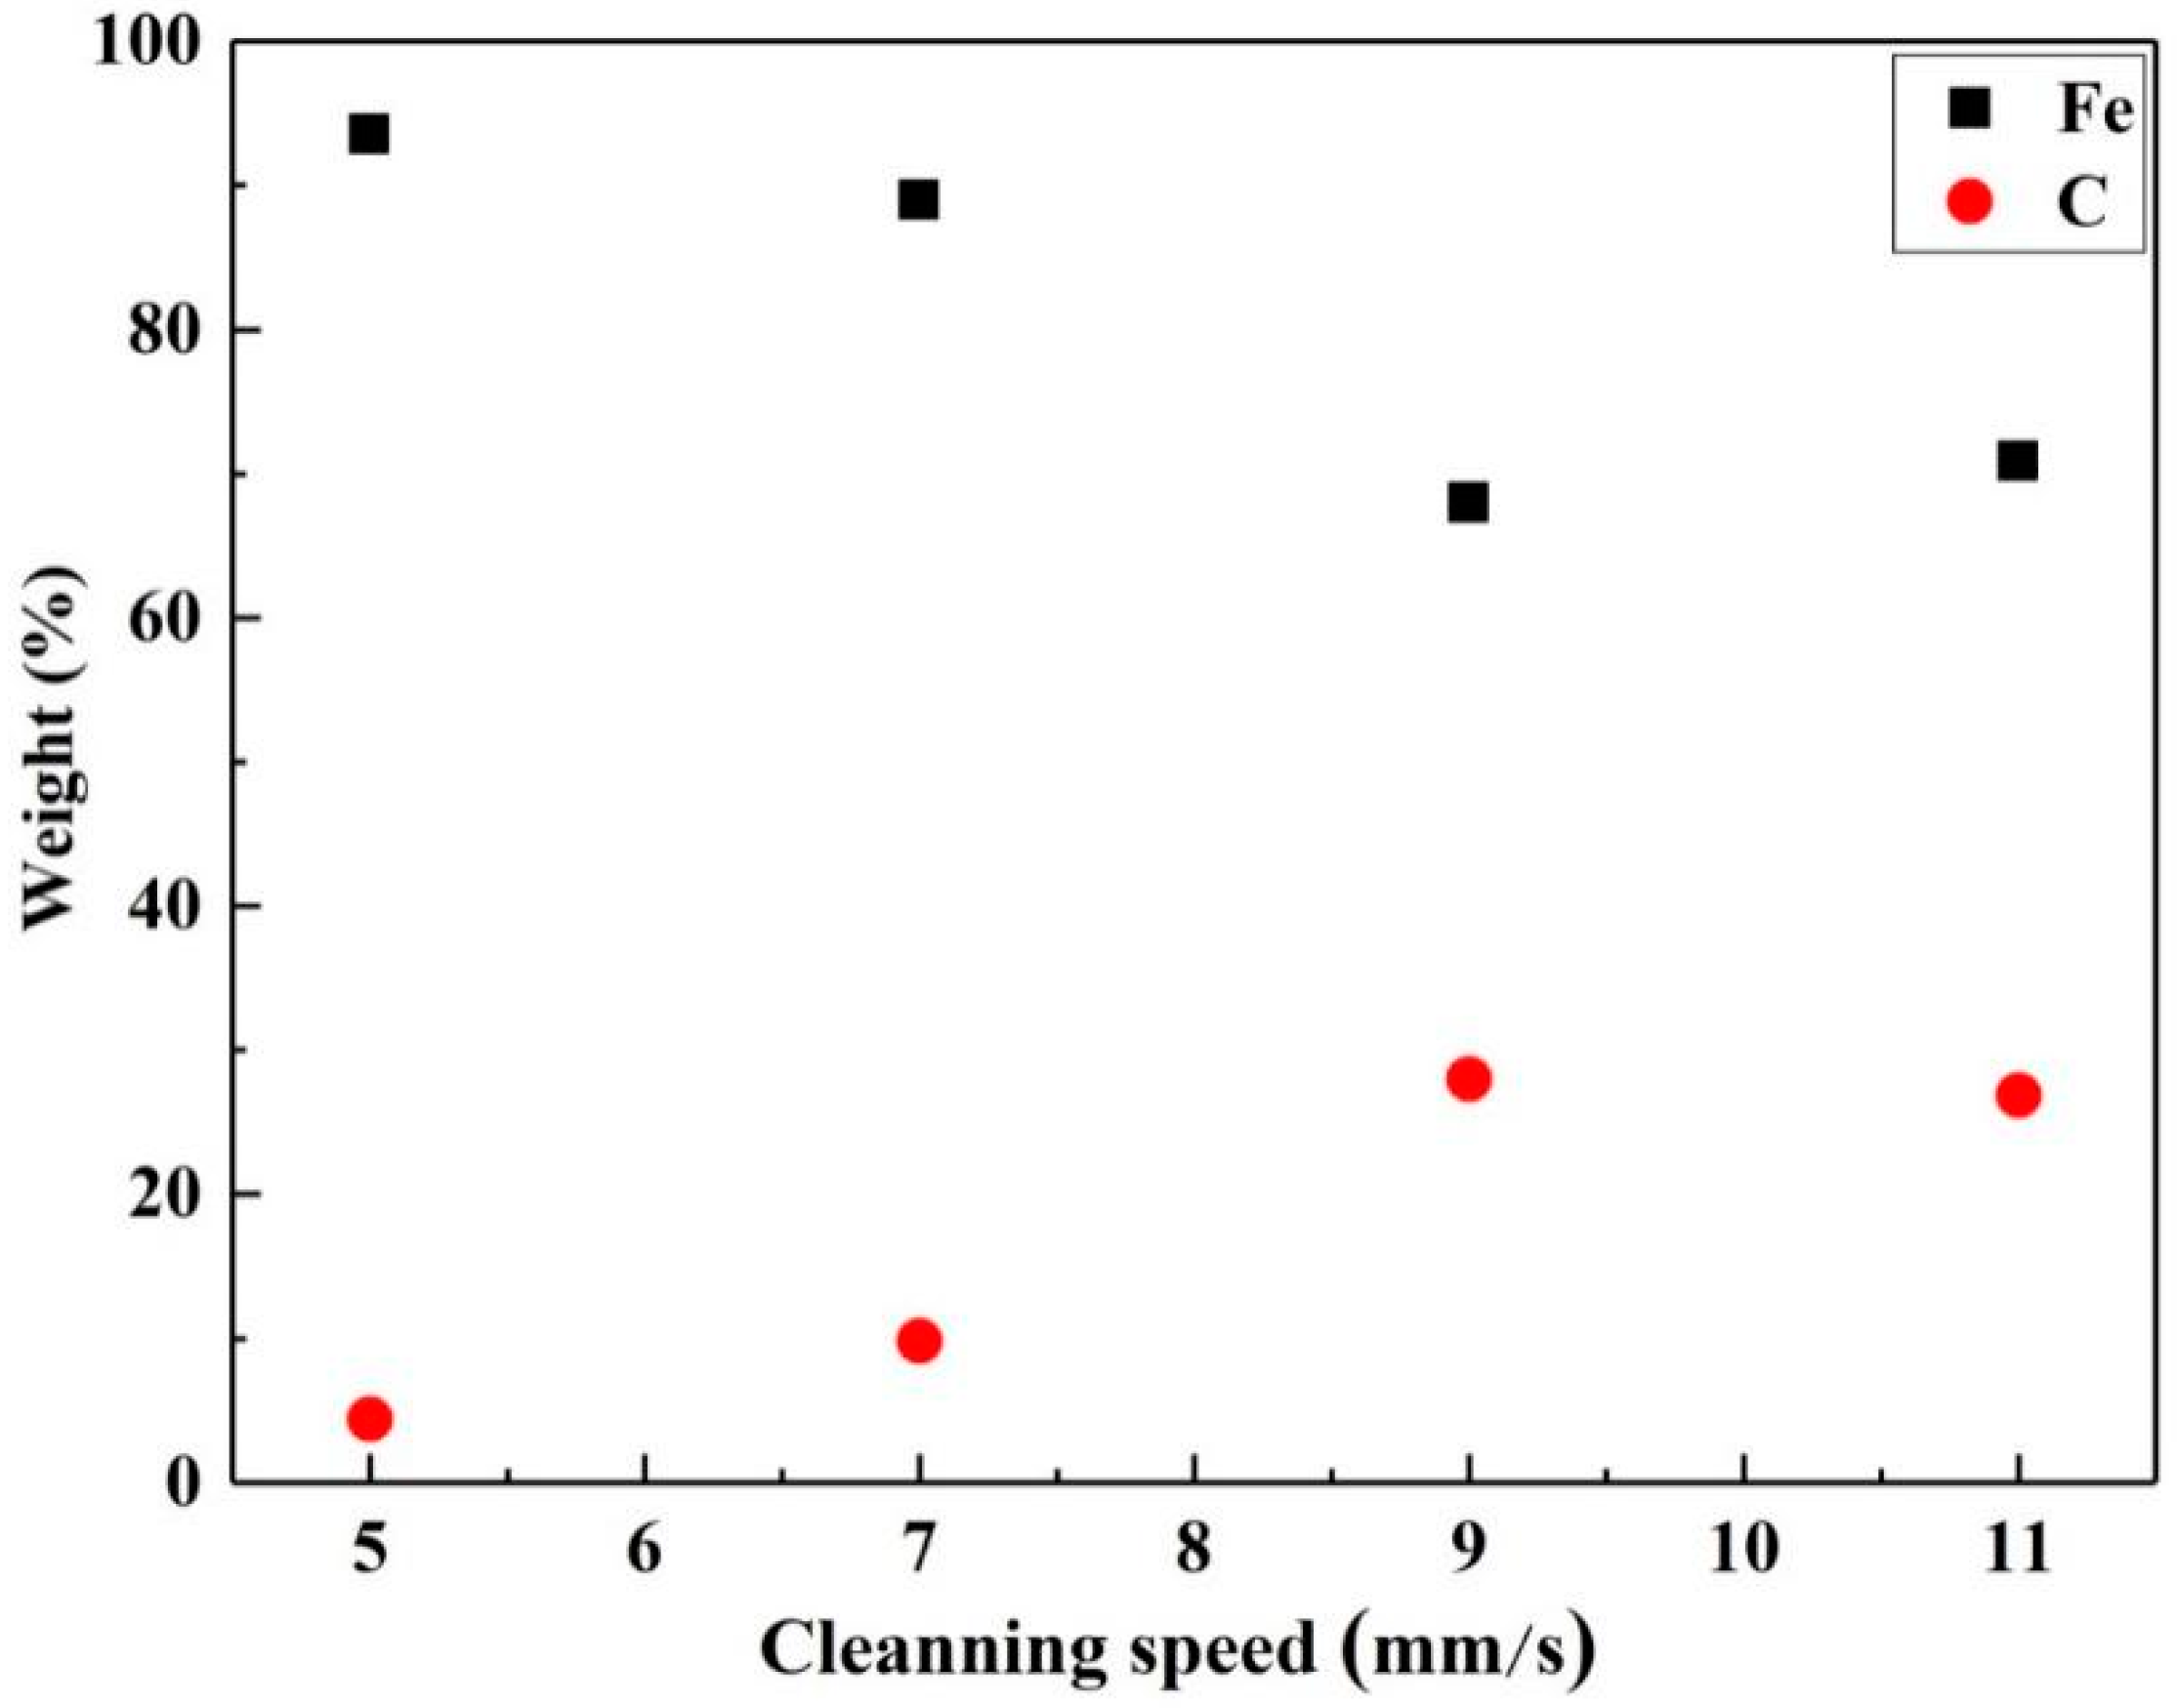
3.2.2. The Effect of Laser Y-Moving Speed
3.3. Roughness and Three-Dimensional Topography of the Surface of the Cleaned Material
3.3.1. The Effect of Laser X-Scanning Speed
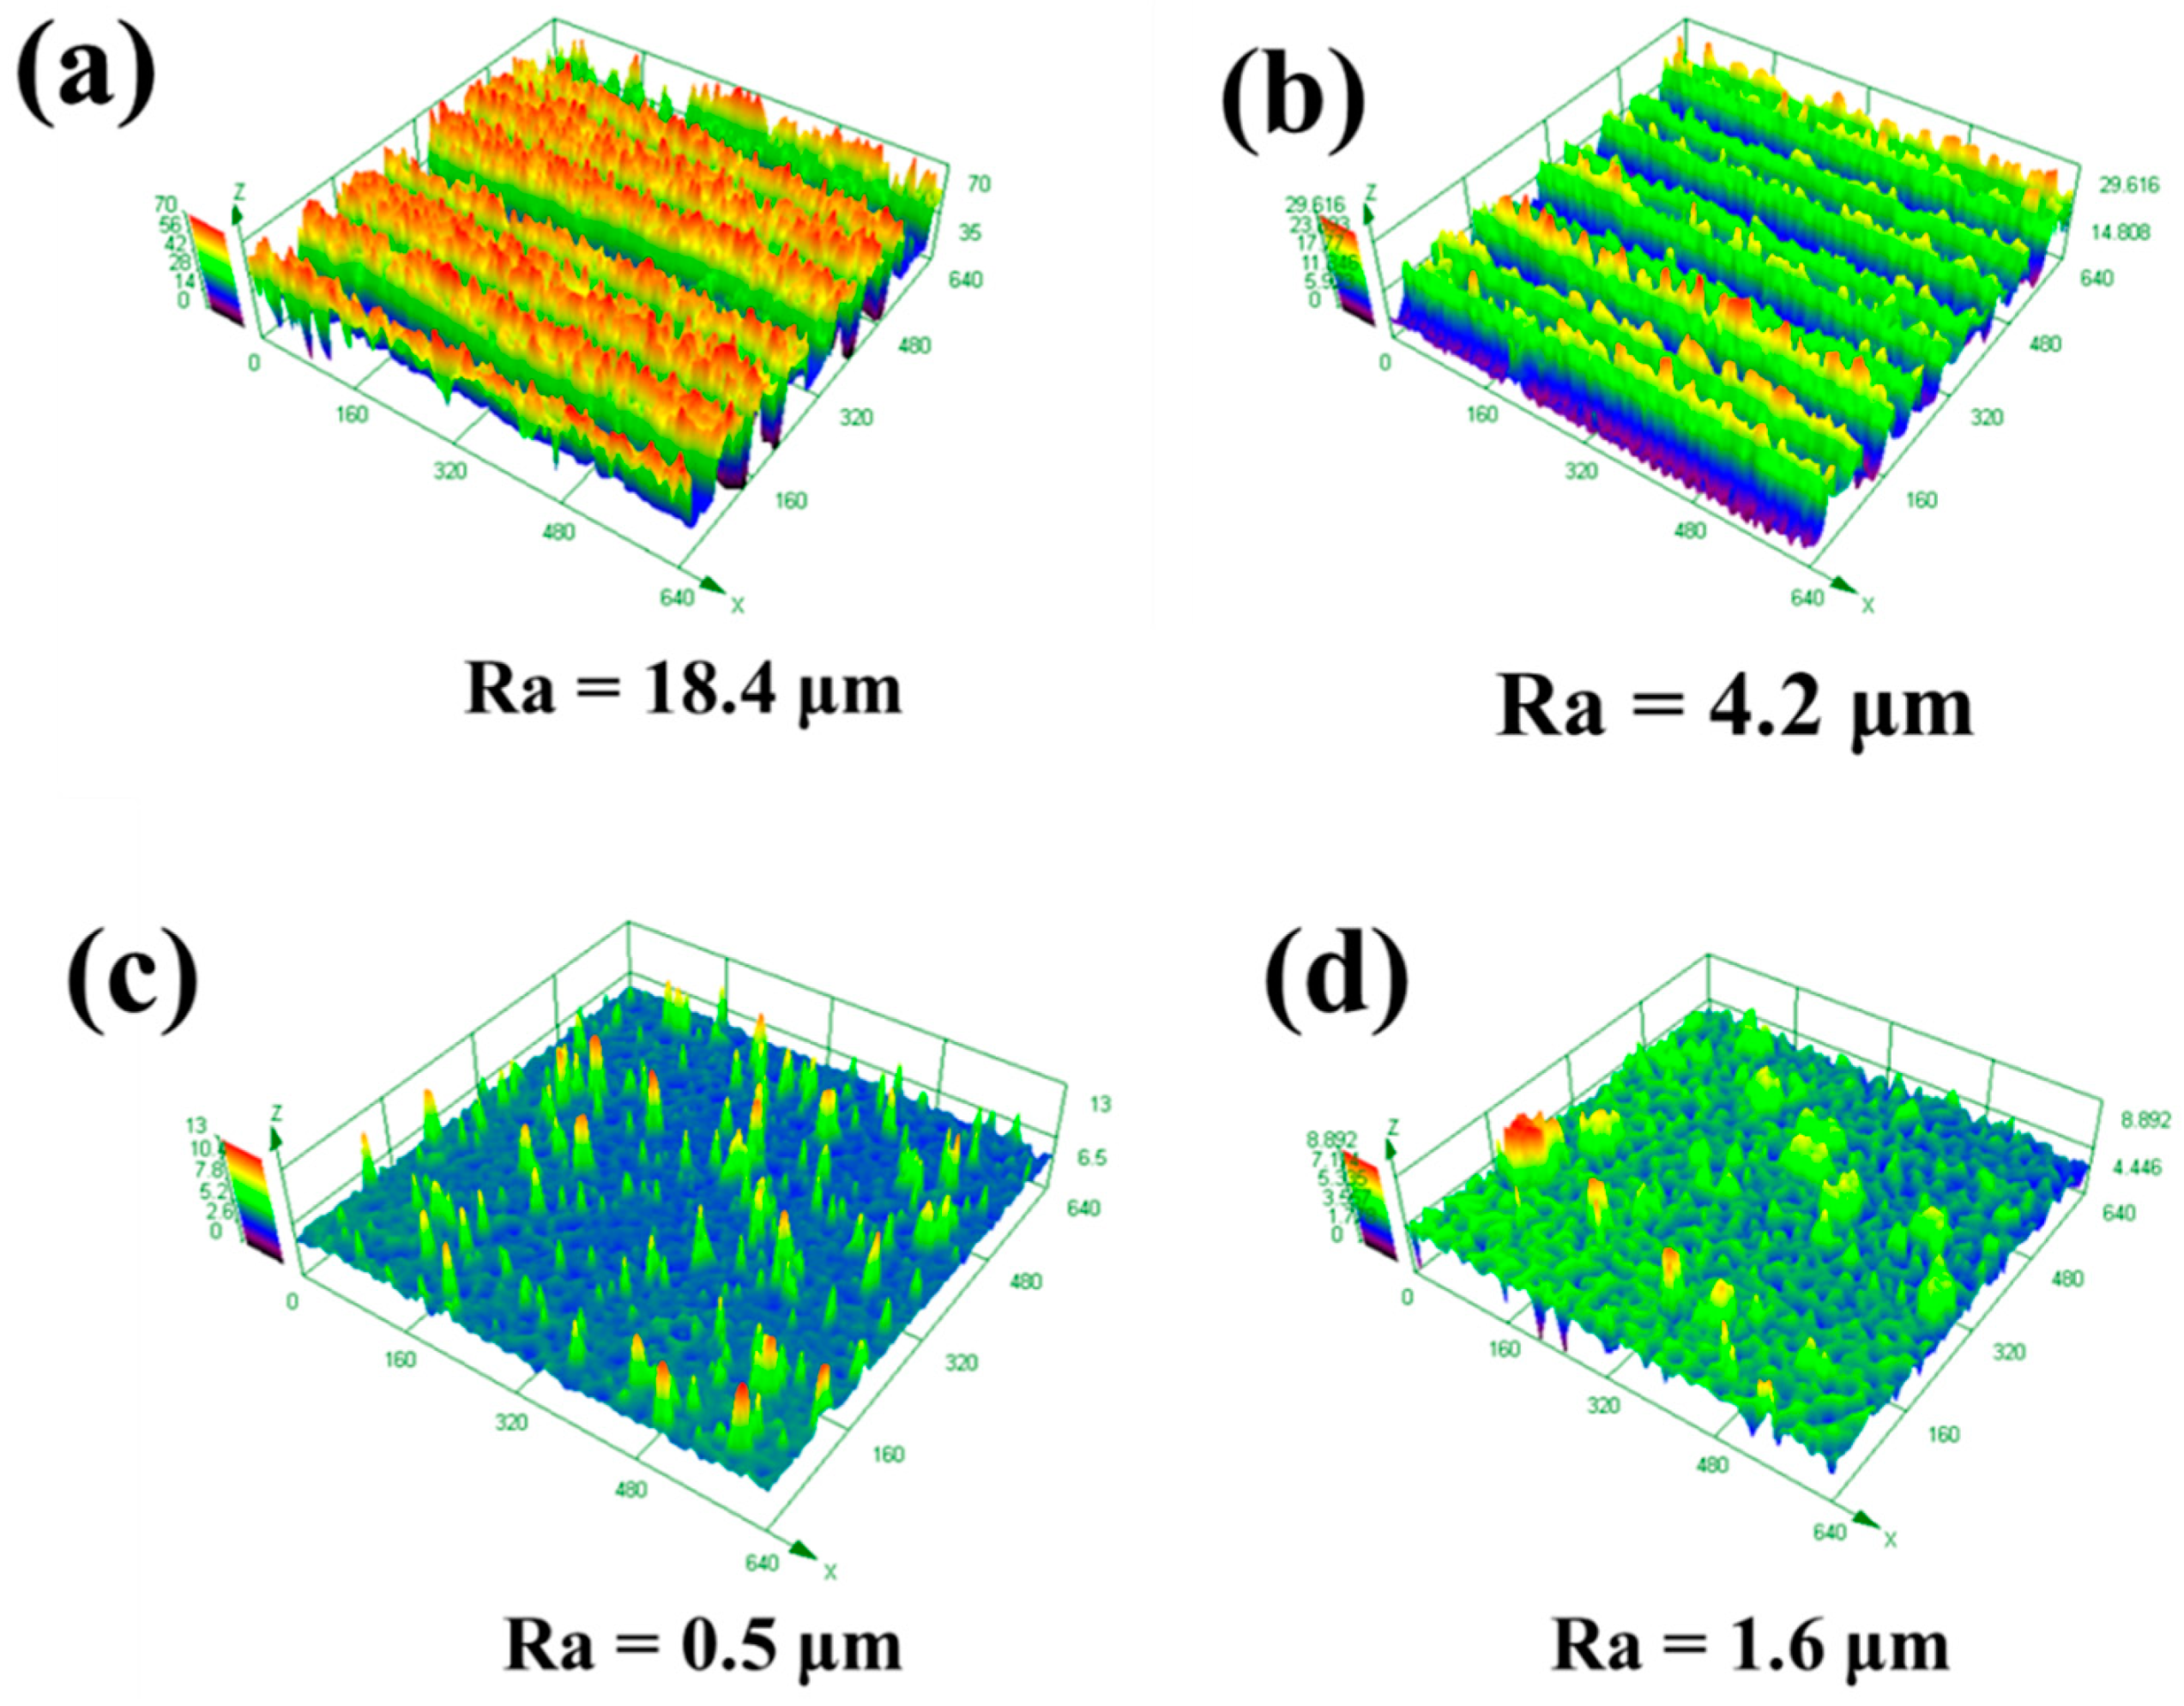
3.3.2. The Effect of Laser Y-Moving Speed
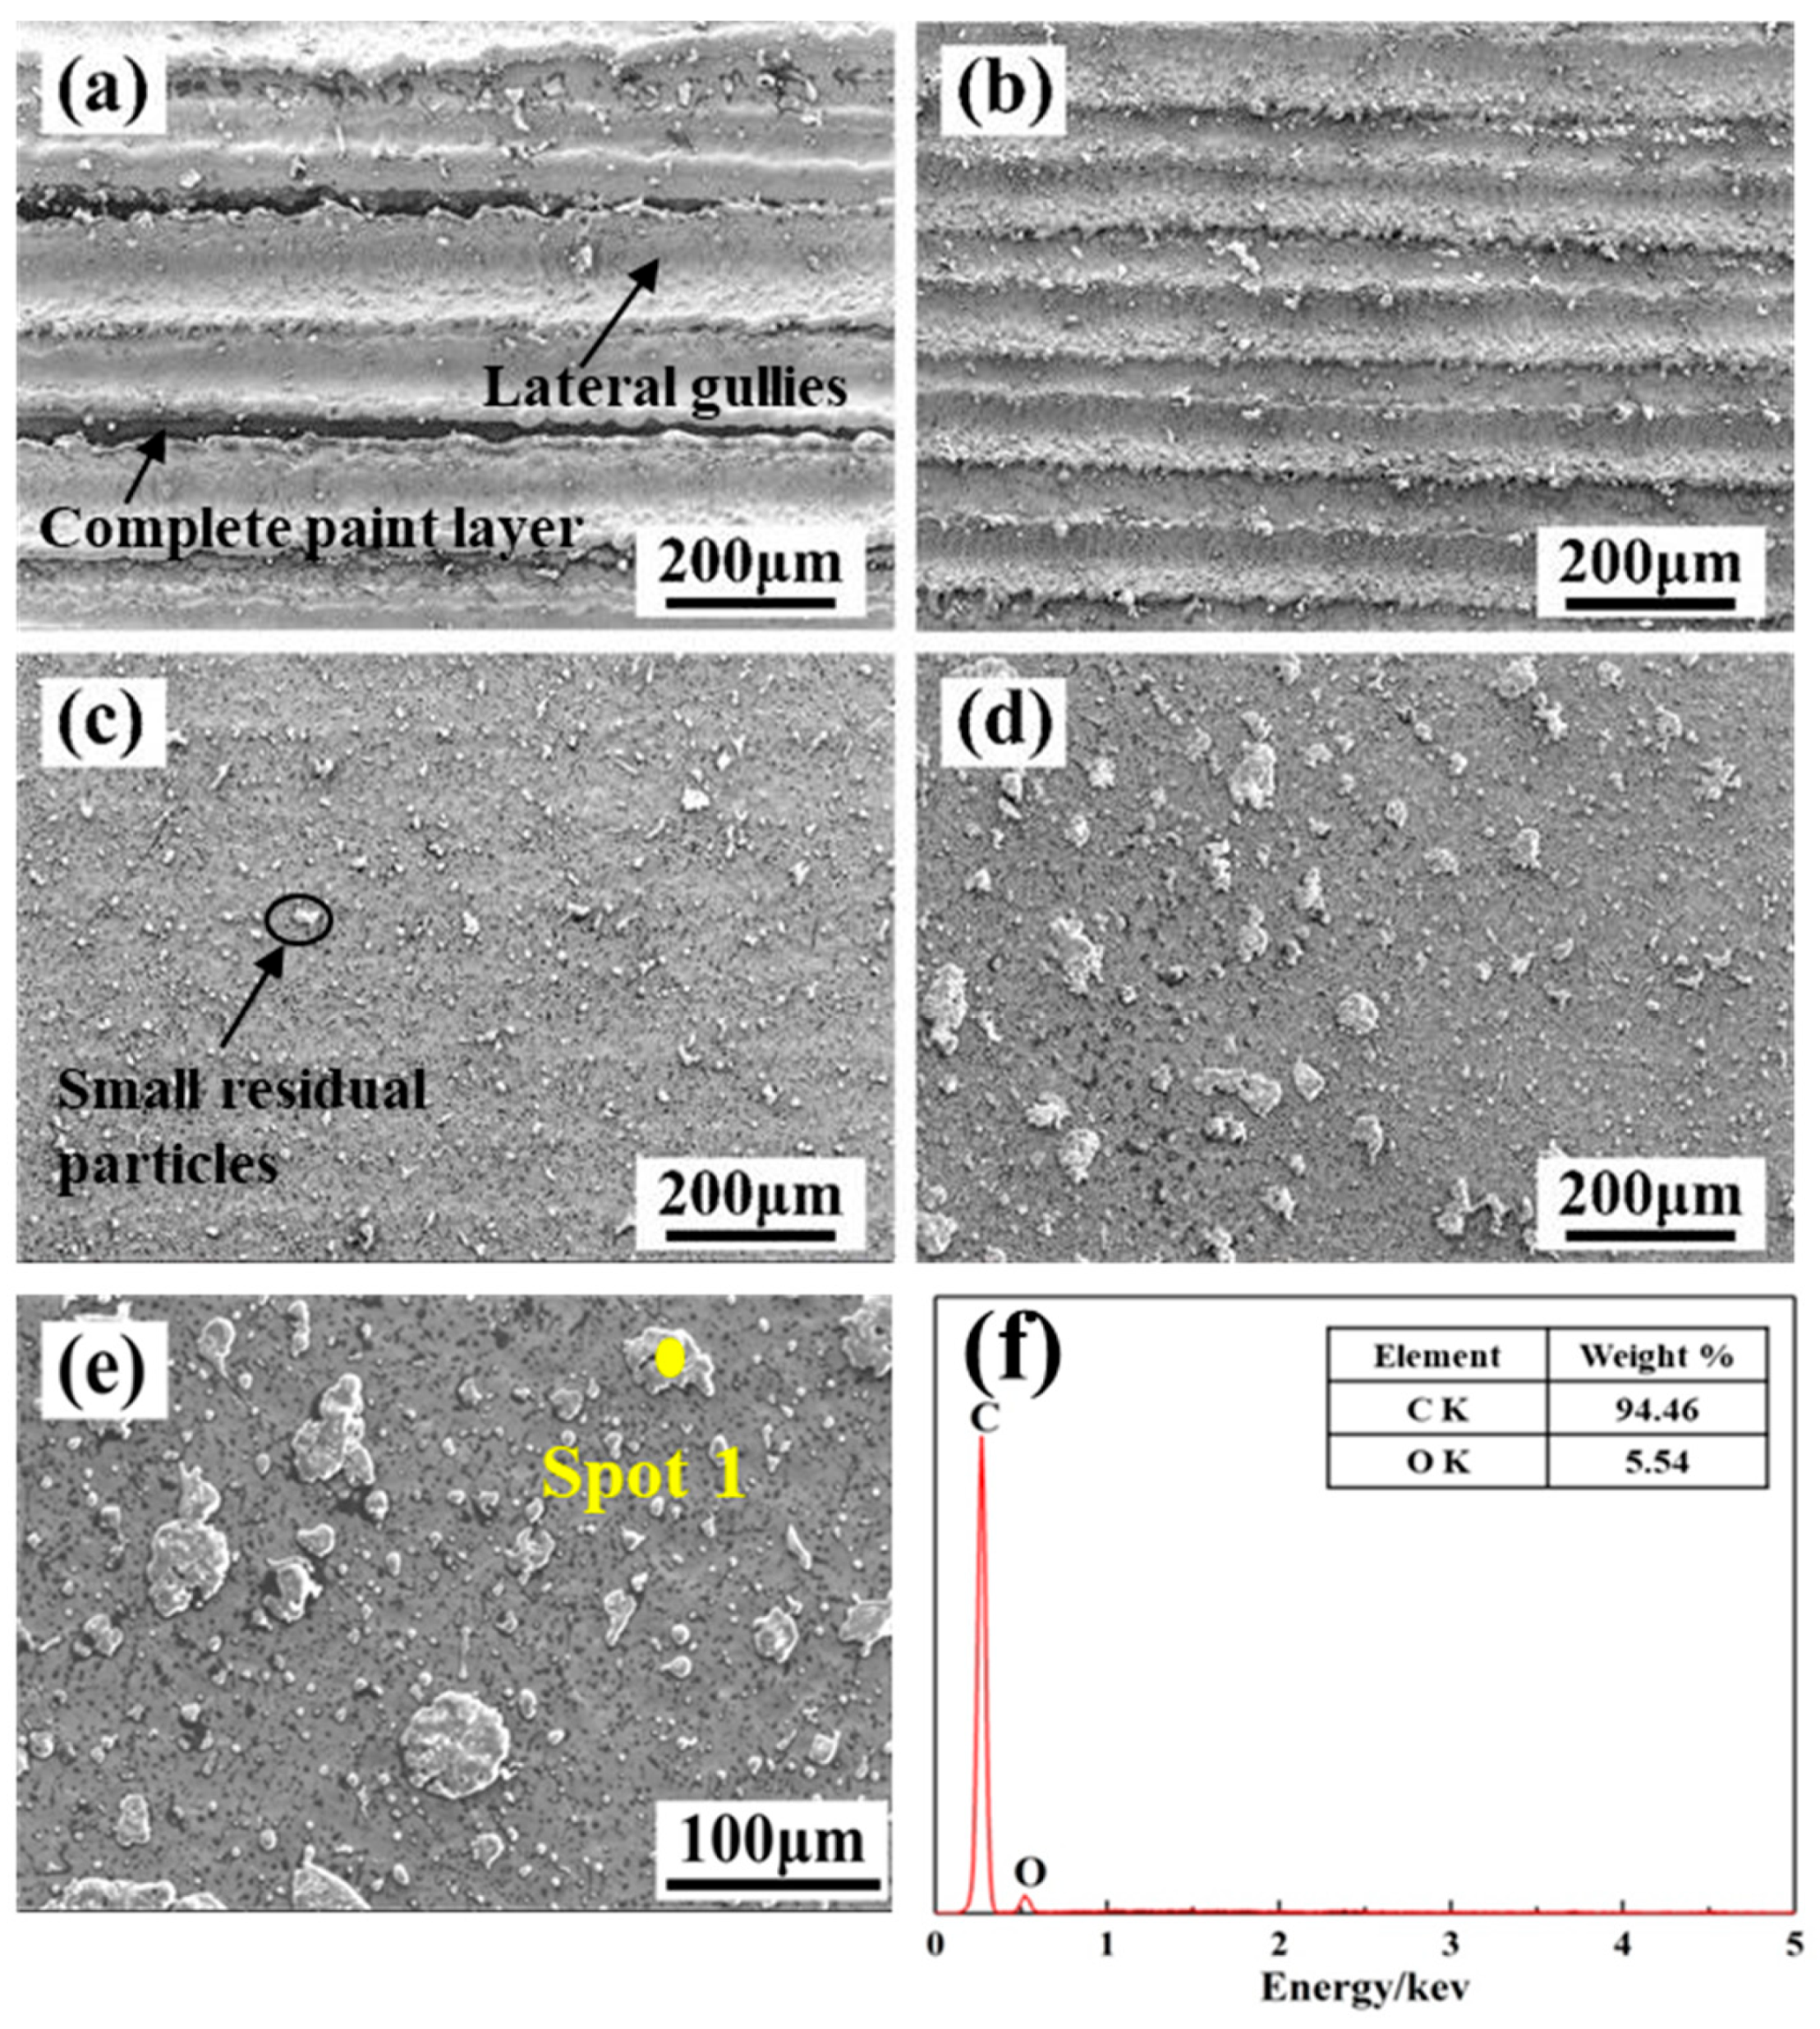
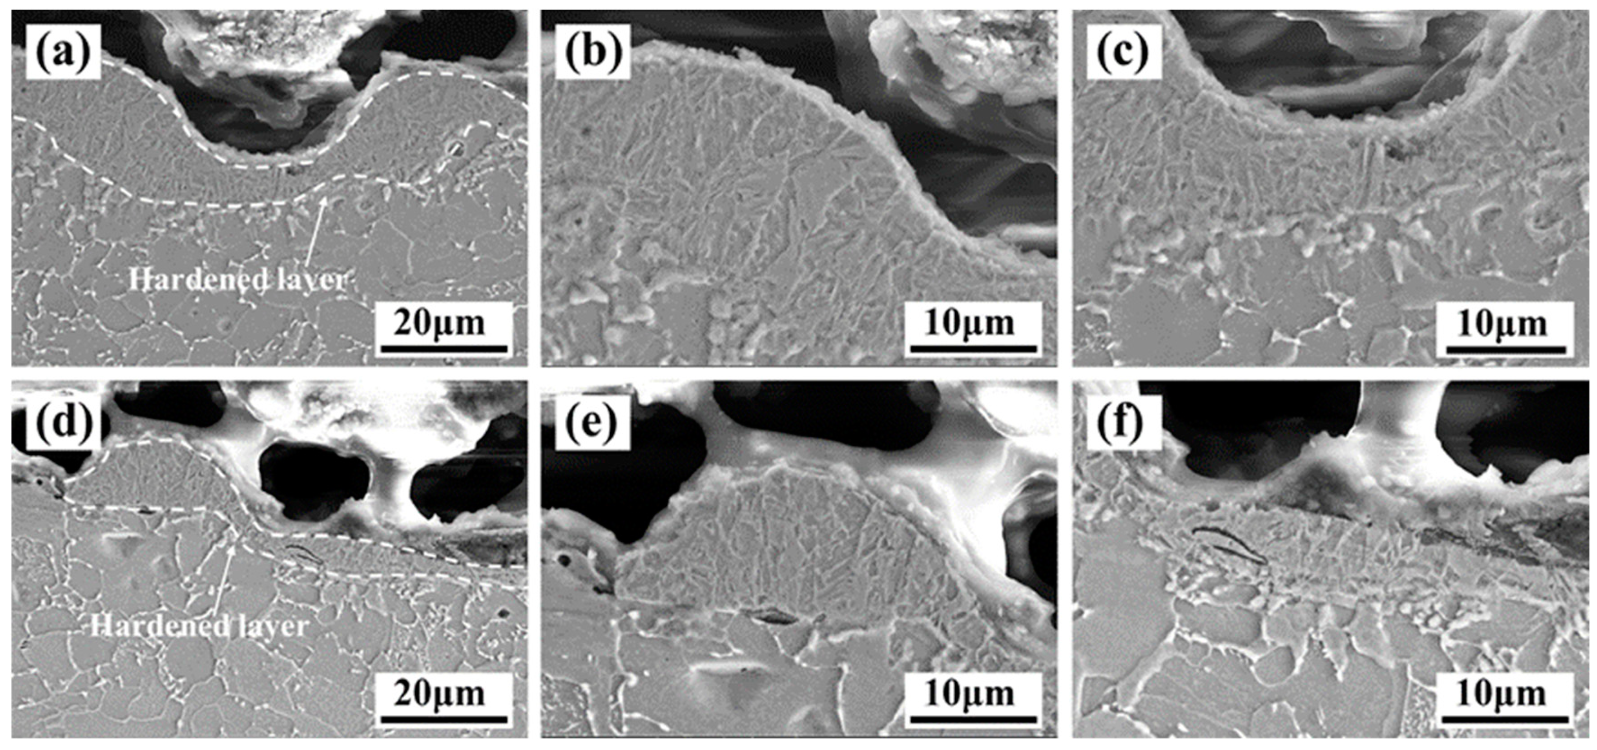
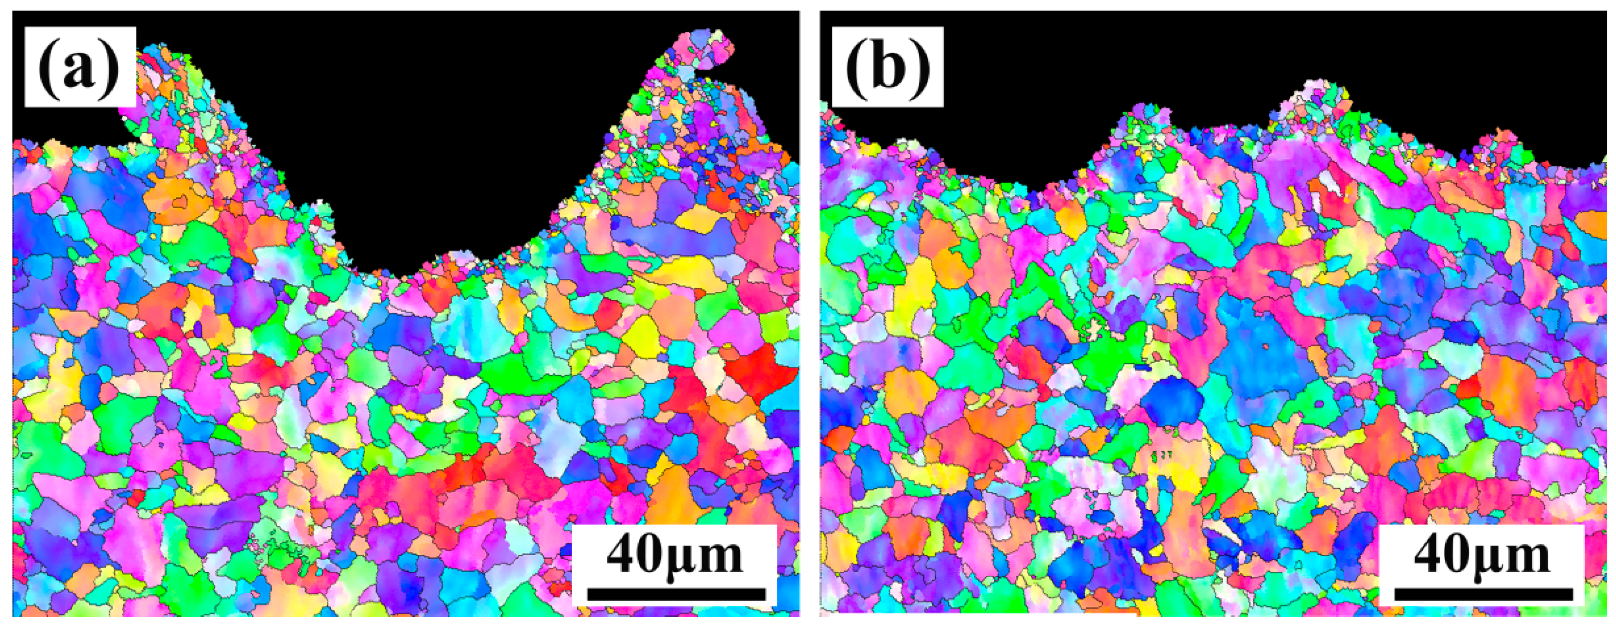
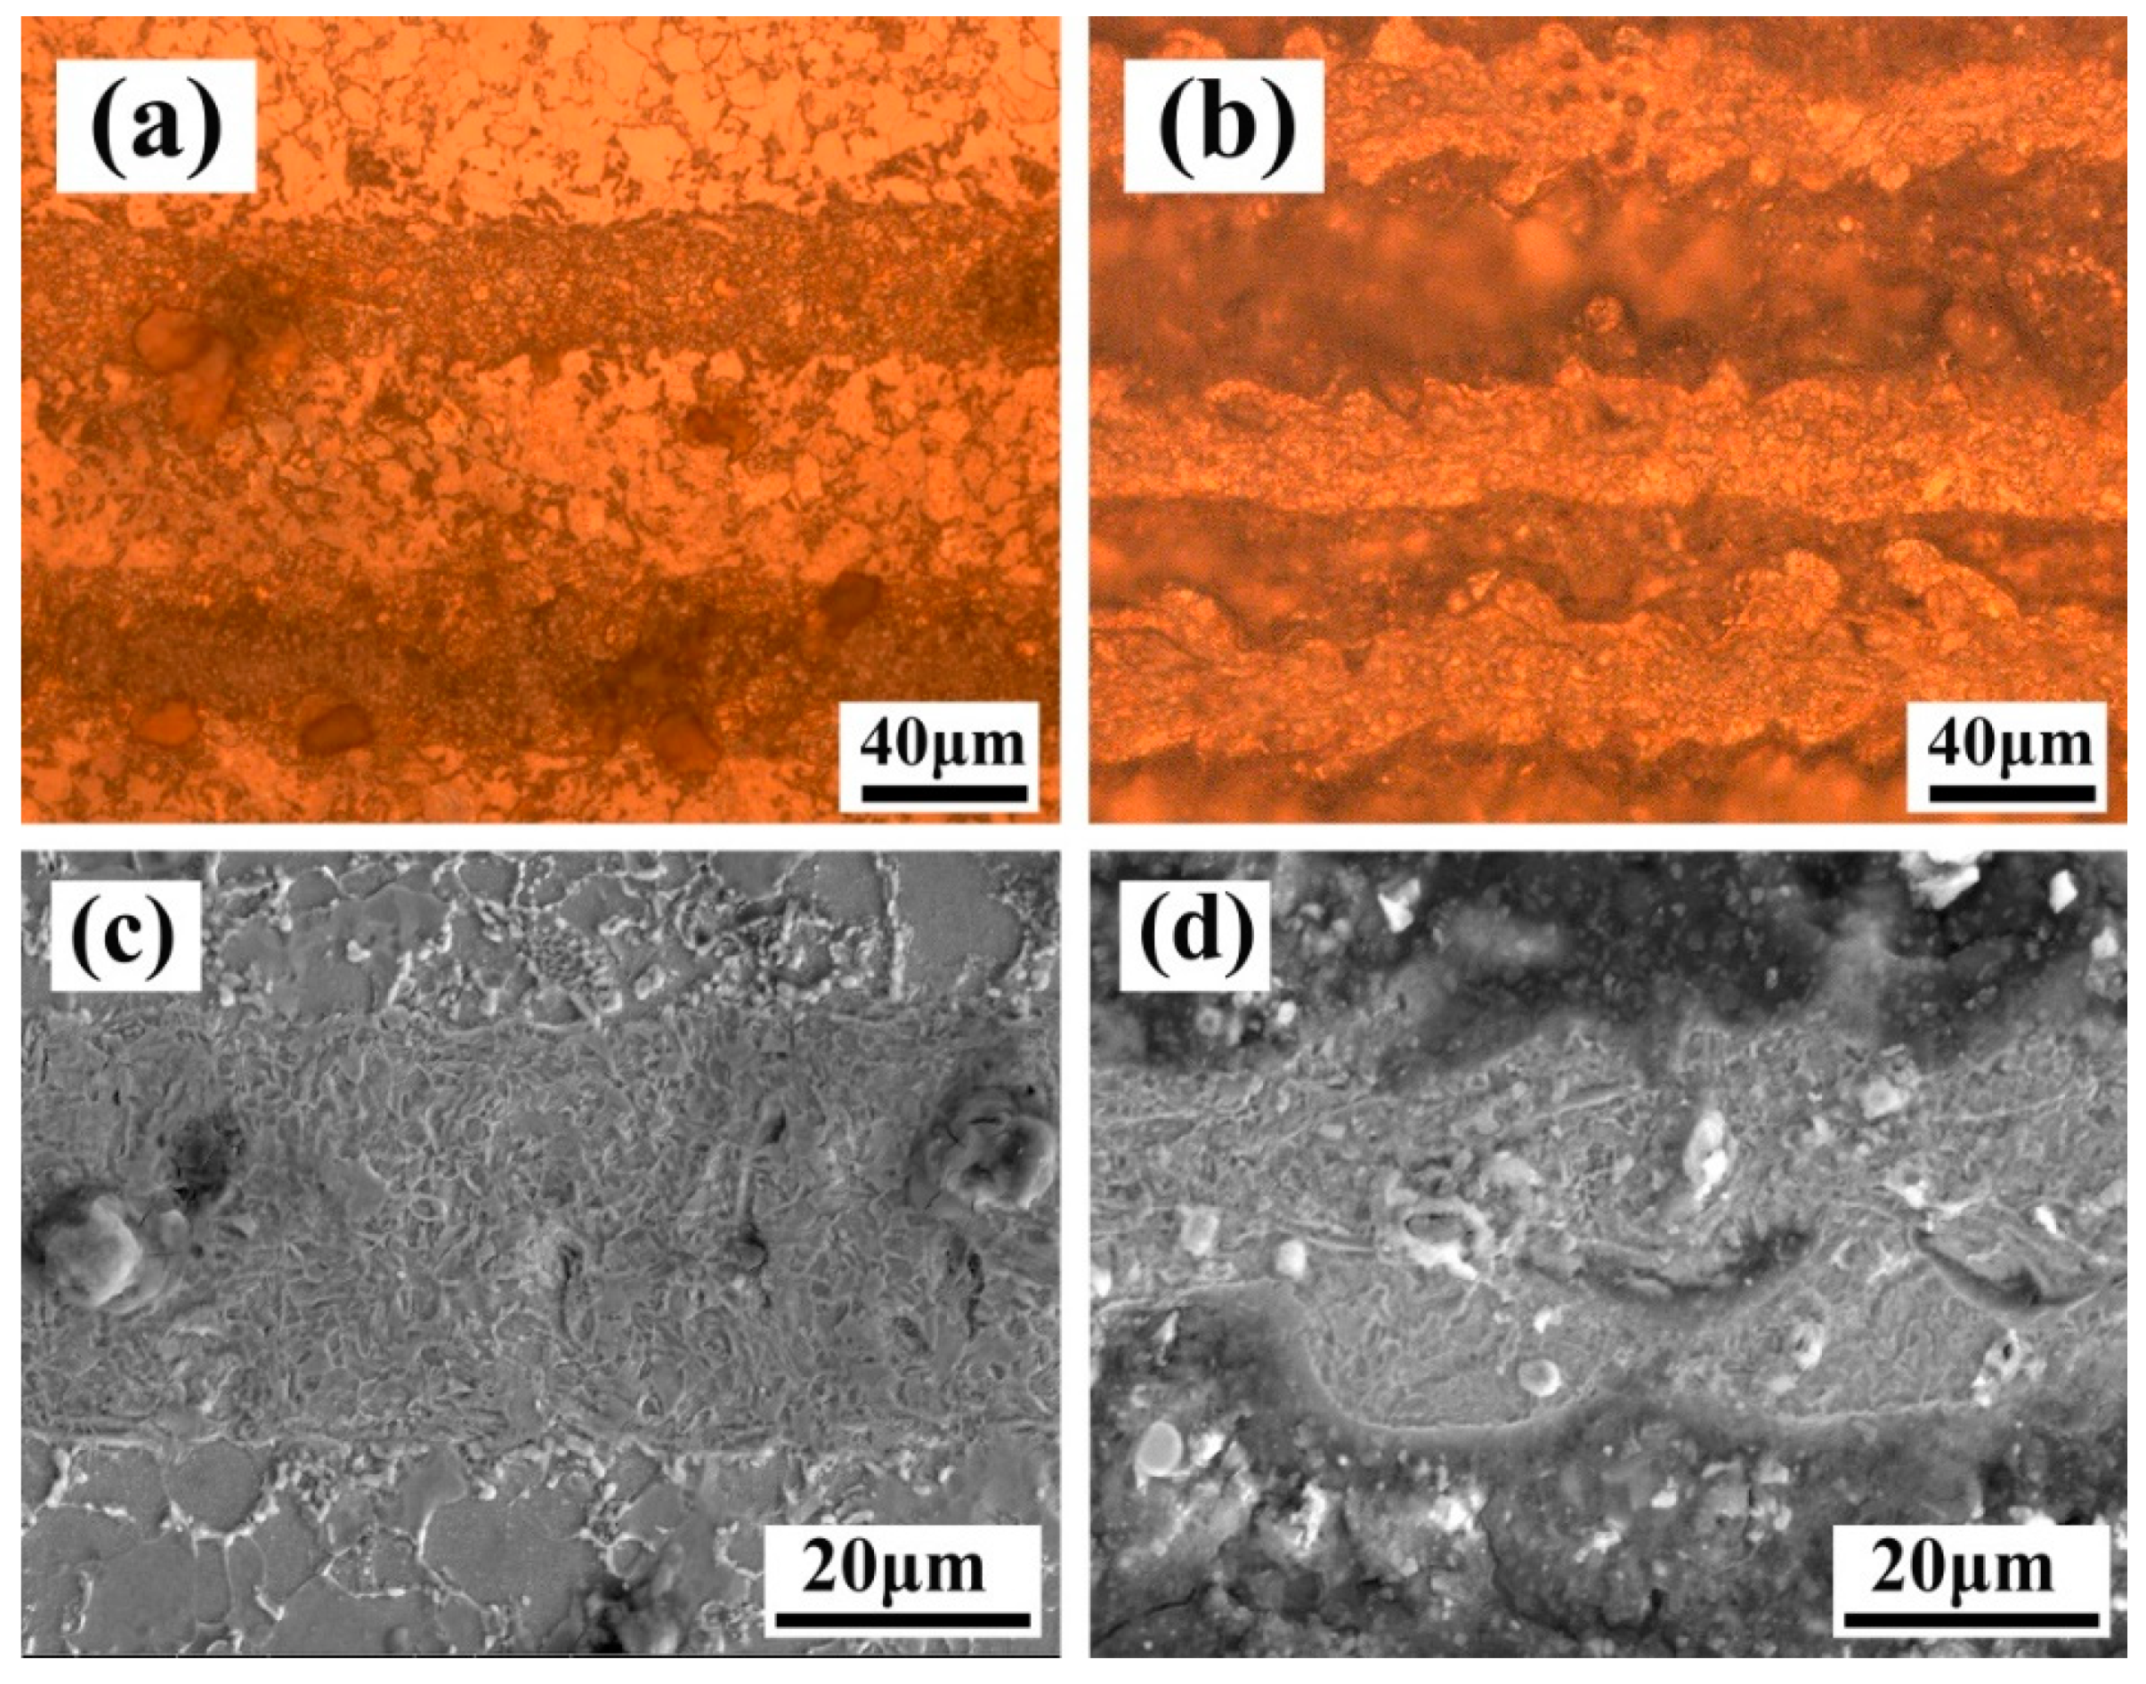
3.4. Microstructure of the Cleaned Region
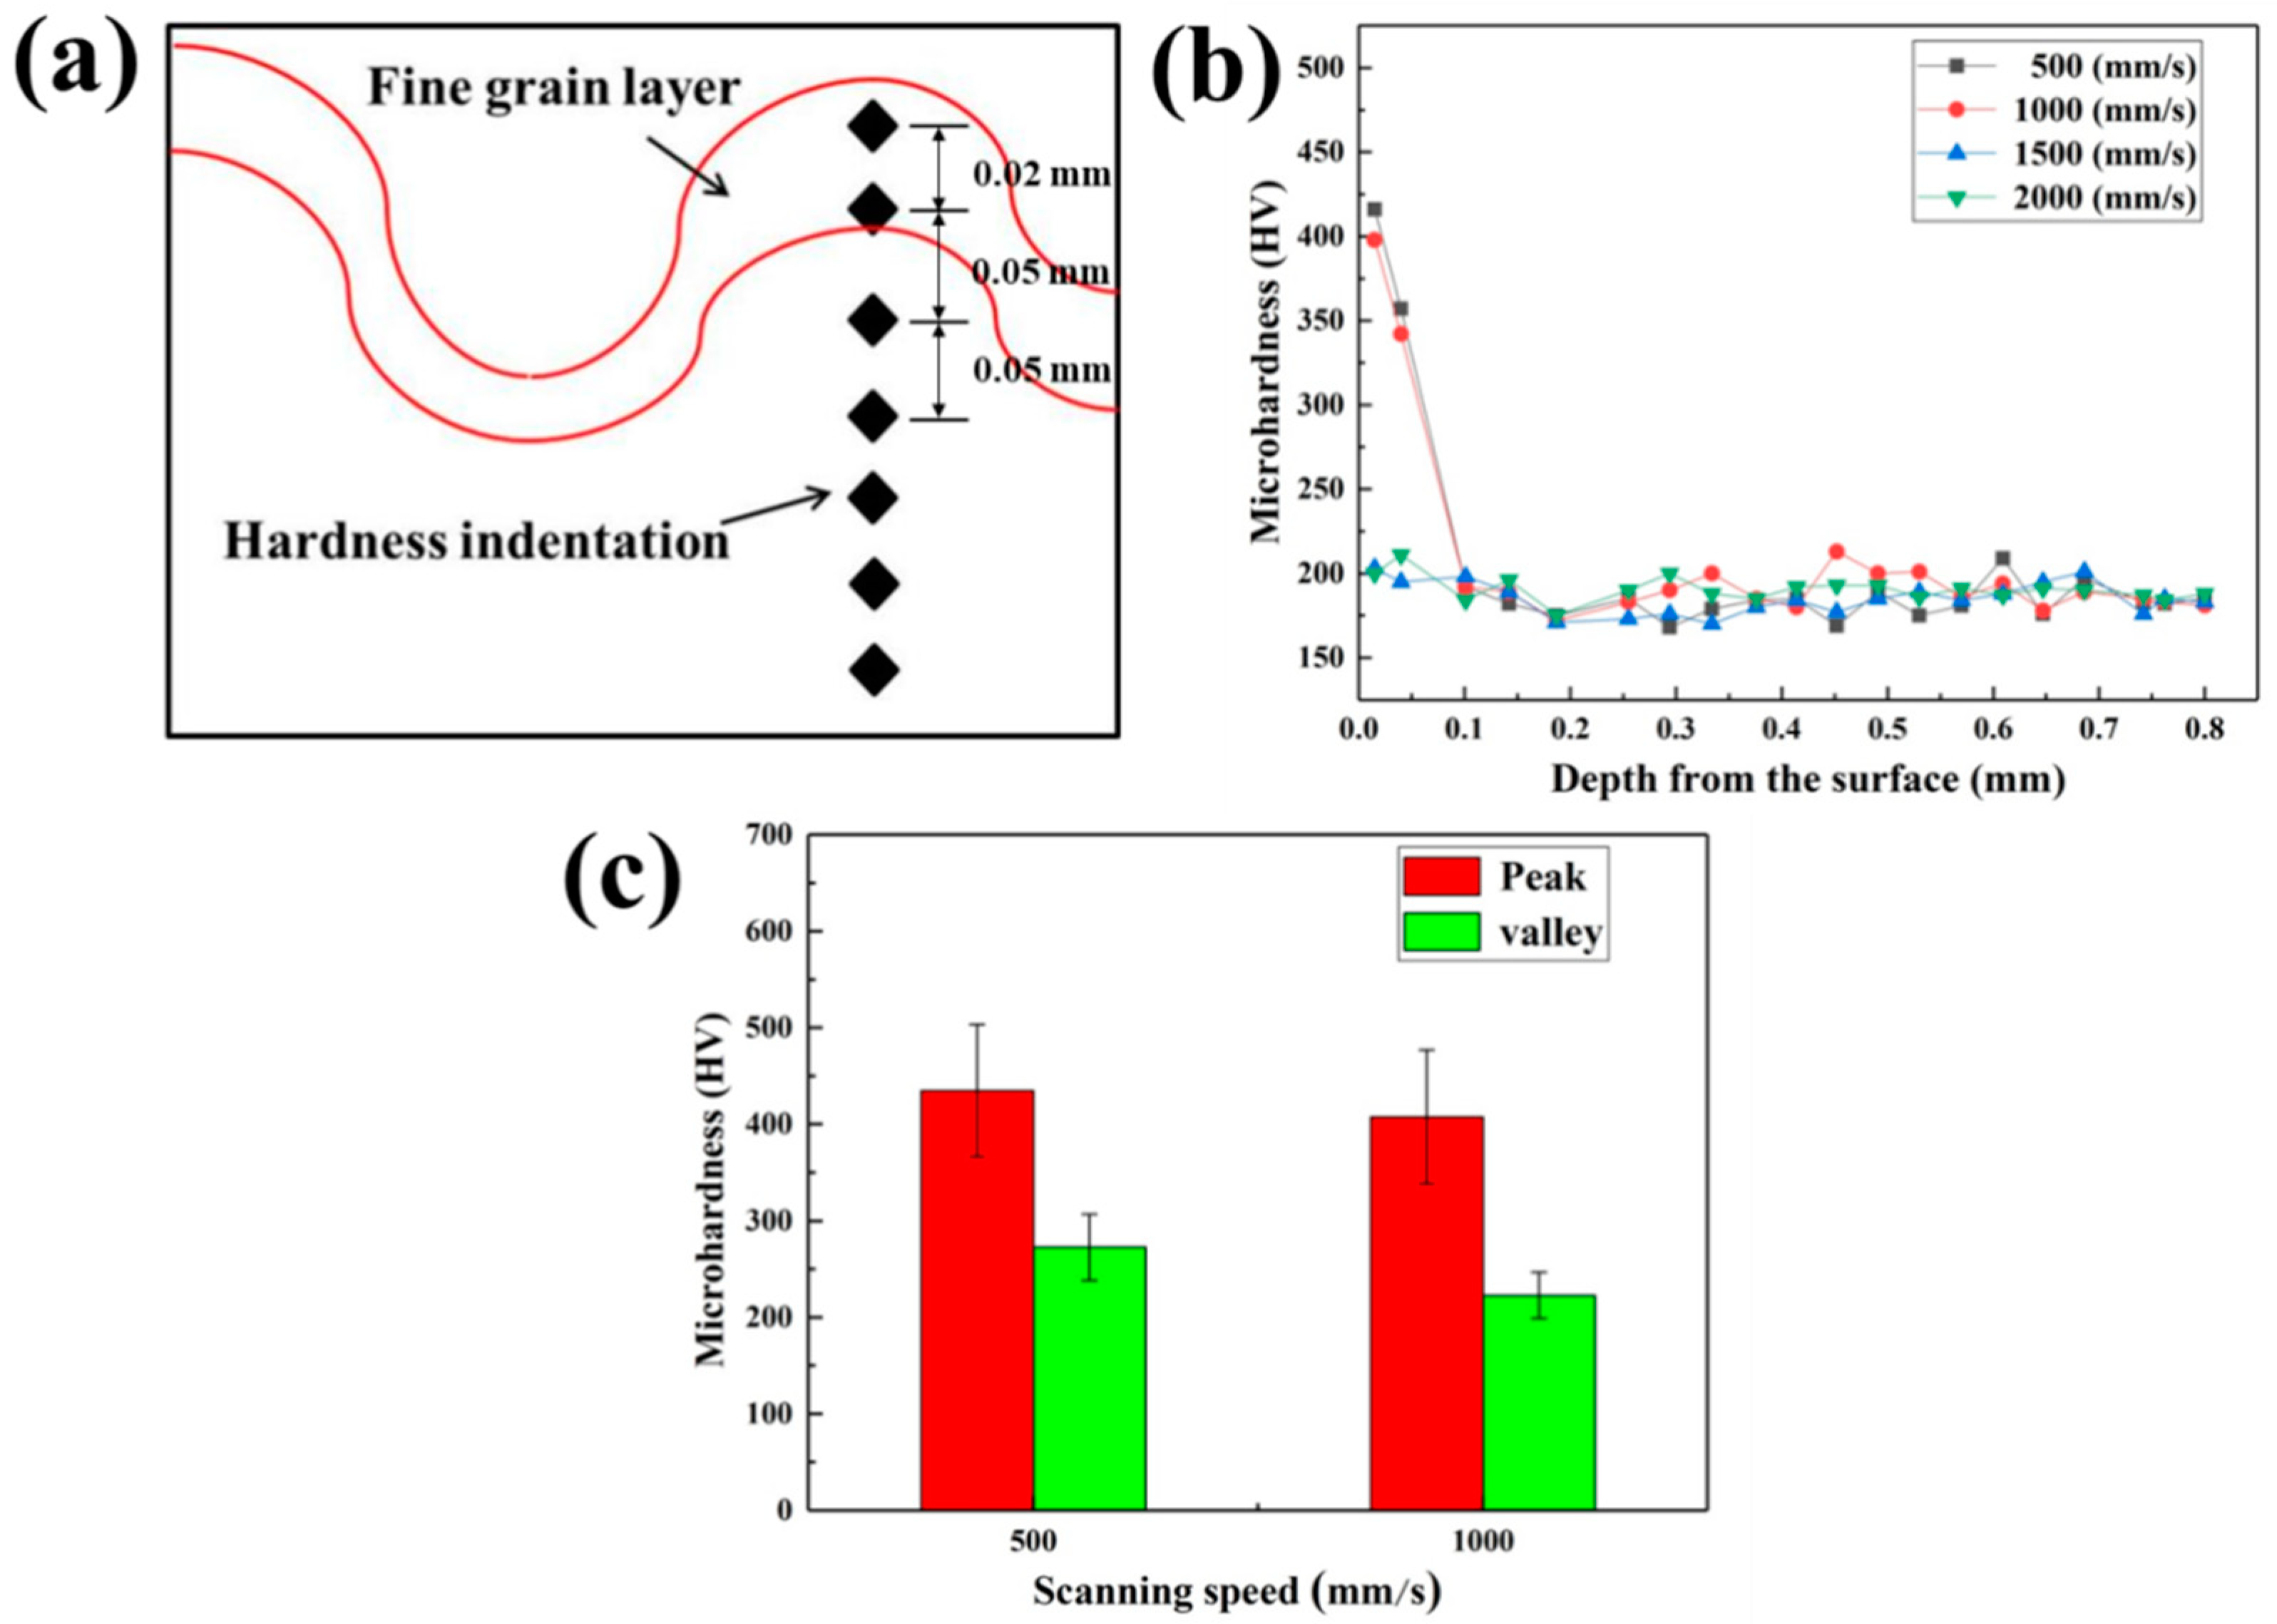
3.5. Hardness of the Fine Grain Layer after Cleaning
4. Conclusions
- (1)
- When the Y-moving speed was of 7 mm/s, the cleaned surface was damaged due to laser radiation of the relatively high energy at the X-scanning speeds of 500 mm/s and 1000 mm/s. Then, the content of Fe element on the cleaned surface increased to 89% and then decreased to about 80%. With increasing X-scanning speed from 500 mm/s up to 2000 mm/s, the roughness declined up to 0.5 μm and then had a little promotion.
- (2)
- When the X-scanning speed was equal to 1500 mm/s, the amount of the residual paint on the cleaned surface tended to increase with increasing Y-moving speed from 5 mm/s to 11 mm/s. This is because the action time of the laser radiation on the surface became short. Meanwhile, the content of Fe element on the cleaned surface had a tendency of firstly decreasing and then remaining constant. Moreover, the roughness reached 0.5 μm at a Y-moving speed of 7 mm/s.
- (3)
- Comprehensively, the cleaning effect of the surface paint could be better on the condition of a X-scanning speed of 1500 mm/s and a Y-moving speed of 7 mm/s during laser cleaning, since there was no damage, negligible residual paint, and the minimum roughness on the cleaned surface.
- (4)
- A fine grain layer appeared on the cleaned surface after laser cleaning at the X-scanning speeds of 500 mm/s and 1000 mm/s, and a Y-moving speed of 7 mm/s. The maximum hardness of the fine grain layer was two times higher than the base metal, more than 400 HV. Moreover, the hardness of the peak of the fine grain layer was larger than those at the valley.
Author Contributions
Funding
Acknowledgments
Conflicts of Interest
References
- Zhang, Y.; Long, B.; Meng, K.; Gohkman, A.; Zhang, Z. Diffusion bonding of Q345 steel to zirconium using an aluminum interlayer. J. Mater. Process. Tech. 2019, 275, 2–4. [Google Scholar] [CrossRef]
- Li, S.; Wang, Q.R.; Li, X.L.; Tian, J.B. Seismic performance of Y-Type eccentrically braced frames combined with high—strength steel based on performance—based seismic design. Struct. Des. Tall. Spec. 2020, 29, 4–6. [Google Scholar] [CrossRef]
- Lv, H.; Gou, G.; Fu, Z.; Gao, W. Stress corrosion property of 304 stainless steel and Q345 steel laser-mag hybrid welded joints. Int. J. Mod. Phys. B 2019, 34, 2040057. [Google Scholar] [CrossRef]
- Gerhard, S.; Werner, L. Industrial 2-kW TEA CO2 laser for paint stripping of aircraft. Proc. SPIE 1995, 2502, 57–62. [Google Scholar] [CrossRef]
- Gomes, V.; Dionísio, A.; Pozo-Antonio, J.S.; Rivas, T.; Ramil, A. Mechanical and laser cleaning of spray graffiti paints on a granite subjected to a SO2-rich atmosphere. Constr. Build. Mater 2018, 188, 621–632. [Google Scholar] [CrossRef]
- Feng, C.; Zhang, Y.; Liu, J.; Qian, Y.; Zhang, J.; Zhao, J.; Shi, F.; Bai, X. Optimized chemical cleaning procedure for enhancing photoemission from GaAs photocathode. Mat. Sci. Semicon. Proc. 2019, 91, 41–46. [Google Scholar] [CrossRef]
- Tangsopa, W.; Thongsri, J. Development of an industrial ultrasonic cleaning tank based on harmonic response analysis. Ultrasonics 2019, 91, 68–76. [Google Scholar] [CrossRef]
- Bañon, F.; Sambruno, A.; Batista, M.; Simonet, B.; Salguero, J. Surface Quality and Free Energy Evaluation of s275 Steel by Shot Blasting, Abrasive Water Jet Texturing and Laser Surface Texturing. Metals 2020, 10, 290. [Google Scholar] [CrossRef] [Green Version]
- Rudawska, A.; Danczak, I.; Müller, M.; Valasek, P. The Effect of Sandblasting on Surface Properties for Adhesion. Int. J. Adhes. 2016, 70, 176–190. [Google Scholar] [CrossRef]
- Harada, T.; Spence, S.; Margiolakis, A.; Deckoff-Jones, S.; Ploeger, R.; Shugar, A.N.; Hamm, J.; Dani, K.M.; Dani, A.R. Obtaining cross-sections of paint layers in cultural artifacts using femtosecond pulsed lasers. Materials 2017, 10, 107. [Google Scholar] [CrossRef] [Green Version]
- Chen, Y.; Deng, G.L.; Zhou, Q.; Feng, G. Acoustic signal monitoring in laser paint cleaning. Laser Phys. 2020, 30, 2–4. [Google Scholar] [CrossRef]
- Chen, G.X.; Kwee, T.J.; Tan, K.P.; Choo, Y.S.; Hong, M.H. Laser cleaning of steel for paint removal. Appl. Phys. A 2010, 101, 249–253. [Google Scholar] [CrossRef]
- Al-Rousan, R.Z.; AL-Tahat, M.F. Consequence of Surface Preparation Techniques on the Bond Behavior Between Concrete and CFRP Composites. Constr. Build. Mater. 2019, 212, 362–374. [Google Scholar] [CrossRef]
- Liu, X.; Du, D.; Mourou, G. Laser Ablation and Micromachining with Ultrashort Laser Pulses. IEEE J. Quantum Elect. 1997, 33, 1706–1716. [Google Scholar] [CrossRef]
- Ancona, A.; Carbone, G.; De Filippis, M.; Volpe, A.; Lugarà, P.M. Femtosecond laser full and partial texturing of steel surfaces to reduce friction in lubricated contact. Adv. Opt. Technol. 2014, 3, 539–547. [Google Scholar] [CrossRef]
- Rode, A.V.; Freeman, D.; Baldwin, K.G.H.; Wain, A.; Uteza, O.; Delaporte, P. Scanning the laser beam for ultrafast pulse laser cleaning of paint. Appl. Phys. A 2008, 93, 135–139. [Google Scholar] [CrossRef]
- Kumar, M.; Bhargava, P.; Biswas, A.K.; Sahu, S.; Mandloi, V.; Ittoop, M.O.; Khattak, B.Q.; Tiwari, M.K.; Kukreja, L.M. Epoxy-Paint stripping using TEA CO2 laser: Determination of threshold fluence and the process parameters. Opt. Laser Technol. 2013, 46, 29–36. [Google Scholar] [CrossRef]
- Zhao, H.; Qiao, Y.; Du, X.; Wang, S.; Liu, X. Laser cleaning performance and mechanism in stripping of polyacrylate resin paint. Appl. Phys. A 2020, 126, 10–14. [Google Scholar] [CrossRef]
- Barletta, M.; Gisario, A.; Tagliaferri, V. Advance in paint stripping from aluminum substrates. J. Mater. Process. Tech. 2006, 173, 232–239. [Google Scholar] [CrossRef]
- Watkins, K.G.; Chen, X.; Fujioka, T.; Matsunawa, A. Mechanisms of laser cleaning. Proc. SPIE 2000, 3888, 165–174. [Google Scholar] [CrossRef]
- Shamsujjoha, M. Effects of laser ablation coating removal (LACR) on a steel substrate: Part 1: Surface profile, microstructure, hardness, and adhesion. Surf. Coat. Technol. 2015, 281, 193–205. [Google Scholar] [CrossRef]
- Shi, T.; Wang, C.; Mi, G.; Yan, F. A study of microstructure and mechanical properties of aluminum alloy using laser cleaning. J. Manuf. Process. 2019, 42, 60–66. [Google Scholar] [CrossRef]
- Zhao, W.Q.; Liu, H.D.; Shen, X.W.; Wang, L.Z.; Mei, X.S. Percussion drilling hole in Cu, Al, Ti and Ni alloys using ultra-short pulsed laser ablation. Materials 2020, 13, 31. [Google Scholar] [CrossRef] [PubMed] [Green Version]
- Ma, M.; Wang, L.; Li, J.; Jia, X.; Zhou, Y. Investigation of the surface integrity of Q345 steel after Nd:YAG laser cleaning of oxidized mining parts. Coatings 2020, 10, 716. [Google Scholar] [CrossRef]
- Li, X.; Zhang, Q.; Zhou, X.; Zhu, D.; Liu, Q. The influence of nanosecond laser pulse energy density for paint removal. Optik 2018, 156, 841–846. [Google Scholar] [CrossRef]
- Gregorčič, H.P.; Conradi, M.; Hribar, L.; Hočevar, M. Long-term influence of laser-processing parameters on (Super) hydrophobicity development and stability of stainless-steel surfaces. Materials 2018, 11, 2240. [Google Scholar] [CrossRef] [Green Version]
- Zhang, Z.Y.; Zhang, J.Y.; Wang, Y.B.; Zhao, S.S.; Lin, X.C.; Li, X.Y. Removal of paint layer by layer using a 20 kHz 140 Ns quasi-continuous wave laser. Optik 2018, 174, 46–55. [Google Scholar] [CrossRef]
- Mahanty, S.; Gouthama. Surface modification of Al–Si alloy by excimer laser pulse processing. Mater. Chem. Phys. 2016, 173, 192–199. [Google Scholar] [CrossRef]
- Leone, C.; Papa, I.; Tagliaferri, F.; Lopresto, V. Investigation of CFRP laser milling using a 30W Q-switched Yb:YAG fiber laser: Effect of process parameters on removal mechanisms and HAZ formation. Compos. Part A Appl. Ence Manuf. 2013, 55, 129–142. [Google Scholar] [CrossRef]
- Vasant, J.A.; Gopi, G.; Jegaraj, J.J.R.; Kumar, K.R.; Oyyaravelu, R. Finite element simulation and experimental validation of laser assisted machining of Inconel 718. Mater. Today 2018, 5, 13637–13649. [Google Scholar] [CrossRef]
- Król, M.; Snopiński, P. Selective laser melting of 18NI-300 maraging steel. Materials 2020, 13, 4268. [Google Scholar] [CrossRef] [PubMed]
- Liu, K.K.; Hill, M.R. The effects of laser peening and shot peening on fretting fatigue in Ti–6Al–4V Coupons. Tribol. Int. 2009, 42, 1250–1262. [Google Scholar] [CrossRef]
- Montross, C.S.; Wei, T.; Ye, L.; Clark, G.; Mai, Y.W. Laser shock processing and its effects on microstructure and properties of metal alloys: A Review. Int. J. Fatigue 2002, 24, 1021–1036. [Google Scholar] [CrossRef]


| C | Si | Mn | P | S | Cr | Mo | Ni | Al | Fe |
|---|---|---|---|---|---|---|---|---|---|
| 0.21 | 0.12 | 0.96 | <0.0005 | 0.0026 | 0.03 | 0.01 | 0.02 | 0.04 | Bal. |
| Laser Main Parameters/Unit | Value |
|---|---|
| X-scanning speed/(mm/s) Y-moving speed/(mm/s) | 500, 1000, 1500, 2000 5, 7, 9, 11 |
| Average rated power/W | 100 |
| Single pulse energy/(mJ) | 2 |
| Repetition rate/(kHz) | 100 |
| Pulse width/(ns) | 400 |
| Spot size/(mm) | 0.6 |
Publisher’s Note: MDPI stays neutral with regard to jurisdictional claims in published maps and institutional affiliations. |
© 2020 by the authors. Licensee MDPI, Basel, Switzerland. This article is an open access article distributed under the terms and conditions of the Creative Commons Attribution (CC BY) license (http://creativecommons.org/licenses/by/4.0/).
Share and Cite
Li, X.; Wang, D.; Gao, J.; Zhang, W.; Li, C.; Wang, N.; Lei, Y. Influence of ns-Laser Cleaning Parameters on the Removal of the Painted Layer and Selected Properties of the Base Metal. Materials 2020, 13, 5363. https://doi.org/10.3390/ma13235363
Li X, Wang D, Gao J, Zhang W, Li C, Wang N, Lei Y. Influence of ns-Laser Cleaning Parameters on the Removal of the Painted Layer and Selected Properties of the Base Metal. Materials. 2020; 13(23):5363. https://doi.org/10.3390/ma13235363
Chicago/Turabian StyleLi, Xinyan, Dan Wang, Juming Gao, Weiwei Zhang, Canyang Li, Nianzheng Wang, and Yucheng Lei. 2020. "Influence of ns-Laser Cleaning Parameters on the Removal of the Painted Layer and Selected Properties of the Base Metal" Materials 13, no. 23: 5363. https://doi.org/10.3390/ma13235363