Thermochromism of Highly Luminescent Photopolymer Flexible Films Based On Eu (III) Salts Confined in Polysulfone

 , , and
Abstract
:1. Introduction
2. Materials and Methods
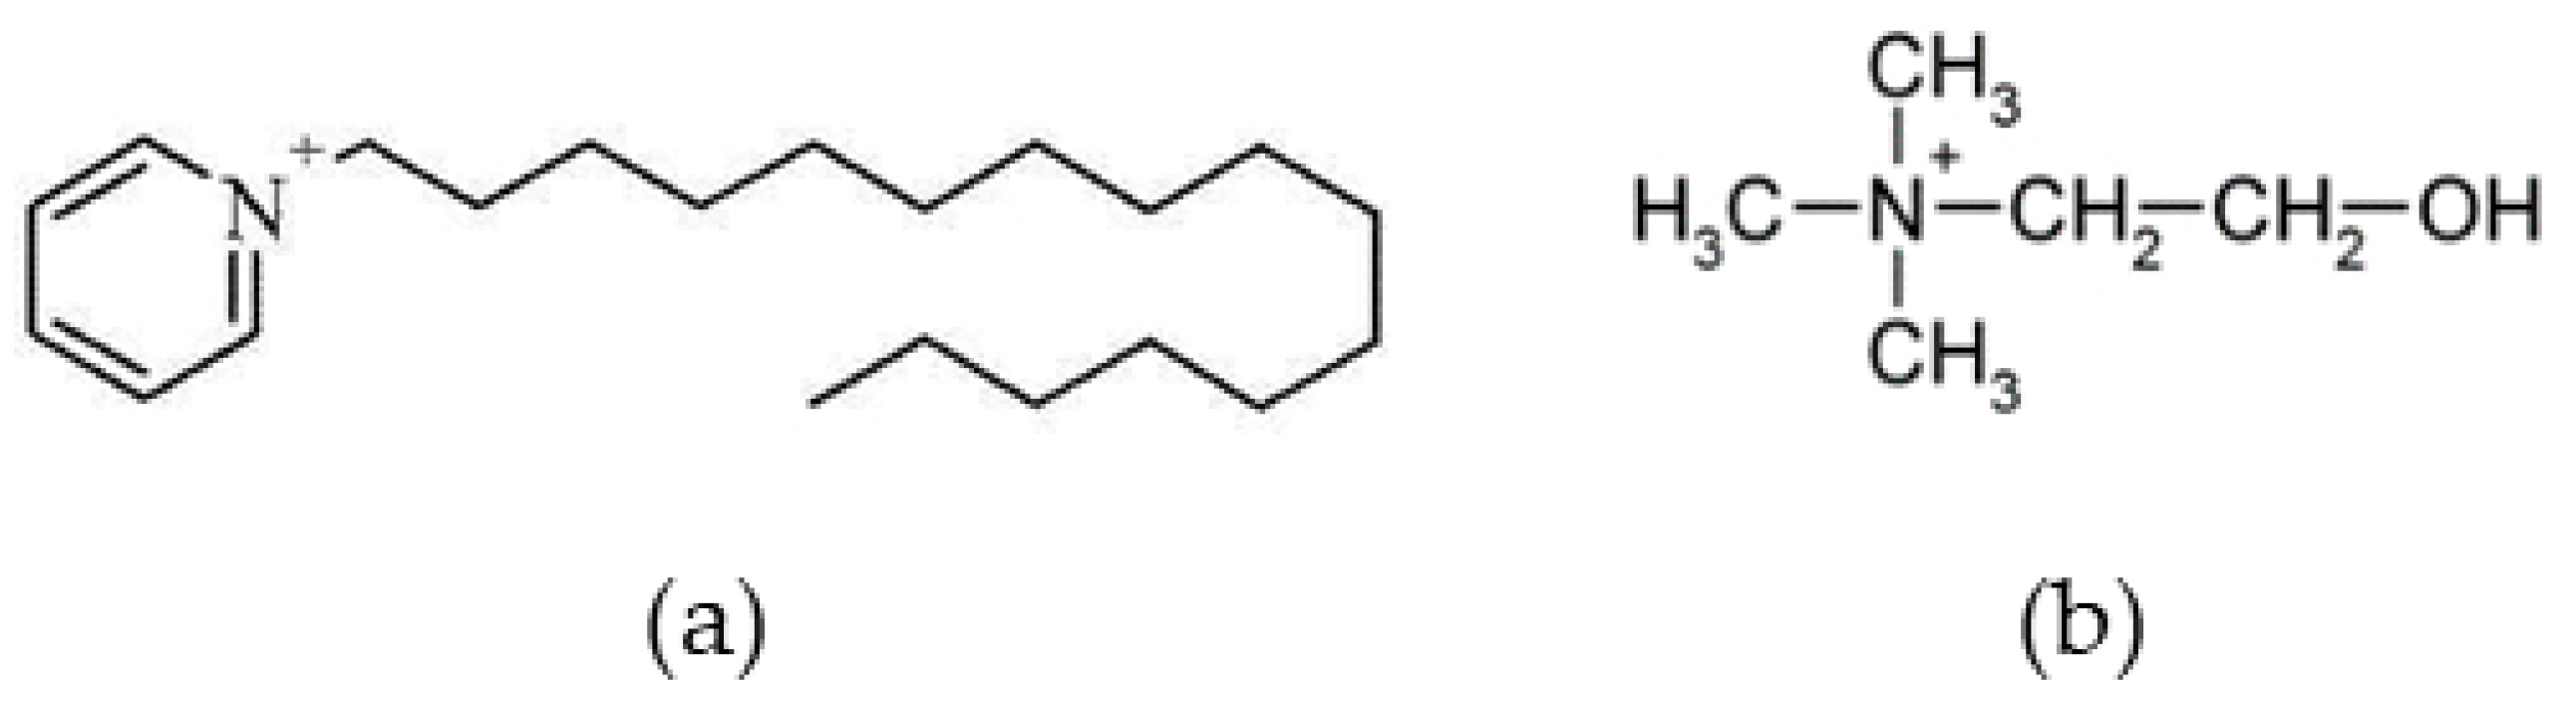
2.1. Synthesis
2.2. Methods
3. Results
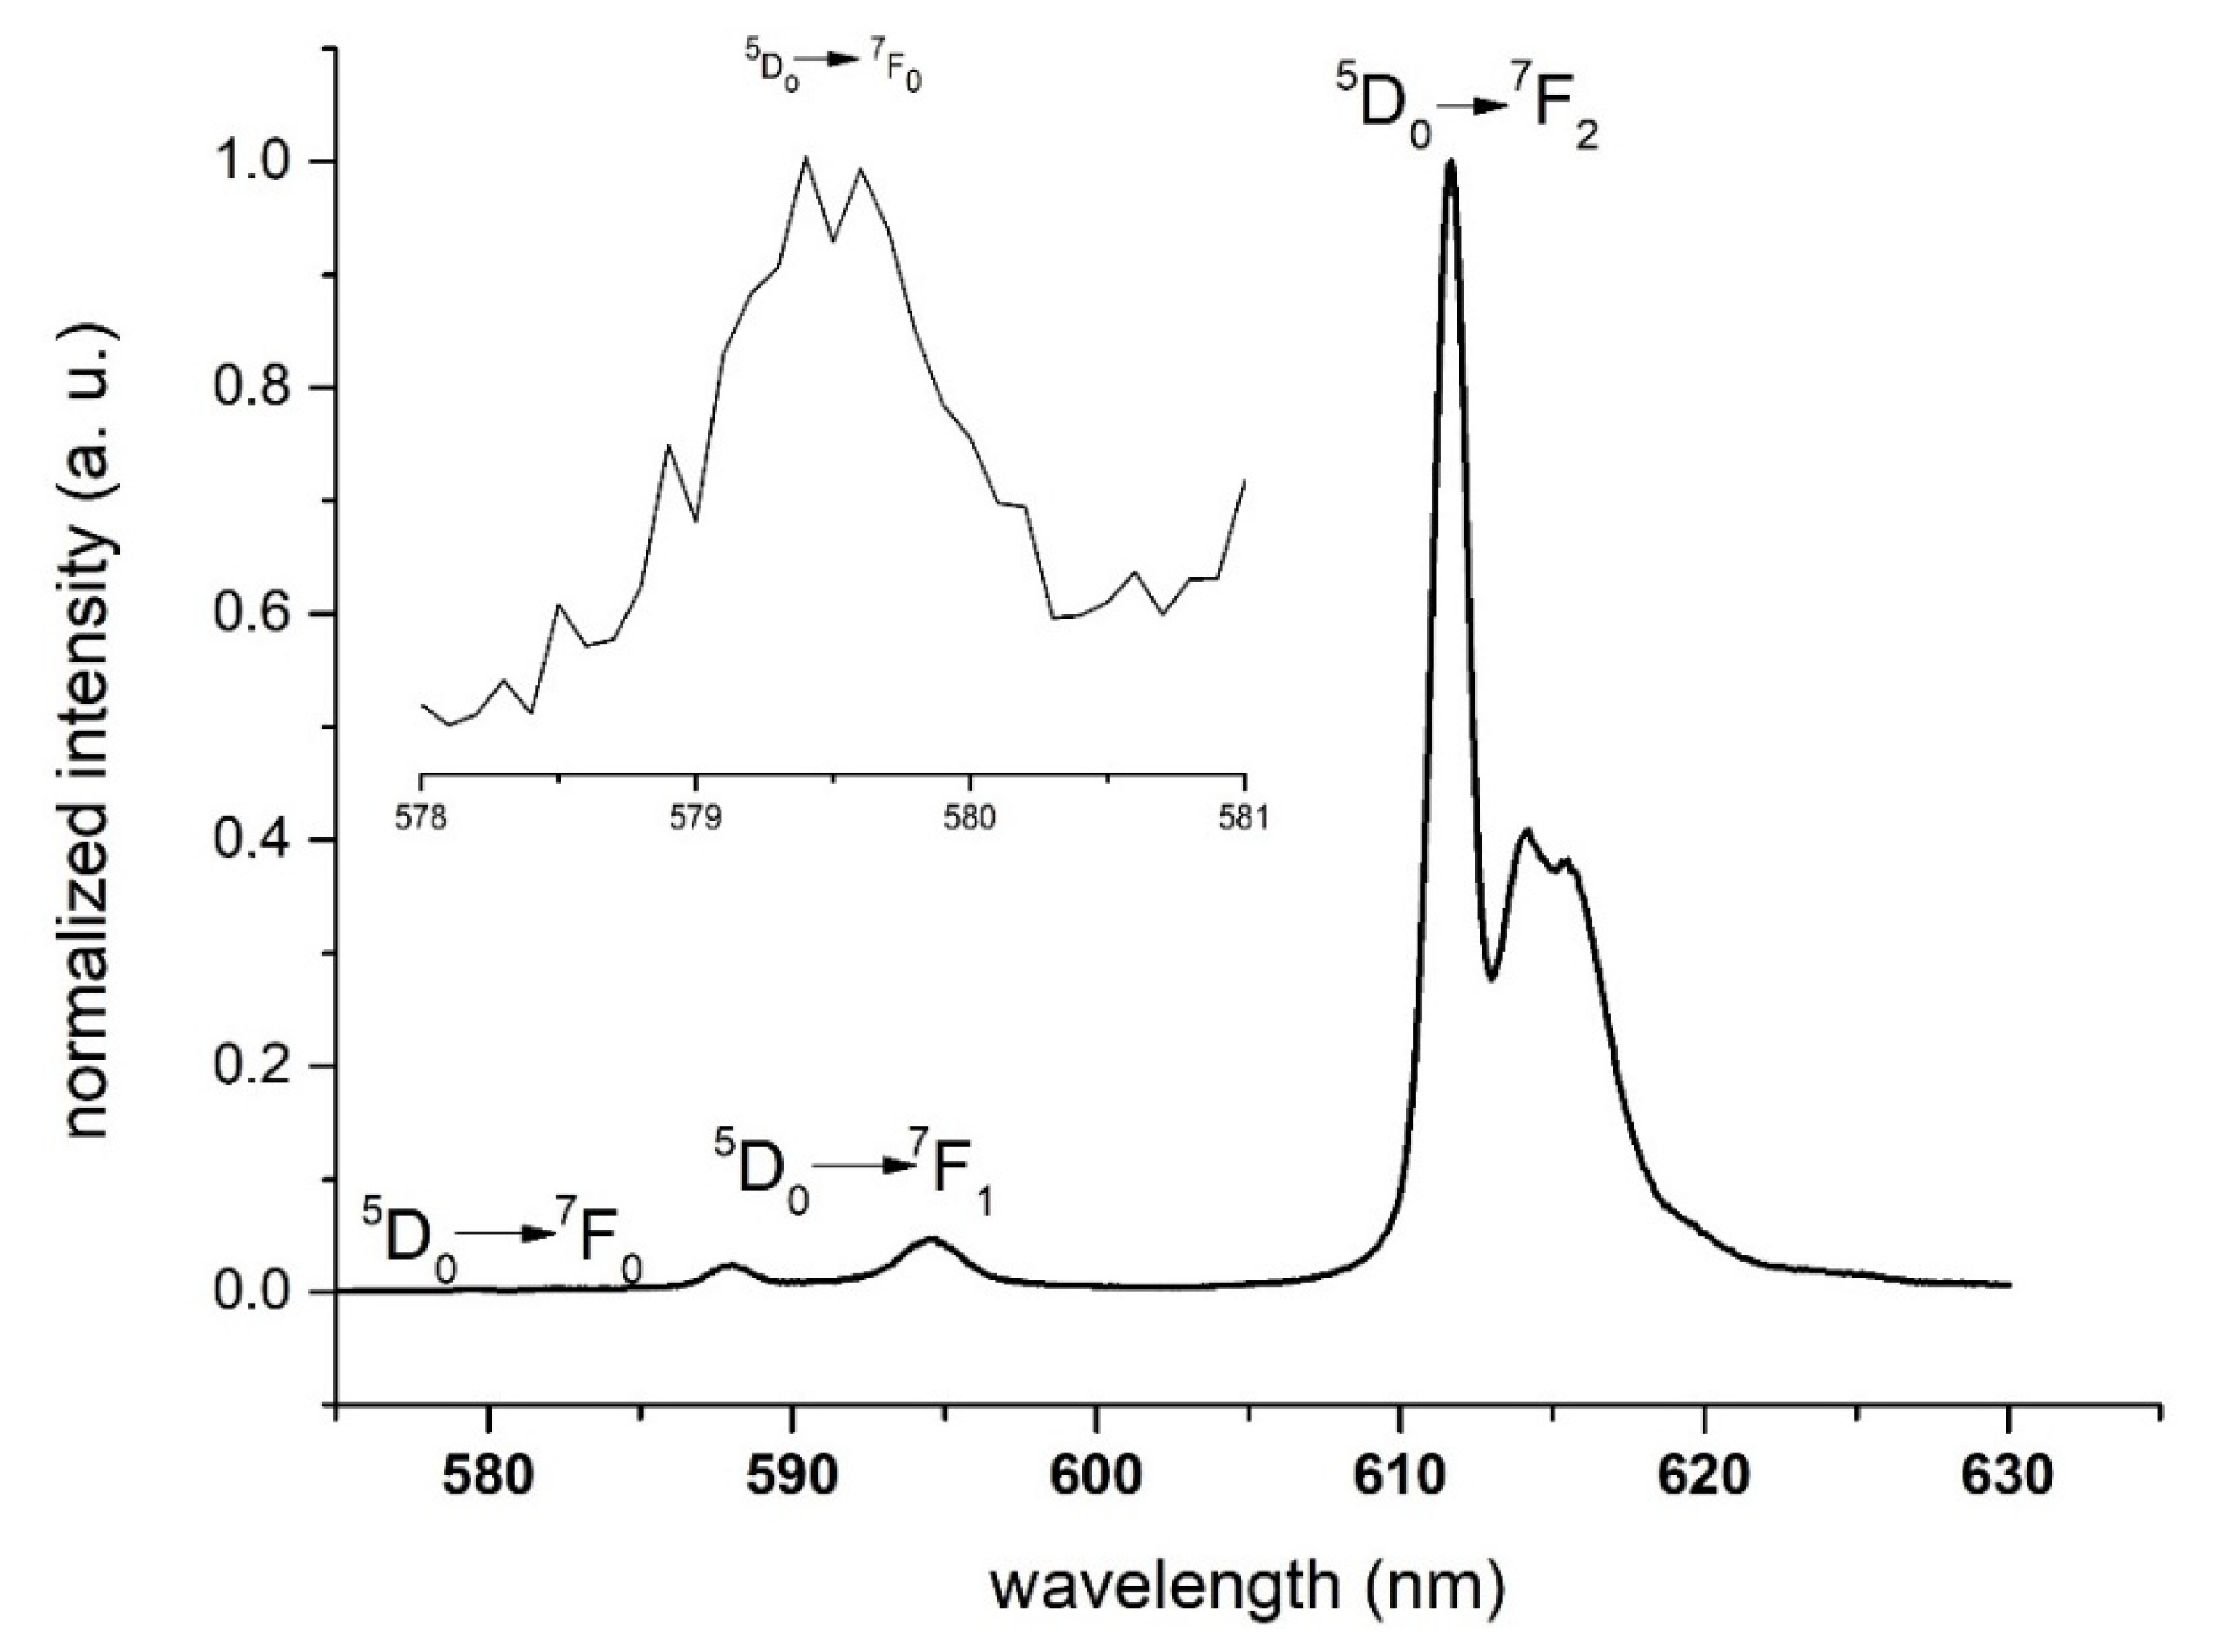
3.1. Luminescence of [Eu(fod)4]− as a Function of the Counter-Cation and Temperature in the Solid State
3.1.1. Cation Effect
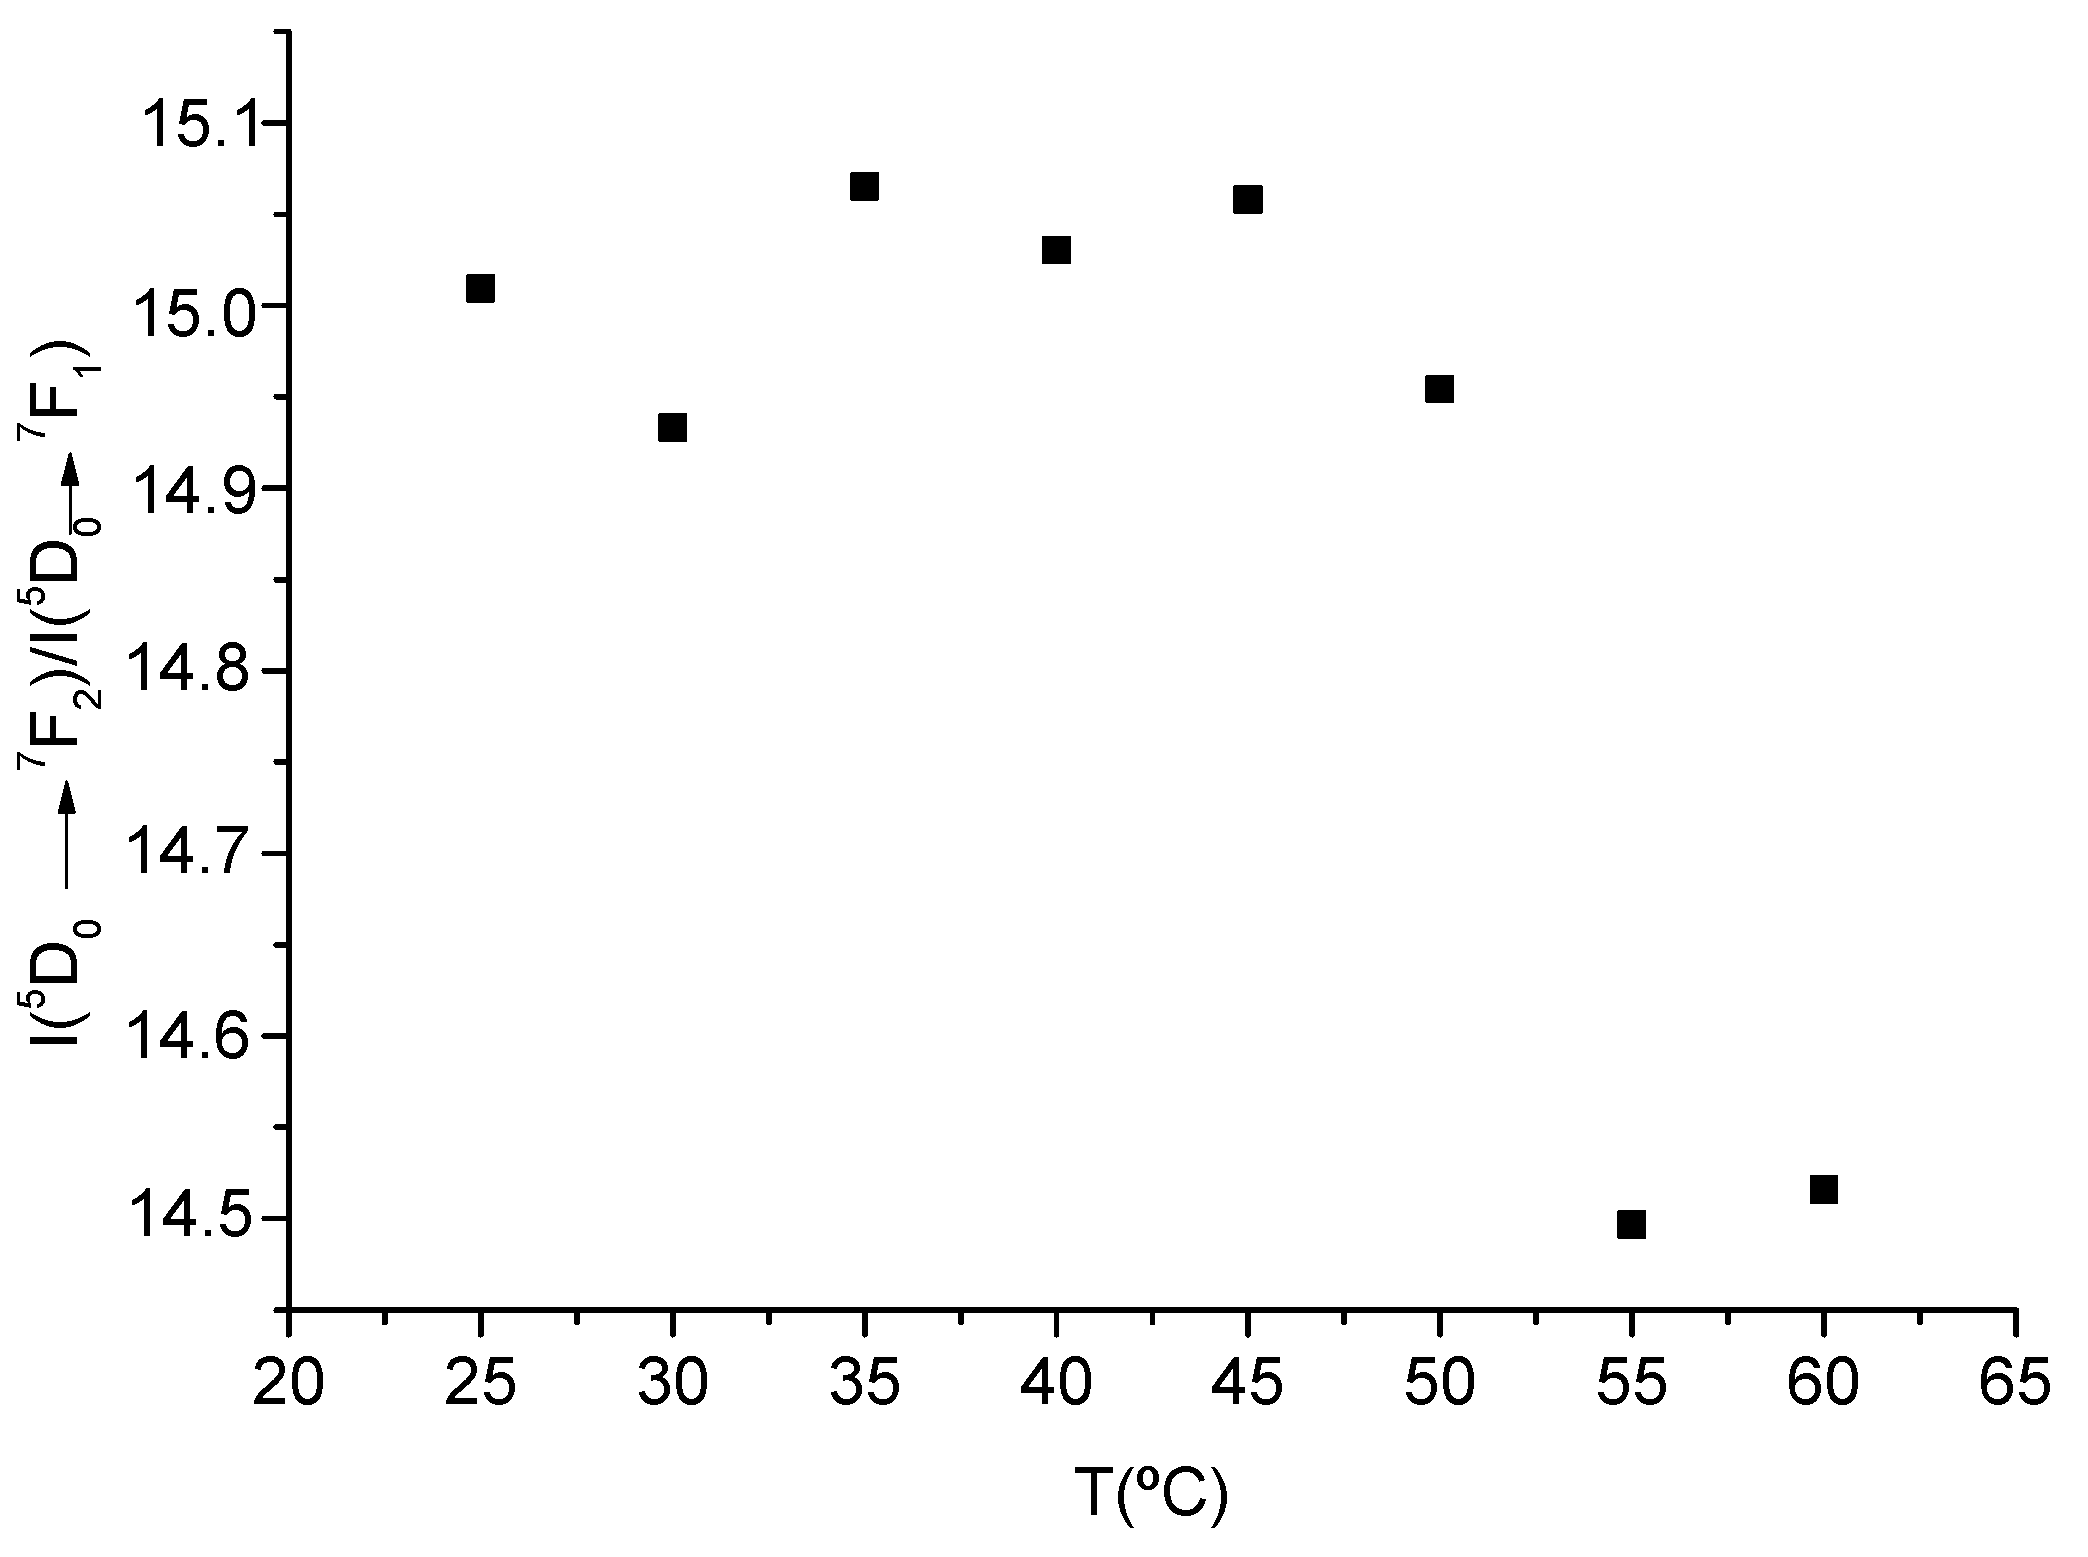
3.1.2. Temperature Effect
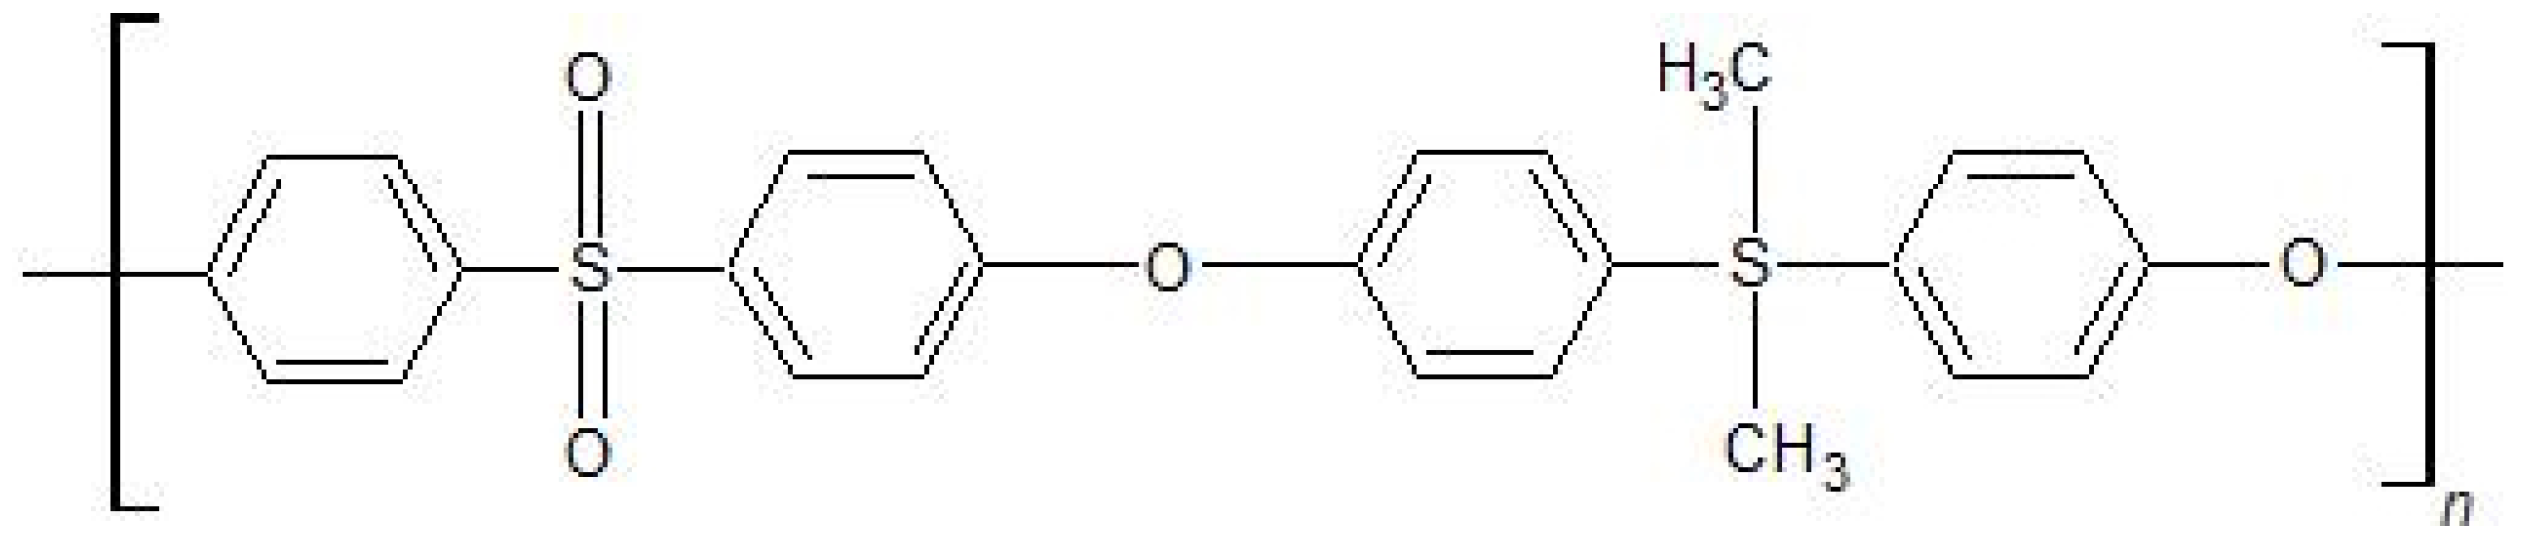
3.2. Characterization of 1/PSU and [Chol][Eu(fod)4]/PSU with 10% (w/w) of the Complex
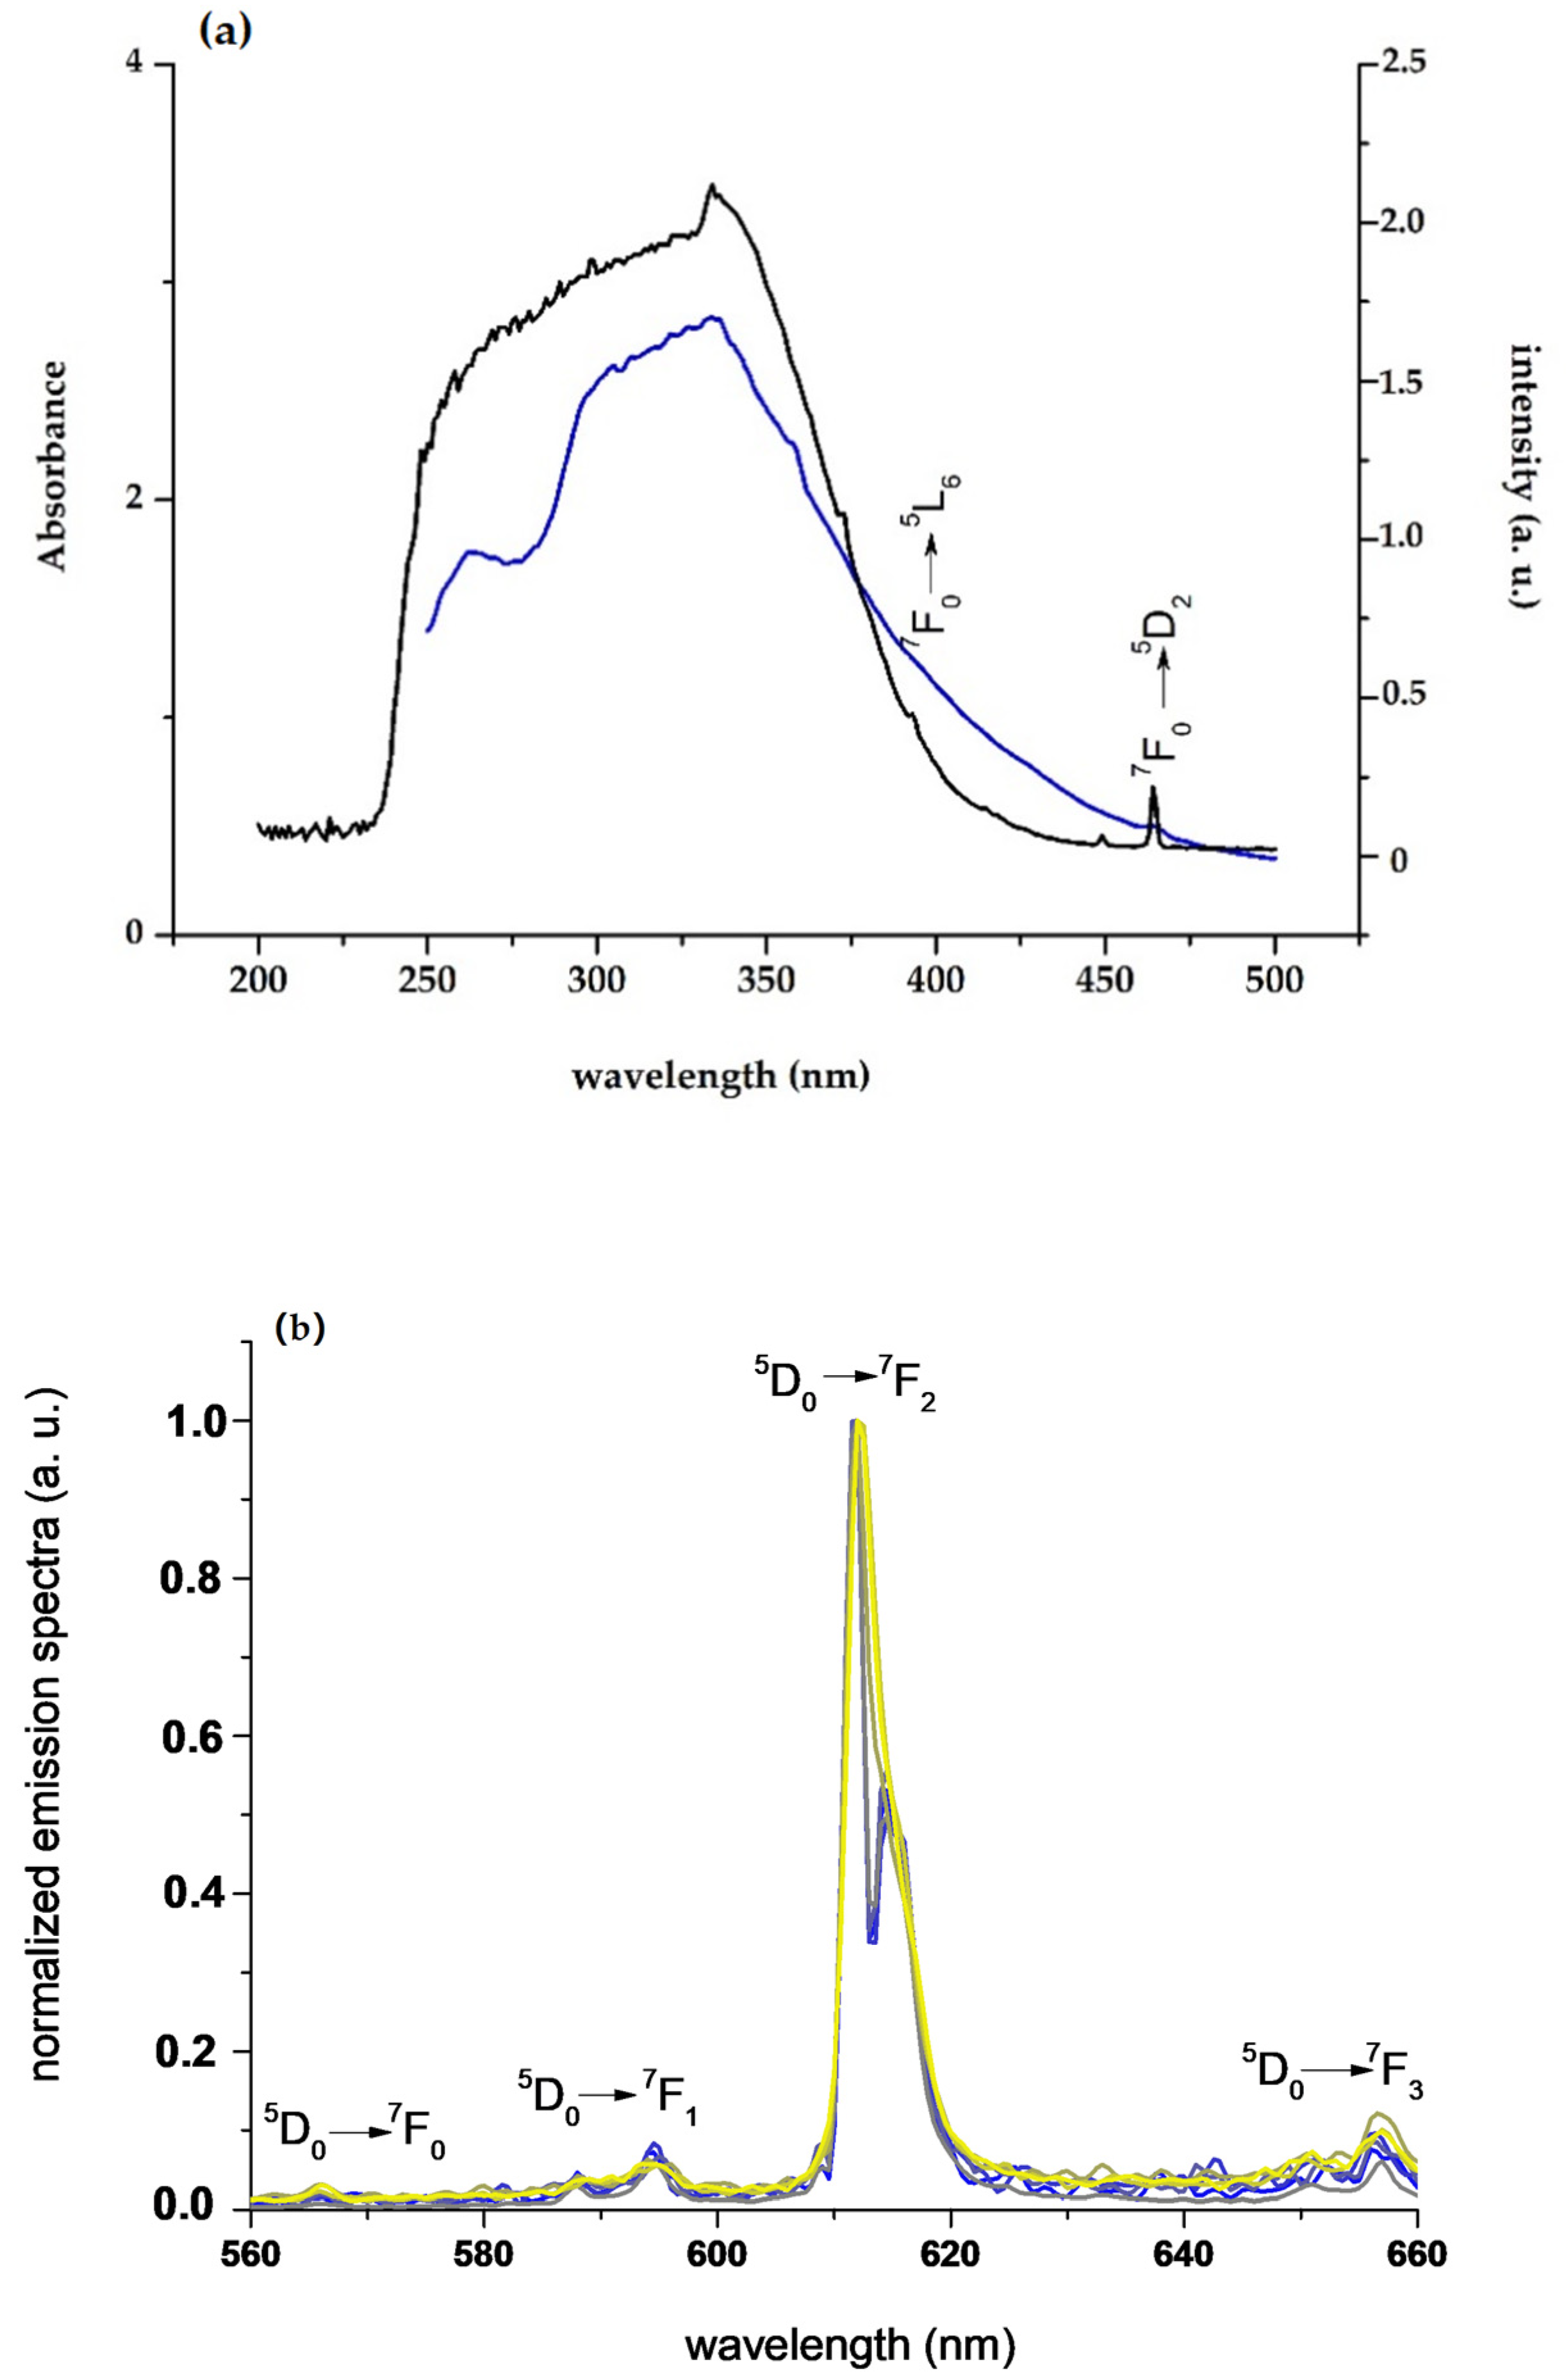
3.2.1. Photophysical Characterization
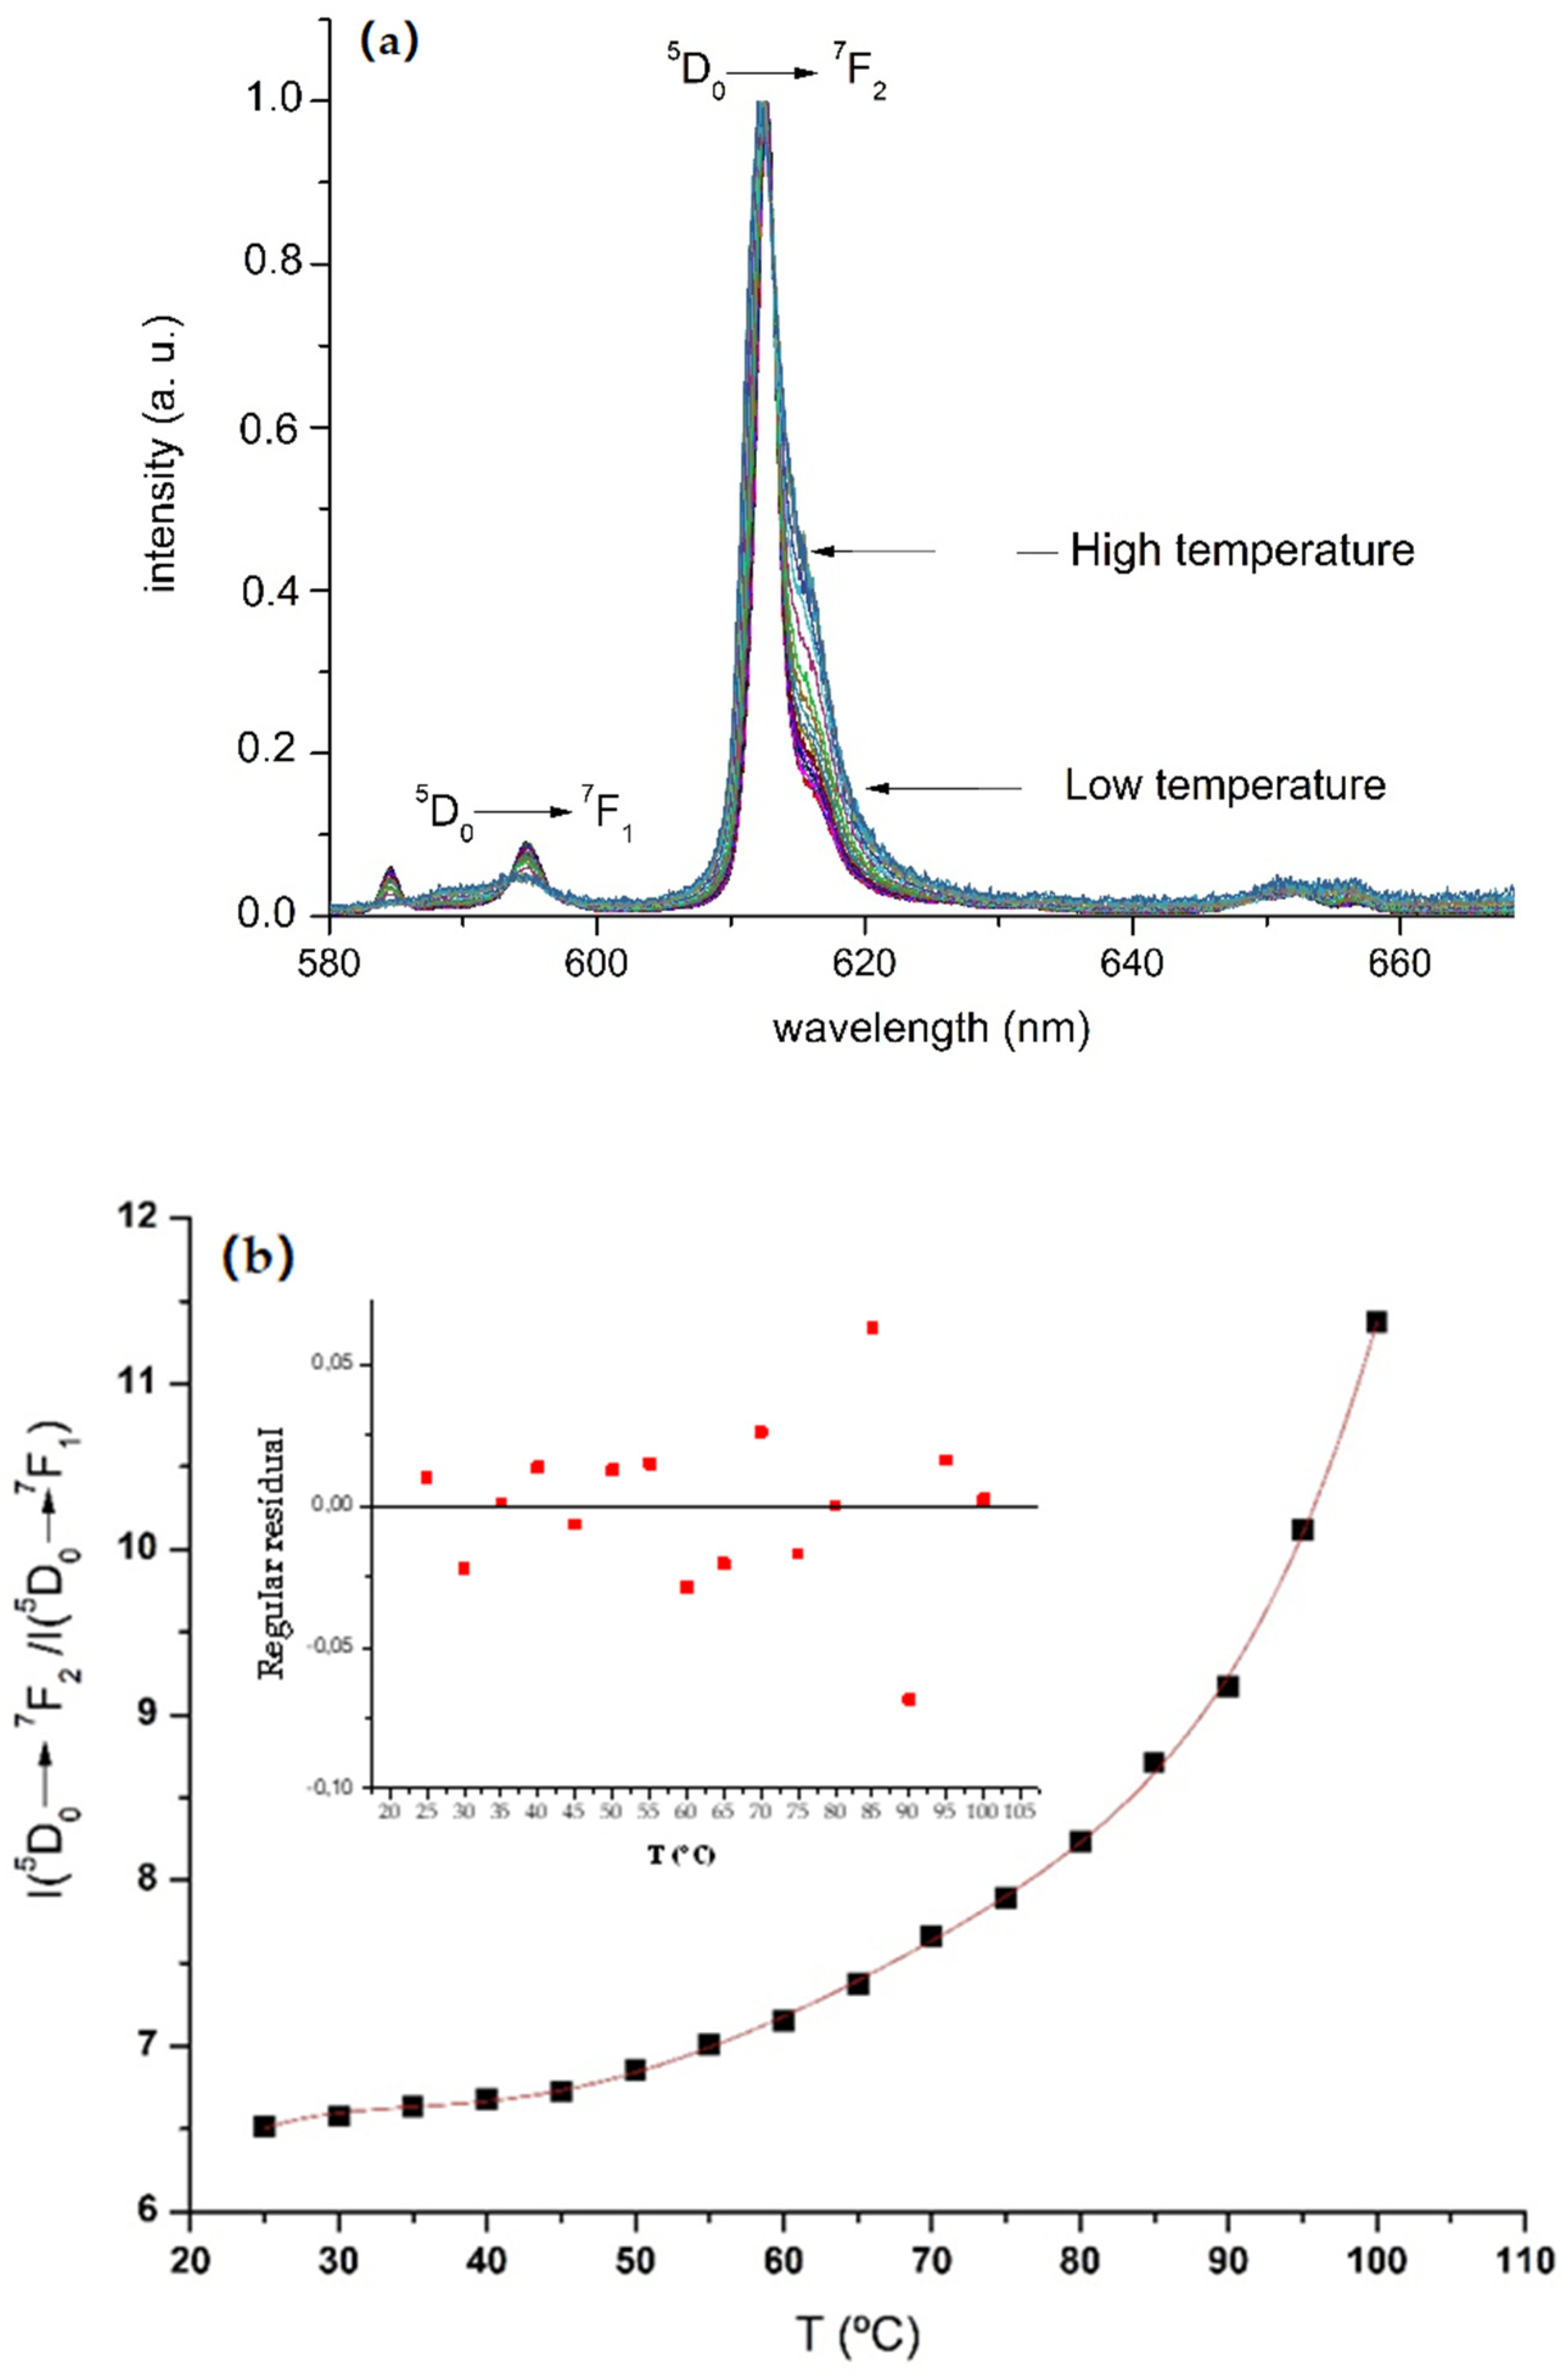
3.2.2. Thermochromism with Temperature-Responsive Ratiometric Behavior of 1/PSU and [Chol][Eu(fod)4]/PSU
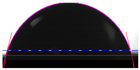
3.2.3. Images of 1/PSU and [Chol][Eu(fod)4]/PSU 10% (w/w)
4. Discussion
5. Conclusions
Supplementary Materials
Author Contributions
Funding
Conflicts of Interest
References
- Bednarkiewicz, A.; Marciniak, L.; Carlos, L.D.; Jaque, D. Standardizing luminescence nanothermometry for biomedical applications. Nanoscale 2020, 12, 14405–14421. [Google Scholar] [CrossRef] [PubMed]
- Brites, C.D.S.; Balabhadra, S.; Carlos, L.D. Lanthanide-Based Thermometers: At the Cutting-Edge of Luminescence Thermometry. Adv. Opt. Mater. 2018, 7, 1801239. [Google Scholar] [CrossRef] [Green Version]
- Kobayashi, H.; Ogawa, M.; Alford, R.; Choyke, P.L.; Urano, Y. New Strategies for Fluorescent Probe Design in Medical Diagnostic Imaging. Chem. Rev. 2010, 110, 2620–2640. [Google Scholar] [CrossRef] [PubMed] [Green Version]
- Jaque, D.; del Rosal, B.; Rodriguez, E.M.; Maestro, L.M.; Haro-Gonzalez, P.; Sole, J.G. Fluorescent nanothermometers for intracellular thermal sensing. Nanomedicine 2014, 9, 1047–1062. [Google Scholar] [CrossRef] [PubMed]
- Weaver, J.B. Bioimaging: Hot nanoparticles light up cancer. Nat. Nanotechnol 2010, 5, 630–631. [Google Scholar] [CrossRef]
- Liang, Z.; Qin, F.; Zheng, Y.; Zhang, Z.; Cao, W. Noncontact thermometry based on downconversion luminescence from Eu3+ doped LiNbO3 single crystal. Sens. Actuator. A Phys. 2016, 238, 215–219. [Google Scholar] [CrossRef]
- Ðačanin, L.R.; Dramićanin, M.D.; Lukić-Petrović, S.R.; Petrović, D.M.; Nikolić, M.G. Eu3+ doped YNbO4 phosphor properties for fluorescence thermometry. Radiat. Meas. 2013, 56, 143–146. [Google Scholar] [CrossRef]
- Nikolić, M.G.; Al-Juboori, A.Z.; Dordević, V.; Dramićanin, M.D. Temperature luminescence properties of Eu3+-doped Gd2O3 phosphors. Phys. Scr. 2013, T157, 014056. [Google Scholar] [CrossRef]
- Ćirić, A.; Stojadinović, S.; Dramićanin, M.D. Luminescence intensity ratio thermometry and judd-ofelt analysis of TiO2:Eu3+. Opt. Mater. 2018, 85, 261–266. [Google Scholar] [CrossRef]
- Nikolić, M.G.; Jovanović, D.J.; Dramićanin, M.D. Temperature dependence of emission and lifetime in Eu3+- and Dy3+-doped GdVO4. Appl. Opt. 2013, 52, 1716–1724. [Google Scholar] [CrossRef]
- Nikolić, M.G.; Lojpur, V.; Antić, Ž.; Dramićanin, M.D. Thermographic properties of a Eu3+-doped (Y0.75Gd0.25)2O3 nanophosphor under UV and x-ray excitation. Phys. Scr. 2013, 87, 055703. [Google Scholar] [CrossRef]
- Meert, K.W.; Morozov, V.A.; Abakumov, A.M.; Hadermann, J.; Poelman, D.; Smet, P.F. Energy transfer in Eu3+ doped scheelites: Use as thermographic phosphor. Opt. Express 2014, 22, A961–A974. [Google Scholar] [CrossRef] [PubMed]
- Lojpur, V.; Ćulubrk, S.; Medić, M.; Dramicanin, M. Luminescence properties of Eu3+ doped YBO3 for temperature sensing. J. Lumin. 2016, 170, 467. [Google Scholar] [CrossRef]
- Monteiro, B.; Outis, M.; Cruz, H.; Leal, J.P.; Laia, C.A.T.; Pereira, C.C.L. A thermochromic europium(III) room temperature ionic liquid with thermally activated anion-cation interactions. Chem. Commun. 2017, 53, 850–853. [Google Scholar] [CrossRef] [PubMed]
- Adati, R.D.; Monteiro, J.H.S.K.; Cardoso, L.P.; de Oliveira, D.H.; Jafelicci Jr., M.; Davolos, M.R. The Influence of Different Ammonium Cations on the Optical Properties of Tetrakis GdIII and EuIII Complexes. J. Braz. Chem. Soc. 2019, 30, 1707–1716. [Google Scholar] [CrossRef]
- Lyszczeka, R.; Gil, M.; Głuchowska, H.; Podkościelna, B.; Lipke, A.; Mergo, P. Hybrid materials based on PEGDMA matrix and europium (III) carboxylates-thermal and luminescent investigations. Eur. Polym. J. 2018, 106, 318–328. [Google Scholar] [CrossRef]
- Yang, P.; Zhang, S.; Chen, X.; Liu, X.; Wang, Z.; Li, Y. Recent developments in polydopamine fluorescent nanomaterials. Mater. Horiz. 2020, 7, 746–761. [Google Scholar] [CrossRef]
- Aguiar, F.P.; Costa, I.F.; Espínola, J.G.P.; Faustino, W.M.; Moura, J.L.; Brito, H.F.; Paolini, T.B.; Felinto, M.C.F.C.; Teotonio, E.E.S. Luminescent hybrid materials functionalized with lanthanide ethylenodiaminotetraacetate complexes containing β-diketonate as antenna ligands. J. Lumin. 2016, 170, 538–546. [Google Scholar] [CrossRef]
- Leyre, S.; Coutino-Gonzalez, E.; Joos, J.J.; Ryckaert, J.; Meuret, Y.; Poelman, D.; Smet, P.F.; Durinck, G.; Hofkens, J.; Deconinck, G.; et al. Absolute determination of photoluminescence quantum efficiency using an integrating sphere setup. Rev. Sci. Instrum. 2014, 85, 123115. [Google Scholar] [CrossRef]
- Bunzli, J.-C.G.; Piguet, C. Taking advantage of luminescent lanthanide ions. Chem. Soc. Rev. 2005, 34, 1048–1077. [Google Scholar] [CrossRef]
- Binnemans, K. Interpretation of Eu(III) spectra. Coord. Chem. Rev. 2015, 295, 1–45. [Google Scholar] [CrossRef] [Green Version]
- Görller-Walrand, C.; Fluyt, L.; Ceulemans, A.; Carnall, W.T. Magnetic dipole transitions as standards for Judd-Ofelt parametrization in lanthanide spectra. J. Chem. Phys. 1991, 95, 3099–3106. [Google Scholar] [CrossRef]
- Tang, S.-F.; Lorbeer, C.; Wang, X.; Ghosh, P.; Mudring, A.-V. Highly Luminescent Salts Containing Well-Shielded Lanthanide-Centered Complex Anions and Bulky Imidazolium Countercations. Inorg. Chem. 2014, 53, 9027–9035. [Google Scholar] [CrossRef] [PubMed] [Green Version]
- Mech, A.; Karbowiak, M.; Gorller-Walrand, C.; Van Deun, R. The luminescence properties of three tetrakis-dibenzoylmethane europium (III) complexes with different counter ions. J. Alloys Compd. 2008, 451, 215–219. [Google Scholar] [CrossRef]
- Outis, M.; Laia, C.A.T.; Oliveira, M.C.; Monteiro, B.; Pereira, C.C.L. A Europium(III) Complex with an Unusual Anion–Cation Interaction: A Luminescent Molecular Thermometer for Ratiometric Temperature Sensing. ChemPlusChem 2020, 85, 580–586. [Google Scholar] [CrossRef] [PubMed]
- Binnemans, K. Rare-Earth Beta-Diketonates, Chapter 225. In Handbook on the Physics and Chemistry of Rare Earths, 2nd ed.; Gschneidner, K.A., Jr., Bünzli, J.-C.G., Pecharsky, V.K., Eds.; Elsevier: Amsterdam, The Netherlands, 2005; Volume 35. [Google Scholar]
- Fu, F.; Sá-Ferreira, R.A.; Silva, N.J.O.; Fernandes, A.J.; Ribeiro-Claro, P.; Goncalves, I.S.; de Zea Bermudez, V.; Carlos, L.D. Structure–photoluminescence relationship in Eu(III) β-diketonate-based organic–inorganic hybrids. Influence of the synthesis method: Carboxylic acid solvolysis versus conventional hydrolysis. J. Mater. Chem. 2005, 15, 3117–3125. [Google Scholar] [CrossRef]
- Zhou, L.; Pang, Q.; Gong, F.; Sun, J.; Wang, W. Photoluminescence properties of a novel phosphor CaB2O4:Eu3+ under NUV excitation. Luminescence 2009, 24, 363–366. [Google Scholar]
- Ghosh, A.; Saha, R.; Mukherjee, K.; Sar, P.; Ghosh, S.K.; Malik, S.; Bhattacharyya, S.S.; Saha, B. Rate enhancement via micelle encapsulation for room temperature metal catalyzed Ce(IV) oxidation of p-chlorobenzaldehyde to p-chlorobenzoic acid in aqueous medium at atmospheric pressure. J. Mol. Liq. 2014, 190, 81–93. [Google Scholar] [CrossRef]
- Shaw, D.J. Introduction to Colloid and Surface Chemistry, 3rd ed.; Butter-Worth and Co. (Publishers) Ltd.: London, UK, 1980; p. 134. [Google Scholar]
- Sanz-Medel, A.; de la Campa, R.F.; Garcia Alonso, J.I. Metal Chelate Fluorescence Enhancement in Micellar Media: Mechanisms of Surfactant Action. Analyst 1987, 112, 493–497. [Google Scholar] [CrossRef]


| - | 1 | [Chol][Eu(fod)4] [25] |
|---|---|---|
| τ (ms) | 0.63 | 1.26 |
| Φ (%) | 100 | 81 |
| - | 1 | 1/PSU | [Chol][Eu(fod)4] [25] | [Chol][Eu(fod)4]/PSU |
|---|---|---|---|---|
| τ (ms) | 0.63 | 0.62 | 1.26 | 0.87 |
| Φ (%) | 100 | 21 | 81 | 24 |
| - | PSU | 1/PSU | [Chol][Eu(fod)4]/PSU |
| Water contact angle (°) | 66 | 79 | 84 |
| - |  |  |
Publisher’s Note: MDPI stays neutral with regard to jurisdictional claims in published maps and institutional affiliations. |
© 2020 by the authors. Licensee MDPI, Basel, Switzerland. This article is an open access article distributed under the terms and conditions of the Creative Commons Attribution (CC BY) license (http://creativecommons.org/licenses/by/4.0/).
Share and Cite
Outis, M.; Leal, J.P.; Casimiro, M.H.; Monteiro, B.; Pereira, C.C.L. Thermochromism of Highly Luminescent Photopolymer Flexible Films Based On Eu (III) Salts Confined in Polysulfone. Materials 2020, 13, 5394. https://doi.org/10.3390/ma13235394
Outis M, Leal JP, Casimiro MH, Monteiro B, Pereira CCL. Thermochromism of Highly Luminescent Photopolymer Flexible Films Based On Eu (III) Salts Confined in Polysulfone. Materials. 2020; 13(23):5394. https://doi.org/10.3390/ma13235394
Chicago/Turabian StyleOutis, Mani, João Paulo Leal, Maria Helena Casimiro, Bernardo Monteiro, and Cláudia Cristina Lage Pereira. 2020. "Thermochromism of Highly Luminescent Photopolymer Flexible Films Based On Eu (III) Salts Confined in Polysulfone" Materials 13, no. 23: 5394. https://doi.org/10.3390/ma13235394