Article

Effect of Ga on the Oxide Film Structure and Oxidation Resistance of Sn–Bi–Zn Alloys as Heat Transfer Fluids

1
School of Mechanical and Electrical Engieering, Huanggang Normal University, Huangang 438000, China
2
Hubei Zhongke Research Institute of Industrial Technology, Huangang 438000, China
3
School of Materials Science and Engineering, Wuhan University of Technology, Wuhan 430070, China
*
Author to whom correspondence should be addressed.
Materials 2020, 13(23), 5461; https://doi.org/10.3390/ma13235461
Submission received: 11 November 2020 / Revised: 26 November 2020 / Accepted: 27 November 2020 / Published: 30 November 2020
(This article belongs to the Section Advanced Materials Characterization)

Abstract

:
The effect of gallium on the oxide film structure and overall oxidation resistance of low melting point Sn–Bi–Zn alloys was investigated under air atmosphere using thermogravimetric analyses. The liquid alloys studied had a Ga content of 1–7 wt.%. The results showed that the growth rates of the surface scale formed on the Sn–Bi–Zn–Ga alloys conformed to the parabolic law. The oxidation resistance of Sn–Bi–Zn alloys was improved by Ga addition and the activation energies increased from 12.05 kJ∙mol−1 to 22.20 kJ∙mol−1. The structure and elemental distribution of the oxide film surface and cross-section were found to become more complicated and denser with Ga addition. Further, the results of X-ray photoelectron spectroscopy and X-ray diffraction show that Ga elements accumulate on the surface of the liquid metal to form oxides, which significantly slowed the oxidation of the surface of the liquid alloy.

1. Introduction

Fusible alloys are widely used in solar power generation, chip-heat dissipation, and nuclear power systems due to their excellent thermal properties and high-temperature stability [1,2,3]. Among the various low-melting-point alloy systems, tin-based alloys have been extensively studied [4,5]. As studied previously, fusible metals can be used as heat transfer medium in solar energy fields [6,7]. The thermal stability of alloys and their encapsulating materials is the key factor of heat transfer systems in the long-term service process at high temperature. In the actual test, there are still serious oxidation phenomena during the preparation process and high-temperature use, which greatly affects the service life of the heat transfer fluid. In addition, oxidation resistance is the key to high-temperature performance of alloy, especially in an air environment [8,9,10].
The oxidation resistance of a given alloy material depends on its ability to form oxide film on the surface. It is well known that the oxide film is formed in the oxidation process of the alloys, but their oxidation behavior varies greatly due to the differences in elemental content and preparation process. There are several publications concerning the oxidation behavior of alloy materials [11,12]. Zhao et al. [13] found that the addition of 2.5 at.% Al to Cu–20Ni–Cr alloy contributed to forming continuous external scales of chromia under lower Cr content. In Wang et al.’s study [14], the issuerable Al segregation to the surface led to the formation of Al2O3 film, which improved the oxidation resistance of the alloy. The added Nb element (1–2 wt.%) made the scale structure of the Ni–25Cr–15Fe alloys change from multiple layers to a single layer of Cr2O3, and also had a positive effect on oxidation kinetics [15]. In terms of coating surface technology, Wail Al Zoubi et al. [16,17,18] found that the use of controlled crosslinking agents for interfacial reactions on porous inorganic surfaces has better corrosion protection, light corrosion stability and antibacterial properties, and 8–HQ flower-like structure is likely to have important applications in biosensors, antioxidants, biological analysis devices, and industrial catalysis.
However, after developing new low melting point alloy heat transfer materials and studying their thermal properties and micromorphology [19], there have been seldom reports on high-temperature oxidation of liquid fusible alloys, let alone completed researches on the surface evolution of the alloys. Therefore, this work studied the oxidation behavior of Sn–Bi–Zn–Ga alloys at high temperature to reveal their oxidation mechanism, and further determined the effect of Ga addition on the improvement of the oxidation resistance of Sn–Bi–Zn alloys.

2. Materials and Methods

Appropriate proportions of pure Sn, Bi, Zn and Ga metals were placed in a temperature-controlled electric resistance furnace at 350 °C. Argon gas was used in the melting process to prevent the surface of the liquid alloys from being oxidized, meanwhile, the mixtures were stirred continuously to prepare uniform Sn–Bi–Zn–xGa (x = 1–7 wt.%) alloys, which were then cast into a desired shape. Component analysis was performed using X–ray fluorescence (XRF, Axios advanced). The alloys with different compositions prepared in the experiment are shown in Table 1.
The surface oxidation of the alloys was tested using a thermogravimetric (TGA, STA449F3, NETZSCH, Selb, Germany). Further, 25 mg alloy powders were placed on corundum crucibles to ensure that the alloy pellets remained substantially spherical during the experiment, which was carried out in air atmosphere with a heating rate of 10 °C·min−1. The oxidation rate of the alloys was expressed by the mass change per unit surface area, and the surface area of each alloy pellet was calculated by dividing the mass by the density. The density deviation of the alloys between liquid and solid state was neglected in the calculation. That is to say, it was believed that the density of the alloy sphere was constant during the heating process.
Structure observation and micro-area composition analysis of the free oxidation surface of the samples were performed using scanning electron microscope (SEM, JSM–IT300, JEOL Ltd., Akishima, Tokyo, Japan) and energy spectrum system (EDS, INCAX–ACT, Oxford Instruments, Abingdon, UK). The composition of the oxide surface was investigated by X-ray photoelectron spectroscopy (XPS, ESCALAB 250Xi, ThermoFisherScientific, Waltham, MA, USA) and X-ray diffraction (XRD, D8 ADVANCE, Bruker, Karlsruhe, Baden-Württemberg, Germany). The samples were cubes of 5 × 5 × 5 mm, which were oxidized at 400 °C for 4 h. In order to form a desired oxide layer on the surface of the alloy, oxidized slag should be avoided during the oxidation.

3. Results and Discussion

3.1. Oxidation Kinetics

Figure 1a shows the changing trend of oxidation weight change of sample alloys with different Ga element with increasing temperature from 0 to 700 °C. The oxidative weight gain of the four alloys with Ga was significantly lower than that of the Sn–50Bi–2Zn, indicating that the addition of Ga improved the oxidation resistance of the alloys. The weight increase of Sn–Bi–Zn alloy without the addition of Ga was large, and the oxidation weight gain when heating to 700 °C was 0.45 mg. When adding 1–5 wt.% Ga, the oxidation weight gain was 0.35, 0.33, and 0.29 mg, respectively. The oxidative weight change of the samples in the liquid state gradually decreases. As the Ga content continued to increase to 7 wt.%, the oxidative weight gain of the alloy slowed down. The reason was that Ga segregated to the surface or subsurface of the liquid alloys and was oxidized by a displacement reaction to form a barrier layer, which inhibited further oxidation of the alloys, thereby improving the oxidation resistance of the alloys. The curves of oxidation weight gain of the samples with time at 700 °C are shown in Figure 1b. It was obvious that the oxidative weight gain of the Sn–Bi–Zn matrix increased rapidly after 40 min, because the oxide of Sn cannot be dissolved in the matrix under long-term high-temperature oxidation, and the nucleation alone grew, thereby destroying the continuous compactness of the oxide film itself and increasing the defect concentration of the oxide film, which accelerated the oxidation of the alloy surface [20,21]. The curves of oxidation weight gain per minute of the two alloys as a function of temperature are shown in Figure 1c. The oxidative weight gain of the (Sn–50Bi–2Zn)–7Ga alloys was smaller than that of the matrix alloys at the same temperature.
It can be seen from Figure 1 that the weight of the liquid alloy increases rapidly in the initial stage of oxidation. The reason for the larger oxidation rate before 200 °C in Figure 1c is that the surface of the liquid metal has not yet formed an oxide film and can be in direct contact with oxygen. Therefore, the slope of the curve in the initial stage in Figure 1a is relatively large. As the temperature increases, an oxide film on the surface of the liquid metal gradually forms. The oxidation rate in Figure 1c tends to a fixed value, and the oxidation weight gain in Figure 1a also increases linearly. According to the Fromhold model [22], oxygen molecules collide with the metal surface in the initial stage of oxidation, followed by physical adsorption of oxygen molecules, and then decomposition and chemical bonding of oxygen molecules, which mainly occur at the interface between the liquid metal surface and oxygen. After half an hour, the alloy oxidation weight gain slowed down, in line with the parabolic law, this stage is the diffusion control process. This stage is divided into the diffusion of metal elements and the diffusion of active materials in oxides and reactive gases. The vapor phase oxygen is separated from the metal substrate, and the reaction material can be further oxidized by the diffusion of the oxide film. The finally formed oxide film is divided into protective oxide film and non-protective oxide film. Rate constant, k1, for the linear stage was estimated by the following equation [13]:
Δ w / t = k 1
where Δw is the weight increase due to oxide layer growth and t represents the reaction time.
Table 1 lists the k1 values of the Sn–Bi–Zn–xGa alloys at 400 °C, which is given by the slope of the linear phase in the weighting curves. The slope from Sn–50Bi–2Zn to (Sn–50Bi–2Zn)–7Ga decreases continuously and the (Sn–50Bi–2Zn)–5Ga alloys show the slowest weight change. Adding Ga element effectively improves the oxidation resistance of the solder.
The parabolic growth of weight gain in Figure 1 followed Arrhenius law [14]:
ln ( k ) = A Q / R T
where k is the reaction rate constant, A is the pre-factor, R is the ideal gas constant, and Q is the activation energy of the reaction. Table 2 show the values of Q for Sn–Bi–Zn–xGa alloys was 12.05, 15.69, 21.27, 22.45 and 22.20 kJ∙mol1, respectively.

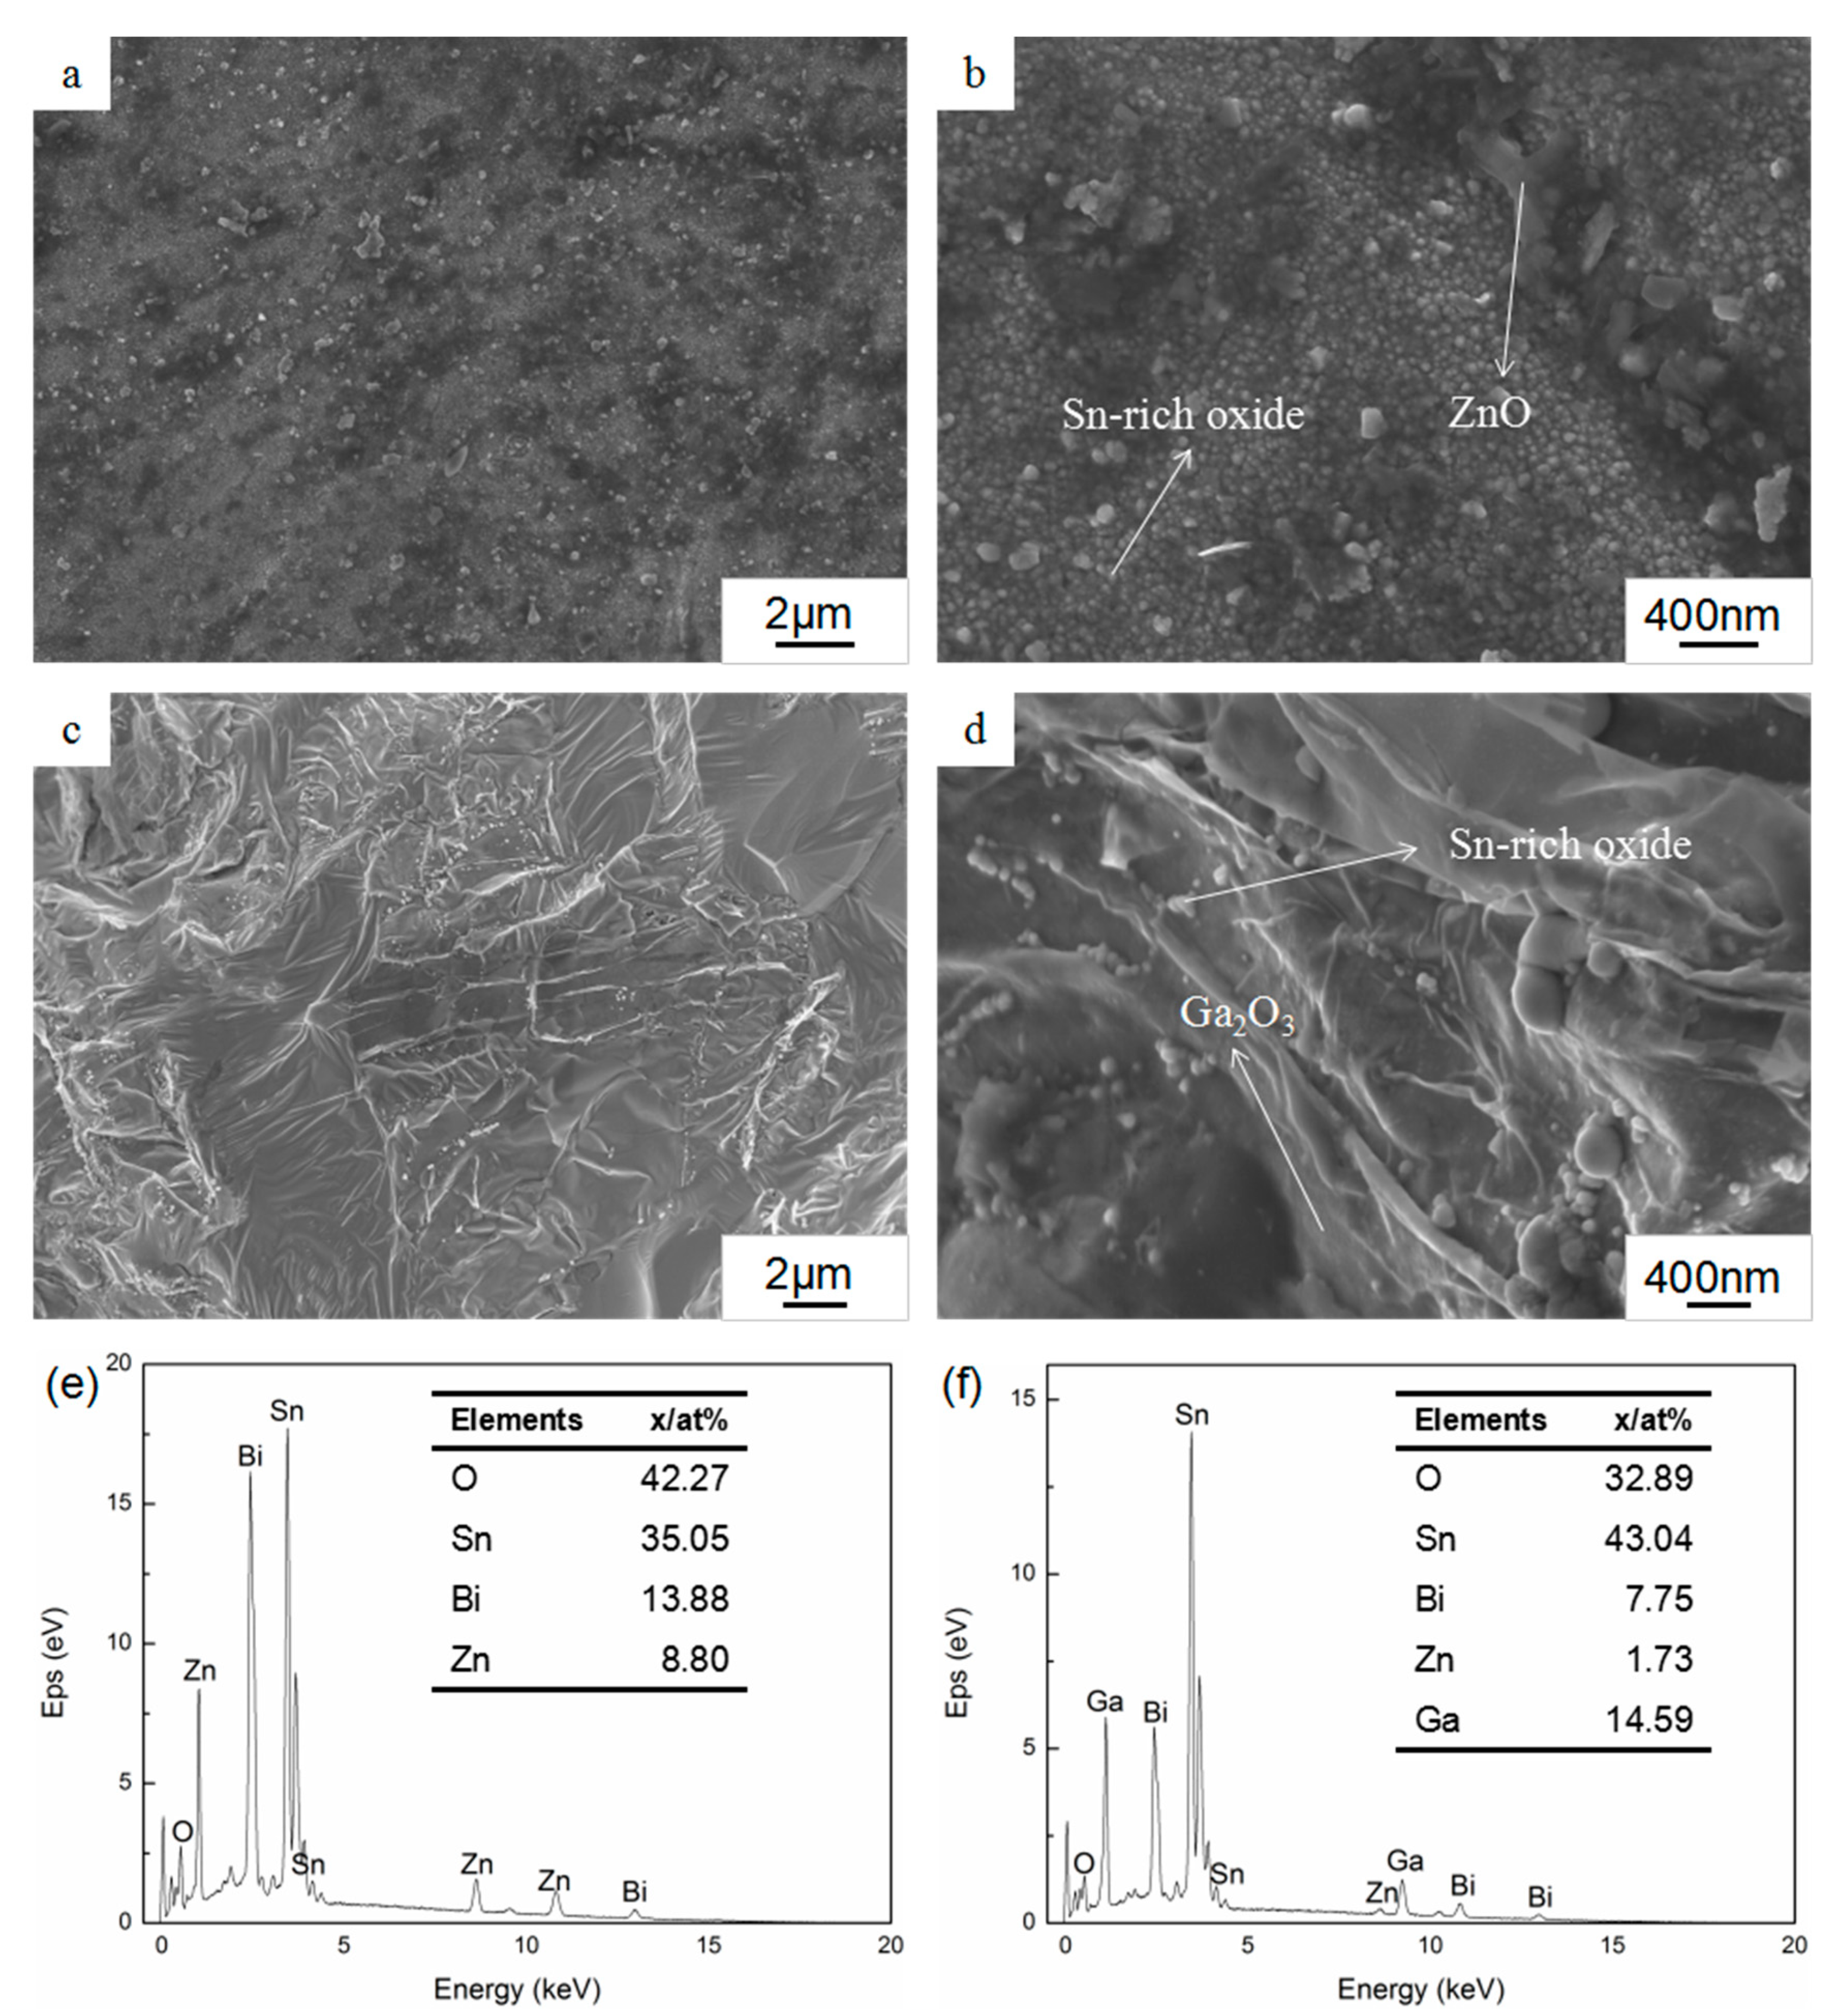
3.2. Surface and Cross-Sectional Morphology of Oxide Scale

Scanning electron microscopy analysis of Sn–Bi–Zn–Ga samples after oxidation for 12 h at 400 °C was performed as shown in Figure 2. The results showed that the morphology of the surface oxide layers of the two alloys was quite different. It can be seen from Figure 2a,b that there were many convex particles of different sizes distributed on the oxidation surface of Sn–50Bi–2Zn alloys, and the largest size was about 1 μm. The oxide film of Sn–50Bi–2Zn consisted of a large amount of Sn-rich oxide and a part of ZnO. The oxidized surface of (Sn–50Bi–2Zn)–7Ga in Figure 2c,d formed a relatively dense oxide film, which was much smoother and denser than that of the matrix alloys. The oxide film of (Sn–50Bi–2Zn)–7Ga was mainly composed of a large amount of Ga2O3 and a part of Sn-rich oxide. Therefore, the addition of the Ga element greatly improved the oxide film structure of the Sn–50Bi–2Zn alloys.
The results of the energy spectrum analysis of the oxidized surface are shown in Figure 2e,f. The results showed that the surface oxygen content of Sn–50Bi–2Zn alloys was higher, while that of (Sn–50Bi–2Zn)–7Ga alloys was lower, and the Ga element in the surface oxide film was much higher than the nominal content of Ga in the alloys. This indicated that the Ga element segregated to the surface of the liquid alloys during oxidation to form a dense oxide film, which hindered further oxidation of the surface of the liquid alloys. In addition, the content of Bi and Zn elements on the oxidized surface of the alloys with Ga addition decreased to 7.75% and 1.73%, respectively, indicating that the added alloying elements changed the oxidation resistance of the alloys by affecting the elemental distribution on the alloy surface.
The cross-sectional morphology of the sample alloys after oxidation for 12 h at 400 °C is shown in Figure 3a,b, and their elemental distribution is shown in Figure 3c,d. As can be seen from Figure 3a,c, Sn-rich oxide film with a thickness of 30 μm, which was loose and porous, was formed on the surface of the liquid alloys. It was remarkable that no oxides of Bi and Zn were detected in the cross-section. In Figure 3b,d, the thickness of the (Sn–50Bi–2Zn)–7Ga surface oxide film reduced to 10 μm, and the film can be divided into two layers. The outer layer with a thickness of 4 μm was the mixed oxides of Sn-rich oxide, Bi2O3, and Ga2O3. This was because the outer oxide film was peeled off in a plurality of regions, while the element Ga in the matrix segregated to the liquid surface to form dense Ga2O3.

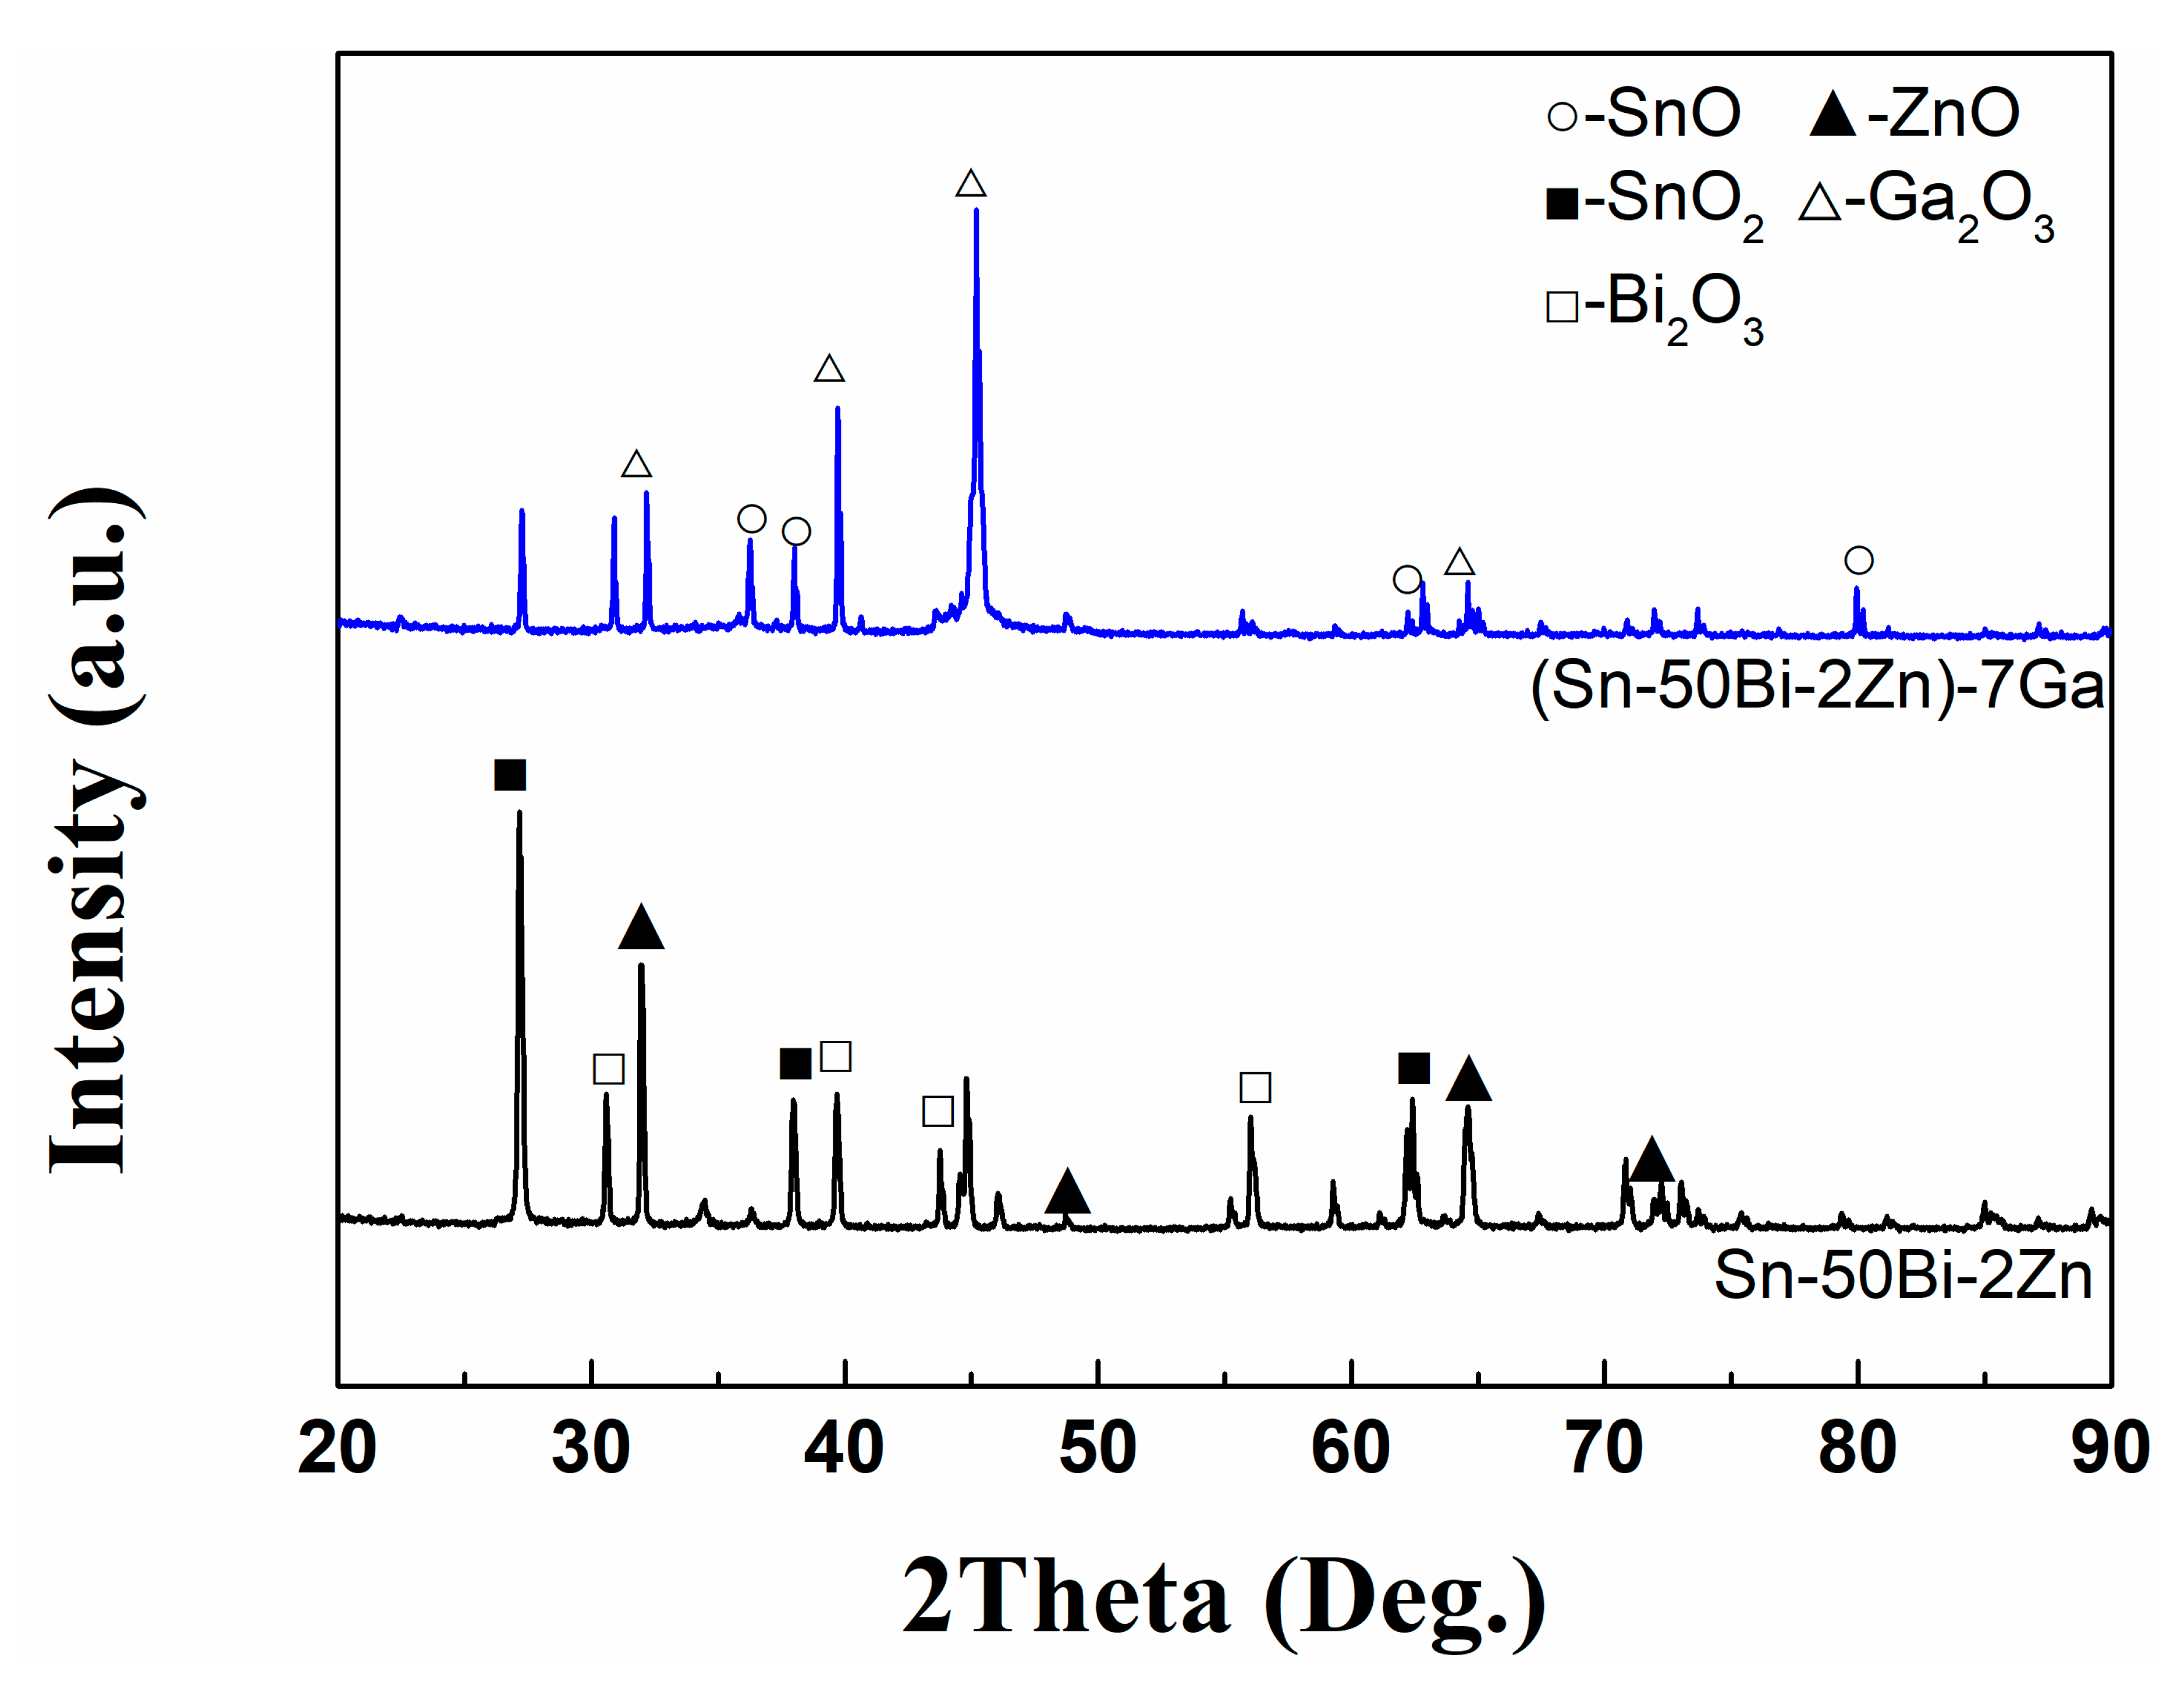
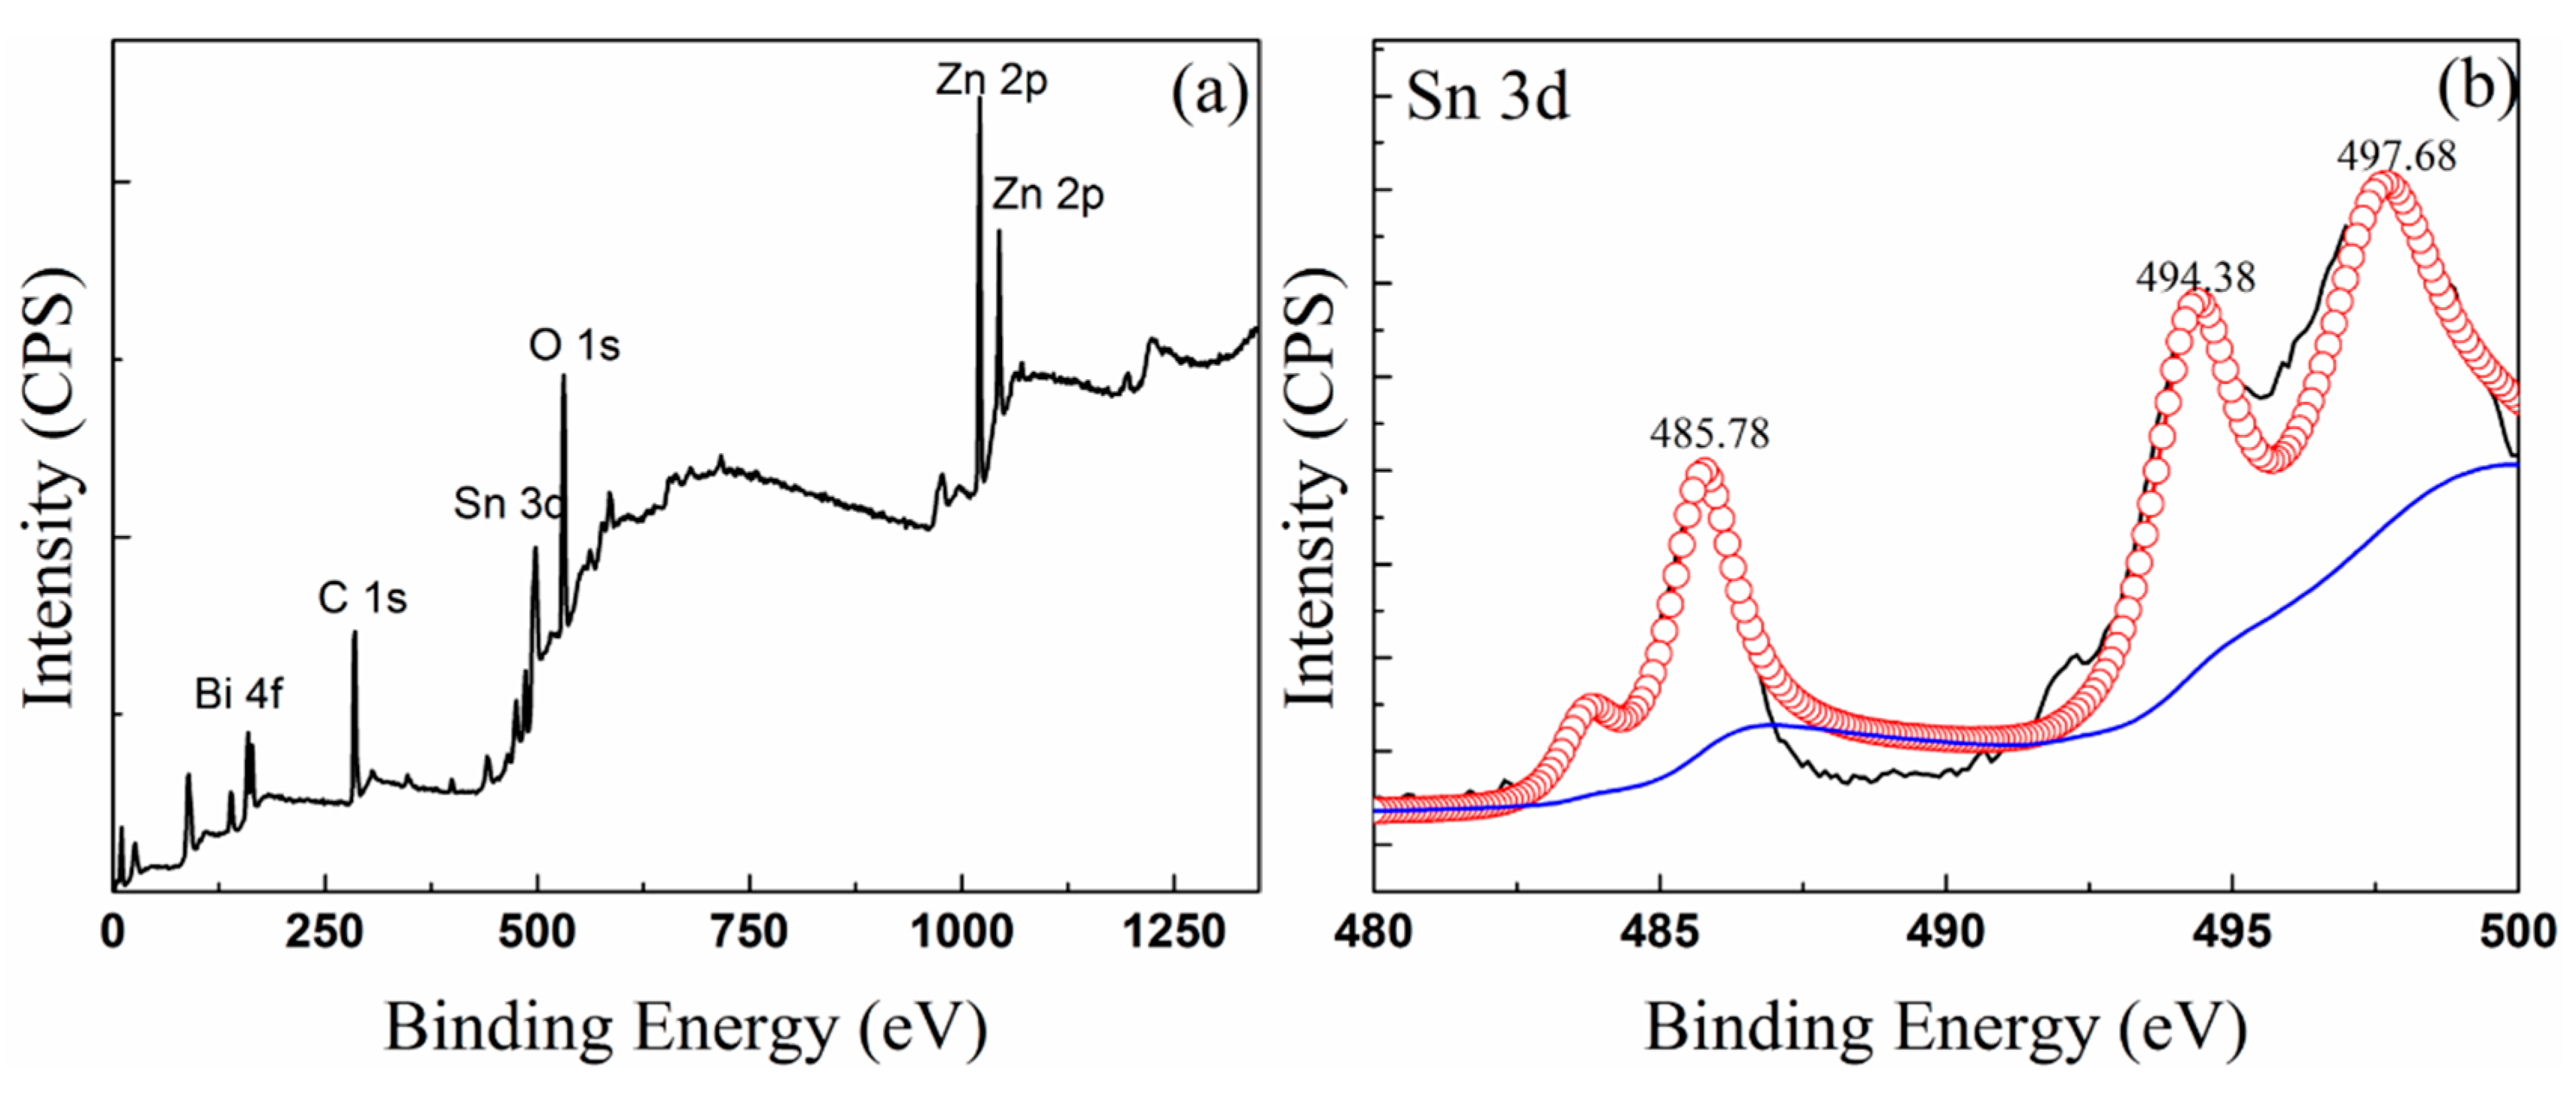
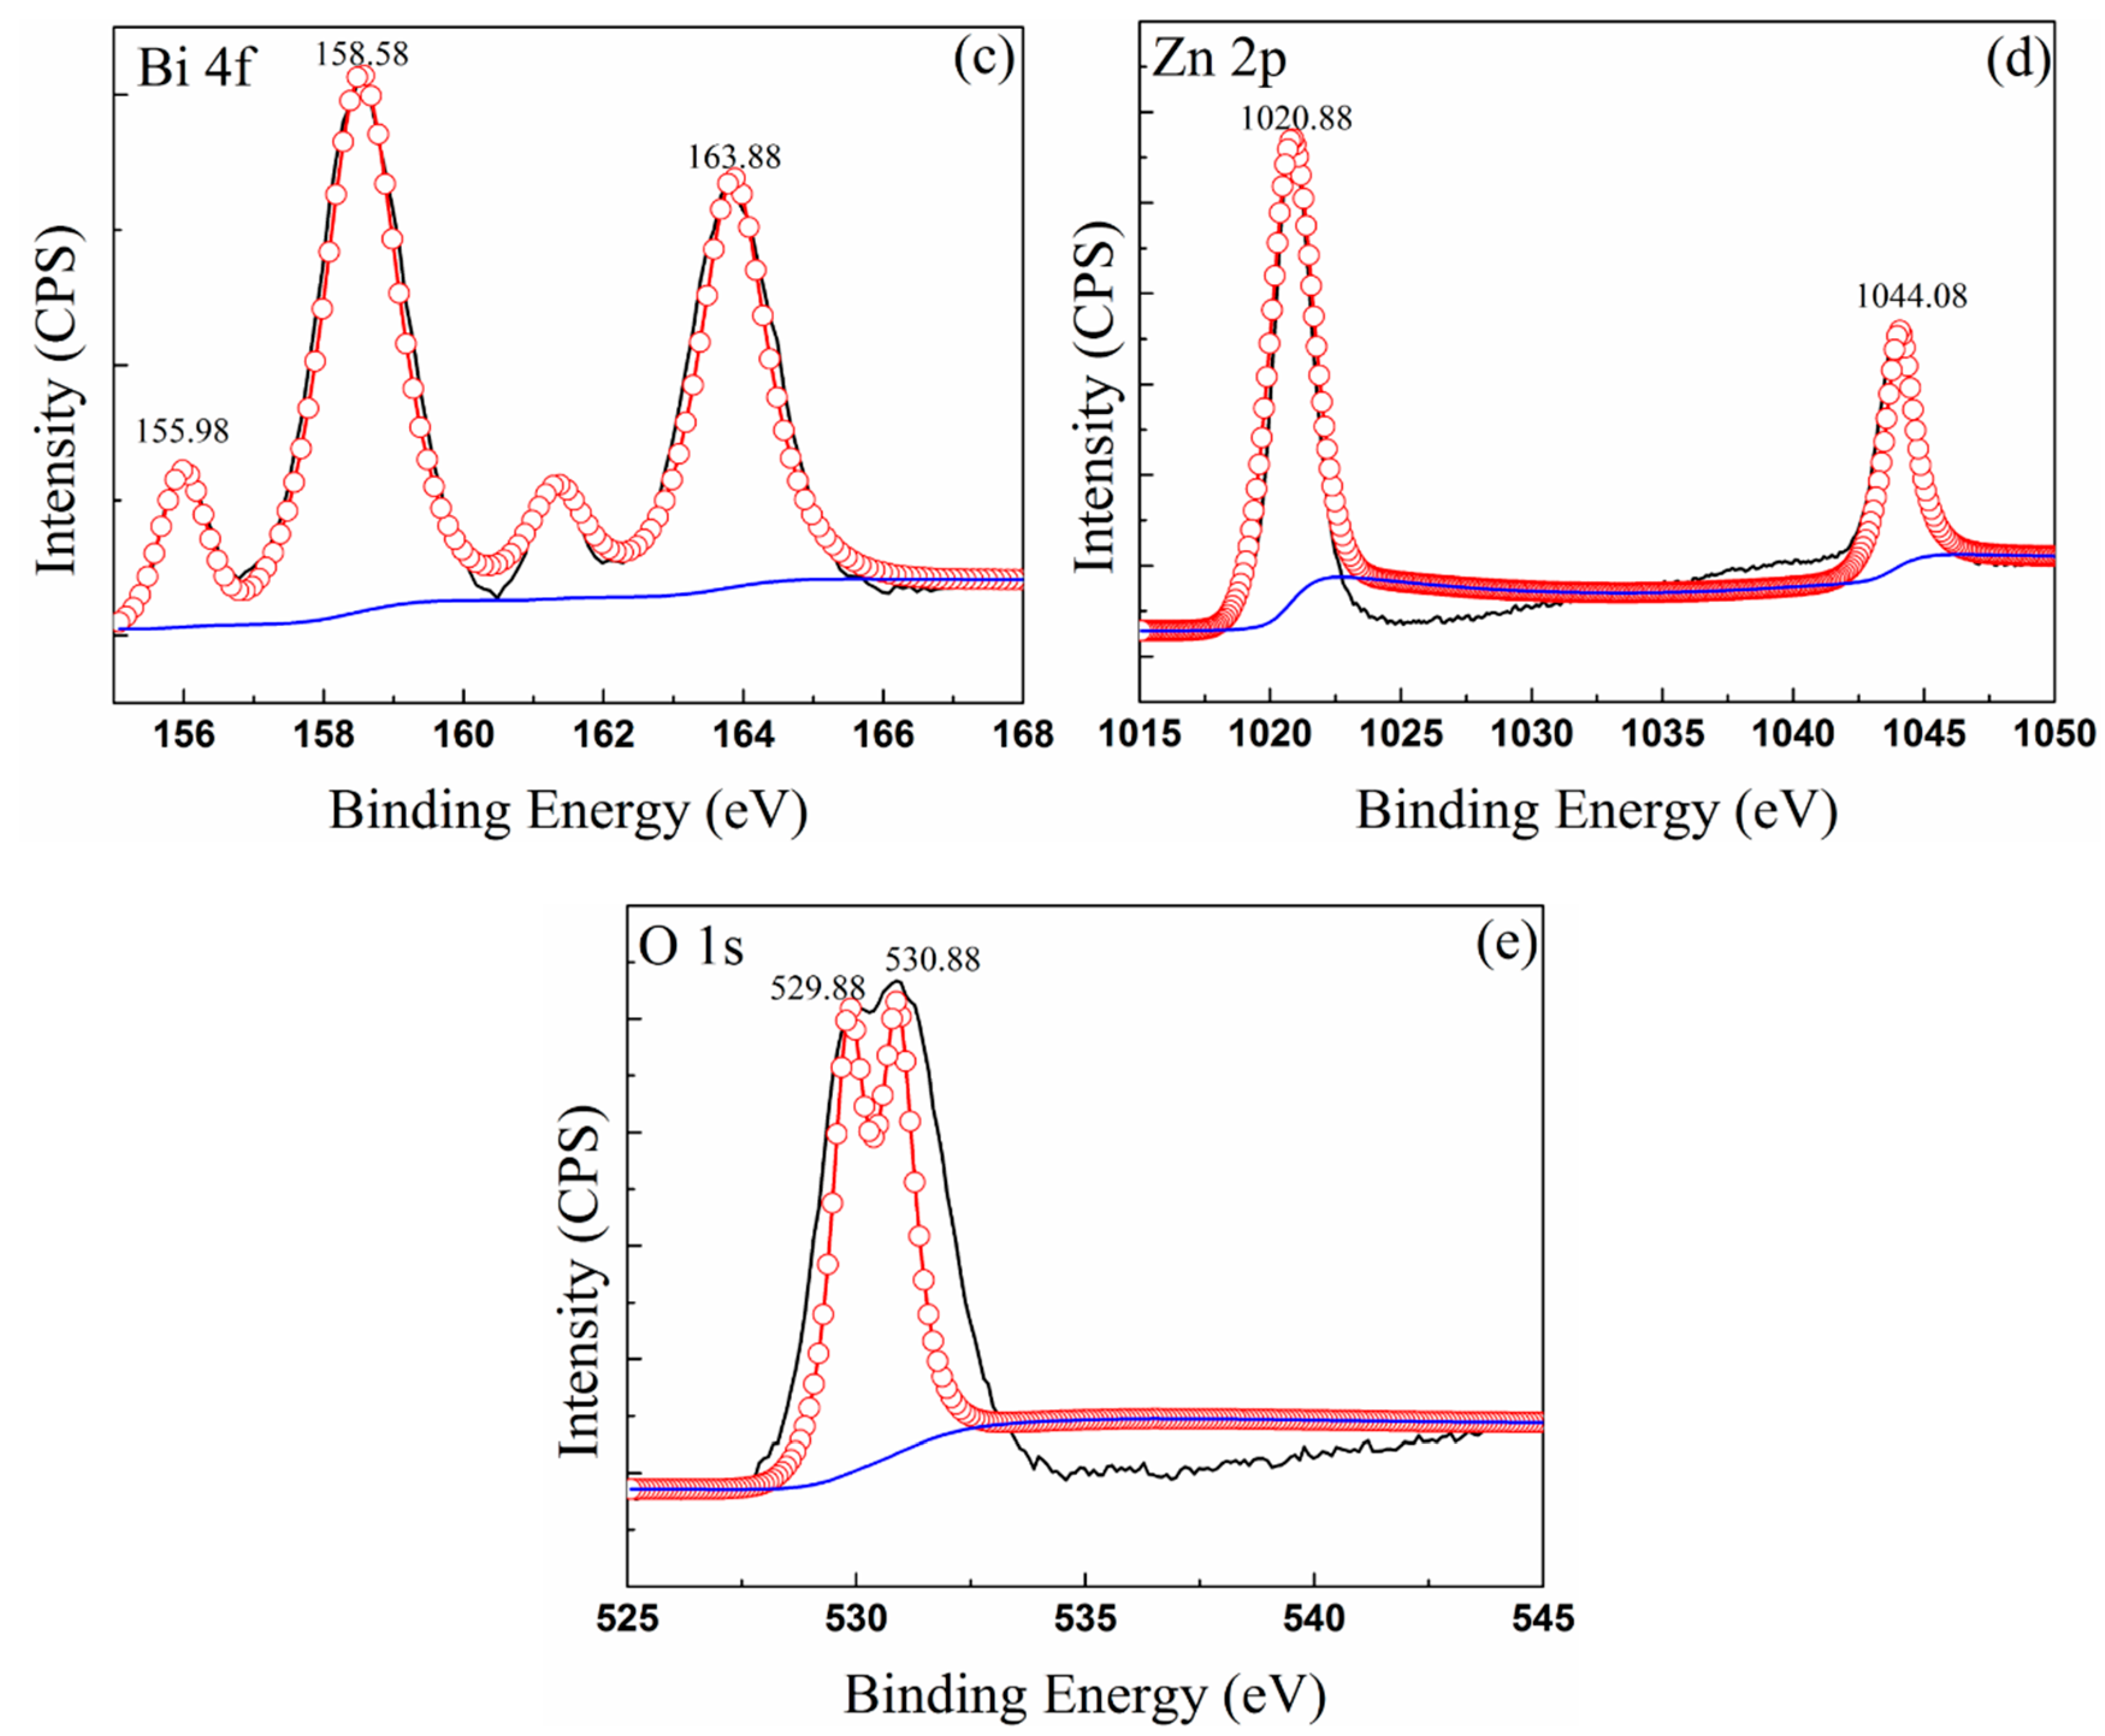
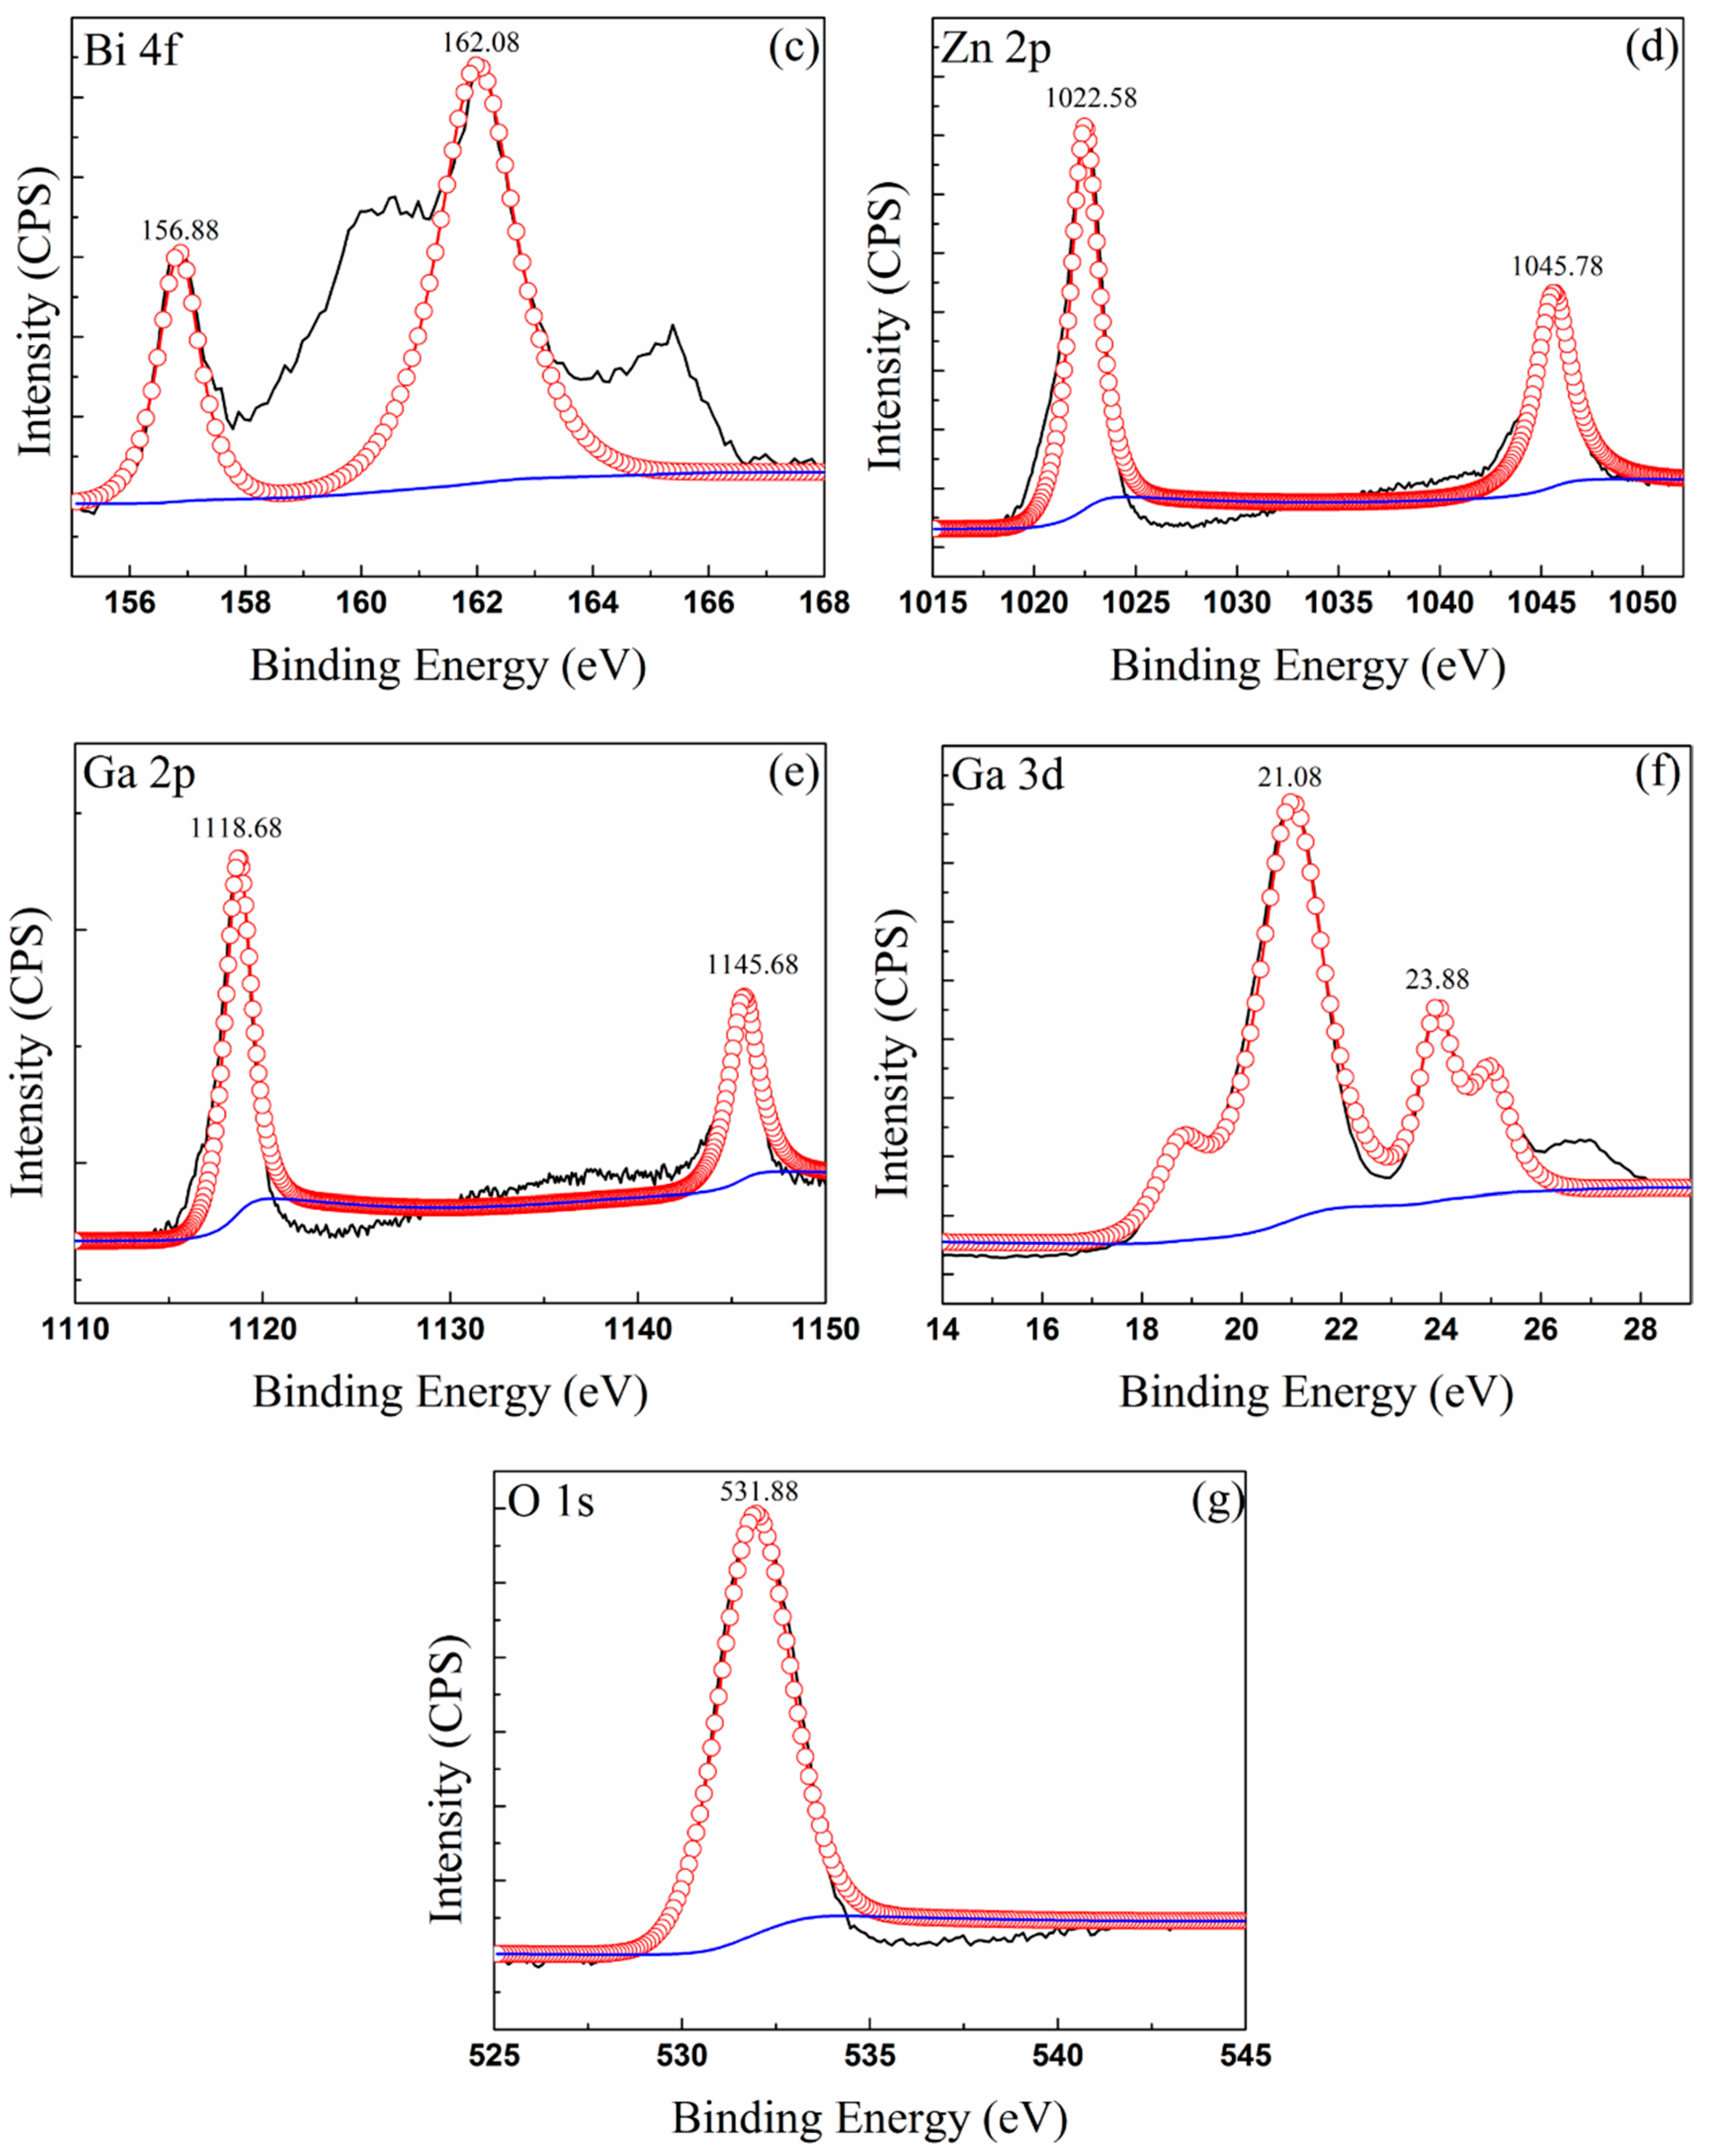
3.3. Composition of Oxide Scale

Figure 4 shows the XRD curve of the oxidized surface of the sample alloy. The composition of the oxide film on the surface of the two alloys and the relative content of each constituent phase were changed. The oxide film of Sn–50Bi–2Zn was composed of SnO2, ZnO, and Bi2O3, and the diffraction peaks of SnO2 and ZnO were strong. After the addition of Ga element, the oxide film was mainly composed of SnO2, ZnO, Ga2O3 and a small amount of SnO. It was found that the intensity of the SnO2 diffraction peak in the XRD pattern of (Sn–50Bi–2Zn)–7Ga was significantly weakened, and the diffraction peaks of SnO and Ga2O3 appeared. This was because the Ga element segregated to the surface of the liquid alloys to form a dense oxide film, which reduced the O content of the reaction with Sn, leading to the appearance of SnO.
Figure 5 and Figure 6 show the XPS spectra of the oxidized surface of the Sn–50Bi–2Zn and (Sn–50Bi–2Zn)–7Ga samples, respectively, and the binding energy of related elements and oxides are listed in Table 3. Figure 5a and Figure 6a show the measured spectra of the samples with visible peaks of Sn 3d, Bi 4f, Zn 2p, Ga 2p, Ga 3d, and O 1s. Peak C1s can be considered as pollution. For more details, the selected subranges for the three Zn and Bi peaks are shown. According to the binding energy value of the XPS peak, it was found that Sn, Bi, Zn, Ga (shown only in the (Sn–50Bi–2Zn)–7Ga sample) and O coexisted in the oxidation products of Sn–50Bi–2Zn and (Sn–50Bi–2Zn)–7Ga samples. The results showed that the XPS spectrum of Zn 2p possessed two peaks corresponding to 1025.6 eV. (ZnO) and 1048.1 eV (Zn 2p1/2). It should be noted that there was no significant difference between the binding energy in the surface oxide film of the two different alloys.
The XPS spectrum of the O 1s peak is shown in Figure 5e and Figure 6g. The O 1s peak was located at 531.88 eV and may be assigned a metal oxide (OM oxygen) [23], where M may be a metal oxide formed outside the liquid alloys by Sn, Bi, Zn or Ga. The binding energy value of Ga 2p sum occurred in the range of 1110–1150 eV, and the binding energy value of Ga2O3 was 20.7 eV. These results indicate that not only the Ga oxide but also the Ga element was present on the surface of the liquid alloys, and Figure 6e,f can also prove this point.
The Bi 4f spectrum composed of a double structure (such as two peaks of Zn 2p) produced by multiple splitting is shown in Figure 5c and Figure 6c. Table 3 lists the binding energy of Bi element in different valence states. Compare the values in Table 3 and NIST database, the Bi compound on the surface of the liquid metal has two different compositions, namely, metal Bi and Bi2O3 corresponded to peak binding energy 157 and 158 eV, respectively [24]. It is important to note that the binding energy of Sn 3d shown in Figure 5e,f may be SnO, SnO2 or a mixture thereof [25]. SnO2 is the main component because of better high-temperature stability [25,26].
The results of the compositions of the oxide films measured by XPS in Table 4 show that the atomic percentages of Sn and O on the surface were higher, but the concentration of Sn was relatively lower than that of the Sn–50Bi–2Zn sample, which meant that the rate of formation of Sn oxide changed with the addition of Ga. The Sn atom concentration of the (Sn–50Bi–2Zn)–7Ga sample was reduced to about 24.14%, while the Sn–50Bi–2Zn was about 50.36%. Moreover, the atomic concentration of Ga was 33.4% on the surface, which was significantly higher than that of the matrix, indicating that Ga2O3 formed on liquid surface. The atomic concentration of Zn in Sn–50Bi–2Zn was smaller than that in the (Sn–50Bi–2Zn)–7Ga alloys, but the atomic concentration of O was large, which indicates that the surface oxide film has poor oxidation resistance.
According to the thermodynamic principle, the smaller the standard free energy of the oxide at the same temperature, the easier the metal was to oxidize. Table 5 lists the Gibbs free energy for the formation of oxides of various elements in the alloys of this study. The ability of Sn, Bi, Zn, Ga, and O to combine is Ga > Bi > Sn > Zn. It can be seen that Ga in the (Sn–50Bi–2Zn)–7Ga alloy was oxidized prior to other elements, and the oxide film on the surface of the alloy was mainly Ga2O3. The theory of high-temperature oxidation of metals suggested that the formation of a stable and dense protective oxide film by selective oxidation is one of the effective ways to improve the oxidation resistance of the alloys.
An important criterion for judging the compactness of an oxide film is the ratio of the volume of the oxide to the volume of the metal forming the oxide, PBR (Pilling−Bedworth ratio), expressed as γ [28]:
γ = V O X V M = M ρ M n A ρ O X = M ρ m m ρ O X > 1
where M is the relative molecular mass of the metal oxides, A is the relative atomic mass of the metal, n is the number of atoms of metal per molecule of the oxide, m is the mass of the metal consumed to form the oxide film, ρm and ρox are the density of the metals and metal oxides.
As shown in Figure 7, when PBR is less than 1, the oxide film cannot completely cover the liquid surface, which can form a complete and dense protective oxide film, and the appropriate compressive stress in the oxide film. When PBR is more than 2, the larger compressive stress in the oxide film will also crack and flake, resulting in an oxide film that does not process protective properties. Therefore, the oxide with protective properties should have a PBR value of 1 to 2 [29,30]. The calculated PBR values of ZnO and Ga2O3 are equal to 1.58 and 1.23, respectively. Accordingly, the oxide film mixed of ZnO and Ga2O3 is maintained in a stable state once formed.

4. Conclusions

Based on the Sn–50Bi–2Zn alloys, the addition of Ga element can change the microstructure and improve the oxidation resistance of the oxide film at 400 °C. Element Ga decreased the rate constant of the oxidation reaction and increased the activation energy. When the mass fraction of Ga in the alloys reached 5%, the Sn–50Bi–2Zn alloys processed the best oxidation resistance. The Element Ga segregated to the surface due to the small density, and preferentially reacted with oxygen to produce a dense Ga2O3 oxide film, which suppressed further oxidation of the matrix alloys, so that the oxide layer was thinned from about 30 to 10 μm. The results of SEM and XPS show that the addition of element Ga changed the structure of the oxide film on the surface of the base alloys, reduced the oxide content of Sn and Bi and formed a dense oxide film together with the oxide of Zn. This work shows that (Sn–50Bi–2Zn)–7Ga alloys can be considered as an ideal high-temperature heat transfer medium, especially when oxidation during the heat transfer process in the atmosphere is of concern.

Author Contributions

The main contributions of Q.M. are article are research data collection and manuscript writing. The main contributions of X.C. are article content concept proposal and design. The main contributions of Z.L. (Zhi Liu) are data analysis and manuscript revision. The main contributions of Z.L. (Zean Lv) are data collection and analysis. The main contributions of Q.C. are data analysis and manuscript revision. All authors have read and agreed to the published version of the manuscript.

Funding

This research received no external funding.

Acknowledgments

The authors would like to thank Key Technology Research & Development Program of Hubei (Grant No. 2015BAA111, Science and Technology Department of Hubei Province), the Key Science Foundation of Hubei Province (Grant No. D20192903) and the Science Foundation of Huanggang (No. XQYF 2020000031).

Conflicts of Interest

The authors declare no conflict of interest.

References

  1. Takada, O.; Kamiyama, T.; Kiyanagi, Y. Study on phase transition of Pb–Bi eutectic alloy by neutron transmission spectroscopy. J. Nucl. Mater. 2010, 398, 129–131. [Google Scholar] [CrossRef] [Green Version]
  2. Prabu, T.; Sekar, C.A. Improving Heat Transfer in Hybrid Solar Systems Using Liquid Metal Alloys as a Coolant. J. Sol. Energy Eng. 2017, 139, 064501. [Google Scholar] [CrossRef]
  3. Popović, M.; Olmsted, D.; Bolind, A.; Asta, M.; Sohn, S.; Schroers, J.; Shao, R.; Hosemann, P. A study of the effects of minor additives to Pb–Bi eutectic: Designing novel Pb–Bi–X liquid alloys for heat transfer applications. Mater. Des. 2018, 159, 240–251. [Google Scholar] [CrossRef]
  4. Wang, Q.M.; Cheng, X.M.; Li, Y.Y.; Yu, G.M.; Liu, Z. Microstructures and thermal properties of Sn–Bi–Pb–Zn alloys as heat storage and transfer materials. Rare Met. 2019, 38, 350–358. [Google Scholar] [CrossRef]
  5. Xu, Z.; Utton, C.; Tsakiropoulos, P. A Study of the Effect of 2 at.% Sn on the Microstructure and Isothermal Oxidation at 800 and 1200 °C of Nb–24Ti–18Si-Based Alloys with Al and/or Cr Additions. Materials 2018, 11, 1826. [Google Scholar] [CrossRef] [PubMed] [Green Version]
  6. Pacio, J.; Wetzel, T. Corrigendum to “Assessment of liquid metal technology status and research paths for their use as efficient heat transfer fluids in solar central receiver systems”. Sol. Energy 2017, 93, 11–22. [Google Scholar] [CrossRef]
  7. Lorenzin, N.; Abánades, A. A review on the application of liquid metals as heat transfer fluid in Concentrated Solar Power technologies. Int. J. Hydrogen Energy 2016, 41, 6990–6995. [Google Scholar] [CrossRef]
  8. Song, J.-M.; Cheng, Y.-M.; Tsai, C.-H. Oxidation of liquid solders for die attachment. Corros. Sci. 2010, 52, 4011–4016. [Google Scholar] [CrossRef]
  9. Wu, X.D.; Liu, S.; Lin, F.; Weng, D. Nitrate storage behavior of Ba/MnOx–CeO2 catalyst and its activity for soot oxidation with heat transfer limitations. J. Hazard. Mater. 2010, 181, 722–728. [Google Scholar] [CrossRef]
  10. Han, J.; Su, B.; Meng, J.; Zhang, A.; Wu, Y. Microstructure and Composition Evolution of a Fused Slurry Silicide Coating on MoNbTaTiW Refractory High-Entropy Alloy in High-Temperature Oxidation Environment. Materials 2020, 13, 3592. [Google Scholar] [CrossRef]
  11. Yang, Y.; Kitashima, T.; Hara, T.; Hara, Y.; Yamabe-Mitarai, Y.; Hagiwara, M.; Iwasaki, S. Effects of Ga, Sn Addition and Microstructure on Oxidation Behavior of Near-α Ti Alloy. Oxid. Met. 2017, 88, 583–598. [Google Scholar] [CrossRef]
  12. Zhang, X.; Li, C.; Gao, Z.; Liu, Y.; Ma, Z.; Yu, L.; Li, H. Correlation between Zn-Rich Phase and Corrosion/Oxidation Behavior of Sn–8Zn–3Bi Alloy. Metals 2016, 6, 175. [Google Scholar] [CrossRef] [Green Version]
  13. Zhao, Z.Q.; Yu, L.; Shen, Y.; Jia, Z.Q. Influence of Al Addition on Oxidation Behavior of Cu–Ni–Cr Alloys at 973–1073 K in 1.01 × 10² kPa Pure Oxygen. Oxid. Met. 2017, 88, 397–407. [Google Scholar]
  14. Wang, X.J.; Zhu, Q.S.; Liu, B.; Liu, N.; Wang, F.J. Effect of doping Al on the liquid oxidation of Sn–Bi–Zn solder. J. Mater. Sci. Mater. Electron. 2014, 25, 2297–2304. [Google Scholar] [CrossRef]
  15. Xu, Y.X.; Lu, J.T.; Yang, X.W.; Yan, J.B.; Li, W.Y. Effect and role of alloyed Nb on the air oxidation behaviour of Ni–Cr–Fe alloys at 1000 degrees C. Corros. Sci. 2017, 127, 10–20. [Google Scholar] [CrossRef]
  16. Al Zoubi, W.; Ko, Y.G. Self-assembly of hierarchical N-heterocycles-inorganic materials into three-dimensional structure for superior corrosion protection. Chem. Eng. J. 2019, 356, 850–856. [Google Scholar] [CrossRef]
  17. Al Zoubi, W.; Kim, M.J.; Kim, Y.G.; Ko, Y.G. Dual-functional crosslinked polymer-inorganic materials for robust electrochemical performance and antibacterial activity. Chem. Eng. J. 2020, 392, 123654. [Google Scholar] [CrossRef]
  18. Al Zoubi, W.; Kamil, M.P.; Fatimah, S.; Nashrah, N.; Ko, Y.G. Recent advances in hybrid organic-inorganic materials with spatial architecture for state-of-the-art applications. Prog. Mater. Sci. 2020, 112, 100663. [Google Scholar] [CrossRef]
  19. Wang, Q.M.; Cheng, X.M.; Li, Y.Y.; Yu, G.M.; Liu, Z. Microstructures and Thermal Properties of Sn–Bi–Zn–Ga Alloys as Heat Transfer and Heat Storage Materials. J. Wuhan Univ. Technol. Mater. Sci. Ed. 2019, 34, 676–683. [Google Scholar] [CrossRef]
  20. Cruchley, S.; Taylor, M.P.; Evans, H.E.; Hardy, M.C.; Child, D.J. Characterisation of subsurface oxidation damage in Ni based superalloy, RR1000. Mater. Sci. Technol. 2014, 30, 1884–1889. [Google Scholar] [CrossRef]
  21. Zhu, L.J.; Zhu, S.L.; Wang, F.H.; Zhang, J.Q. Comparison of the cyclic oxidation behavior of low expansion Ni + Cr AlYSiN nanocomposite and a NiCrAlYSi coating. Corros. Sci 2014, 80, 393. [Google Scholar] [CrossRef]
  22. Perdew, J.P.; Wang, Y. Accurate and simple analytic representation of the electron-gas correlation energy. Phys. Rev. B 1992, 45, 13244–13249. [Google Scholar] [CrossRef] [PubMed]
  23. Moulder, J.F.; Stickle, W.F.; Sobol, P.E.; Bomben, K.D. Handbook of Photoelectron Spectroscopy; Perkin-Elmer Corporation: Waltham, MA, USA, 1992. [Google Scholar]
  24. Cho, S.; Yu, J.; Kang, S.K.; Shih, D.-Y. Oxidation study of pure tin and its alloys via electrochemical reduction analysis. J. Electron. Mater. 2005, 34, 635–642. [Google Scholar] [CrossRef]
  25. Cheng, W.; Liu, M.; Wu, Z.; Xing, X.; Mo, G.; Wu, Z.; Liu, H. In-situ GISAXS study on the oxidation behavior of liquid Ga on Ni(Cu)/Si substrates. Nucl. Instrum. Methods Phys. Res. Sect. B 2015, 362, 133–137. [Google Scholar] [CrossRef]
  26. Denisov, V.M.; Denisova, L.T.; Osipovich, T.V.; Kirik, S.D. Influence of silver on oxidation of Ge–Bi melts. Russ. J. Non-Ferrous Met. 2010, 51, 49–51. [Google Scholar] [CrossRef]
  27. Landolt, B.; Börnstein, R. Thermodynamic Properties of Inorganic Material; Springer: Berlin, Germany, 1999; Volume 19A1. [Google Scholar]
  28. Zhang, S.; Zhang, Y.; Wang, H. Effect of oxide thickness of solder powders on the coalescence of SnAgCu lead-free solder pastes. J. Alloys Compd. 2009, 487, 682–686. [Google Scholar] [CrossRef]
  29. Meier, H. Introduction to High Temperature Oxidation of Metals; Edward Arnold: London, UK, 1983; p. 88. [Google Scholar]
  30. Fontana, M.G.; Stactile, W. Corrosion Science and Technology; Plenum Press: London, UK, 1970; p. 149. [Google Scholar]
Figure 1. TG curves of the test alloys. (a) Weight gain curves with temperature, (b) weight gain curves with time, and (c) weight gain per minute with temperature.
Materials 13 05461 g001
Figure 2. SEM images of surface morphologies of oxidation films of (a,b) Sn–50Bi–2Zn, (c,d) (Sn–50Bi–2Zn)–7Ga, and (e,f) EDS analysis of the oxide film.
Materials 13 05461 g002
Figure 3. SEM image of cross section of low melting point alloys oxide film and corresponding concentration distribution of elements (a,c) Sn–Bi–Zn, (b,d) (Sn–50Bi–2Zn)–7Ga.
Materials 13 05461 g003
Figure 4. XRD patterns of oxide surfaces on the test alloys.
Materials 13 05461 g004
Figure 5. XPS spectra of the Sn–50Bi–2Zn oxide surfaces (a), the relevant Sn 3d (b), Bi 4f (c), Zn 2p (d) and O 1s (e).
Materials 13 05461 g005aMaterials 13 05461 g005b
Figure 6. XPS spectra of the (Sn–50Bi–2Zn)–7Ga oxide surfaces (a), the relevant Sn (b), Bi (c), ZnO (d), Ga (e), Ga2O3 (f), and O 1s (g).
Materials 13 05461 g006aMaterials 13 05461 g006b
Figure 7. Scheme of the oxide structure and the Pilling-Bedworth ratio.
Materials 13 05461 g007
Table 1. The compositions of the alloys measured by X–ray fluorescence (XRF).
Designed CompoundsXRF Results (wt.%)
SnBiZnGa
Sn–50Bi–2Zn48.2949.572.140
(Sn–50Bi–2Zn)–1Ga47.6149.511.910.97
(Sn–50Bi–2Zn)–3Ga46.6548.571.872.91
(Sn–50Bi–2Zn)–5Ga45.6247.581.864.94
(Sn–50Bi–2Zn)–7Ga44.7346.541.816.92
Table 2. The first stage oxidation rate constant and activation energy.
Alloysk1 (10−3∙mg∙cm−2∙min−1)Q (kJ∙mol−1)
Sn–50Bi–2Zn7.1112.05
(Sn–50Bi–2Zn)–1Ga3.7115.69
(Sn–50Bi–2Zn)–3Ga1.3721.27
(Sn–50Bi–2Zn)–5Ga1.1122.45
(Sn–50Bi–2Zn)–7Ga1.1622.20
Table 3. XPS curves of related elements and oxides in the experiment.
Elements and OxidesSn 3d (eV)Bi 4f (eV)Zn 2p (eV)Ga 2p (eV)Ga 3d (eV)
Sn [23]484.9, 493.3
SnO [23]486.3
SnO2[25]487.3
Bi [24] 157, 162.3
Bi2O3 [24,25] 158.1–159.5
Zn [26] 1021.8, 1044
ZnO [26] 1021.7
Ga [26] 1116.6, 1143.4
Ga2O3 [26] 20.7
Table 4. The compositions of the oxide films measured by XPS (Atomic %).
SamplesSnBiZnGaO
Sn–50Bi–2Zn50.365.959.2334.47
(Sn–50Bi–2Zn)–7Ga24.145.3313.1433.432.24
Table 5. Gibbs free energy of the elements in the experimental materials [27].
Oxidation ReactionΔGθ/(J·mol−1)
298 K400 K600 K800 K
Sn–SnO−302.61−309.06−325.03−344.30
Sn–SnO2−596.33−602.56−619.43−641.61
Bi–Bi2O3−615.89−633.08−675.29−725.87
Zn–ZnO−361.08−366.18−379.44−396.05
Ga–Ga2O3−1114.43−1124.63−1152.28−1187.79
Publisher’s Note: MDPI stays neutral with regard to jurisdictional claims in published maps and institutional affiliations.

