Article

Magnetic Properties and the Electronic Structure of the Gd0.4Tb0.6Co2 Compound

1
Institute of Physics, University of Silesia in Katowice, 75 Pułku Piechoty 1A, 41-500 Chorzów, Poland
2
Institute of Materials Engineering, University of Silesia in Katowice, 75 Pułku Piechoty 1A, 41-500 Chorzów, Poland
*
Author to whom correspondence should be addressed.
Materials 2020, 13(23), 5481; https://doi.org/10.3390/ma13235481
Submission received: 26 October 2020 / Revised: 27 November 2020 / Accepted: 27 November 2020 / Published: 1 December 2020

Abstract

:
We report on the comprehensive experimental and theoretical studies of magnetic and electronic structural properties of the Gd0.4Tb0.6Co2 compound crystallization in the cubic Laves phase (C15). We present new results and compare them to those reported earlier. The magnetic study was completed with electronic structure investigations. Based on magnetic isotherms, magnetic entropy change (ΔSM) was determined for many values of the magnetic field change (Δμ0H), which varied from 0.1 to 7 T. In each case, the ΔSM had a maximum around room temperature. The analysis of Arrott plots supplemented by a study of temperature dependency of Landau coefficients revealed that the compound undergoes a magnetic phase transition of the second type. From the M(T) dependency, the exchange integrals between rare-earth R-R (JRR), R-Co (JRCo), and Co-Co (JCoCo) atoms were evaluated within the mean-field theory approach. The electronic structure was determined using the X-ray photoelectron spectroscopy (XPS) method as well as by calculations using the density functional theory (DFT) based Full Potential Linearized Augmented Plane Waves (FP-LAPW) method. The comparison of results of ab initio calculations with the experimental data indicates that near TC the XPS spectrum collects excitations of electrons from Co3d states with different values of exchange splitting. The values of the magnetic moment on Co atoms determined from magnetic measurements, estimated from the XPS spectra, and results from ab initio calculations are quantitatively consistent.

1. Introduction

Magnetic properties of Laves phase compounds have recently been of great interest to researchers [1,2,3,4]. A relatively simple crystal structure, facilitating the interpretation of the investigation results, was the main reason for this. In this family of materials, special attention should be paid to Laves phases containing rare-earth (R) and transition metal (T) atoms. Conventional representatives of this class of compounds are the RCo2, the magnetic properties of which strongly depend on the kind of rare earth metal involved in the alloy. The RCo2 compounds with non-magnetic R-ions such as Y or Lu show enhanced Pauli paramagnetism and undergo a metamagnetic transition. Under the influence of an external magnetic field exceeding a certain critical Hc value, a transition from a paramagnetic to a ferromagnetic state occurs [5] accompanied by the increase of initially negligible magnetic moment on the Co site even by 0.5 μB. [6,7]. In the RCo2 compounds with magnetic R ions, in the ordered state, the molecular field Hmol may exceed the critical field required to induce the metamagnetic transition in the d-electron subsystem [5,8]. The molecular field enhanced by the external magnetic field can easily exceed the critical value Hc, resulting in an increase of the magnetic moment of Co up to a value of about 1 μB [5,8,9]. It is known that RCo2 compounds show a magnetic structure with parallel or antiparallel alignments of the magnetic moments of R and Co ions, for light or heavy R elements, respectively [8]. Substitution of other kinds of atoms with RCo2 results in a new family of compounds called pseudo-binaries like the R(Co1−xTx)2, the R1-yR’yCo2 or even four-component R1−yR’y(Co1−xTx)2 compounds. They are particularly interesting because of additional interactions between magnetic moments (4f’-4f, 4f-3d, 4f’-3d, and others) which may significantly alter the magnetic properties of the original material but also strongly modify their electronic structure. RT2 intermetallics are also known as materials exhibiting a significant magnetocaloric effect (MCE) [10]. The value of MCE in these compounds usually has its maximum around the Curie temperature (TC) and can be quite high in the case of the first-order phase transition (FOPT). The magnetic materials for which TC is located near room temperature are particularly attractive due to the possibility of using them for magnetic refrigeration in consumer devices. [11]. This technology of cooling is more efficient than gas compression refrigeration [12]. MC materials can also be applied in passive cooling processes to control heating in power conversion applications [13] as well as in medicine, e.g., in the treatment of malignant tumors by the method of hyperthermia [14].
Among the materials with TC near room temperature, there is one composition (x = 0.6) in the Gd1−xTbxCo2 series studied by Zhou et al. [15], where the MCE was determined only for Δμ0H = 2 T. In our study, we focused on more detailed and extended magnetic investigations of the Gd0.4Tb0.6Co2 compound, for many values of the magnetic field change (Δμ0H) varying from 0.1 to 7 T, and in a broader temperature range. Besides the determination of the magnetic entropy change ΔSM, we additionally calculated the relative cooling power parameter RCP and the refrigeration capacity, RC. Considering the Gd0.4Tb0.6Co2 as a basis for the new class of multi-component compounds, we have studied its electronic structure, particularly in the valence band range, which is essential for magnetic properties. The study of the electronic structure was conducted experimentally using XPS (X-ray Photoelectron Spectroscopy), and theoretically by ab initio calculations. Our results are completely new for the compound under investigation. Moreover, using the two-sublattice model, in the mean-field theory (MFT) approximation, the exchange integrals JRR, JRCo, and JCoCo were evaluated. Within this theory, we determined the magnetic moment of Co atoms μCo-MFT and compared it with ts values obtained by other methods.

2. Experimental and Computational Details

The Gd0.4Tb0.6Co2 samples were prepared by the arc melting method from high-purity elements (99.99% purity) under an argon atmosphere. Excess amounts of 1 wt % of gadolinium and terbium were added to overcome weight losses during the melting. To obtain a high homogeneity of compounds, the samples were re-melted several times. Afterwards, the as-cast samples were wrapped in tantalum foil, placed in a quartz tube, and annealed at 800 °C for two weeks. The crystal structure was determined by the X-ray diffraction technique (XRD) using an Empyrean PANalytical diffractometer. The measurements were performed at room temperature with Cu Kα source and 2θ changing from 15 to 140 degrees. All magnetic measurements were carried out using a SQUID magnetometer MPMS XL–7 (Quantum Design Inc., San Diego, CA, USA) in the temperature range from 2 to 400 K under a magnetic field of up to 7 T. The electronic structure of the investigated compound was studied using the XPS method. The XPS spectra were obtained with monochromatized Al Kα radiation ( = 1486.6 eV) at room temperature using a PHI 5700/660 spectrometer (Physical Electronics Inc., Eden Prairie, MN, USA). All spectra were measured immediately after breaking the sample in the vacuum of 10−9 Torr. The breaking in the high vacuum resulted in clean surfaces free of oxygen and carbon contamination.
The electronic structure of Gd0.4Tb0.6Co2 was calculated employing the ab initio DFT based full-potential linearized augmented plane waves (FP-LAPW) method [16] using the WIEN2k package (WIEN2k_19.1, released 25 June 2019, Institute of Materials Chemistry, TU Wien, Vienna, Austria) [17]. The electronic states of constituent atoms are divided into core (strongly bound), valence band, and weakly bound core states described by local orbital functions [16]. Accordingly, the following electronic configurations were assumed: Tb–[Kr+4d10] {5s25p6}LO(6s24f 9)VB; Gd–[Kr+4d10]{5s25p6}LO(6s24f 75d1)VB and Co–[Ne]{3s23p6}LO(3d74s2)VB. For the core states, the fully relativistic DFT formalism was applied while the local orbitals (LO) and VB states were treated within the scalar relativistic approximation. For the LO and VB states, the spin-orbit (SO) interaction was taken into account using the second variational method [16]. A generalized gradient approximation for the exchange-correlation (XC) potential parametrized for solids (PBEsol) [18] was used. To account for the enhanced Coulomb correlation in the group of R4f states we have used the LDA + U formalism [19]. In the present study, we have taken an effective Coulomb correlation parameter Ueff equal to 6.5 eV and 7.1 eV for Tb [20] and Gd [21], respectively. The radii of muffin-tin spheres were assumed 0.1376 nm and 0.1217 nm for R and Co, respectively. The following values of parameters decisive for the accuracy of calculations employing WIEN2k code were assumed: lmax = 12, Gmax = 14, and Kmax = 9/RMT. The k mesh division 11 × 11 × 11 (714 k-vectors in the IBZ) used in calculations was tested to ensure a total energy convergence of 0.01 eV/fu. For simulations of the fractional concentration of R atoms in Gd0.4Tb0.6Co2 a conventional unit cell comprising eight formula units of TbCo2 was employed basing on which the superstructures were prepared in which three Tb atoms were replaced by the Gd ones.

3. Results and Discussion

3.1. Crystal Structure

Figure 1 presents the X-ray diffraction patterns of the investigated compound. The crystal structure was refined using the Rietveld method, and the analysis was carried out using the non-commercial Maud software [22,23]. The analysis showed that the Gd0.4Tb0.6Co2 crystallized in the MgCu2 type of structure (Fd-3m space group). The sample was found homogeneous and free of other phases. The refined cell parameter was equal to 7.2563 ± 0.0010 Å, slightly larger than that reported by Zhou [15] (7.2285 Å).

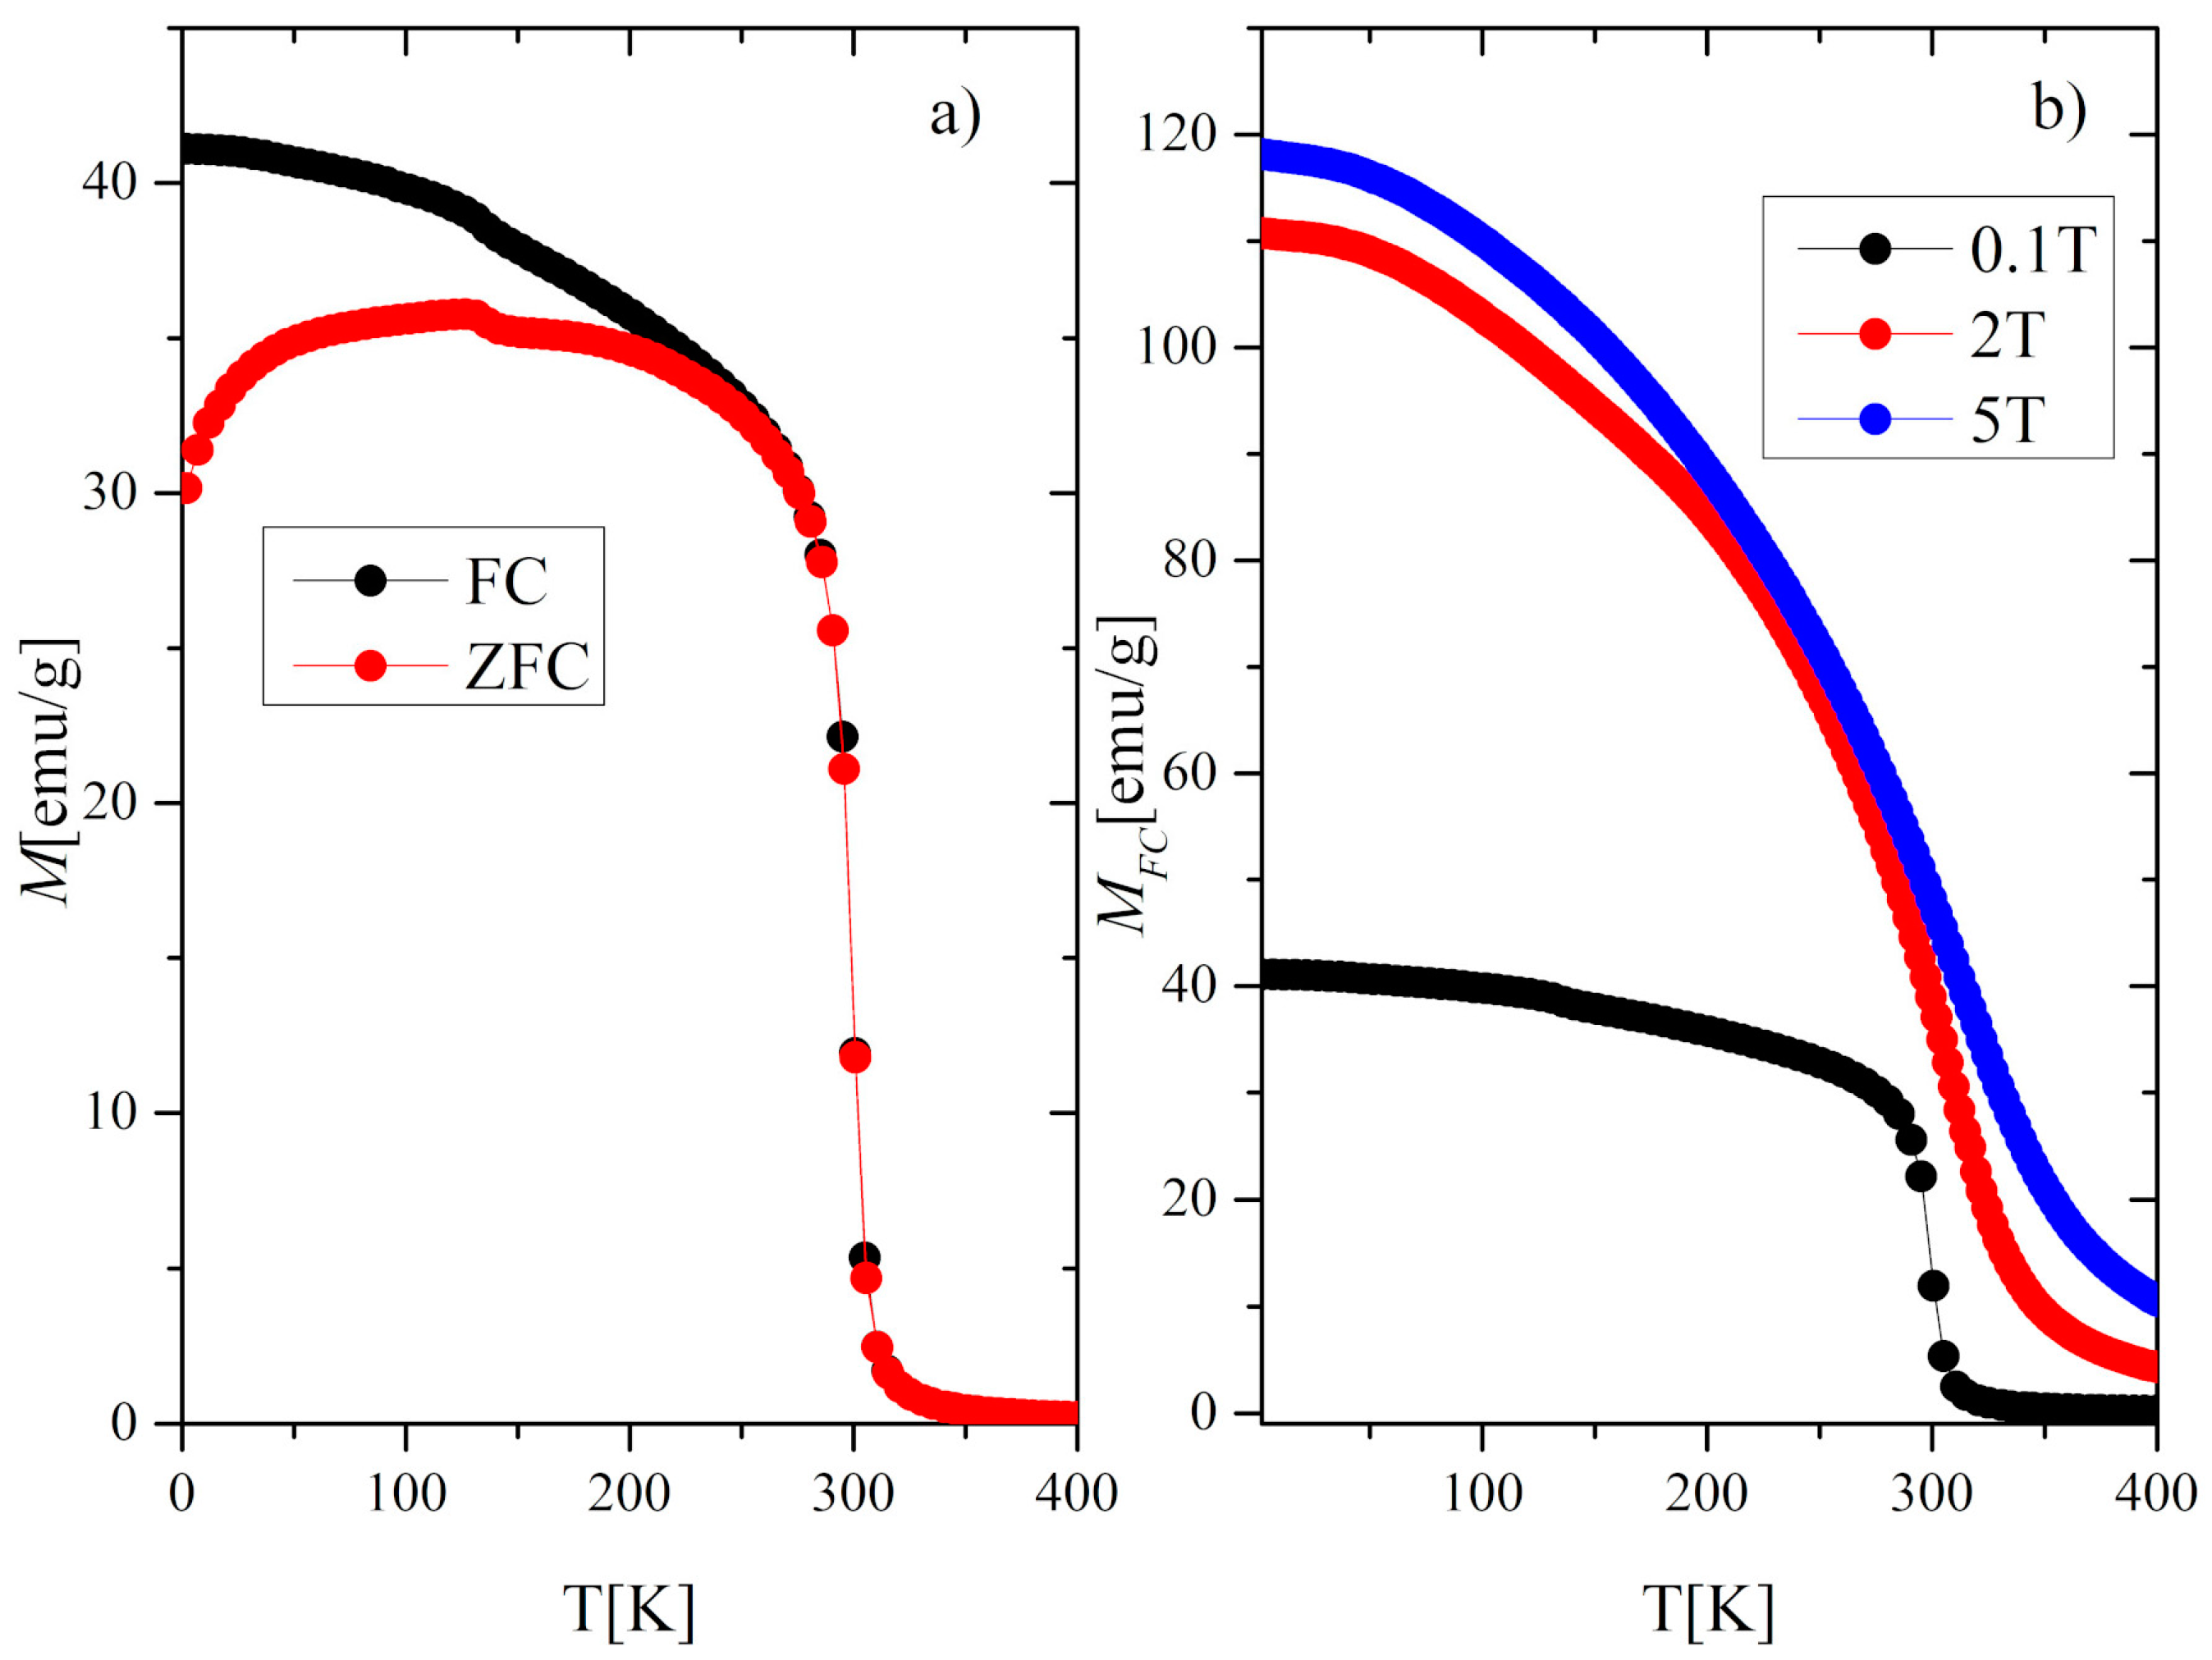
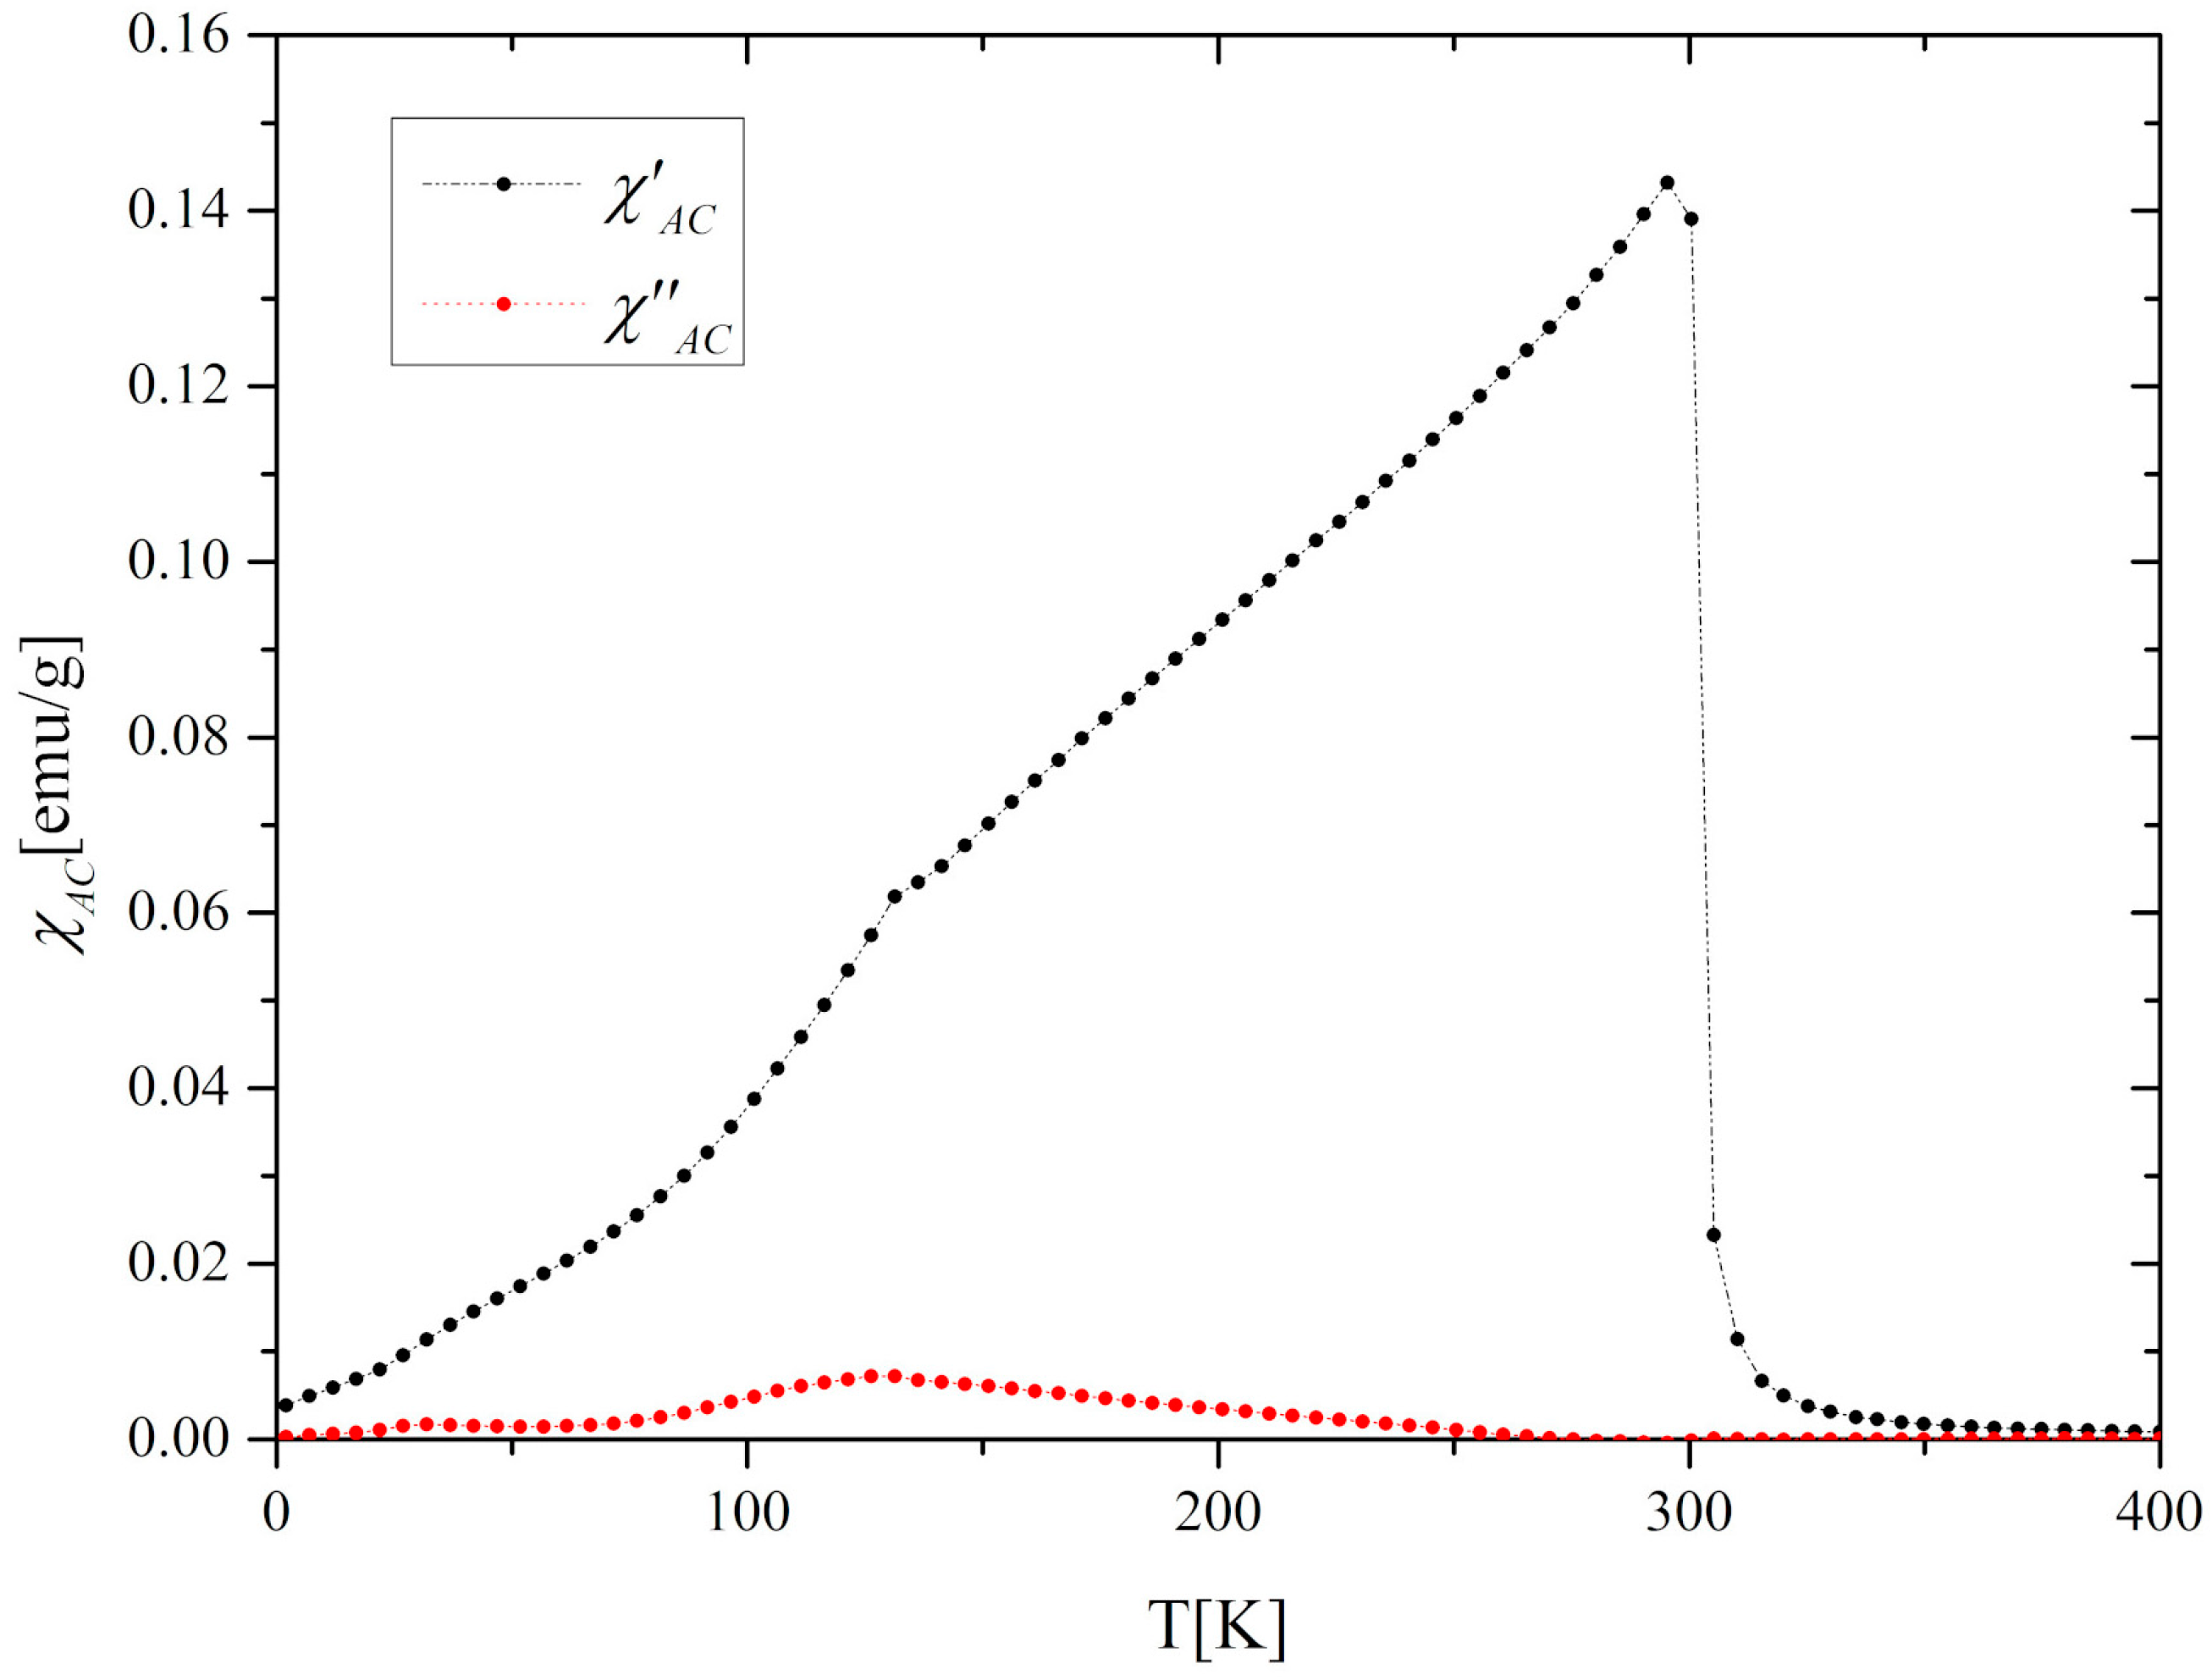
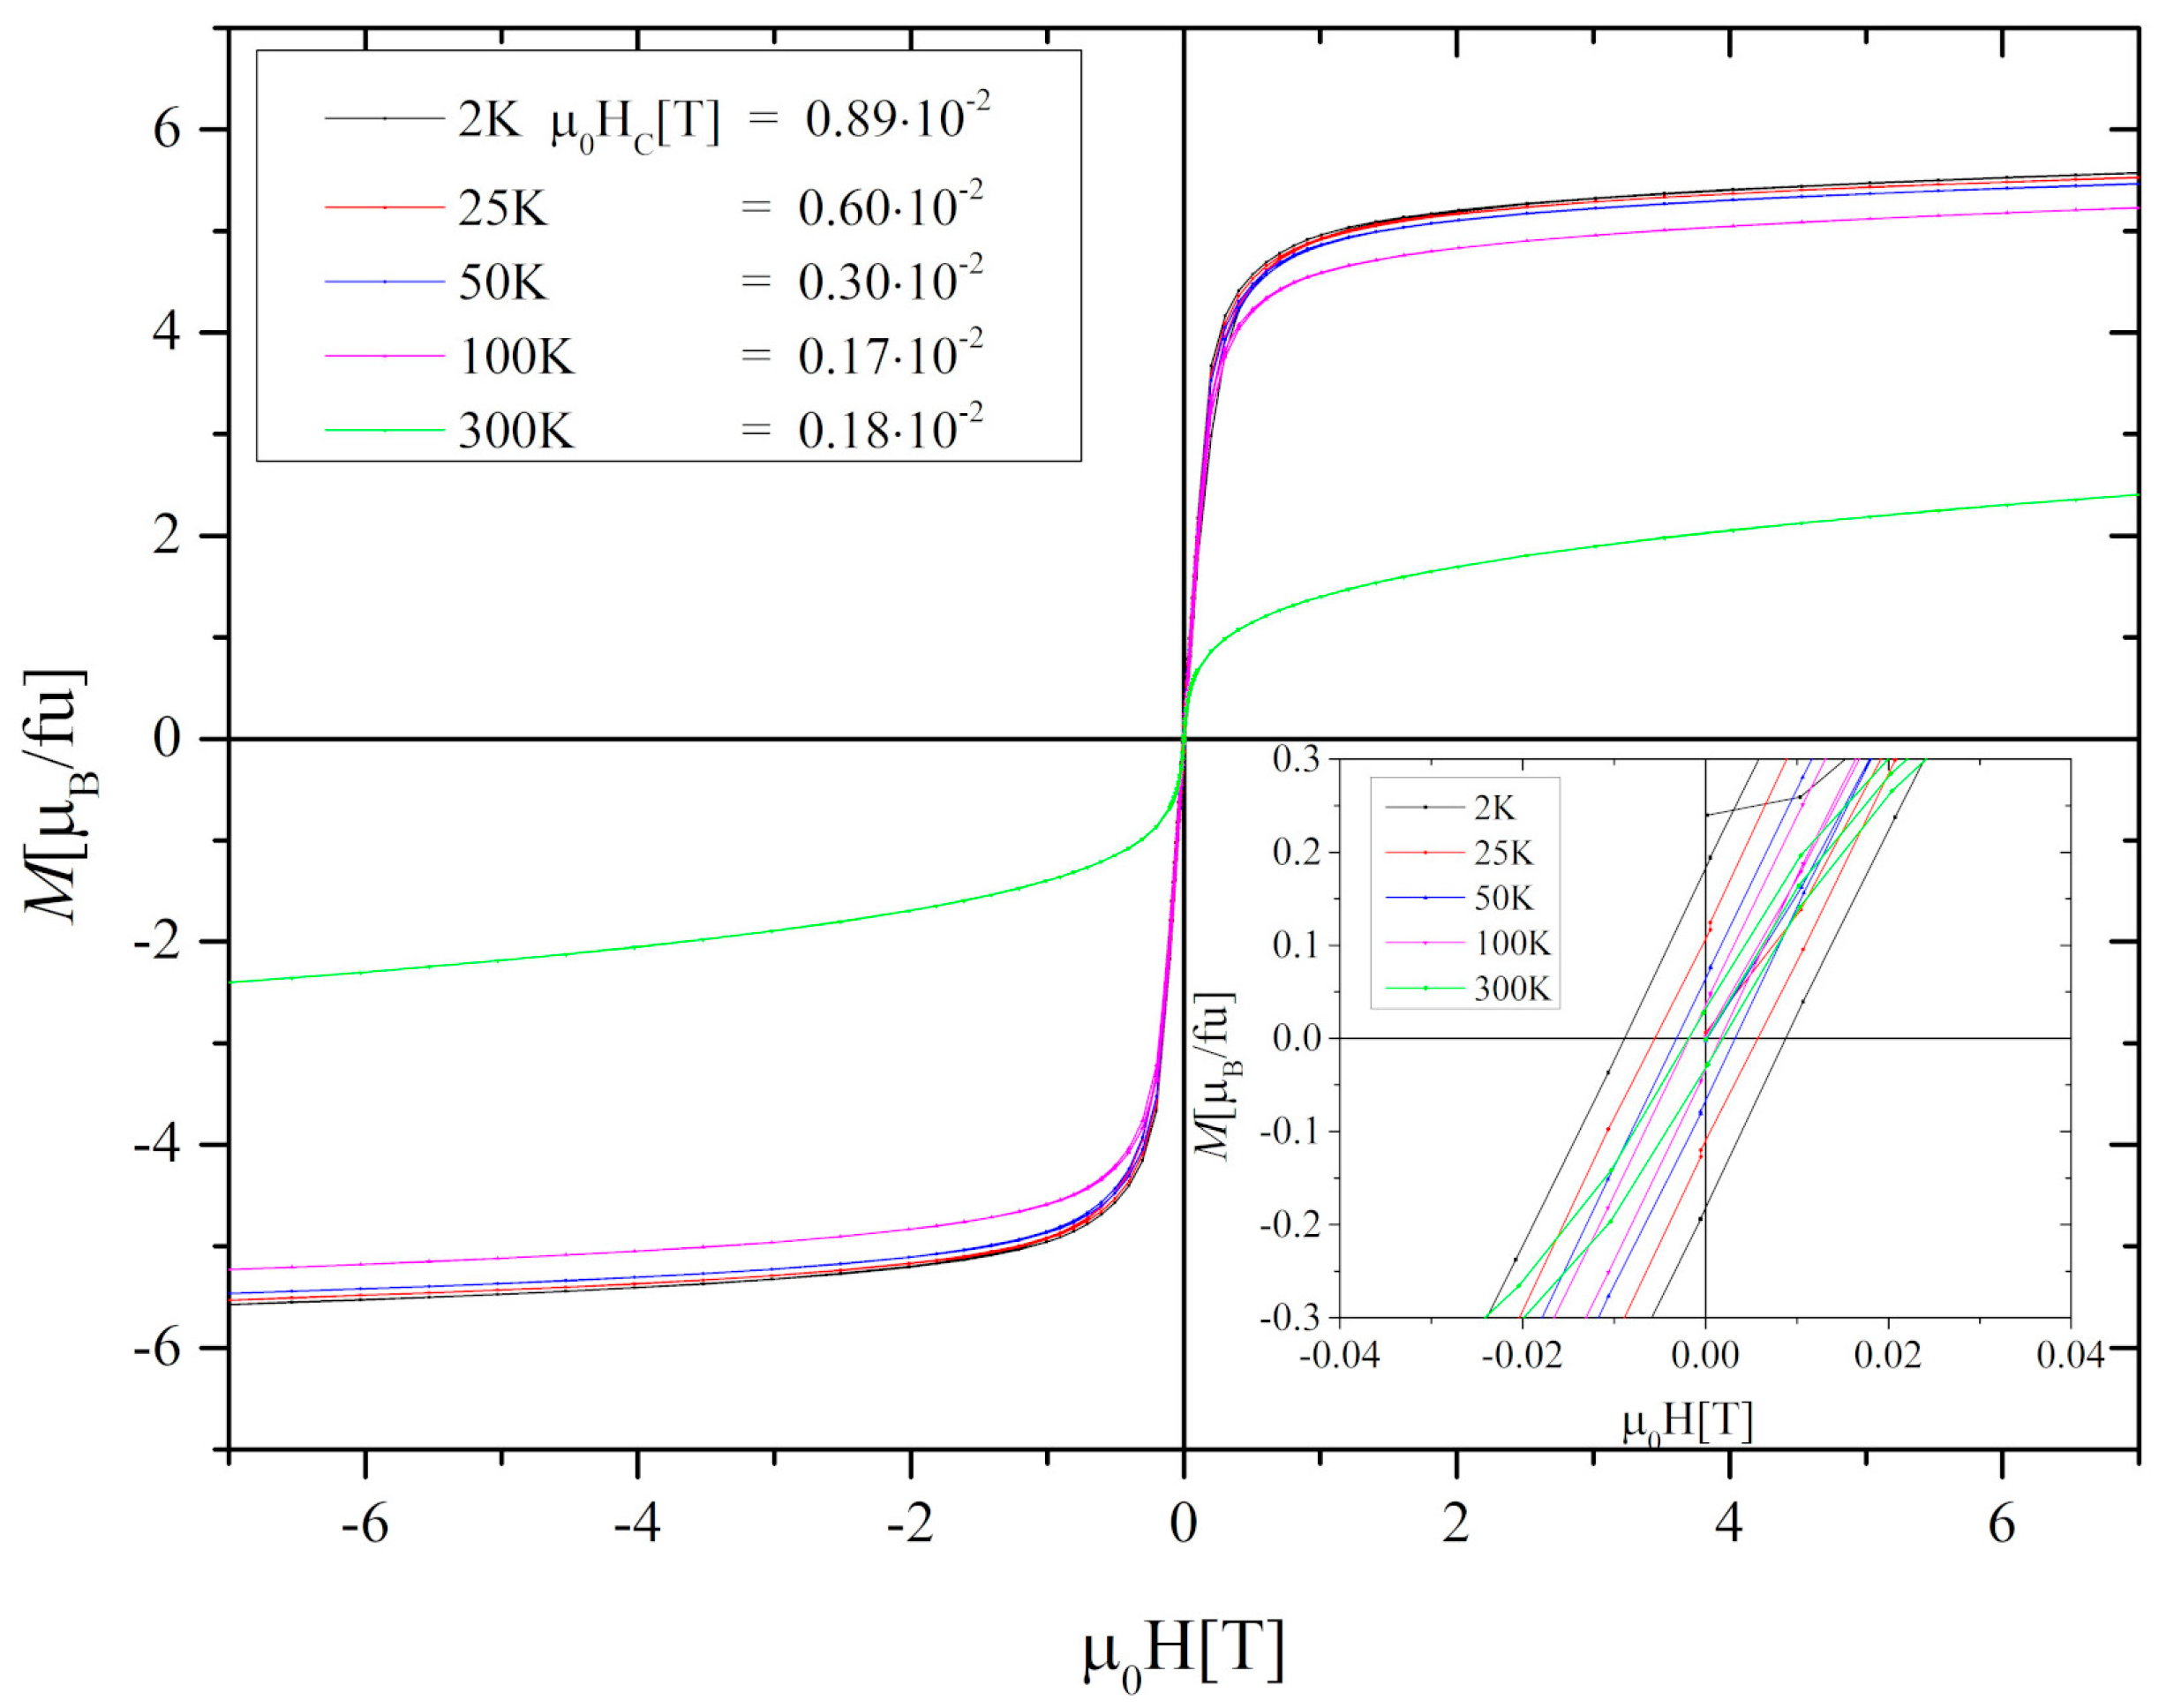
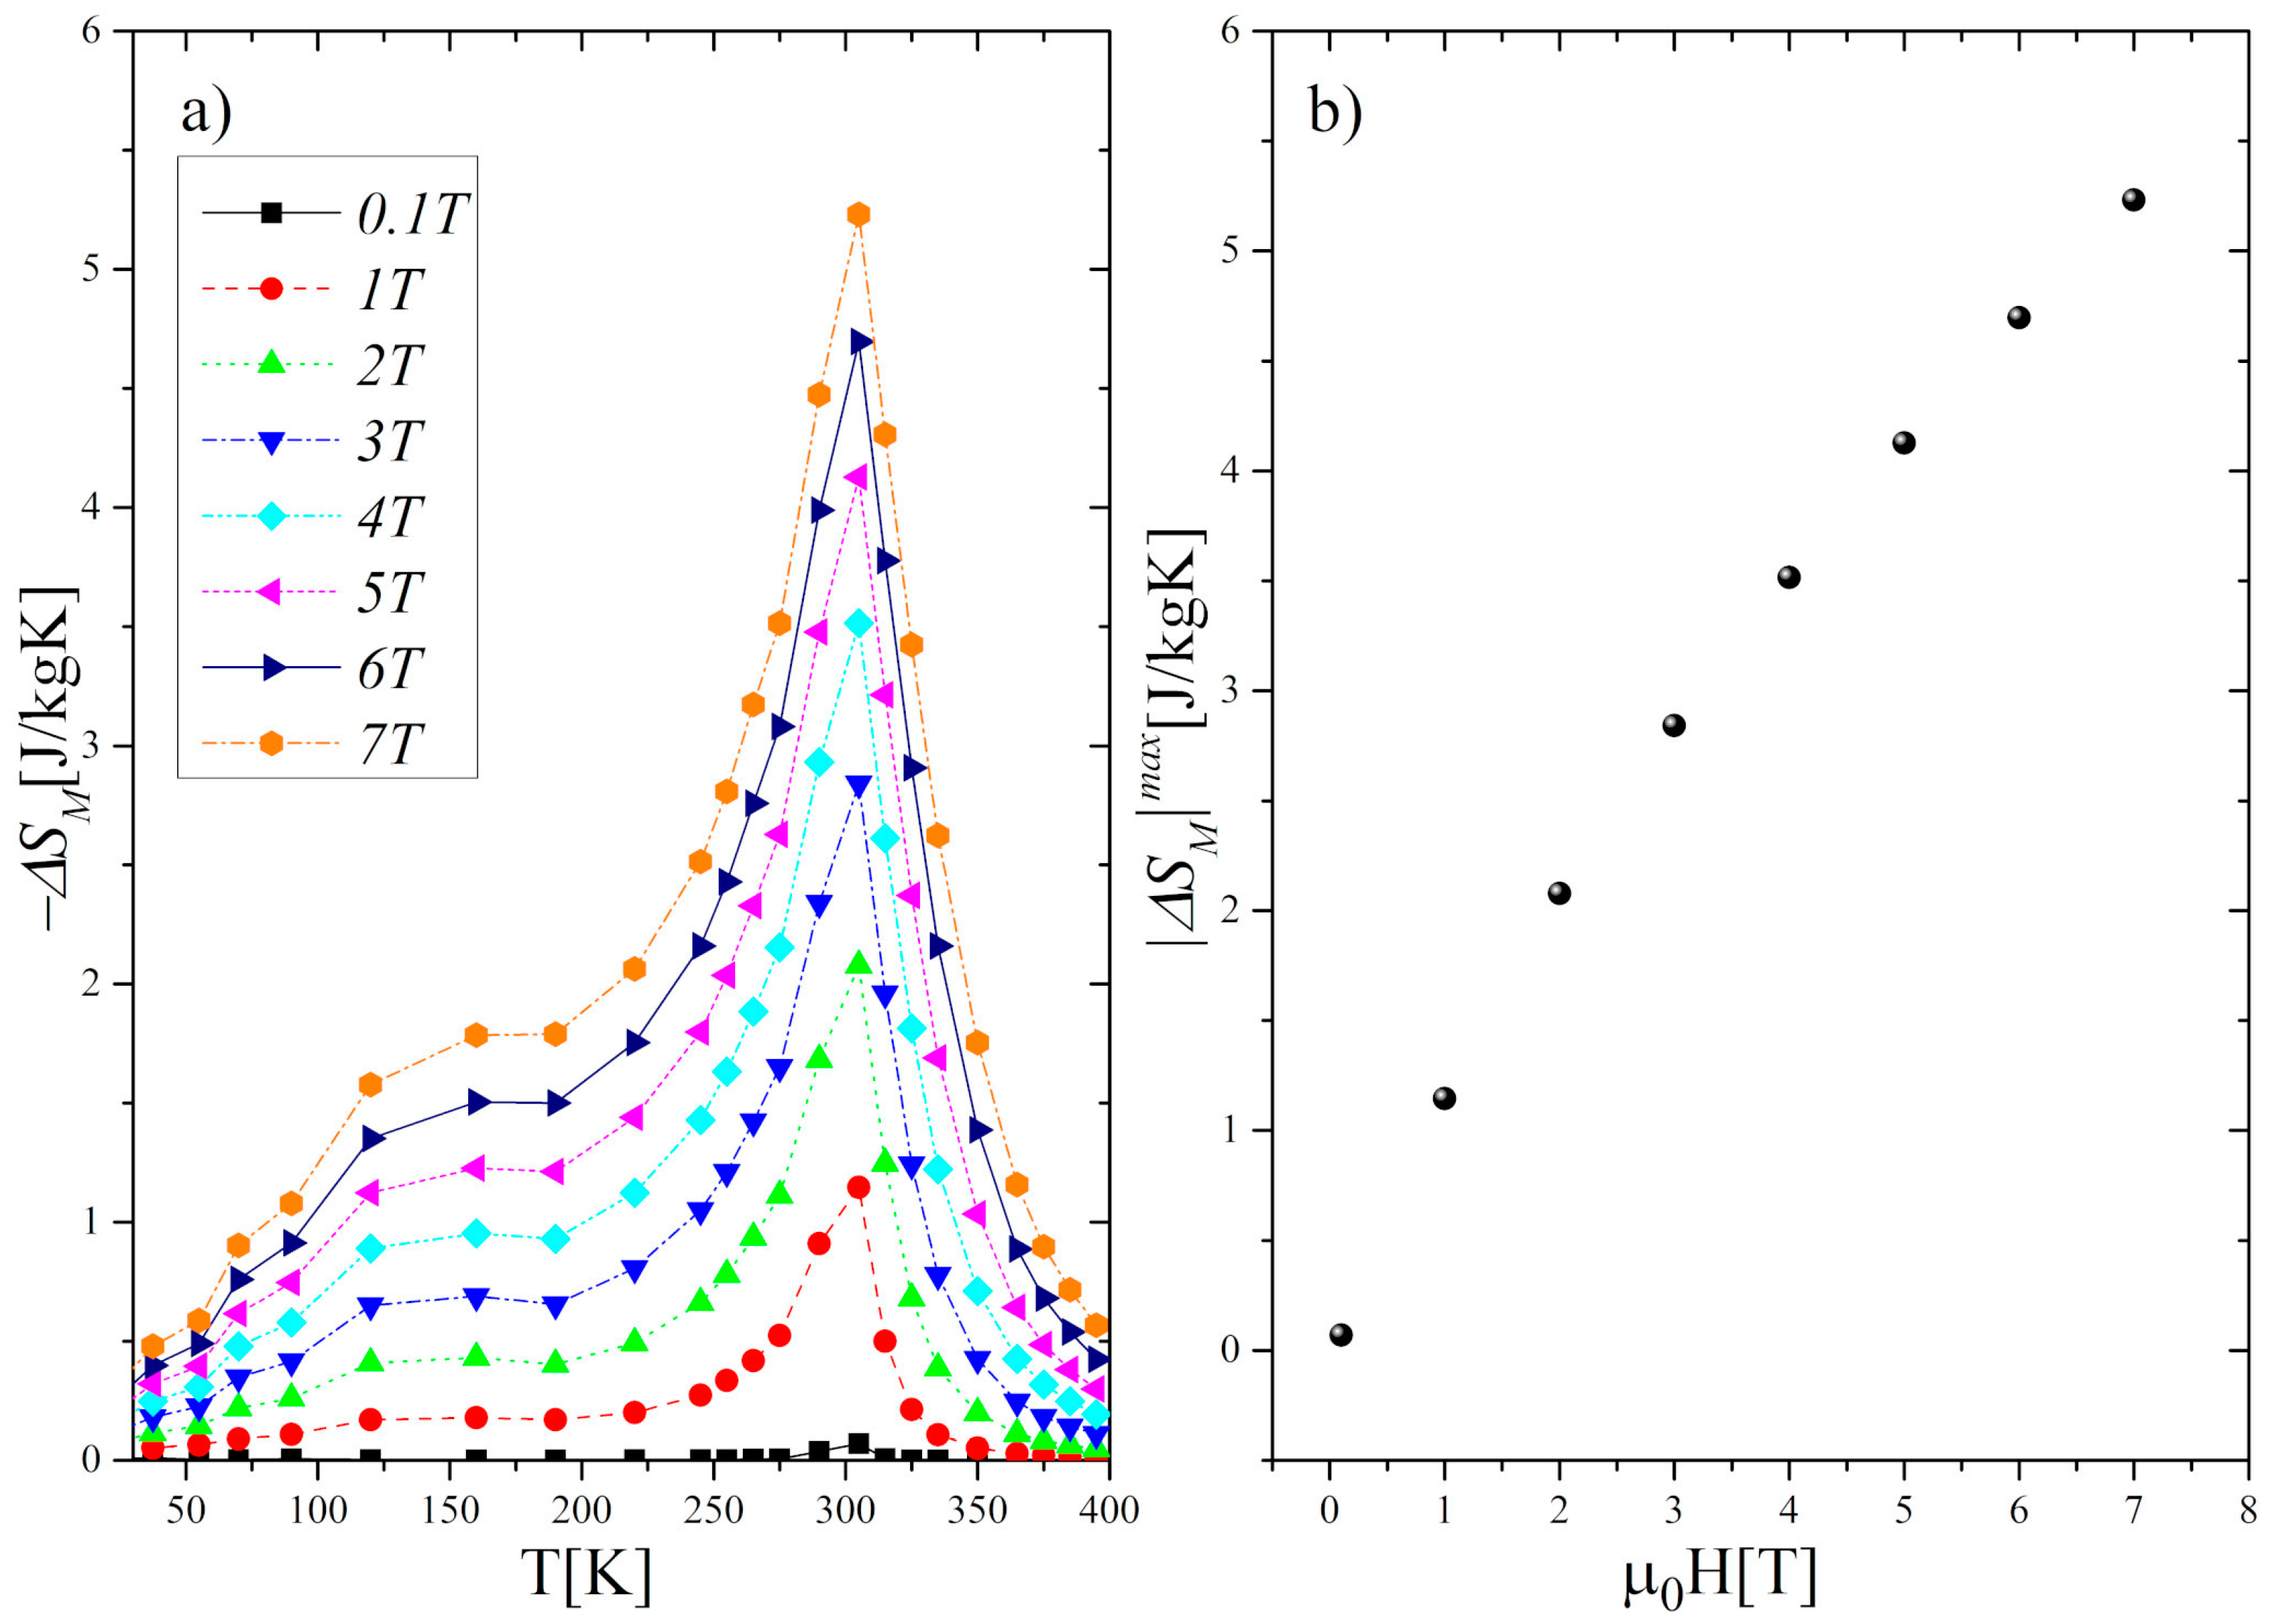
3.2. Magnetic and Magnetocaloric Properties
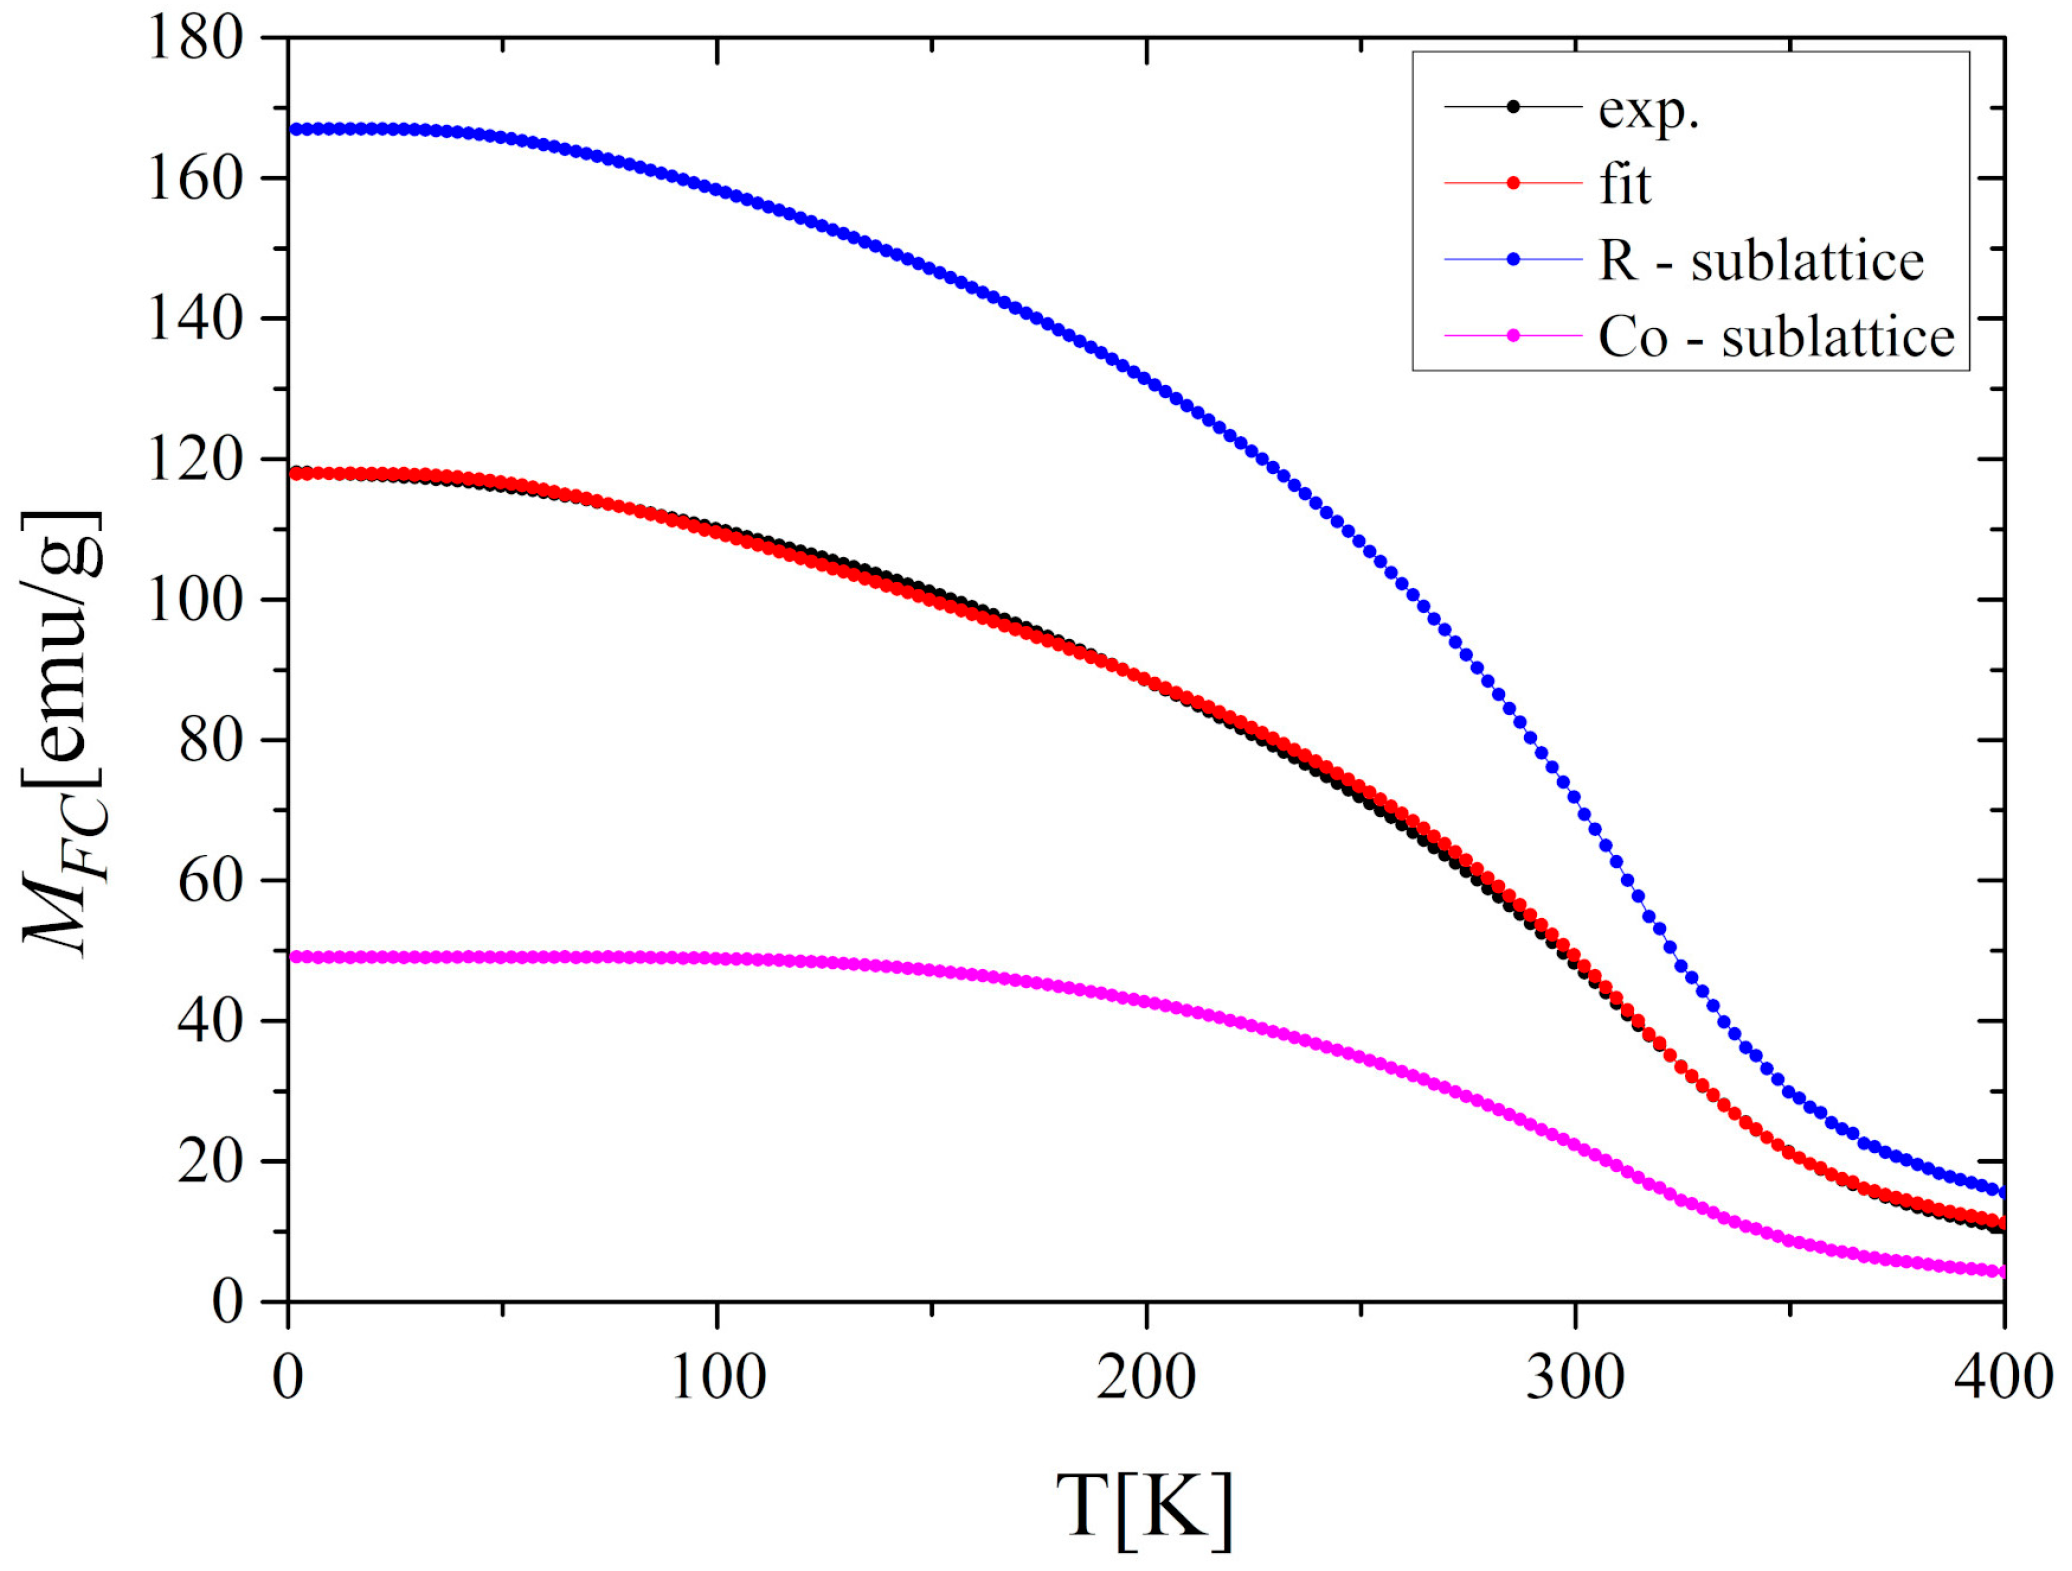
The temperature dependence of the magnetization M(T) of the Gd0.4Tb0.6Co2 compound in zero-field cooling (ZFC) and field cooling (FC) modes at the external magnetic field of 0.1T is presented in Figure 2a. These thermomagnetic curves exhibit irreversible behavior in the low-temperature range, which often happens in this kind of compounds [10,24]. The magnetic ordering temperature TC estimated from the minimum value of dM/dT was equal to 300.7 K in both ZFC and FC modes. A peculiarity which is visible in Figure 2a at 136 K may be attributed to the partial reorientation of the Tb spin toward the easy axis direction. The effect is also reflected in AC magnetic susceptibility χAC at the same temperature (Figure 3). The application of a higher magnetic field of 2T and 5T caused the disappearance of this characteristic feature (Figure 2b). A similar effect was observed for TbNi2, where it was additionally confirmed by the elastic neutron diffraction [25].
The hysteresis loops measured at 2 K, 25 K, 50 K, 100 K, and 300 K show minimal hysteresis losses with the value of the coercive field decreasing from 0.89 × 10⁻² T to 0.18 × 10⁻² T at 2 K and 300 K, respectively (Figure 4). Moreover, no saturation has been found even at μ0H = 7 T.
Using M(H) data at 2 K, the saturation magnetization (μS) was determined from extrapolation to zero of 1/H in the 1/H vs. M dependence. The procedure gave μS = 5.85μB. Assuming that the total magnetic moment of Gd0.4Tb0.6Co2 is given by μS = 0.4μGd + 0.6μTb + 2μCo and taking μGd = 7μB, μTb = 9μB, (calculated using the formula: μ R = g R μ B J R , where g R is a Landé factor and J R is a ground state total angular momentum [26] we have got the value of the magnetic moment of the cobalt atom μCo = −1.17μB. The negative sign indicates the antiparallel alignment of the R and Co moments. Figure 5a shows the isothermal magnetization M as a function of the applied magnetic field of up to 7 T. The Arrott plots (Figure 5b) indicate that the investigated compound undergoes a phase transition of the second-order (SOPT). To confirm the observation we determine the type of phase transition using the Landau expression for the magnetic free energy (F) [10]:
F =   1 2 a ( T ) M 2 + 1 4 b ( T ) M 4 + 1 6 c ( T ) M 6 μ 0 H M
The temperature dependence of Landau coefficients a(T), b(T), and c(T) is used to identify the type of the phase transition. They are accessible through the following relation between M and H:
μ 0 H = a ( T ) M + b ( T ) M 3 + c ( T ) M 5
Essentially, the order of the magnetic transition is governed by the sign of b(T). The first-order phase transition takes place if b(TC) < 0, while the second-order phase transition occurs when b(TC) ≥ 0.
The coefficients were determined by fitting the Equation (2) to magnetic isotherms μ0H(M) (Figure 5a). As it is visible in Figure 6 the a(T) exhibits a minimum in the vicinity of TC and the b(T) parameter is positive, which proves the second-order character of the phase transition, consistently with the conclusion based on our Arrott plots and in agreement with the results reported in [15].
It is known that in materials showing SOPT, the magnetic entropy change is lower than in those with FOPT; however, the SOPT materials usually have a broader working-temperature range which enhances their cooling efficiency (see Equation (4)), which is essential for potential applications, e.g., in magnetic refrigerators [27,28,29,30].
To calculate the magnetic entropy change ΔSM basing on the magnetic isotherms we used Maxwell’s relation:
Δ S M ( T , Δ H = H 1 H 0 ) =   H 0 H 1 ( M ( T ,   H ) T ) H d H
where H0 and H1 are the initial and final magnetic fields, respectively. The calculated values of the ΔSM as a function of temperature and magnetic field are presented in Figure 7.
As can be seen, the maxima of the entropy changes |ΔSM|max occur near TC, which is typical of compounds exhibiting SOPT. The value of |ΔSM|max obtained under magnetic field changes between 1 T and 7 T increased from 1.15 J/kgK to 5.23 J/kgK, respectively. Moreover, we found that the ΔSM curves are symmetric with respect to TC only in a limited temperature range (TC ± 50 K). Both the height and width of the curves increase monotonically with the growth of the magnetic field. In effect, the value of δTFWHM, defined as the full-width at half-maximum of the |ΔSM| peak, increased from 34 K at Δ(μ0H) = 1 T to 64 K at Δ(μ0H) = 7 T. To assess the cooling efficiency, we calculated the relative cooling power parameter RCP using the formula:
R C P =    | Δ S M | m a x    δ T F W H M
The cooling efficiency was also evaluated using the value of refrigerant capacity (RC) defined as the amount of heat that can be transferred from the cold end (at Tcold) to the hot end (at Thot):
R C =   T c o l d T h o t | Δ S M | m a x d T
The values of both parameters increased significantly with increasing magnetic field.
Thus, the RC parameter increased from 31.16 J/kg to 259.40 J/kg, whereas the RCP from 39.40 J/kg to 298.17 J/kg with a μ0H change from 1 T to 7 T.

3.3. MFT Analysis

To estimate the 3d–3d and 3d–4f exchange interactions in the Gd0.4Tb0.6Co2 compound, we considered its magnetic structure as consisting of two magnetic sublattices formed by R and Co moments. Making the assumption that magnetic moments of R and T(Co) atoms are directed oppositely, the magnetization M of the system can be treated as a superposition of MR and MT described by the formula:
M = |MRMT|
In the MFT approximation, the MR and MT magnetizations can be described as follows [9,31,32,33]:
    M R = N R μ B g R J R =   N R μ B g R J R B J R ( g R J R H R μ B k B T )
M T = N R μ B g T J T = N R μ B g T J T B J T ( g T J T H T μ B k B T )
  H R = 2 J R R Z R R ( g R 1 ) 2 N R g R 2 μ B 2 M R + 2 J R T Z R T ( g R 1 ) ( g T 1 ) N T g R μ B 2 M T + H e x t
H T = 2 J T R Z T R ( g R 1 ) ( g T 1 ) N R g R 2 μ B 2 M R + 2 J T T Z T T ( g T 1 ) 2 N T g T 2 μ B 2 M T + H e x t
where B is the Brillouin function, NT and NR are the numbers of T and R atoms per unit volume, μB is the Bohr magneton, g is the Landé factor, J is the total angular momentum, HR, HT refers to the magnetic field acting on the corresponding site, Hext is an external magnetic field, and kB is the Boltzmann constant. The exchange integrals JRR, JTT, and JRT (= JTR) can be determined by fitting the above equations to empirical thermomagnetic curves. For this purpose, we have used the M(T) dependence under a magnetic field of 5 T, which was strong enough to avoid the influence of domain effects and achieve a relatively high saturation (Figure 2b). Figure 8 compares the fitted curve with the experimental data and presents the results of the MFT analysis. Because the R sublattice consists of two kinds of rare-earth atoms (described by the Brillouin functions with different ground states) the presented analysis refers to an average value of R magnetic moment. Assuming that the average coordination numbers of R-R (ZRR), R-Co (ZRCo), Co-R (ZCoR), and Co-Co (ZCoCo) are equal: 4, 12, 6, and 6, respectively [33], we have obtained the following values of exchange coupling integrals: JRR = 1.9 × 10⁻²³ J, JRCo = −1.17 × 10⁻²² J and JCoCo = 3.59 × 10⁻²² J.
It should be noted that the order of magnitude of JRCo is the same as that obtained by Duc [9] for GdCo2 and TbCo2 compounds (1.88 × 10⁻²² J and 1.81 × 10⁻²² J, respectively). The negative sign of JRCo means the antiparallel coupling between R and Co moments. Taking μGd = 7 μB and μTb = 9 μB, and following the above assumptions, it is also possible to determine the average magnetic moment per Co atom. As a result, we got μCo-MFT = −1.22 μB which is very close to the value obtained from the magnetic measurements at 2 K (−1.17 μB) and from ab initio calculations (−1.28).

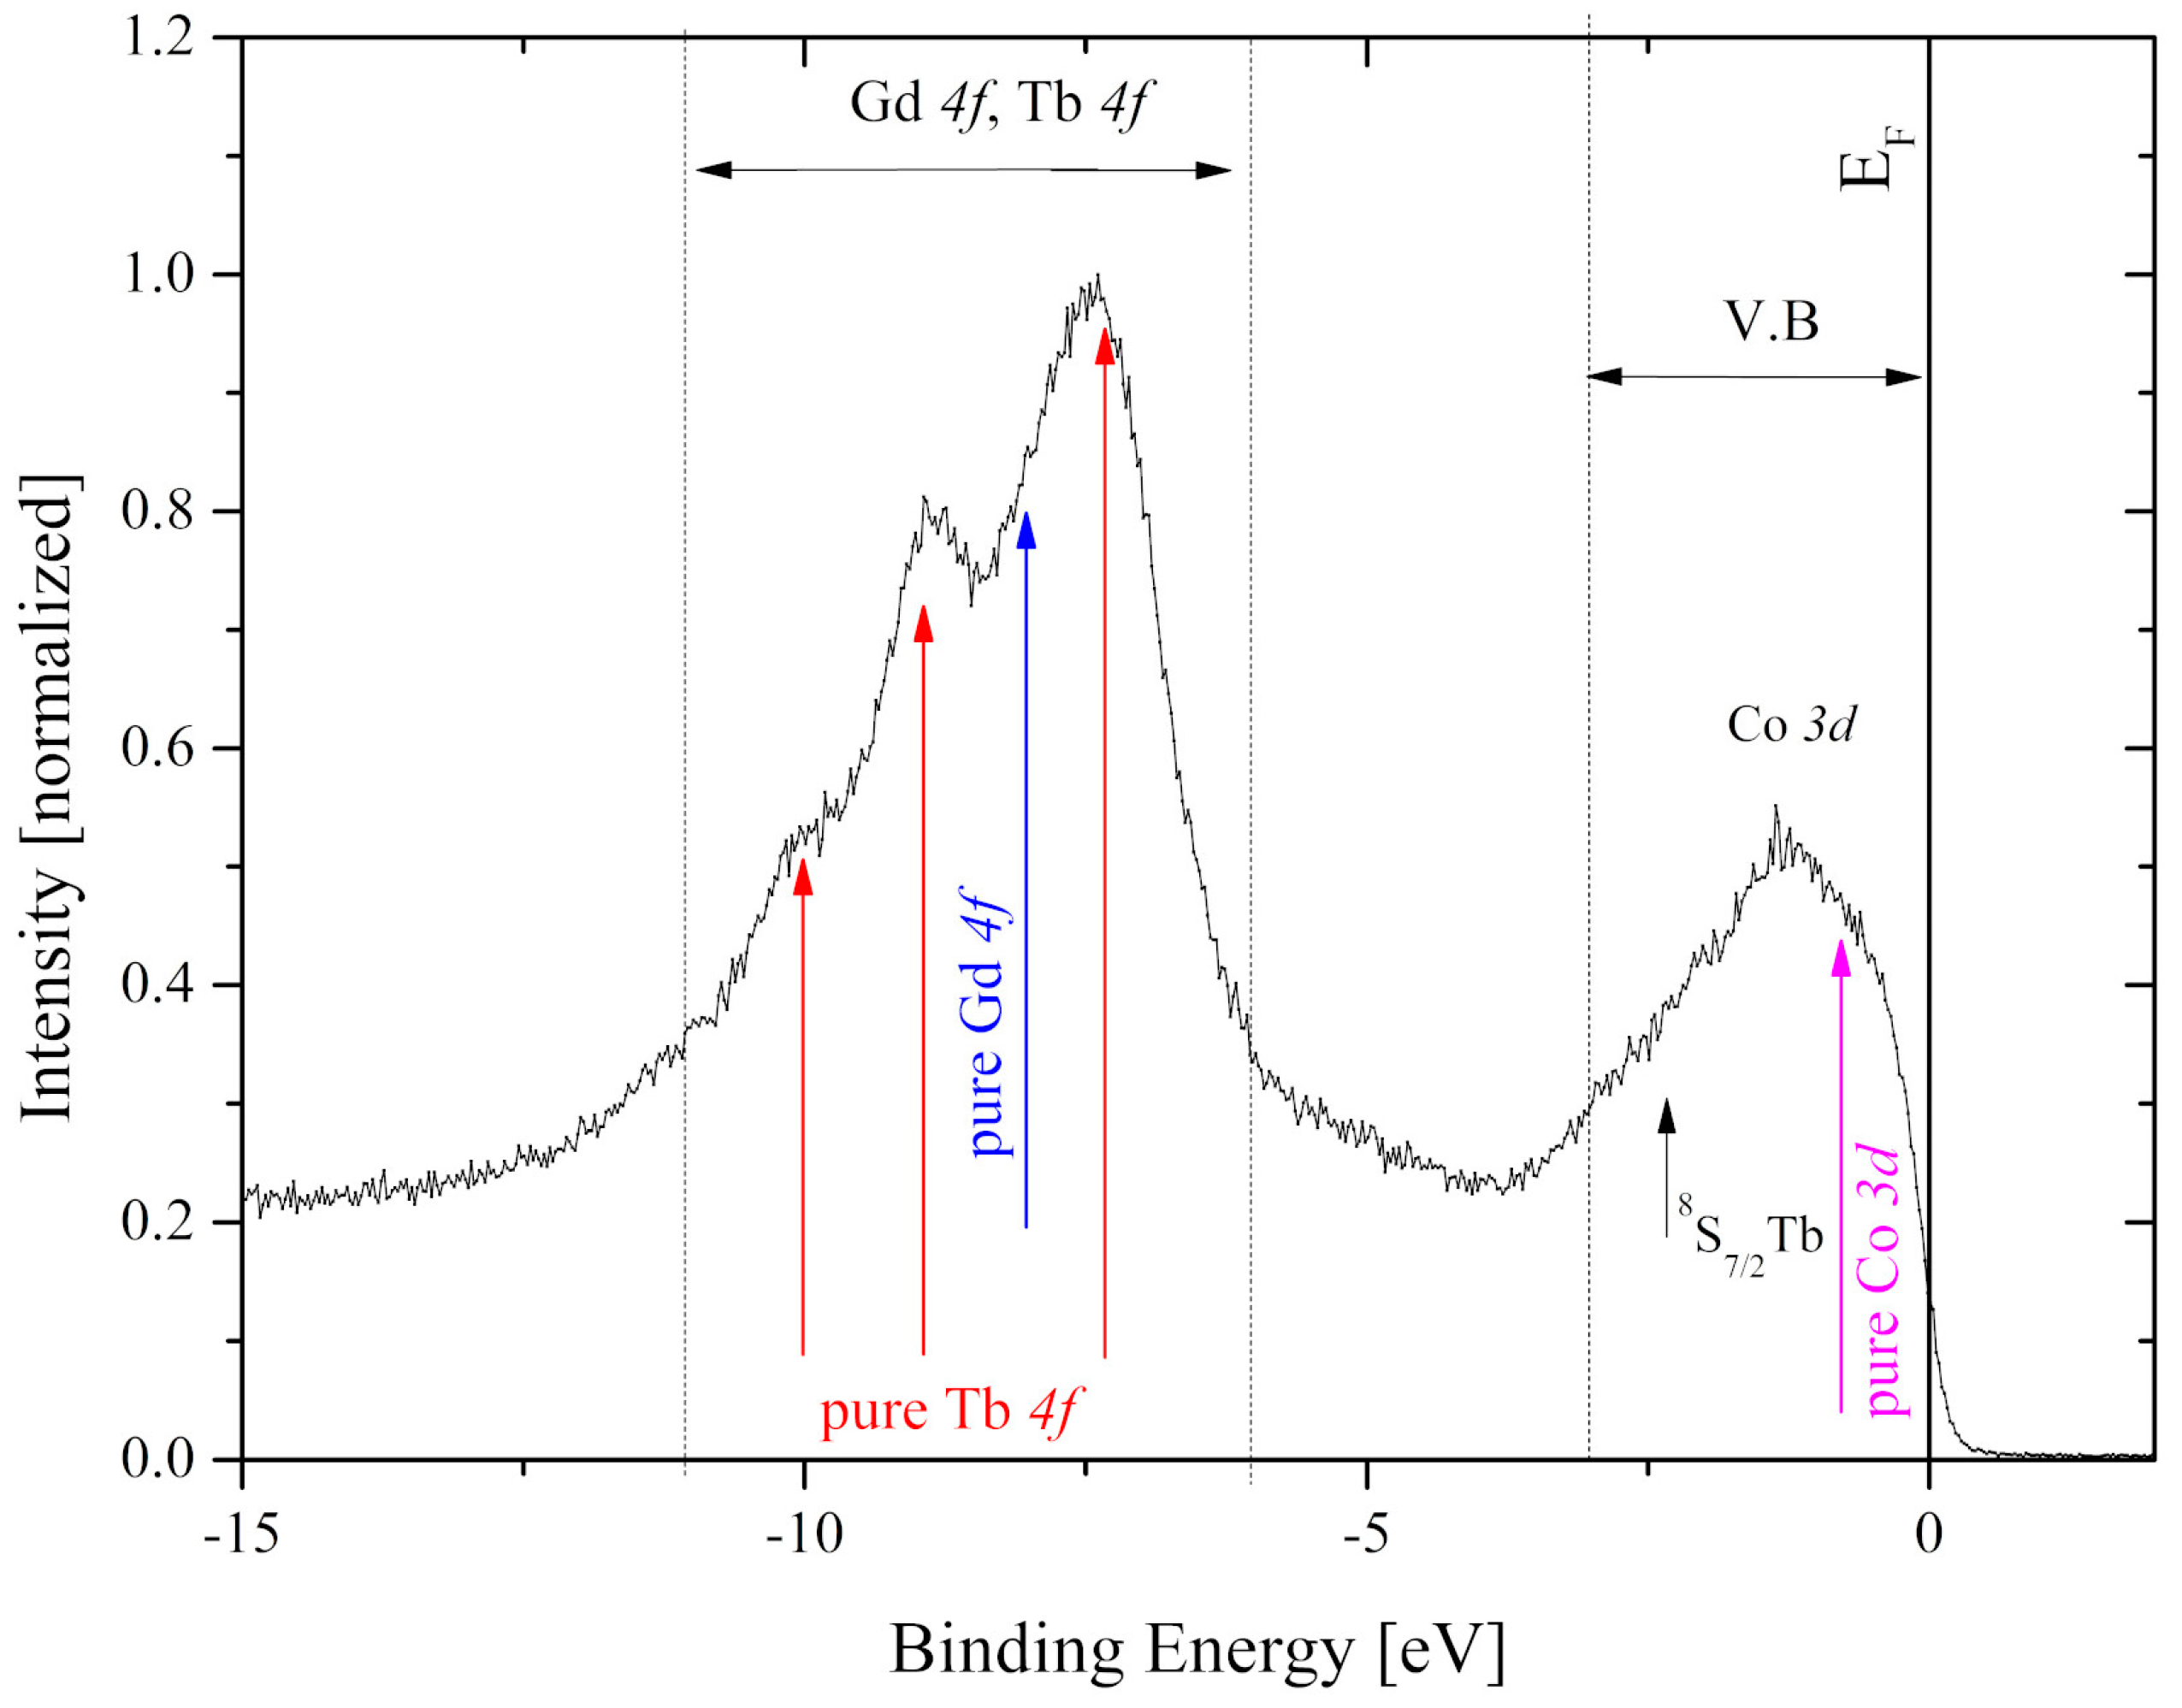
4. X-ray Photoelectron Spectroscopy (XPS)

The valence band spectrum of the Gd0.4Tb0.6Co2 compound in the binding energy range from −15 eV to −2 eV is presented in Figure 9.
In pure metals, 4f states are visible at −8 eV for Gd whereas Tb4f states, as a result of multiplet splitting, present several lines located at −2.5 eV (8S7/2), −7.4 eV, −9.1 eV, and −10.2 eV [34]. In the case of the compound under investigation, all majority spin 4f contributions overlap to form one wide band in the range from −11 eV to −6 eV. The shape of the band near the Fermi level is dominated by Co3d states and its width is about 4 eV. This energy region also contains contributions of R5d and Tb8S7/2 states, however, they are hardly visible on the XPS spectrum since they are obscured by Co3d states.
Figure 10 shows the calculated partial atomic, spin-resolved density of states (Figure 10a), and the total density of states (DOS) compared with the scaled XPS spectrum (Figure 10b).
The multiplet structure of Tb4f states, as the many-body effect, is not accounted for within the single-particle DFT calculations. Nevertheless, the GGA calculations with the Coulomb correlation corrections for Gd4f and Tb4f states reproduce the observed position of the 4f state’s manifold.
A significant discrepancy between the shape of the calculated DOS function and the XPS spectrum can be observed just below the Fermi energy, up to 1 eV of BE (Figure 10b). In this energy range, the XPS spectrum shows an evident bump while in the DOS function, a relatively deep valley occurs. The band structure of Co3d states in Gd0.4Tb0.6Co2, shown in Figure 10a, is very similar to the results of ab initio calculations reported for TbCo2 [20] and GdCo2 [35] Laves phases. It comprises two peaks separated by a valley of reduced DOS. The Fermi level is situated at the bottom edge of the upper peak of majority spin Co3d states (polarized toward the R magnetic moments) while the minority spin bands are almost fully occupied and located below the Fermi energy. In effect, there are no states which would be responsible for the formation of the bump in the XPS spectrum of the Gd0.4Tb0.6Co2 compound just below EF (Figure 10b). We suppose that the discrepancy between the calculated structure of the valence band and the XPS spectrum near the Fermi level is related to the thermodynamic conditions under which the experiment was conducted. It is worth noting that the total DOS, presented in Figure 10b, is the ground state property, while the XPS spectrum is taken near the Curie temperature, where the magnetic system of the compound is highly unstable. To explain the discrepancy, it is important to note that the magnetic properties of the investigated compound are the result of interplay of two magnetic subsystems: a system of persistent, localized magnetic moments of R ions (μR) and a system of local magnetic moments of Co ions (μCo) derived from spin-polarized Co3d itinerant states due to the exchange interaction with the R4f shell. In the vicinity of TC, because of strong thermal fluctuations of the R magnetic moments, the local magnetic field exerted by R magnetic subsystem on Co3d states may decrease below the critical value, which may imply a reduction of local spin polarization of Co3d states. Thus, the XPS spectrum may collect excitations of electrons from Co3d states with varying degrees of exchange splitting. We argue, that upon decreasing spin polarization and related exchange splitting of Co3d bands, the mutual shift of Co3d spin-polarized bands would result in filling the valley separating the peaks of the DOS just below EF. The effect may explain the occurrence of the bump observed in the XPS spectrum of Gd0.4Tb0.6Co2 in this energy range.
To check our conjecture, we combine the spin-polarized Co3d DOS of Gd0.4Tb0.6Co2 with the corresponding DOS calculated for isostructural LaCo2 compound in the paramagnetic state. Both Co3d DOS contributions, spin-polarized (in Gd0.4Tb0.6Co2), and paramagnetic (in LaCo2) are depicted in Figure 10c. Figure 10d compares the XPS spectrum of Gd0.4Tb0.6Co2 with a simulated mixture of fully spin-polarized (60%) and paramagnetic (40%) Co-spd DOS. It is noteworthy that the valley of reduced DOS, present in Figure 10b, is filled partially by non-spin-polarized Co3d states, which contribution to the XPS spectrum would result in the bump just below the Fermi level. Figure 10d shows a mixture of DOS with two limiting values of Co3d states exchange splitting. The variable magnitude of exchange splitting of Co3d states and the related shift of oppositely polarized Co3d bands may lead to a more complete filling of the valley of reduced DOS.
Figure 11 presents the Co3s line of the Gd0.4Tb0.6Co2 compound. Analyzing the Co3s multiplet splitting one can derive information about the magnetic moment of the cobalt atom. The multiplet splitting of the 3s spectra of 3d-metals is the result of the exchange interaction between unfilled 3d and ionized 3s shells. In effect, two final states are observed and the intensities of these peaks satisfy the equation [36]:
   I 1 I 2 = S + 1 S
where S is the spin of the unfilled 3d shell while I1 and I2 are the intensities of the main and the satellite 3s lines, respectively. The magnetic moment of the Co atom can be estimated using:
  μ C o = 2 μ B S ( S + 1 )
To obtain the I1/I2 ratio, necessary to calculate the   μ C o , the Co3s line (Figure 11) was fitted using the Doniach–Sunjić line shape [37]. The background of the spectrum was evaluated using the Touggard function and subtracted [38]. Using the above equations, we obtained the value of the Co magnetic moment equal to 0.95 μB ± 0.05 μB which is slightly lower than the value obtained from the magnetic measurements.

5. Conclusions

We synthesized a single-phase polycrystalline Gd0.4Tb0.6Co2 intermetallic compound with an MgCu2 type of structure. Magnetic measurements carried out over a wide temperature range confirmed that the magnetic phase transition for this compound is near room temperature (TC = 300.7 K). Both Arrott plots and Landau’s coefficients indicated that, in the investigated compound, we are dealing with the second-order phase transition. The value of the maximum entropy change |ΔSMmax| obtained under magnetic field changes μ0H of 7 T is equal to 5.23 J/kgK, which results in the RCP and RC parameters equal to 298.17 and 259.40 J/kg, respectively. The values are moderate compared to some other materials, however, they occur near room temperature, which is crucial for potential applications. The hysteresis loops, at all measured temperatures, showed minimal losses, which is desirable for practical applications in magnetic refrigeration. The value of the magnetic moment of Co determined from the saturation magnetization is comparable with those estimated based on the Co3s XPS spectrum, evaluated with the use of MFT analysis and calculated through the ab initio method. The values of exchange coupling parameters JRR, JRCo, and JCoCo obtained from MFT calculations have shown that the strongest interaction occurs between Co-Co spins and the weakest between R-R ones.
The shape of the valence band near the Fermi level is dominated by Co3d states. Ab initio calculations showed that R5d states also contribute slightly to this energy range. Our photo-emission measurements, combined with the band structure calculations, indicate that near TC, the XPS spectrum collects excitations of electrons from Co3d states with different values of exchange splitting. This explains the discrepancy between the measured spectrum and the calculated density of states near the Fermi level.
Summarizing, we have shown that the Gd0.4Tb0.6Co2 compound is a material with minimal hysteresis losses and reasonable RCP values at room temperature, which qualifies it for use in magnetic refrigerators. Furthermore, based on the results of our extended study of magnetic properties (which was completed for the first time by electronic structure investigations) we propose that the Gd0.4Tb0.6Co2 compound may provide a promising basis for a new family of multi-component compounds with enhanced MCE properties.

Author Contributions

Conceptualization, G.C. and M.S.; methodology, M.S., A.C., A.B., J.D. and G.Z.; theoretical calculations, J.D.; formal analysis, A.C. and G.Z.; validation, G.C.; writing—original draft preparation, G.C., J.D. and M.S. All authors have read and agreed to the published version of the manuscript.

Funding

This research received no external funding.

Conflicts of Interest

The authors declare no conflict of interest

References

  1. Ćwik, J.; Koshkid’ko, Y.; de Oliveira, N.A.; Mikhailova, A.; Nenkov, K. Effect of composition changes on the structural, magnetic and thermodynamic properties in Tb1−xDyxNi2 intermetallic compounds. J. Alloys Compd. 2018, 769, 588–596. [Google Scholar] [CrossRef]
  2. Halder, M.; Yusuf, S.M.; Mukadam, M.D.; Shashikala, K. Magnetocaloric effect and critical behavior near the paramagnetic to ferromagnetic phase transition temperature in TbCo2−xFex. Phys. Rev. B 2010, 81, 174402. [Google Scholar] [CrossRef] [Green Version]
  3. Murtaza, A.; Zuo, W.; Yaseen, M.; Ghani, A.; Saeed, A.; Hao, C.; Mi, J.; Li, Y.; Chang, T.; Wang, L.; et al. Magnetocaloric effect in the vicinity of the magnetic phase transition in NdCo2−xFex compounds. Phys. Rev. B 2020, 101, 214427. [Google Scholar] [CrossRef]
  4. Zhou, C.; Ren, S.; Bao, H.; Yang, S.; Yao, Y.; Ji, Y.; Ren, X.; Matsushita, Y.; Katsuya, Y.; Tanaka, M.; et al. Inverse effect of morphotropic phase boundary on the magnetostriction of ferromagnetic Tb1−xGdxCo2. Phys. Rev. B 2014, 89, 100101. [Google Scholar] [CrossRef]
  5. Duc, N.H.; Brommer, P.E. Formation of 3d-Moments and Spin Fluctuations in the Rare Earth—Transition Metal Intermetallics. In Handbook of Magnetic Materials; Duc, N.H., Ed.; Vietnam National University Press: Ho Chi Minh City, Vietnam, 1999; Volume 12. [Google Scholar]
  6. Goto, T.; Fukamichi, K.; Sakakibara, T.; Komatsu, H. Itinerant electron metamagnetism in YCo2. Solid State Commun. 1989, 72, 945–947. [Google Scholar] [CrossRef]
  7. Goto, T.; Sakakibara, T.; Murata, K.; Komatsu, H.; Fukamichi, K. Itinerant electron metamagnetism in YCo2 and LuCo2. J. Magn. Magn. Mater. 1990, 90, 700–702. [Google Scholar] [CrossRef]
  8. Baranov, N.; Yermakov, A.A.; Pirogov, A.N.; Proshkin, A.; Gvasaliya, S.N.; Podlesnyak, A.A. Irreversibility of the magnetic state of Tm1−xTbxCo2 revealed by specific heat, electrical resistivity, and neutron diffraction measurements. Phys. Rev. B 2006, 73, 104445. [Google Scholar] [CrossRef] [Green Version]
  9. Duc, N.H. Intersublattice Exchange Coupling in The Rare Earth–Transition Metal Intermetallics. In Handbook on the Physics and Chemistry of Rare Earths; Gschneidner, K.A., Jr., Eyring, L., Eds.; Elsevier Science B.V.: Amsterdam, The Netherlands, 1997; Volume 24, pp. 339–398. [Google Scholar]
  10. Ćwik, J. Magnetism and magnetocaloric effect in multicomponent Laves-phase compounds: Study and comparative analysis. J. Solid State Chem. 2014, 209, 13–22. [Google Scholar] [CrossRef]
  11. Not Your Average Fridge Magnet: These High-Tech Magnets Will Keep Your Butter (and Beer) Cold. Available online: https://www.ge.com/news/reports/not-your-average-fridge-magnet (accessed on 24 November 2020).
  12. Gschneidner, K.A.; Pecharsky, V.K. Magnetocaloric materials. Annu. Rev. Mater. Res. 2000, 30, 387–429. [Google Scholar] [CrossRef] [Green Version]
  13. Leary, A.; Ohodnicki, P.R.; McHenry, M.E. Soft magnetic materials in high-frequency, high-power conversion applications. JOM 2012, 64, 772–781. [Google Scholar] [CrossRef]
  14. Tishin, A.M.; Spichkin, Y. Recent progress in magnetocaloric effect: Mechanisms and potential applications. Int. J. Refrig. 2014, 37, 223–229. [Google Scholar] [CrossRef]
  15. Zhou, K.W.; Zhang, Y.H.; Li, J.Q.; Deng, J.Q.; Zhu, Q.M. Magnetocaloric effects in (Gd1-xTbx)Co2. Solid State Commun. 2006, 137, 275–277. [Google Scholar] [CrossRef]
  16. Singh, D.J.; Nordstrom, L. Planewaves, Pseudopotentials, and the LAPW Method, 2nd ed.; Springer Science: Berlin/Heidelberg, Germany, 2006; pp. 43–106. [Google Scholar]
  17. Blaha, P.; Schwarz, K.; Madsen, G.K.H.; Kvasnicka, D.; Luitz, J. WIEN2k, An Augmented Plane Wave + Local Orbitals Program for Calculating Crystal Properties; Karlheinz Schwarz, Technische Universität: Wien, Austria, 2018; ISBN 3-9501031-1-2. [Google Scholar]
  18. Perdew, J.P.; Ruzsinszky, A.; Csonka, G.I.; Vydrov, O.A.; Scuseria, G.E.; Constantin, L.A.; Zhou, X.; Burke, K. Restoring the Density-Gradient Expansion for Exchange in Solids and Surfaces. Phys. Rev. Lett. 2008, 100, 136406. [Google Scholar] [CrossRef] [PubMed] [Green Version]
  19. Anisimov, V.I.; Zaanen, J.; Andersen, O.K. Band theory and Mott insulators: Hubbard U instead of Stoner, I. Phys. Rev. B 1991, 44, 943–954. [Google Scholar] [CrossRef] [Green Version]
  20. Ahuja, B.L.; Mund, H.S.; Sahariya, J.; Dashora, A.; Halder, M.; Yusuf, S.M.; Itou, M.; Sakurai, Y. Temperature dependent spin and orbital polarization in TbCo2: Magnetic Compton scattering and first-principles investigations. J. Alloys Compd. 2015, 633, 430–434. [Google Scholar] [CrossRef]
  21. Bajorek, A.; Deniszczyk, J.; Chrobak, A.; Chełkowska, G. Effect of In/Sn substitution on magnetism, crystal and electronic structure in Gd (In1-xSnx)3 system. Philos. Mag. 2015, 95, 3554–3576. [Google Scholar] [CrossRef]
  22. Lutterotti, L.; Ceccato, R.; Maschio, R.D.; Pagani, E. Quantitative Analysis of Silicate Glass in Ceramic Materials by the Rietveld Method. Mater. Sci. Forum 1998, 87–92. [Google Scholar] [CrossRef]
  23. Gialanella, S.; Lutterotti, L. On the measure of order in alloys. Prog. Mater. Sci. 1997, 42, 125–133. [Google Scholar] [CrossRef]
  24. Singh, N.K.; Suresh, K.G.; Rana, D.S.; Nigam, A.K.; Malik, S.K. Role of Fe substitution on the anomalous magnetocaloric and magnetoresistance behaviour in Tb (Ni1−xFex)2 compounds. J. Phys. Condens. Matter 2006, 18, 10775–10786. [Google Scholar] [CrossRef] [Green Version]
  25. Gratz, E.; Goremychkin, E.; Latroche, M.; Hilscher, G.; Rotter, M.; Muller, H.; Lindbaum, A.; Ichor, H.; Paul-Boncour, V.; Fernandez-Diaz, T. New magnetic phenomena in TbNi2. J. Phys. Condens. Matter 1999, 11, 7893–7905. [Google Scholar] [CrossRef]
  26. Coey, J.M.D. Magnetism and Magnetic Materials; Cambridge University Press: Cambridge, UK, 2006. [Google Scholar]
  27. Franco, V.; Blazquez, J.S.; Ipus, J.J.; Law, J.Y.; Moreno-Ramirez, L.M.; Conde, A. Magnetocaloric effect: From materials research to refrigeration devives. Prog. Mater. Sci. 2018, 93, 112–232. [Google Scholar] [CrossRef]
  28. Gschneidner Jr, K.A.; Pecharsky, V.K.; Tsokol, A.O. Recent developments in magnetocaloric materials. Rep. Prog. Phys. 2005, 68, 1479–1539. [Google Scholar] [CrossRef]
  29. Mozharivskyj, Y. Magnetocaloric Effect and Magnetocaloric Materials; Elsevier B.V.: Amsterdam, The Netherlands, 2016. [Google Scholar]
  30. Shen, B.G.; Sun, J.R.; Hu, F.X.; Zhang, H.W.; Cheng, Z.H. Recent progress in exploring magnetocaloric materials. Adv. Mater. 2009, 21, 4545–4564. [Google Scholar] [CrossRef] [Green Version]
  31. Chrobak, A.; Bajorek, A.; Chełkowska, G. Effect of Tb/Gd substitution on crystal structure and exchange interactions in Gd1-xTbxNi3 intermetallic. Compd. Acta Phys. Pol. A 2012, 121, 1132–1135. [Google Scholar] [CrossRef]
  32. Danh, T.; Duc, N.; Thuy, N. Exchange interactions in amorphous Gd–Fe alloys. J. Magn. Magn. Mater. 1998, 185, 105–108. [Google Scholar] [CrossRef]
  33. Duc, N.H. An evaluation of the R-T spin coupling parameter in the rare earth–transition metal intermetallics. Phys. Status solidi B 1991, 164, 545–552. [Google Scholar] [CrossRef]
  34. Lang, J.K.; Baer, Y.; Cox, P.A. Study of the 4f and valence band density of states in rare-earth metals: II. Experiment and results. J. Phys. F Met. Phys. 1981, 11, 121–138. [Google Scholar] [CrossRef]
  35. Saini, S.M.; Singh, N.; Nautiyal, T.; Auluck, S. Comparative study of optical and magneto-optical properties of GdFe2and GdCo2. J. Phys. Condens. Matter 2007, 19, 176203. [Google Scholar] [CrossRef]
  36. Shabanova, I.N.; Keller, N.V. X-ray photoelectron studies of spin-state changes in 3d metal systems. Surf. Interface Anal. 2001, 32, 114–116. [Google Scholar] [CrossRef]
  37. Doniach, S.; Sunjic, M. Many-electron singularity in X-ray photoemission and X-ray line spectra from metals. J. Phys. C Solid State Phys. 1970, 3, 285–291. [Google Scholar] [CrossRef]
  38. Tougaard, S. Practical algorithm for background subtraction. Surf. Sci. 1989, 216, 343–360. [Google Scholar] [CrossRef]
Figure 1. The X-ray diffraction (XRD) patterns for the Gd0.4Tb0.6Co2 compound.
Materials 13 05481 g001
Figure 2. (a) Magnetization M versus temperature in the FC and ZFC mode at a magnetic field of 0.1 T, (b) Magnetization in the FC mode at 0.1, 2, and 5 T.
Materials 13 05481 g002
Figure 3. The AC magnetic susceptibility (χAC) of the Gd0.4Tb0.6Co2 compound.
Materials 13 05481 g003
Figure 4. Hysteresis loops of the Gd0.4Tb0.6Co2 compound measured at 2 K, 25 K, 50 K, 100 K, and 300 K. The magnetization unit of [µB/fu] was derived from [emu/g] using the formula: 1 [emu/g] = 0.1078 × 10²¹/N [µB/fu], where N is the number of formula units of Gd0.4Tb0.6Co2 in 1 g.
Materials 13 05481 g004
Figure 5. (a) Magnetic isotherms and (b) Arrott plots for the Gd0.4Tb0.6Co2.
Materials 13 05481 g005
Figure 6. The temperature dependence of Landau coefficients a(T) and b(T) for the Gd0.4Tb0.6Co2.
Materials 13 05481 g006
Figure 7. (a) Magnetic entropy changes (−ΔSM) in the Gd0.4Tb0.6Co2 as a function of temperature and magnetic field. (b) Variation of the maximum of the magnetic entropy changes |ΔSM|max with the growth of a magnetic field.
Materials 13 05481 g007
Figure 8. The MFC(T) dependence at μ0H = 5 T and the results of MFT analysis for the Gd0.4Tb0.6Co2.
Materials 13 05481 g008
Figure 9. The XPS valence band of the Gd0.4Tb0.6Co2. The spectrum is normalized to the maximum intensity in this energy range. Vertical arrows show the positions of spectral lines observed in elemental Gd, Tb, and Co.
Materials 13 05481 g009
Figure 10. The density of states (DOS) of the Gd0.375Tb0.625Co2 calculated within the PBEsol + SO + U method. (a)—spin-resolved, partial atomic contributions, (b)—total DOS compared with the scaled XPS spectrum, (c)—spin-resolved, partial atomic spd DOS in Gd0.375Tb0.625Co2 compared with the spd DOS of paramagnetic LaCo2 compound; (d)—Gd + Tb 4f DOS combined with the simulated mixture of spd DOS (60%—Gd0.375Tb0.625Co2 + 40%—LaCo2) compared with the scaled XPS spectrum.
Materials 13 05481 g010
Figure 11. The Co3s multiplet splitting for the Gd0.4Tb0.6Co2.
Materials 13 05481 g011
Publisher’s Note: MDPI stays neutral with regard to jurisdictional claims in published maps and institutional affiliations.

