Achieving Ti-5Al-4Sn-2Zr-1Mo-0.25Si-1Nb Alloys with High Strength and Moderate Ductility through Selective Laser Melting

Abstract
:1. Introduction
2. Materials and Methods
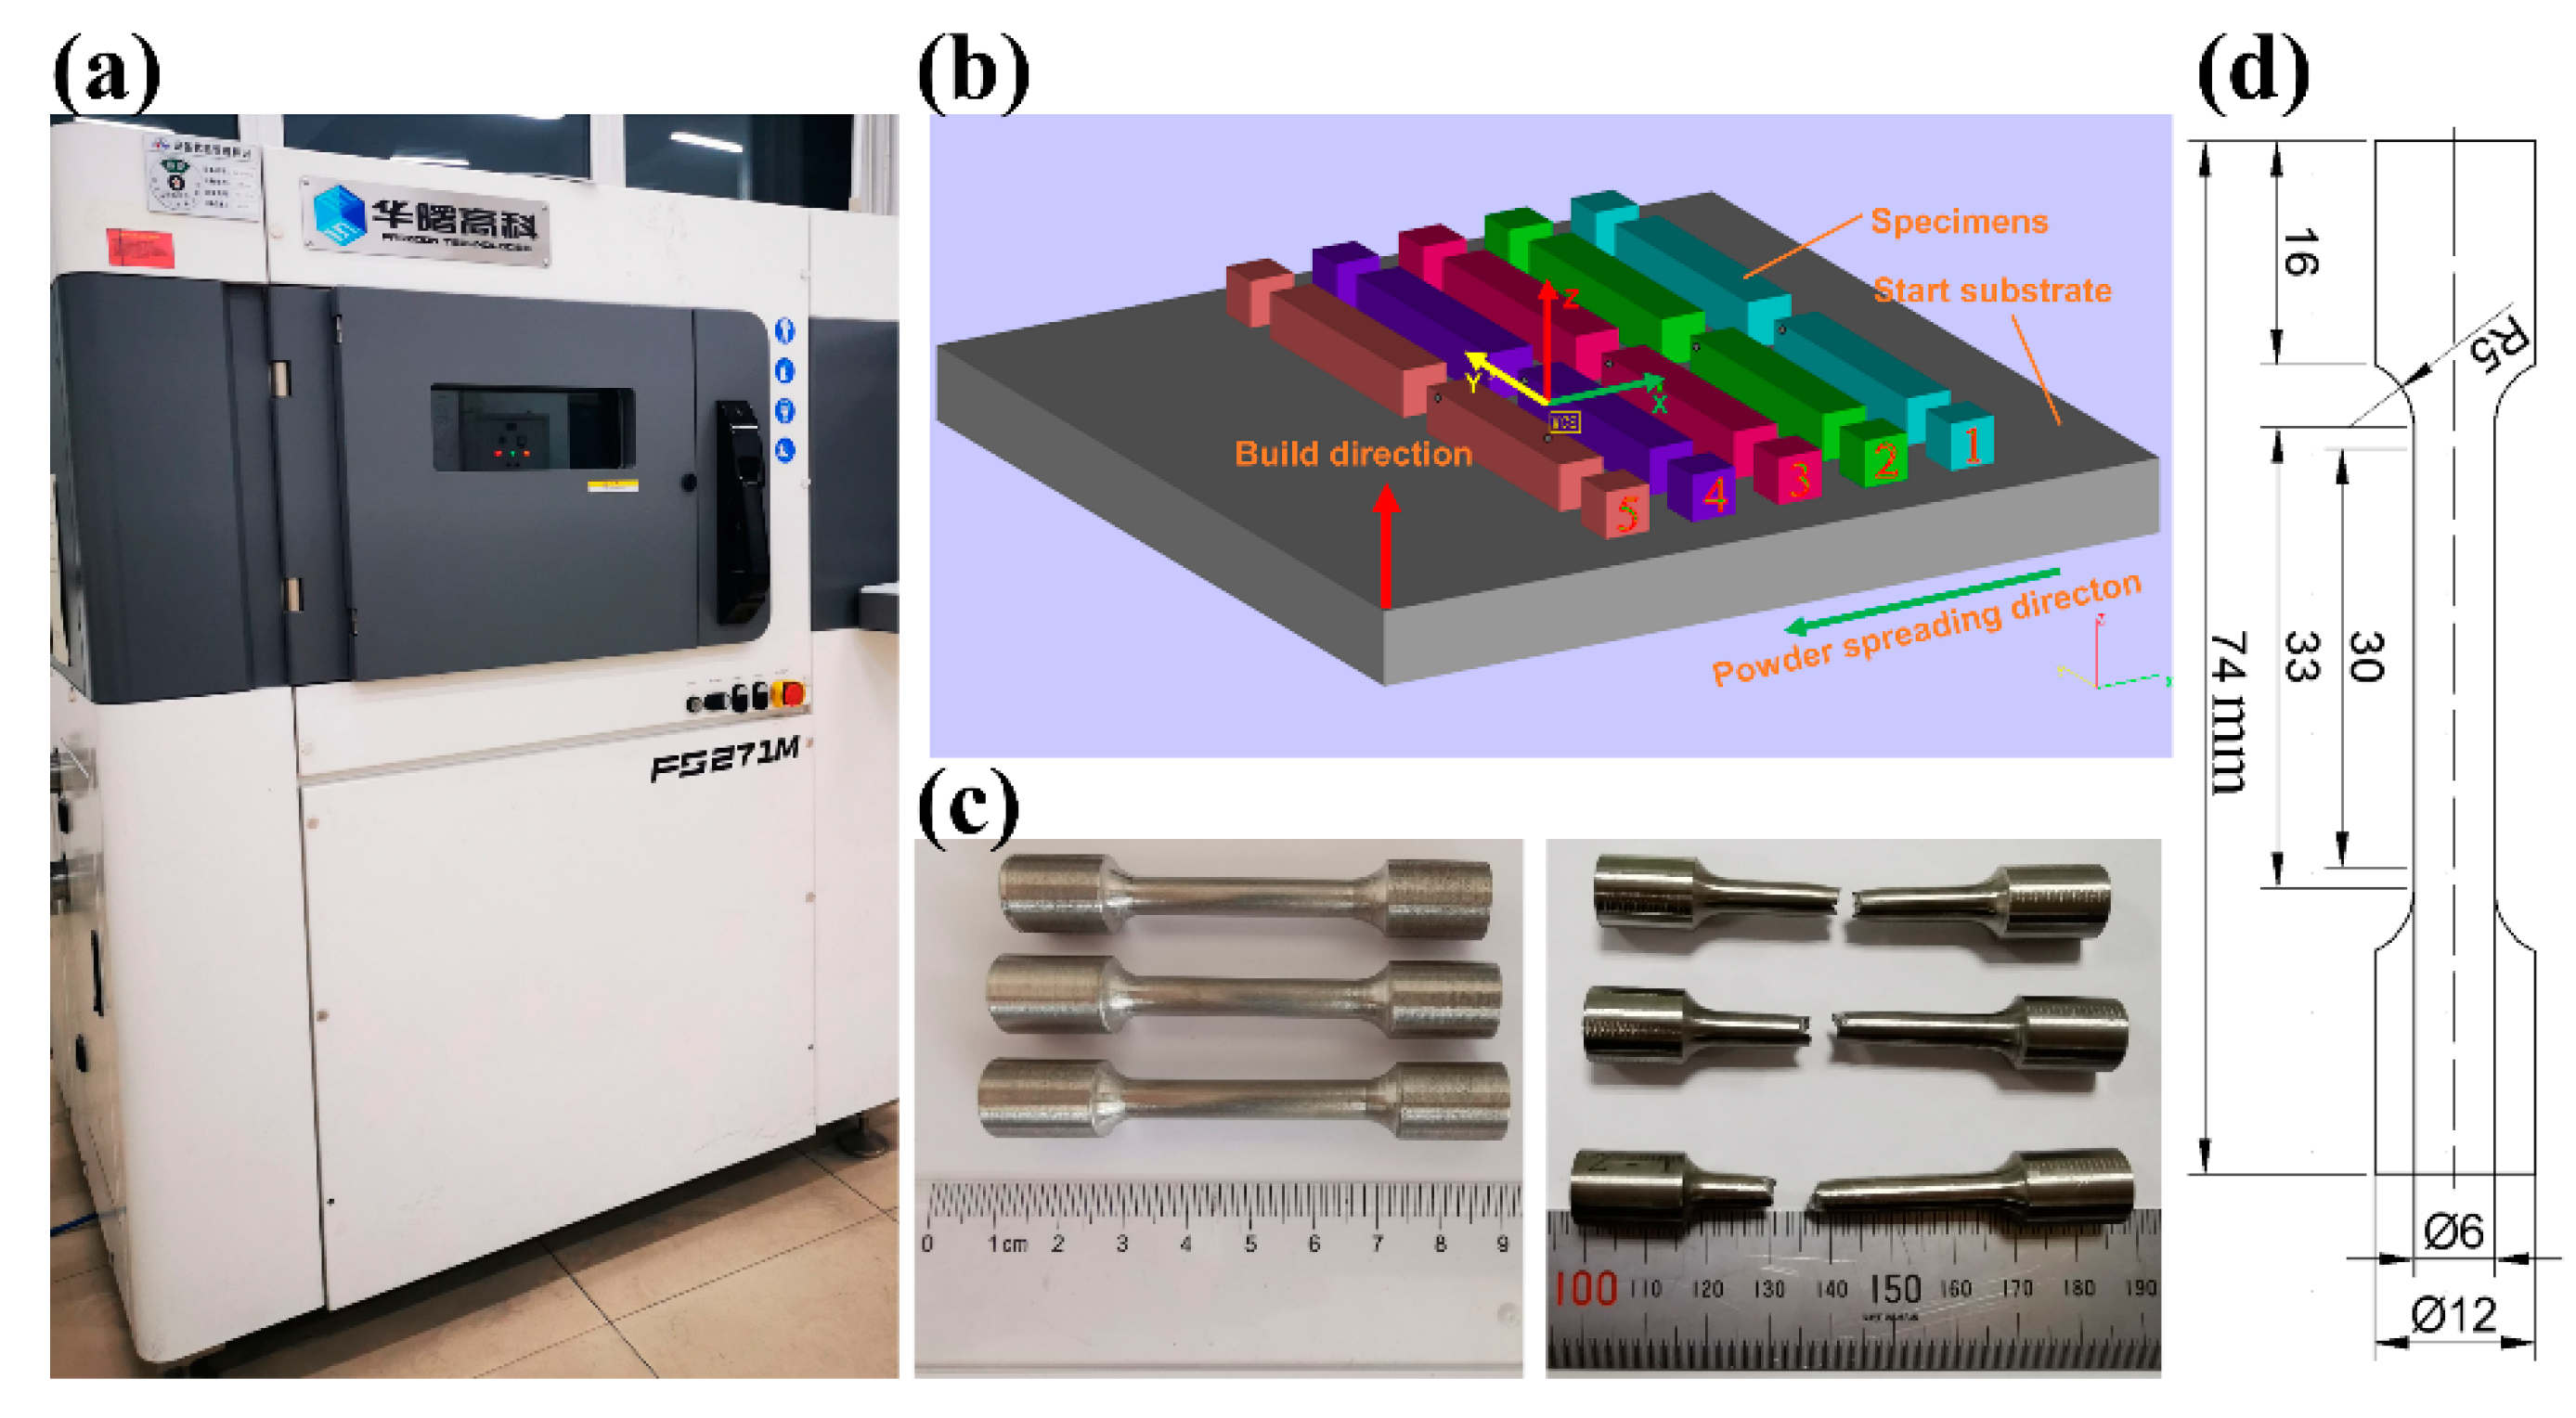
2.1. Materials and Processing Conditions
2.2. Sample Location and Preparation
2.3. Characterization Methodology
2.3.1. Microstructure Ans Porosity Characterization
2.3.2. Microhardness
2.3.3. Tensile Testing
3. Results and Discussion
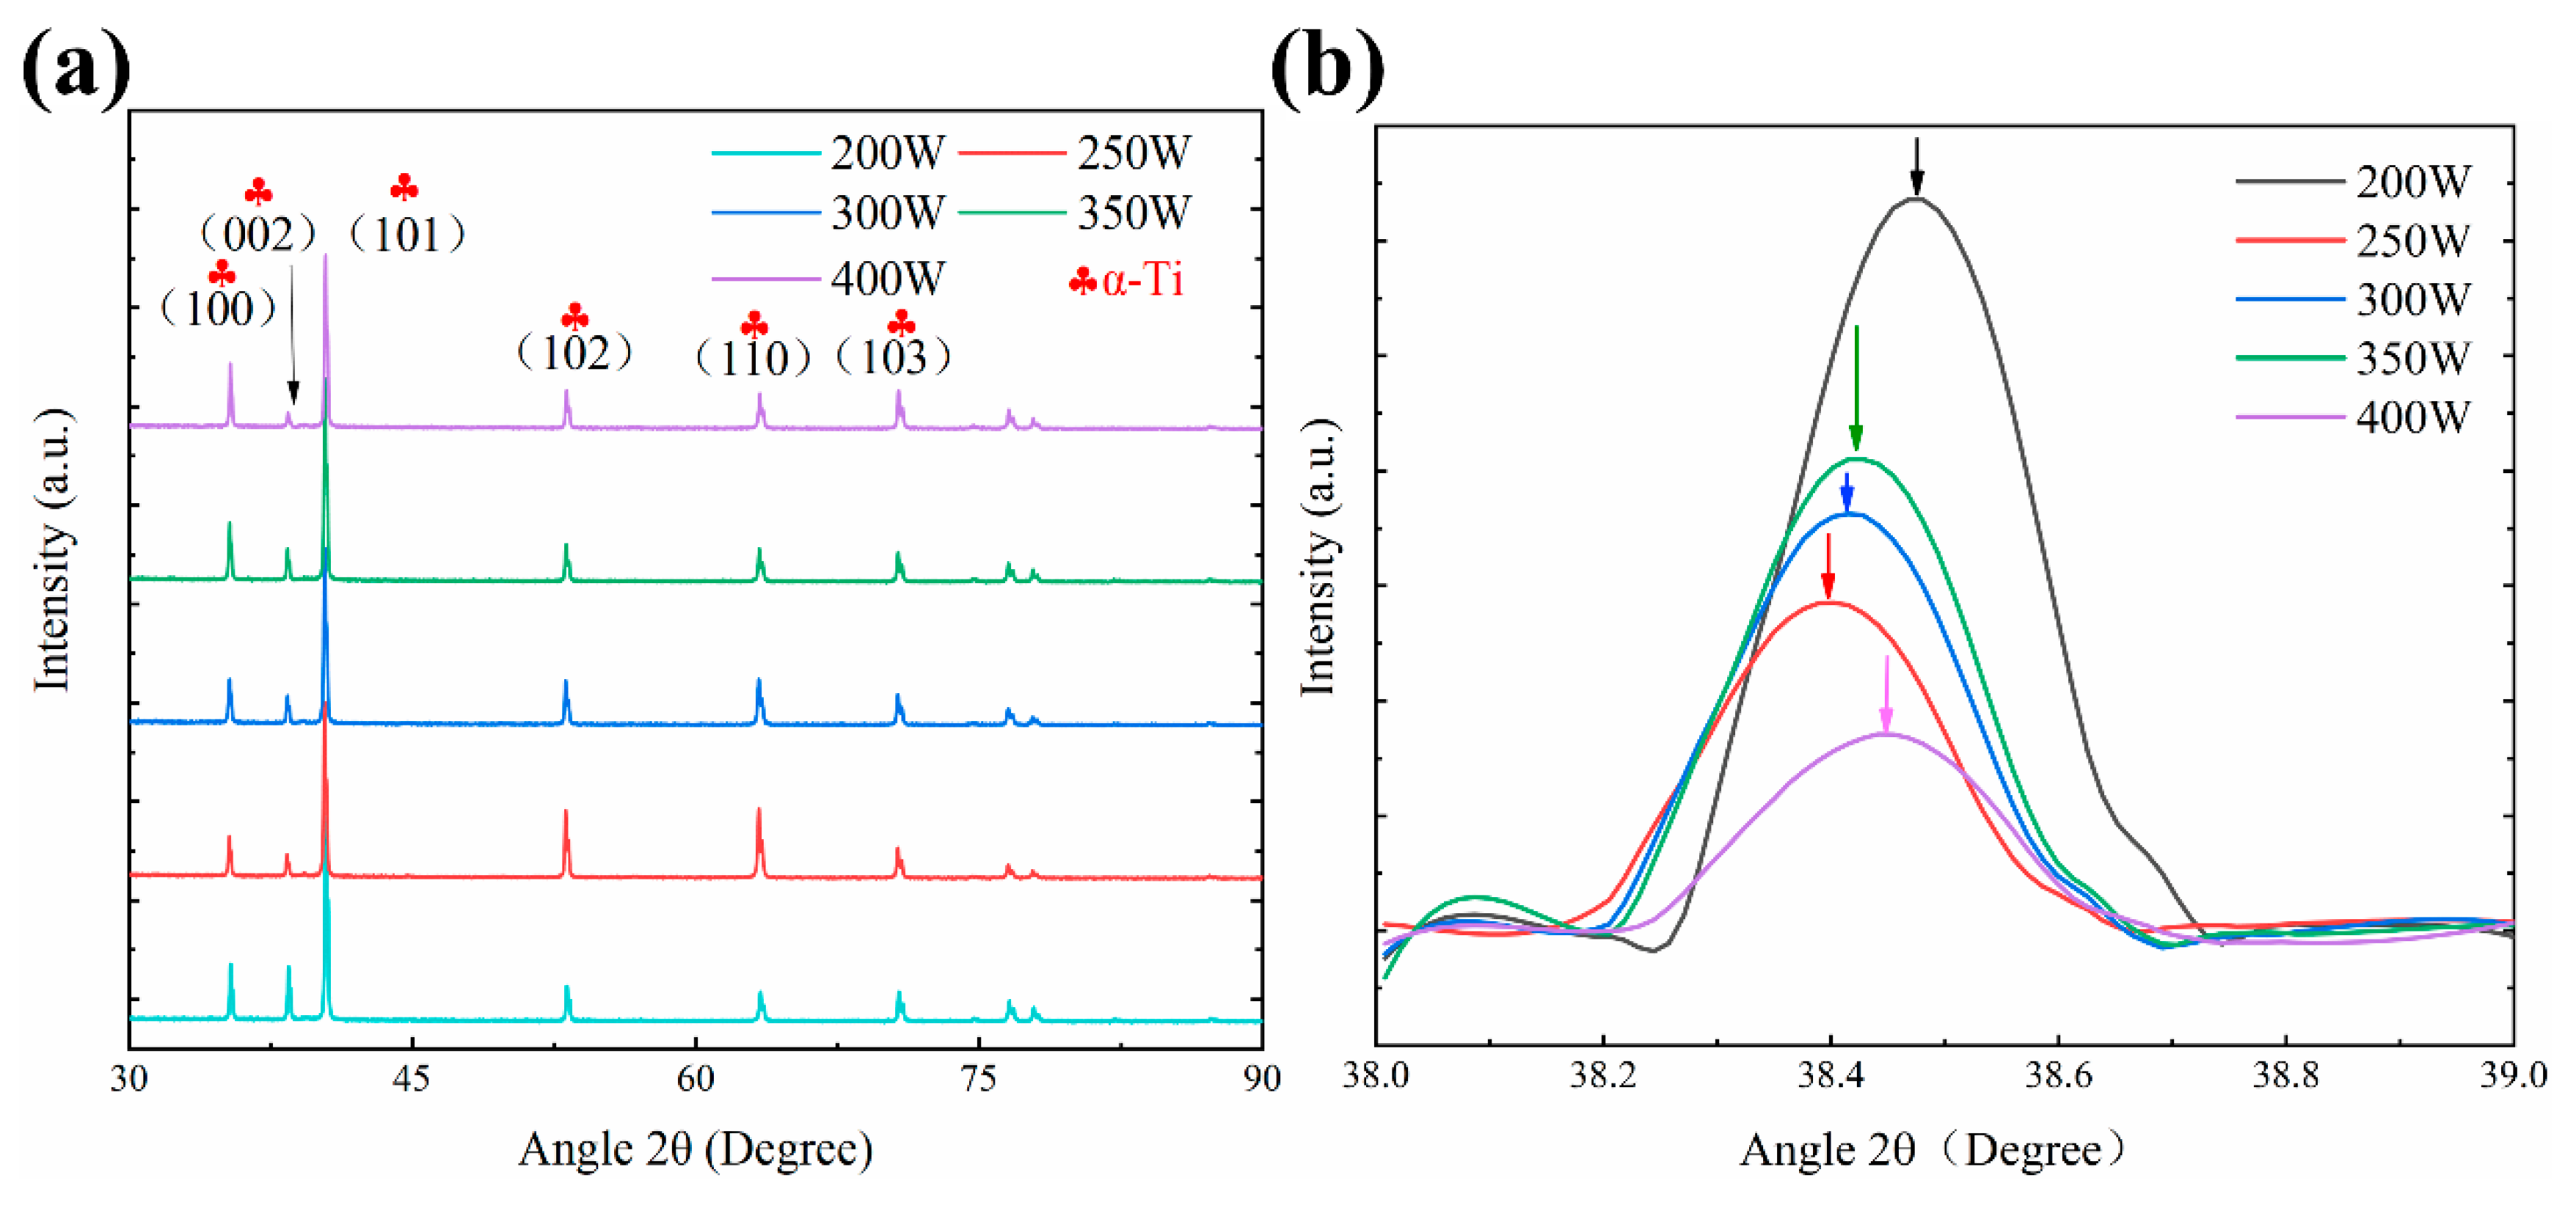
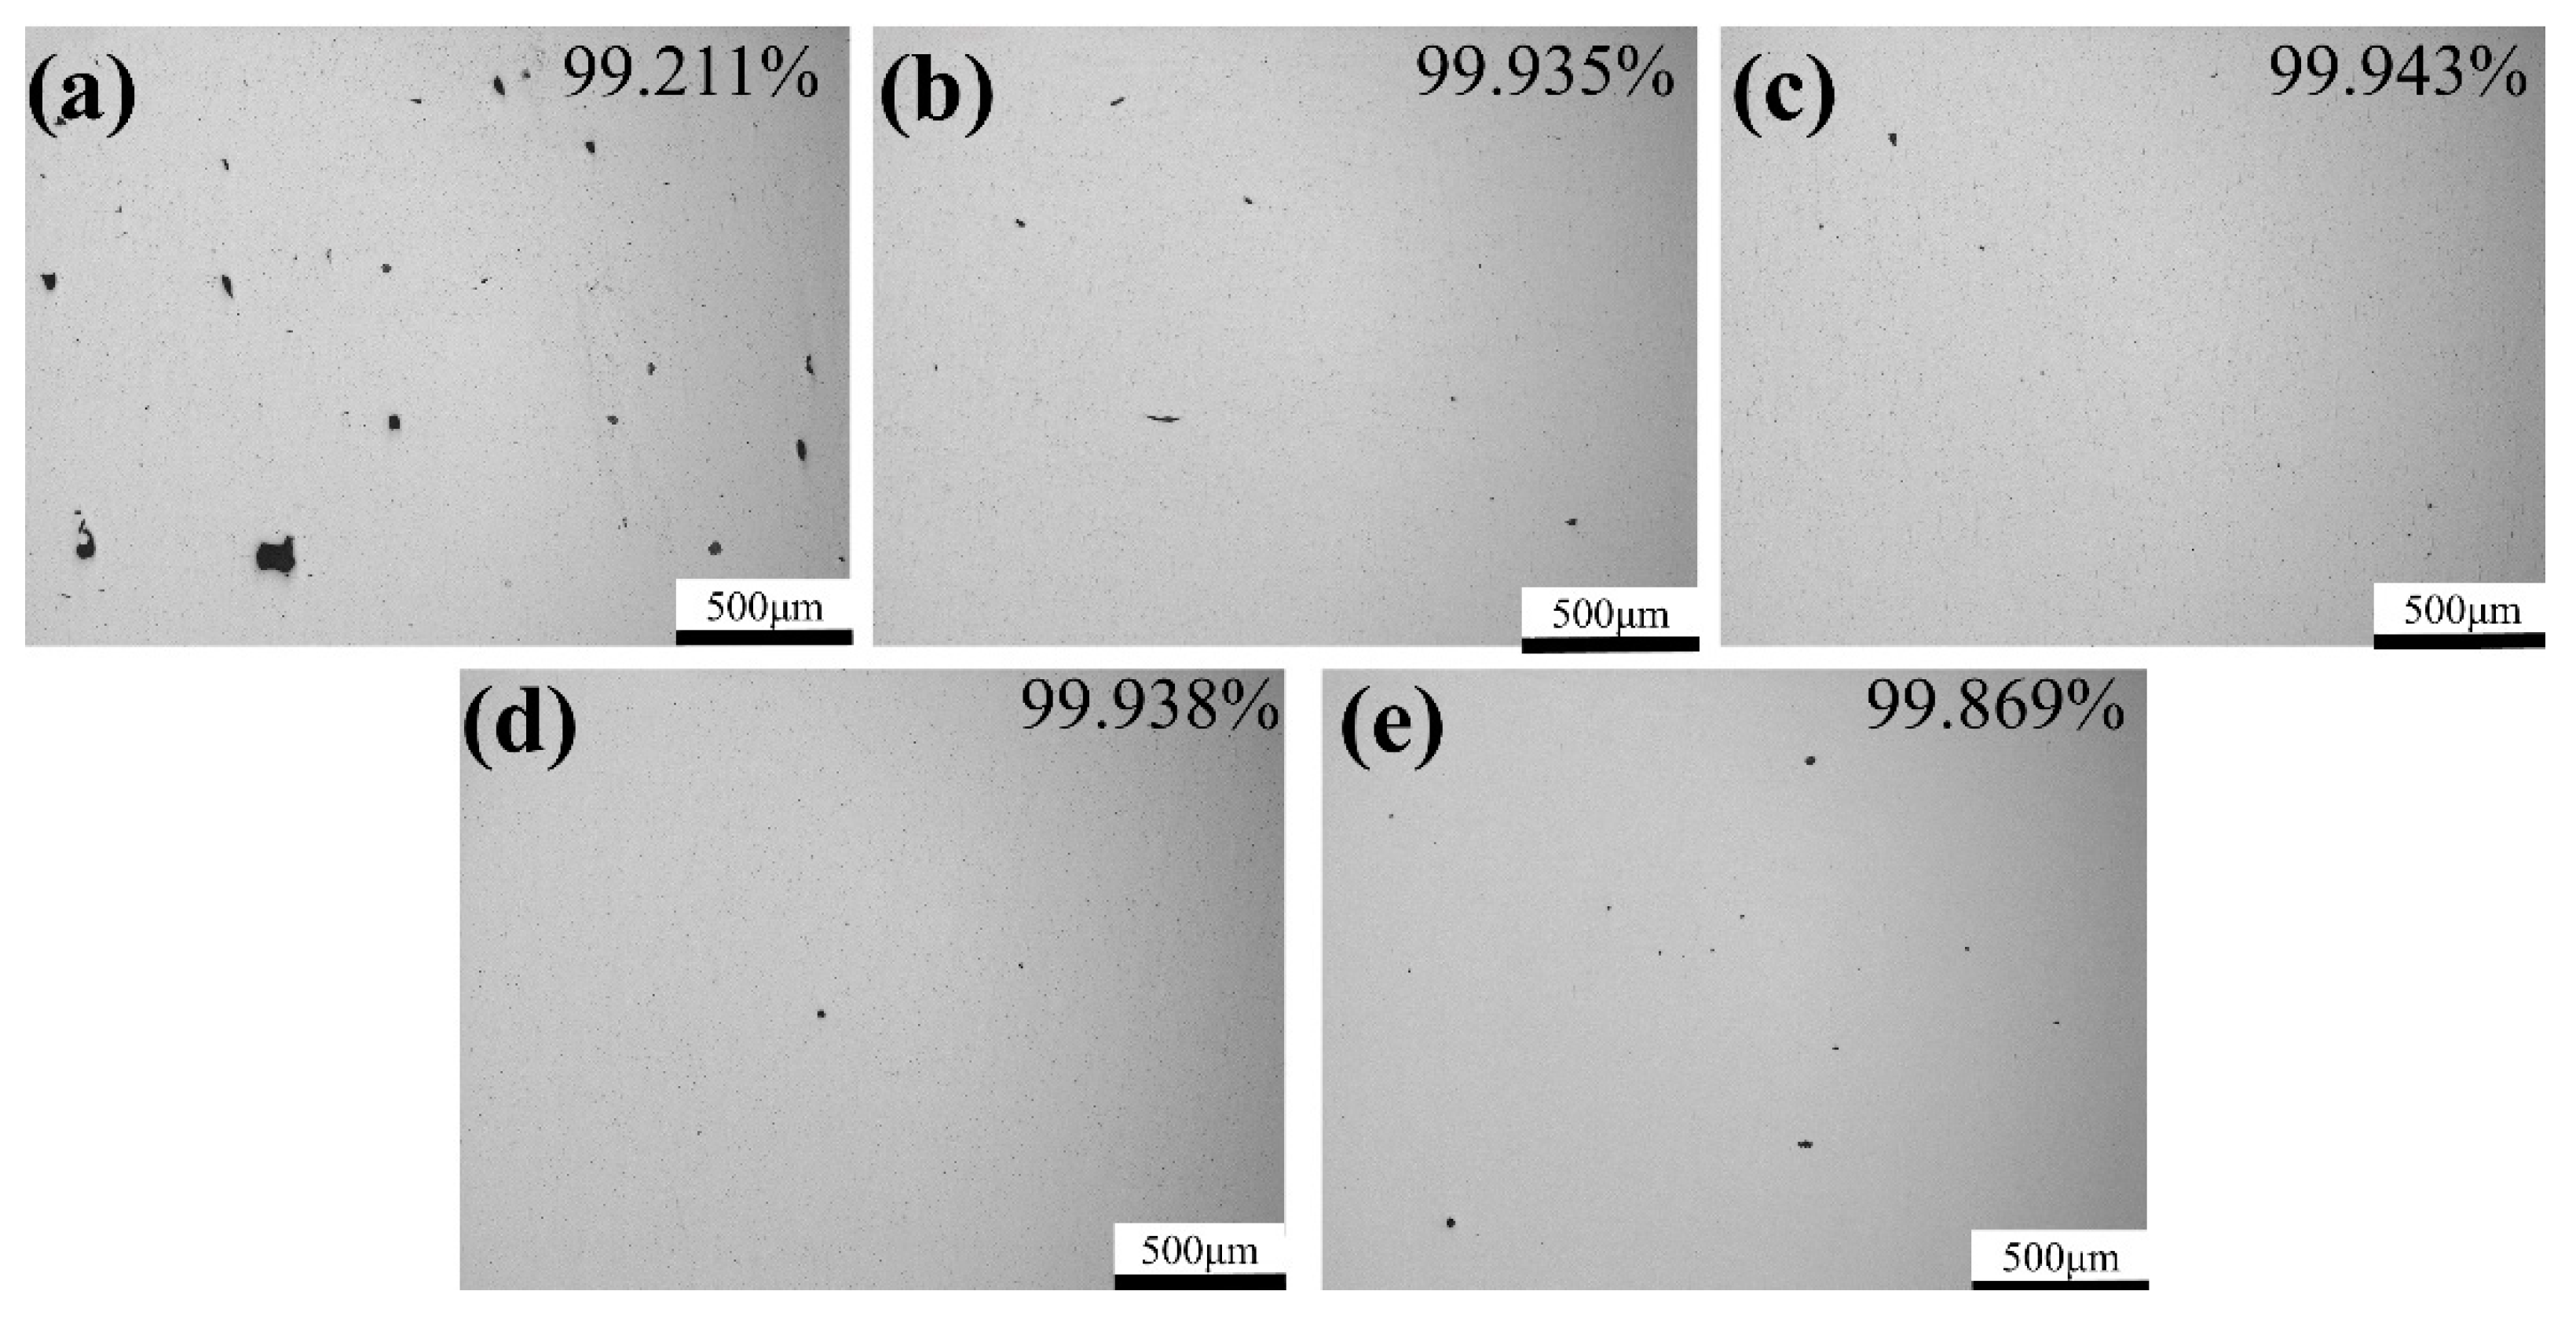
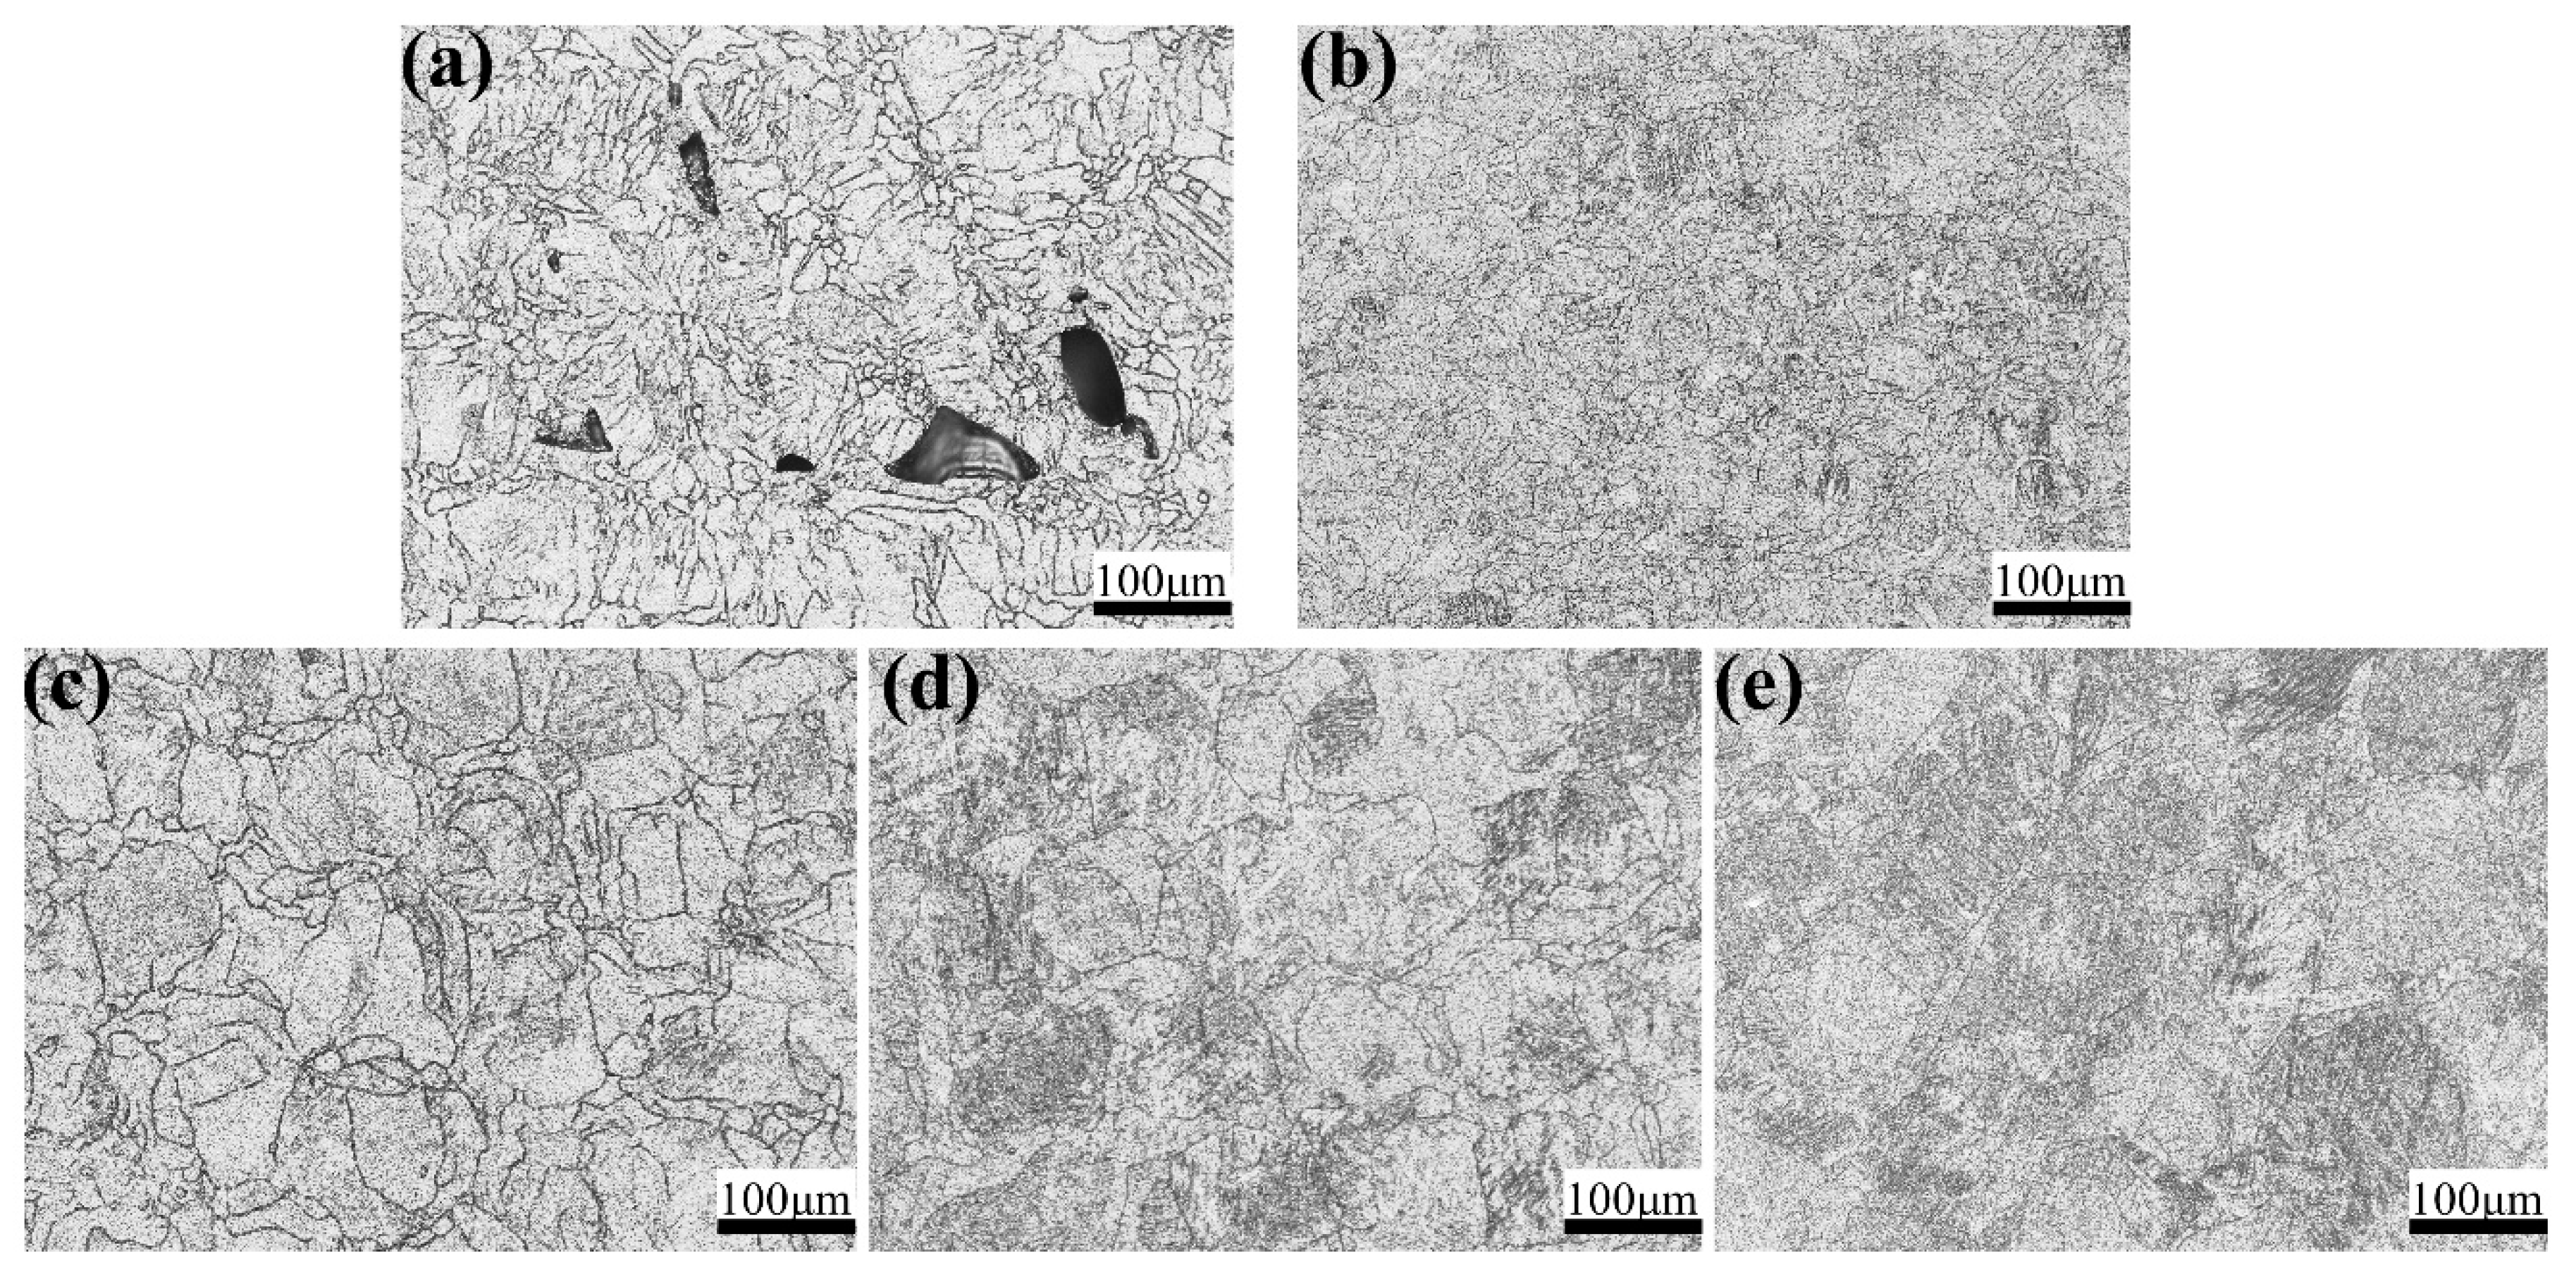
3.1. Microstructure of SLM TA32 Titanium Alloy
3.2. Mechanical Properties of SLM TA32 Specimens
3.2.1. Mechanical Properties at Ambient Temperature
3.2.2. Mechanical Properties at Elevated Temperature
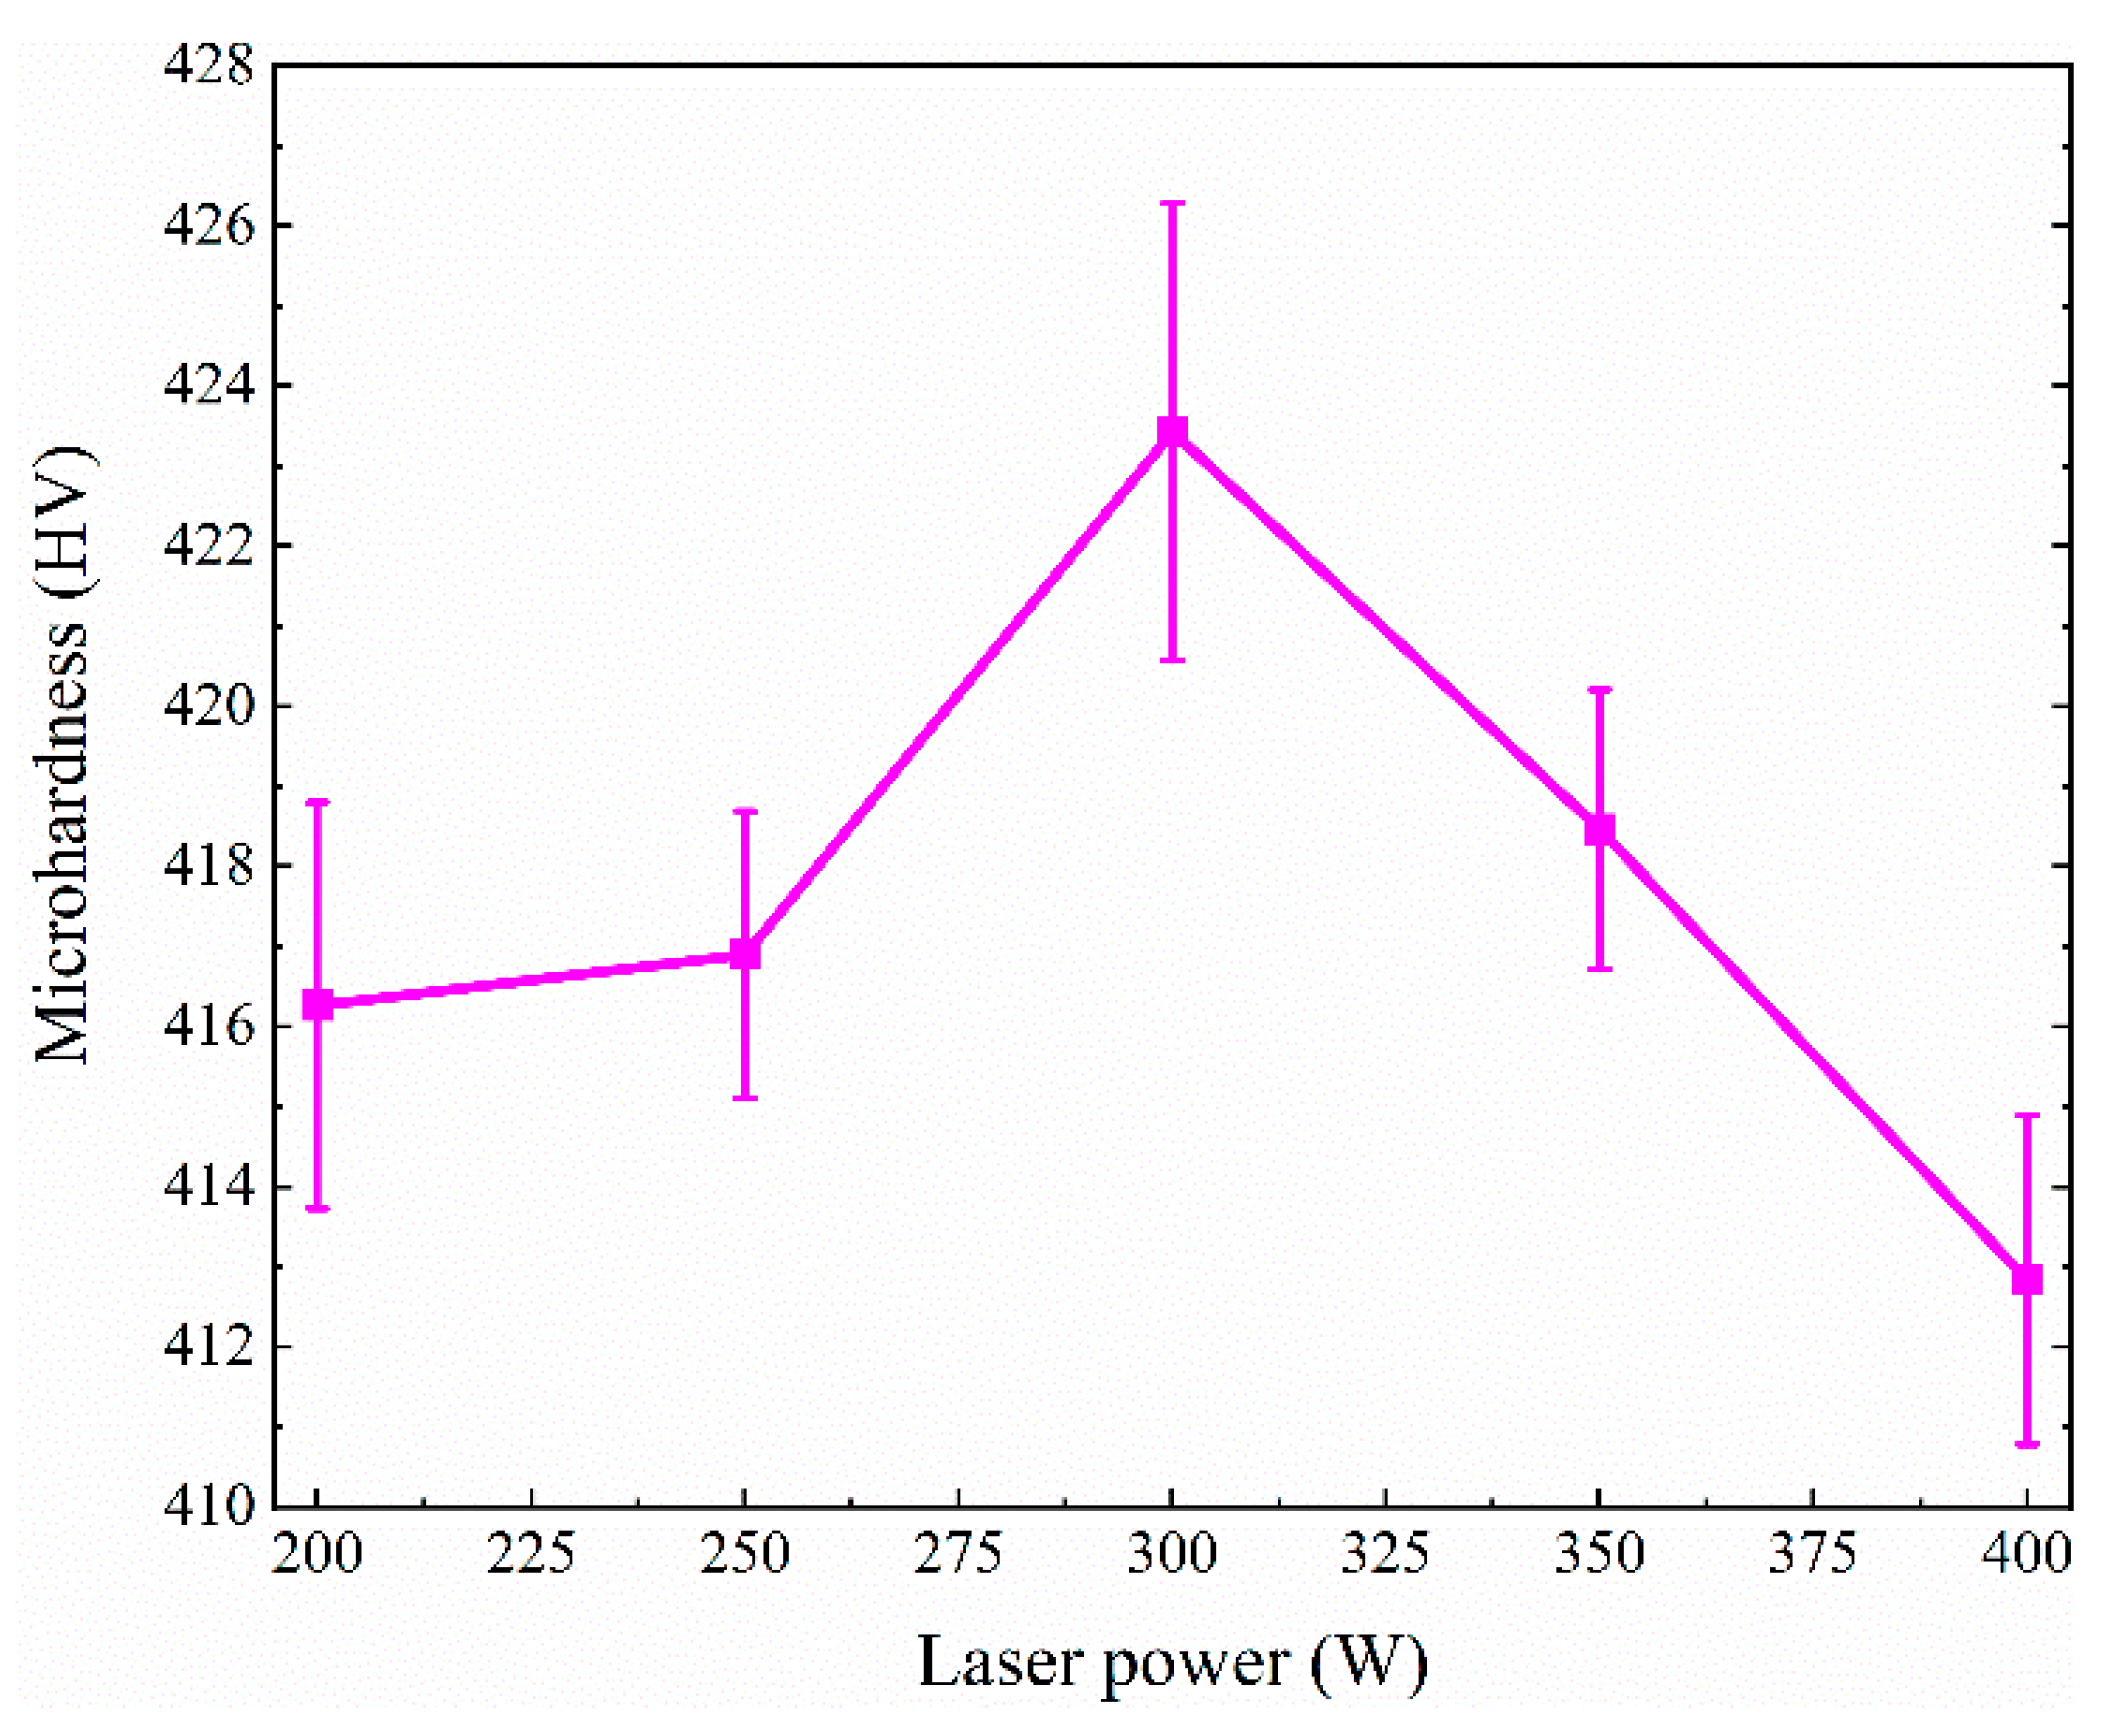
3.3. Microhardness Measurements
4. Conclusions
- (1)
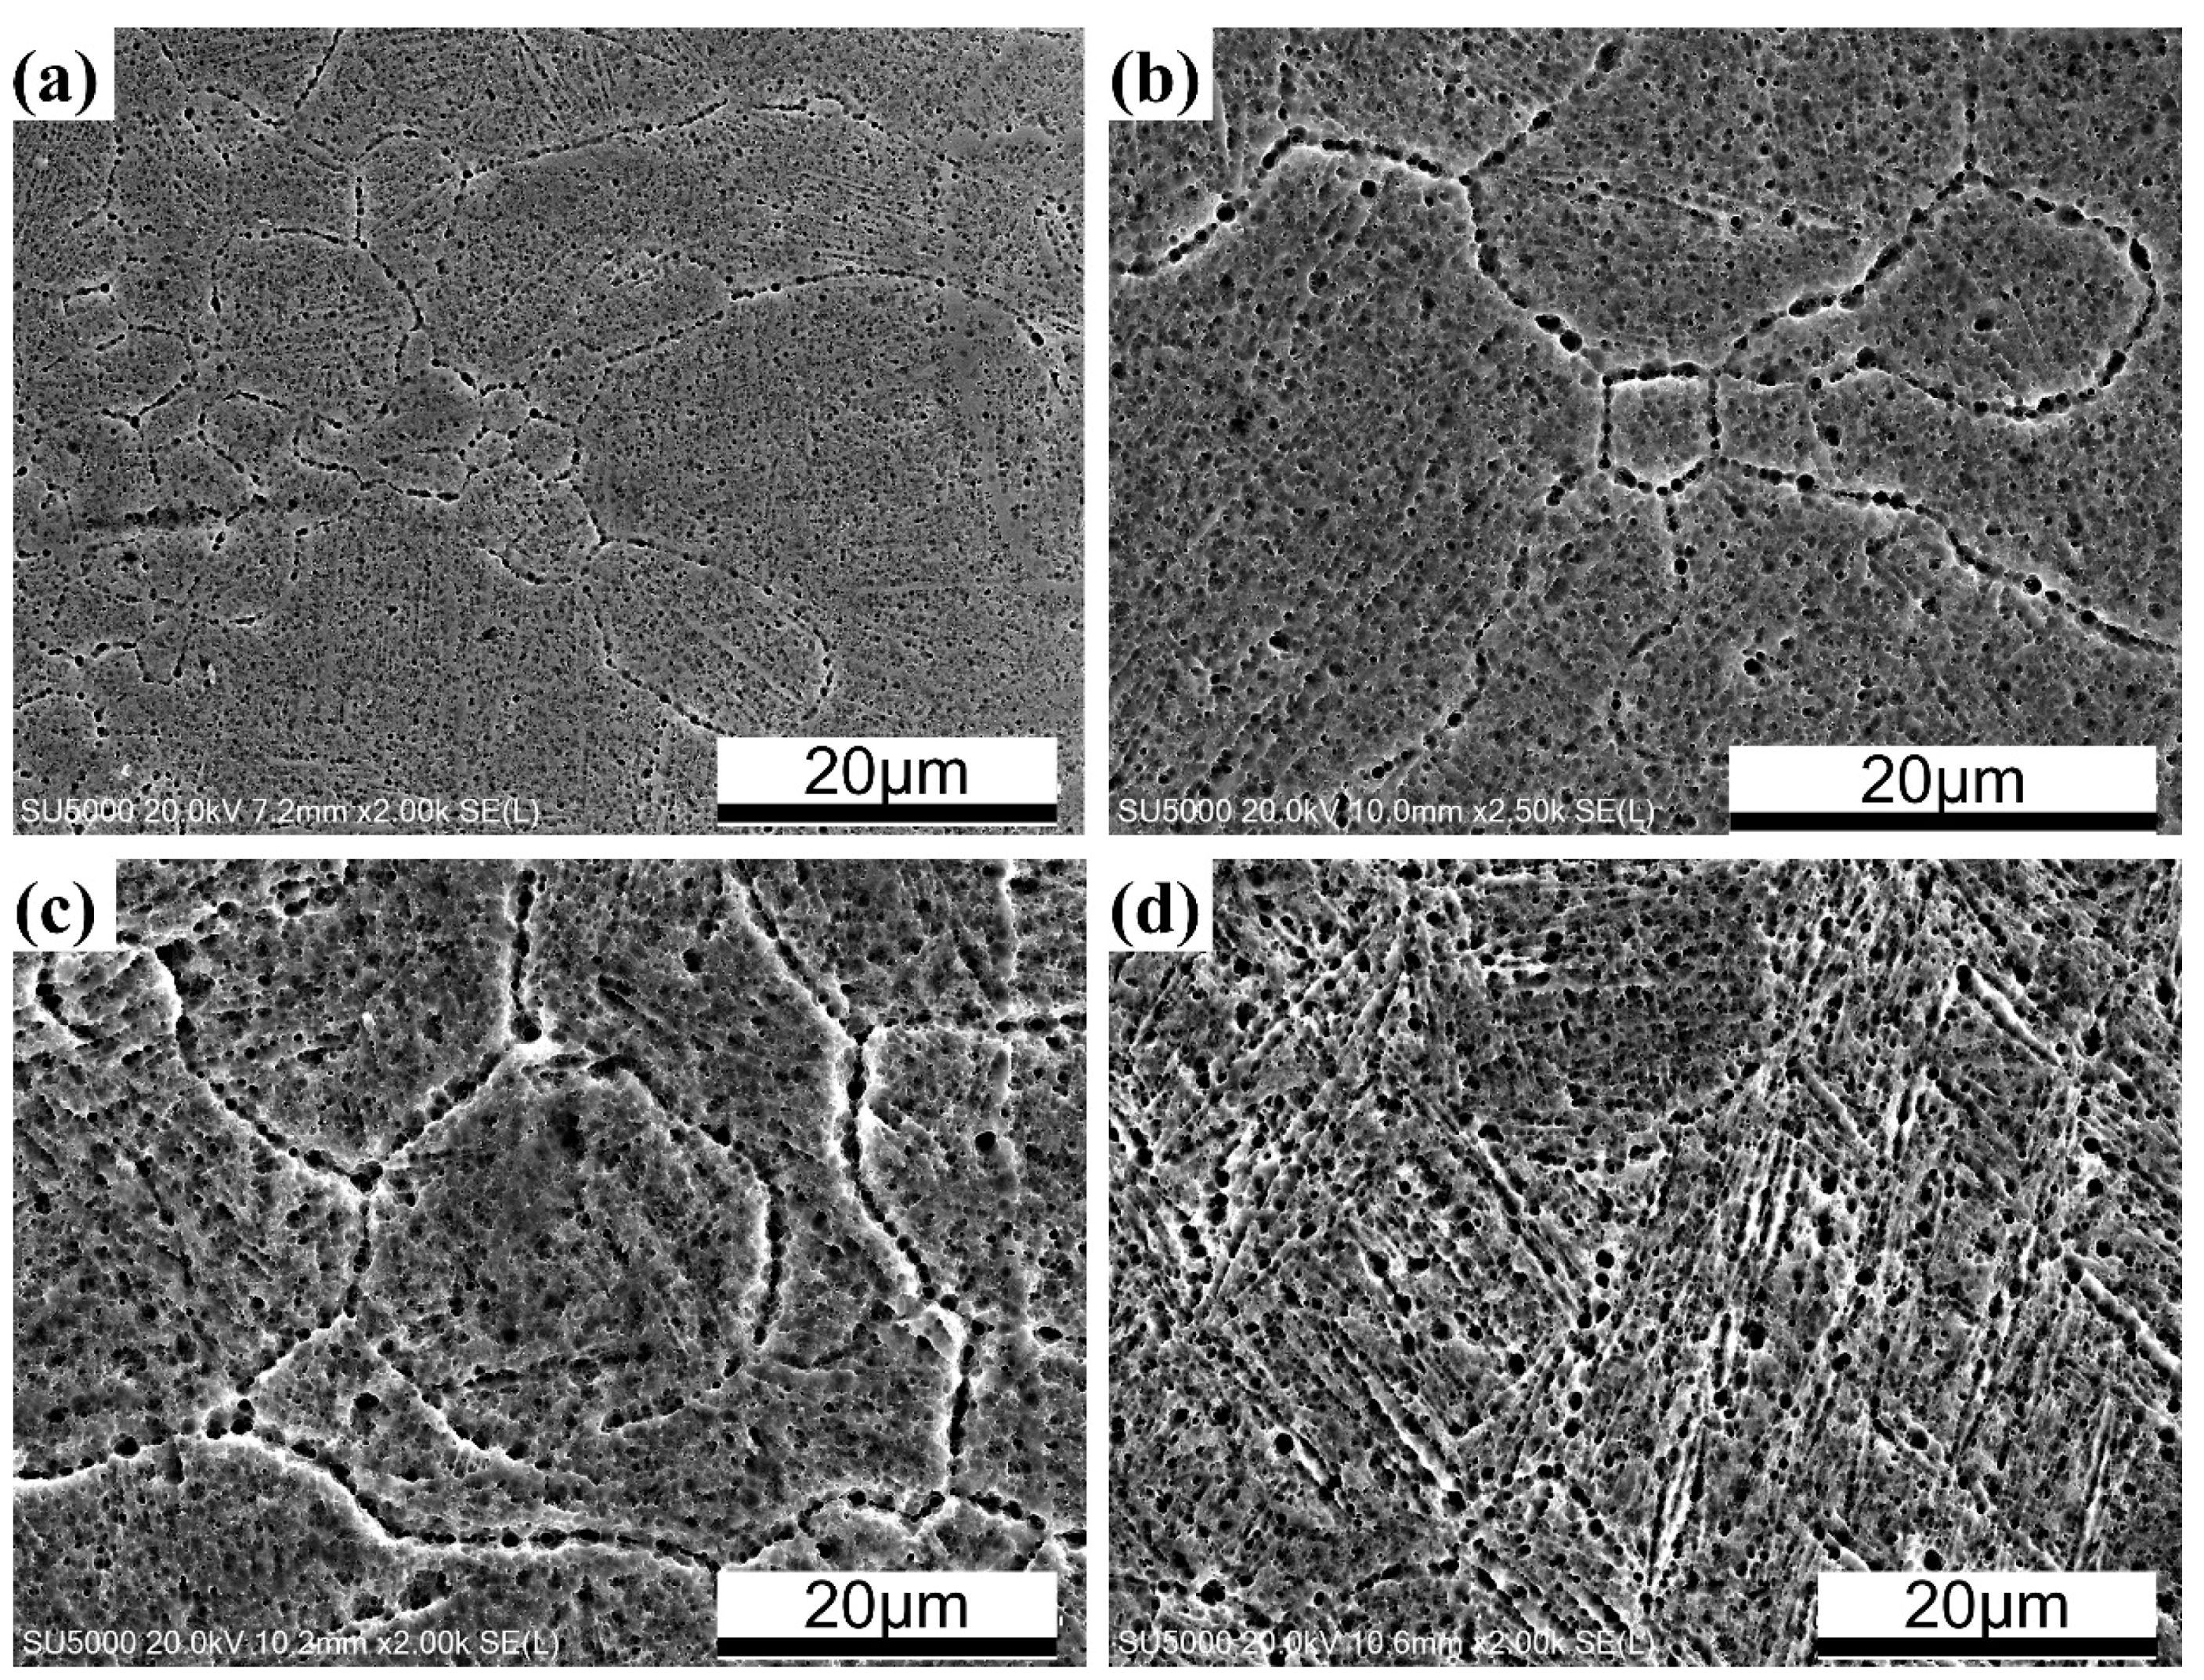
- Laser power has a significant effect on the microstructure of SLM TA32 specimens in the way that the average grain size increases from 12.4 μm to 62 μm when increasing laser power from 200 W to 400 W. When laser power increases, the microstructure of TA32 specimens varies from cellar microstructure to dendrite microstructure.
- (2)
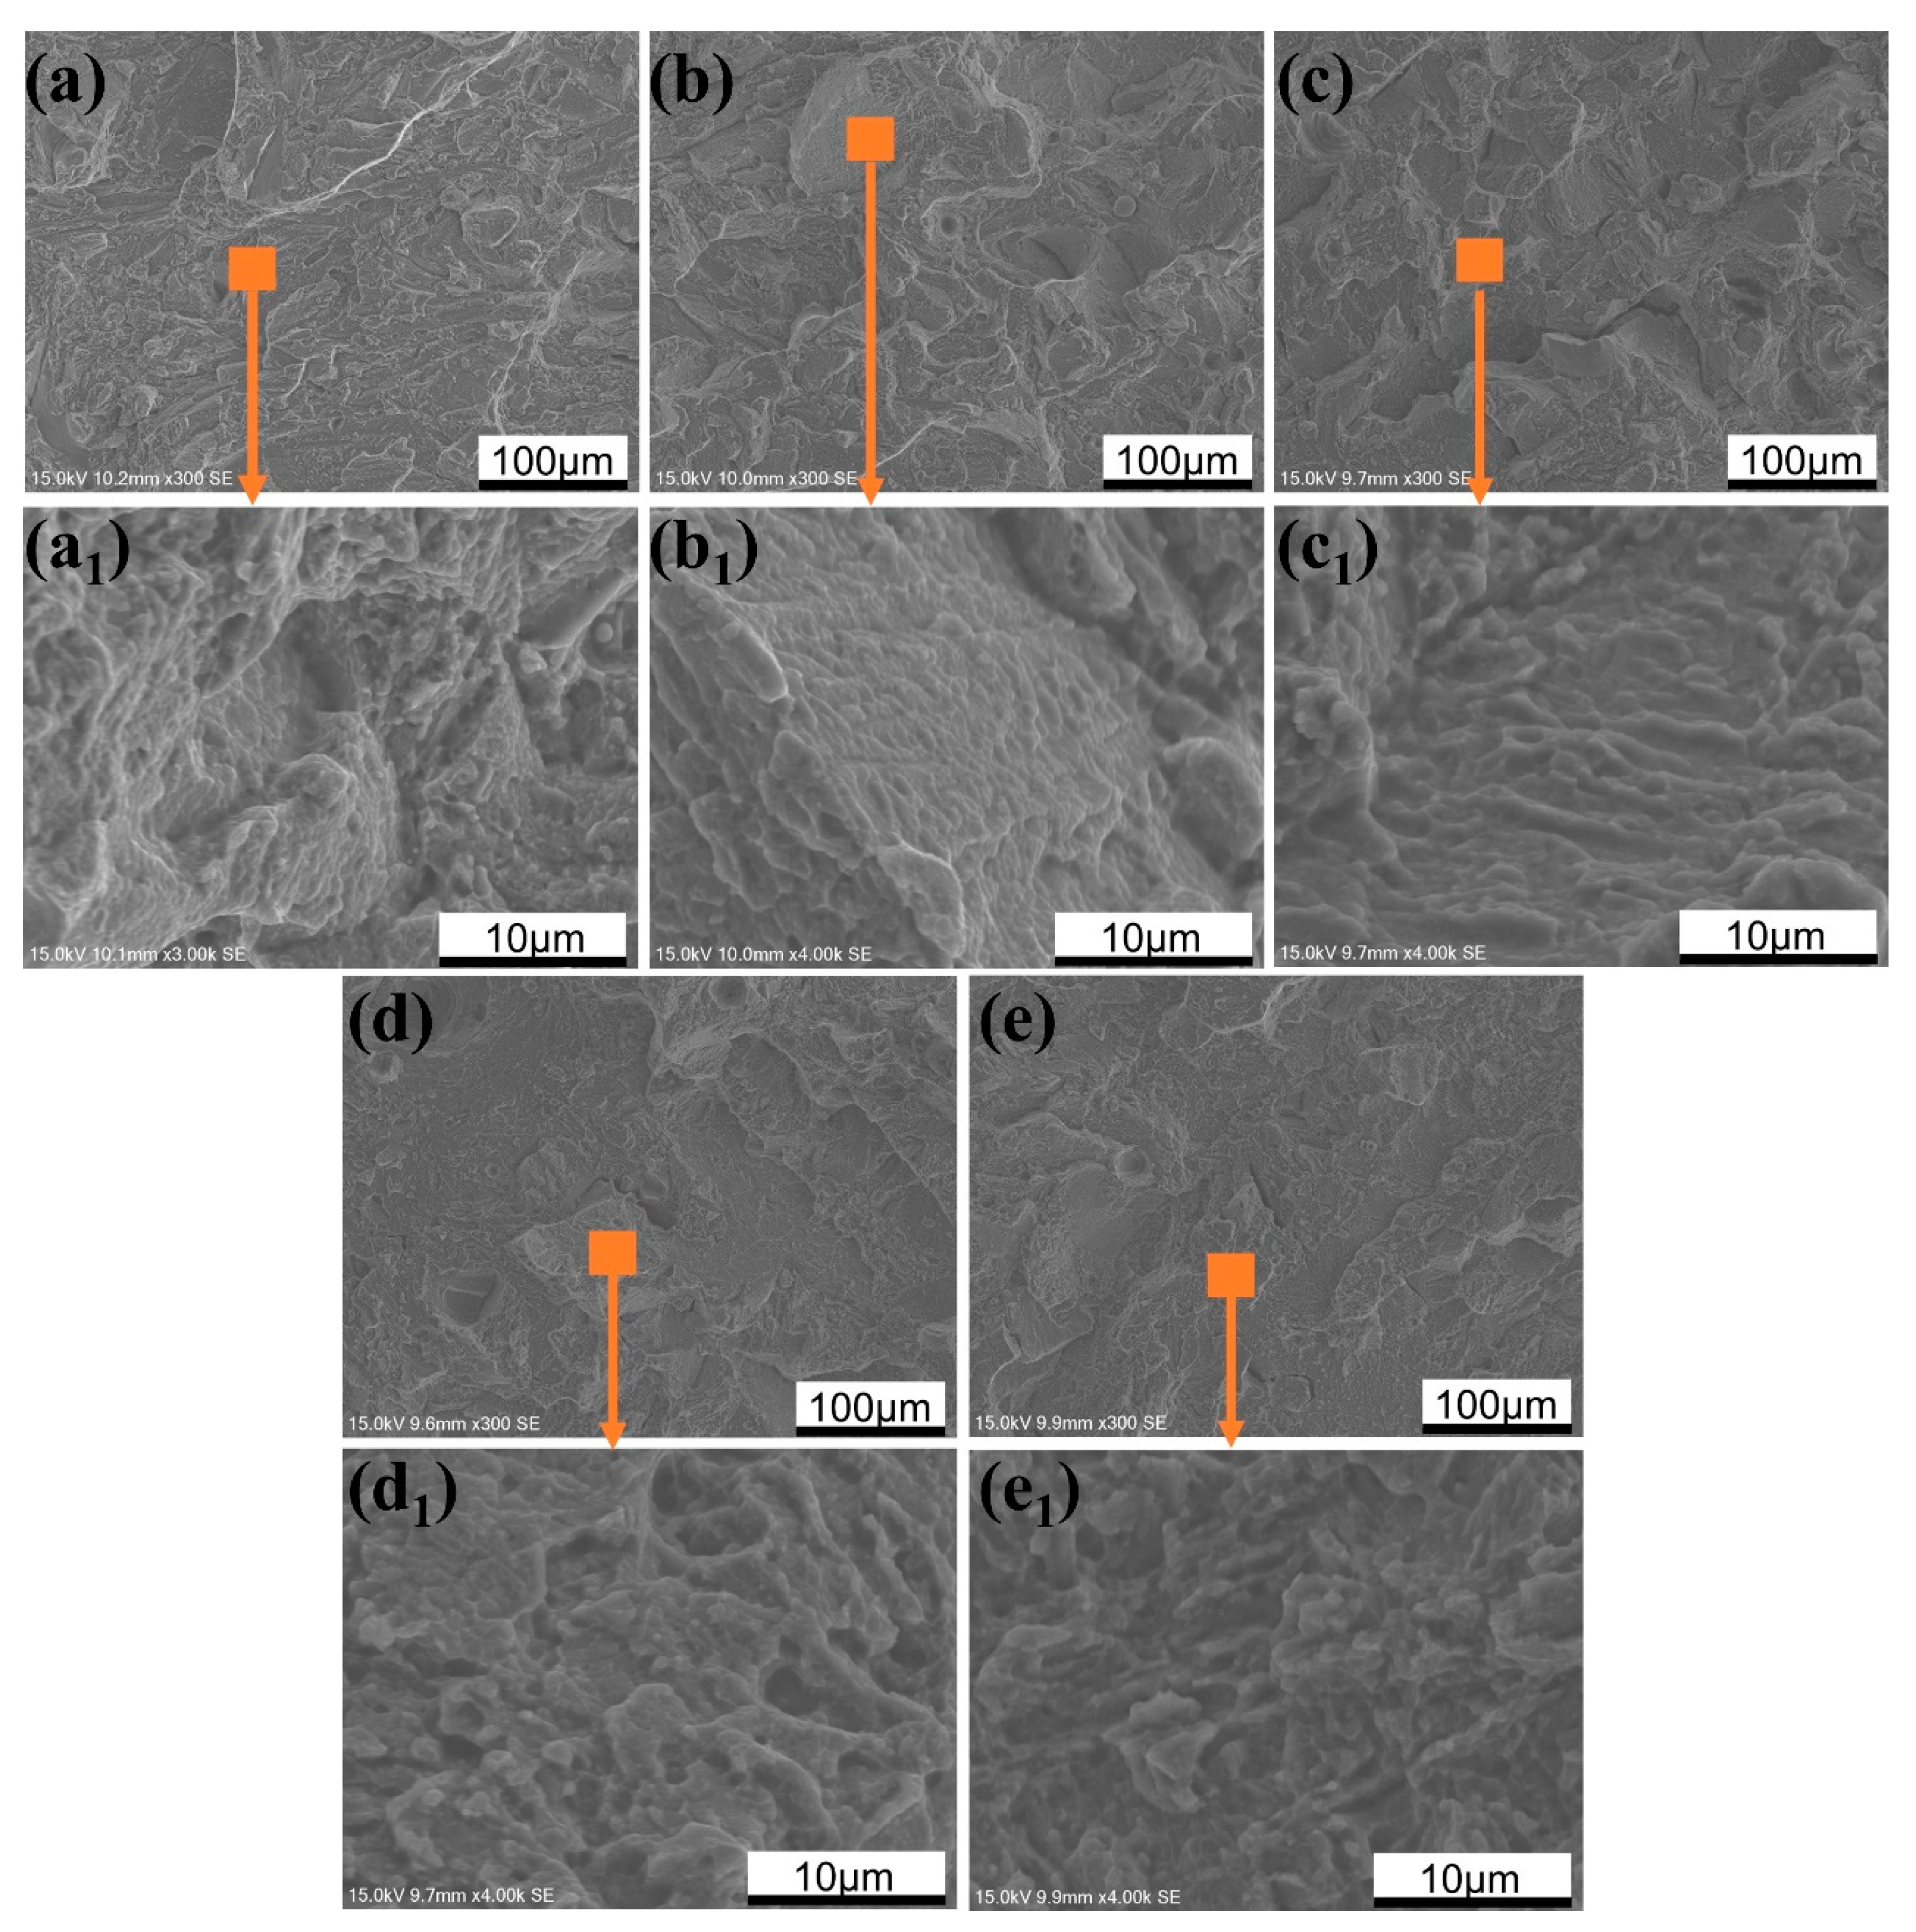
- When increasing laser power, the tensile strength and yield strength of SLM TA32 specimens increase first and then decrease. The maximum value of TA32 specimen is measured as 1225 MPa with a laser power of 300 W. While increasing laser power, the ductility of TA32 specimens has no obvious developing trend. The strength and ductility of TA32 specimens are significantly affected by build defects. Specimens built with a laser power of 200 W show a lower strength and ductility due to the occurrence of a huge number of defects with large size. Fracture analysis results demonstrated that the fracture mode of SLM TA32 specimens is cleavage fracture.
- (3)
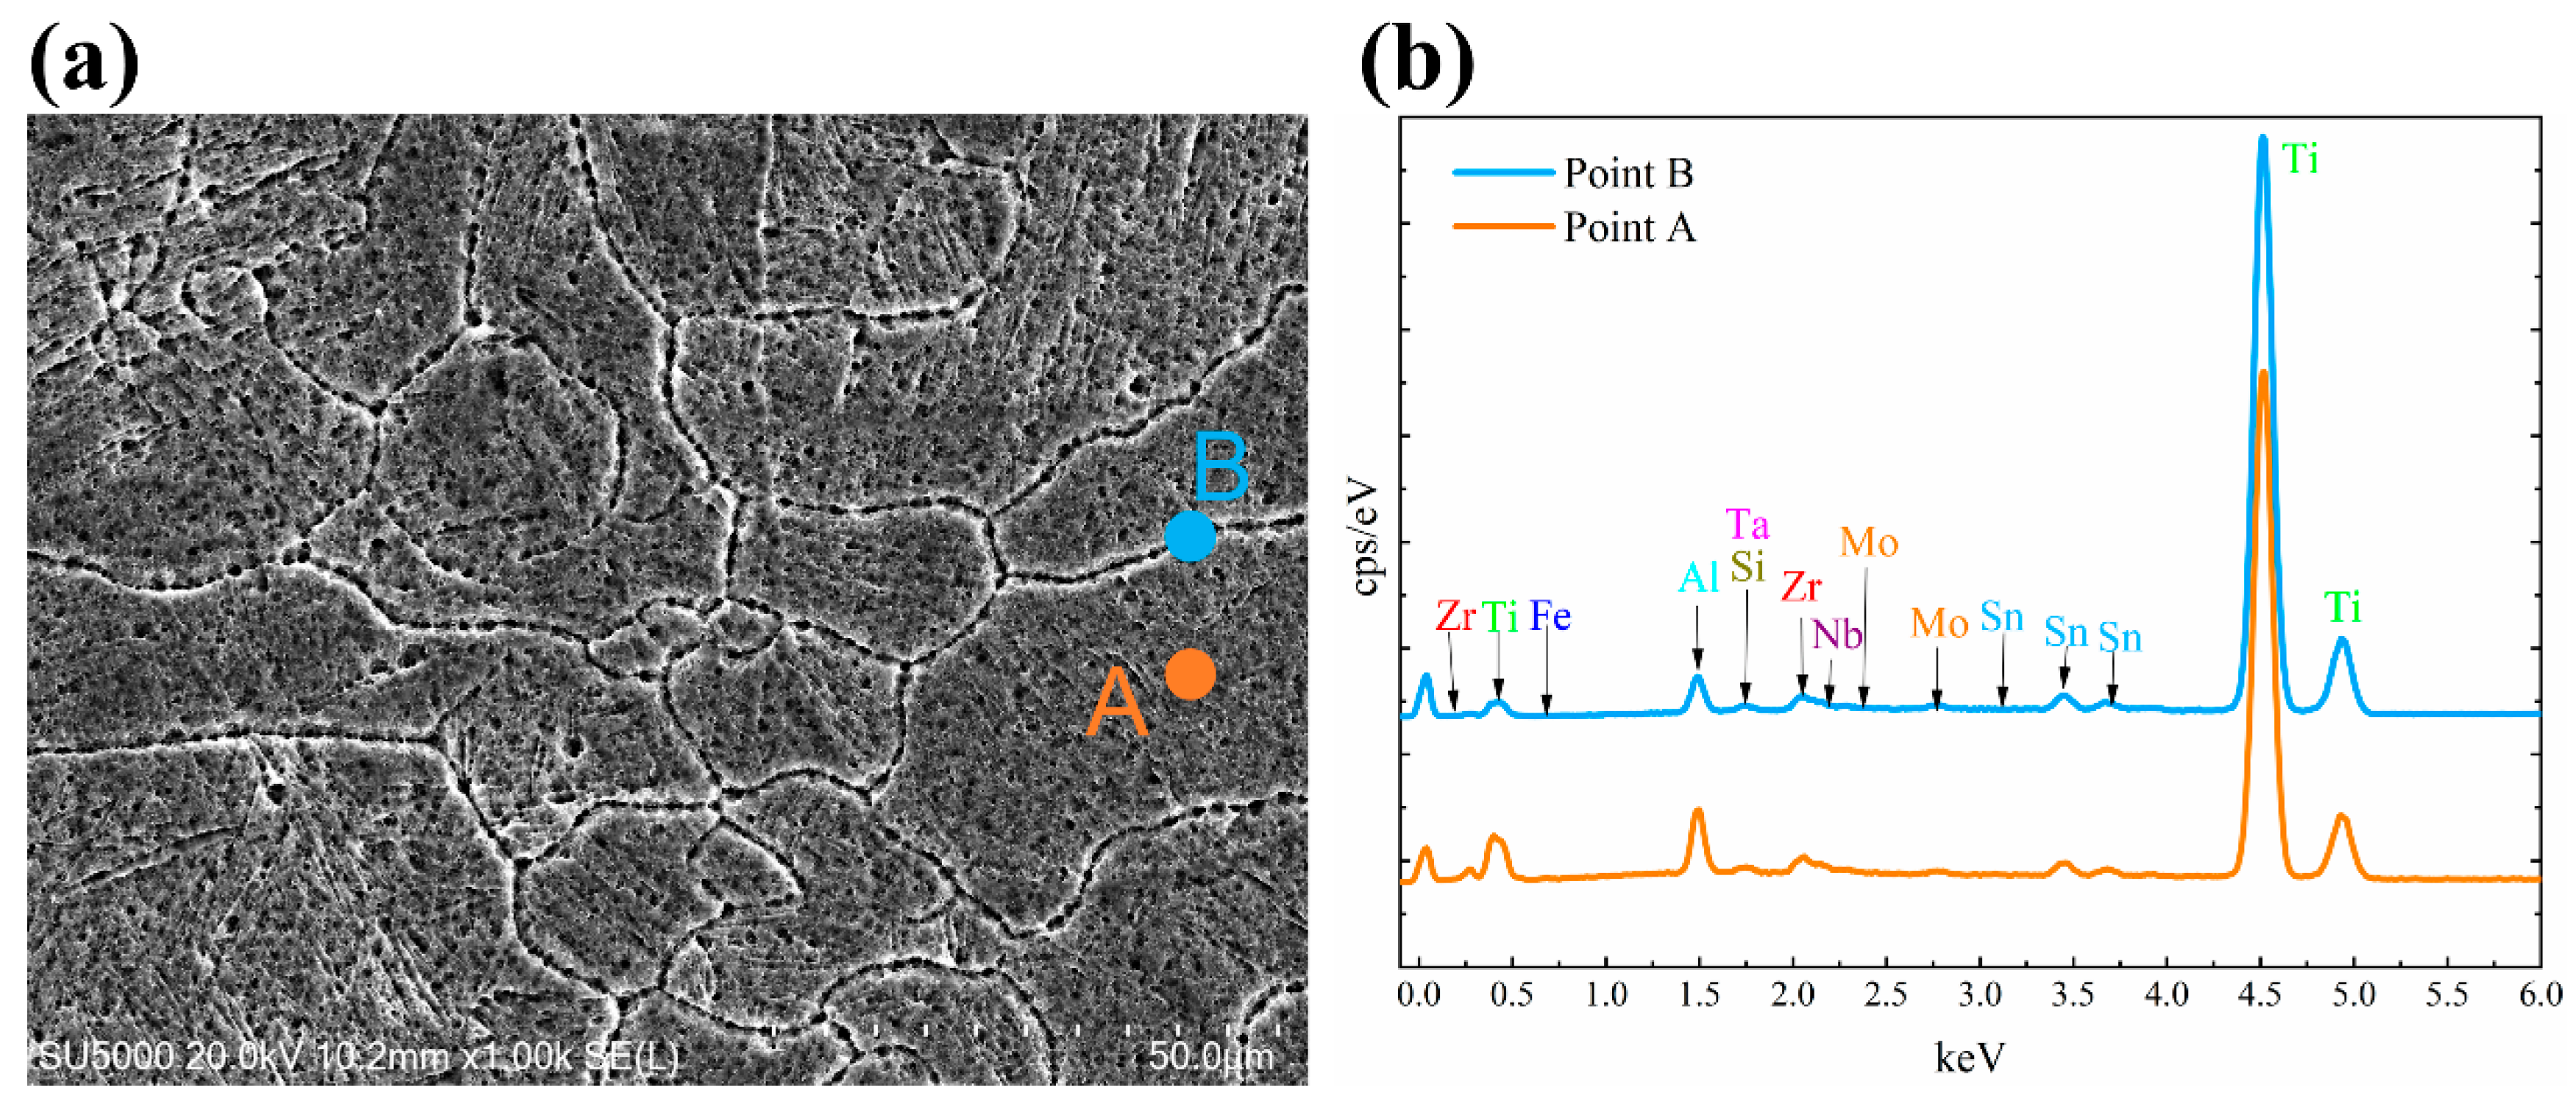
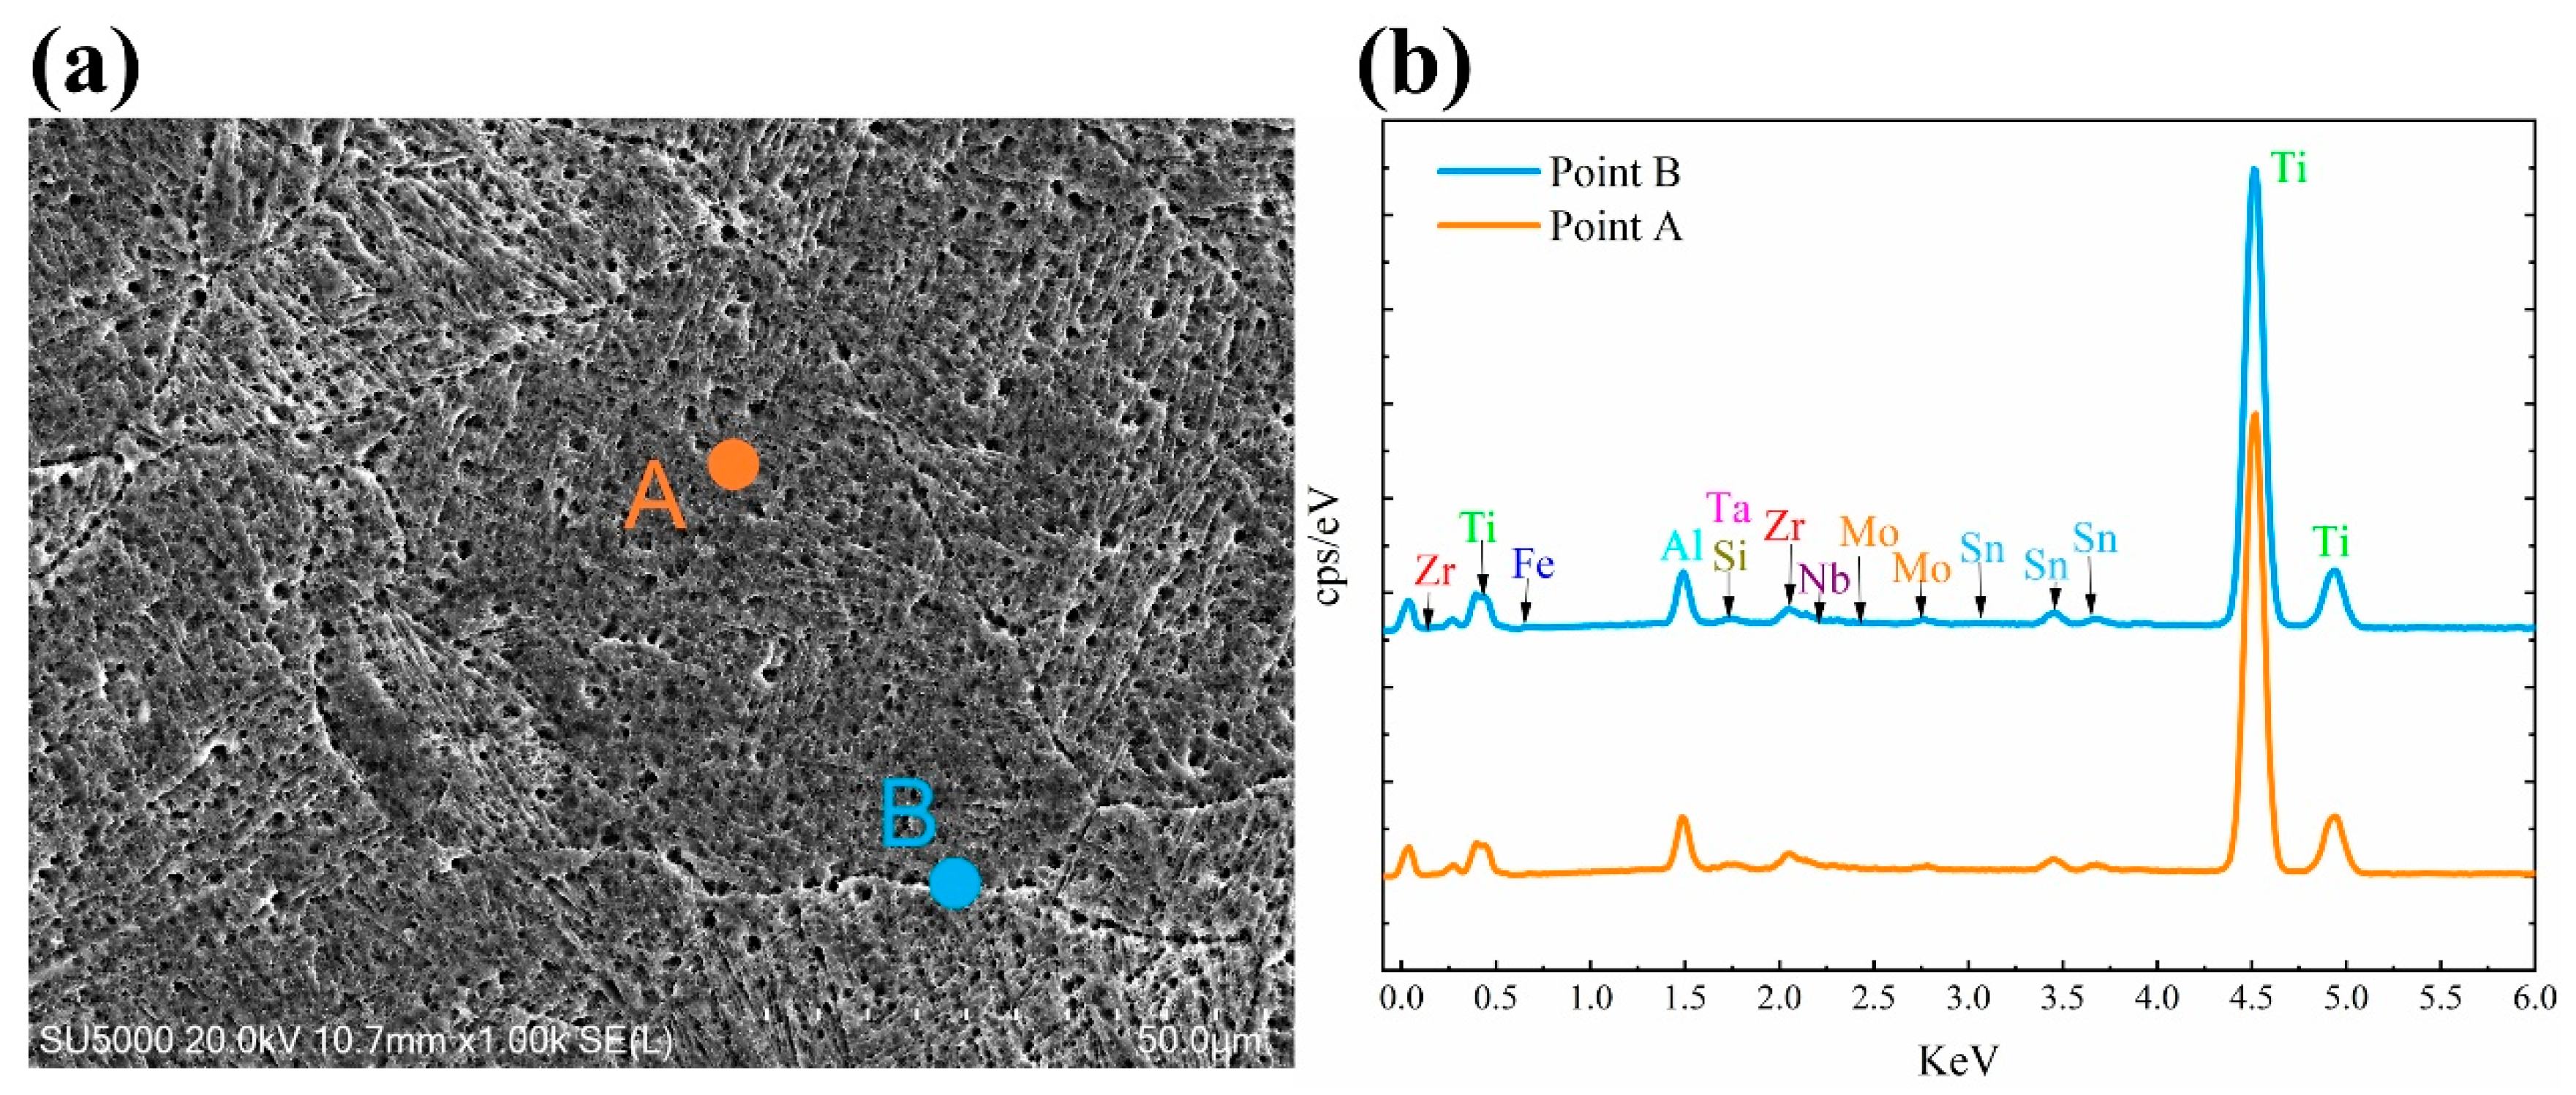
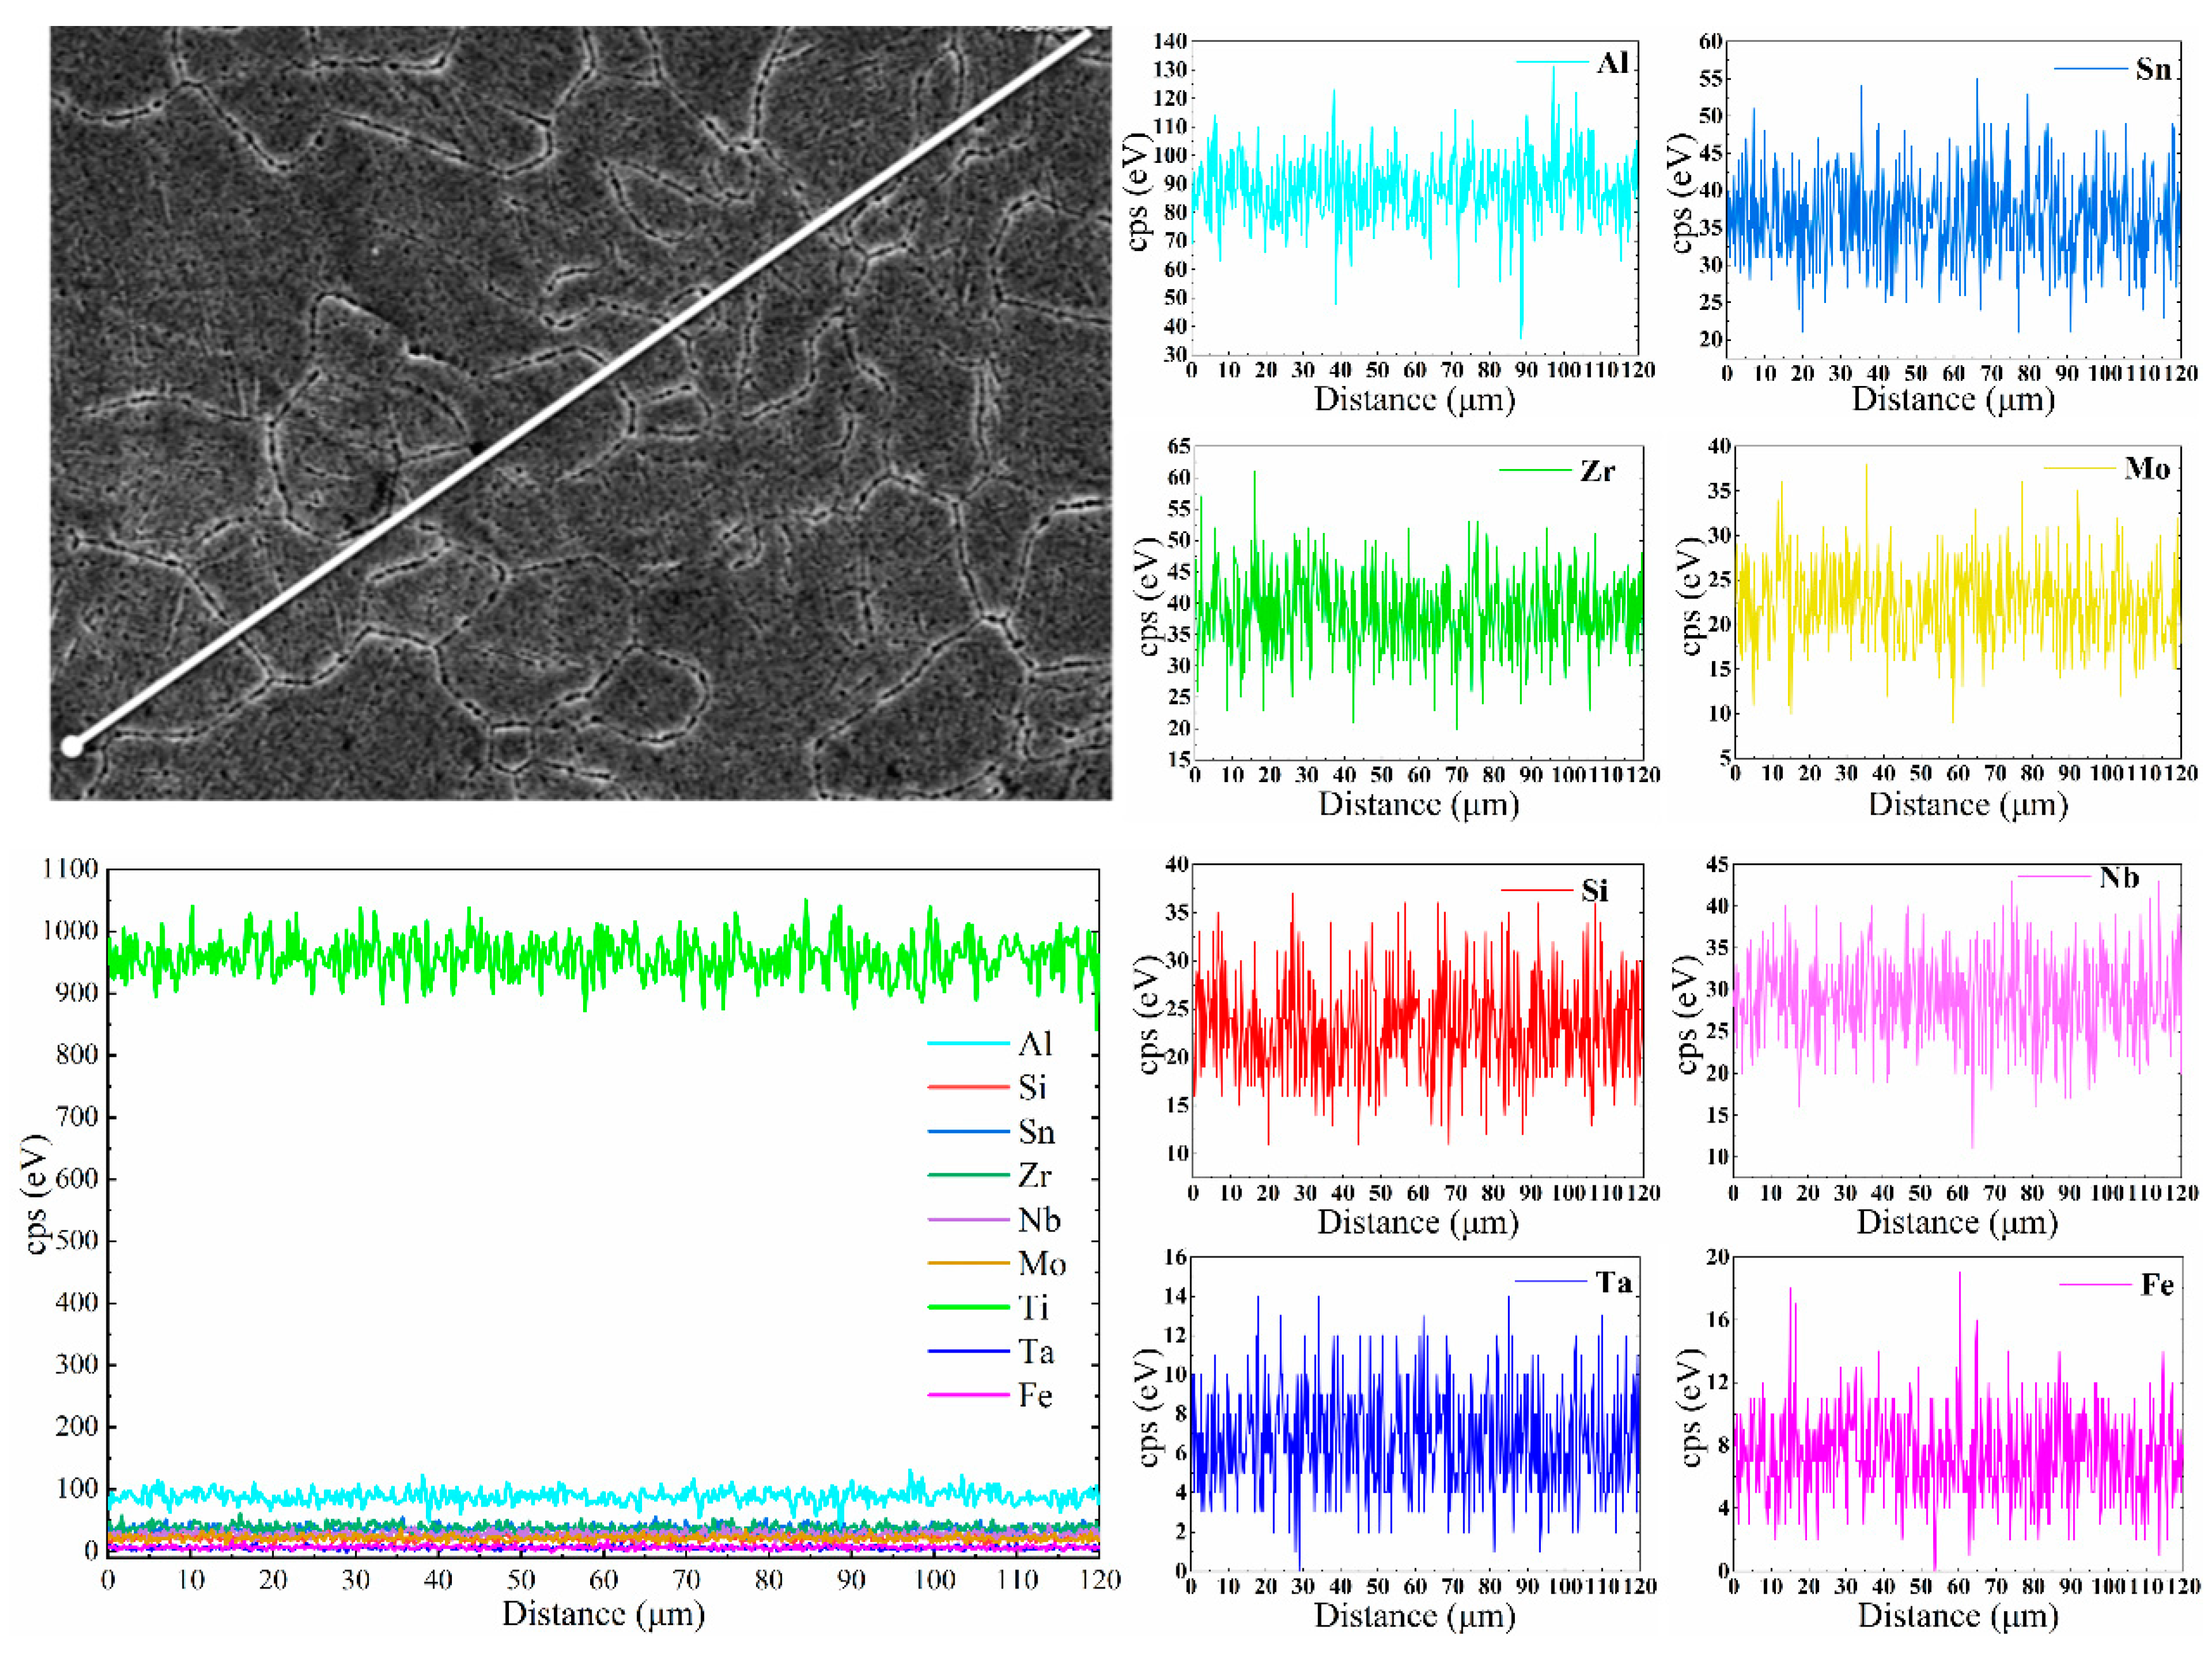
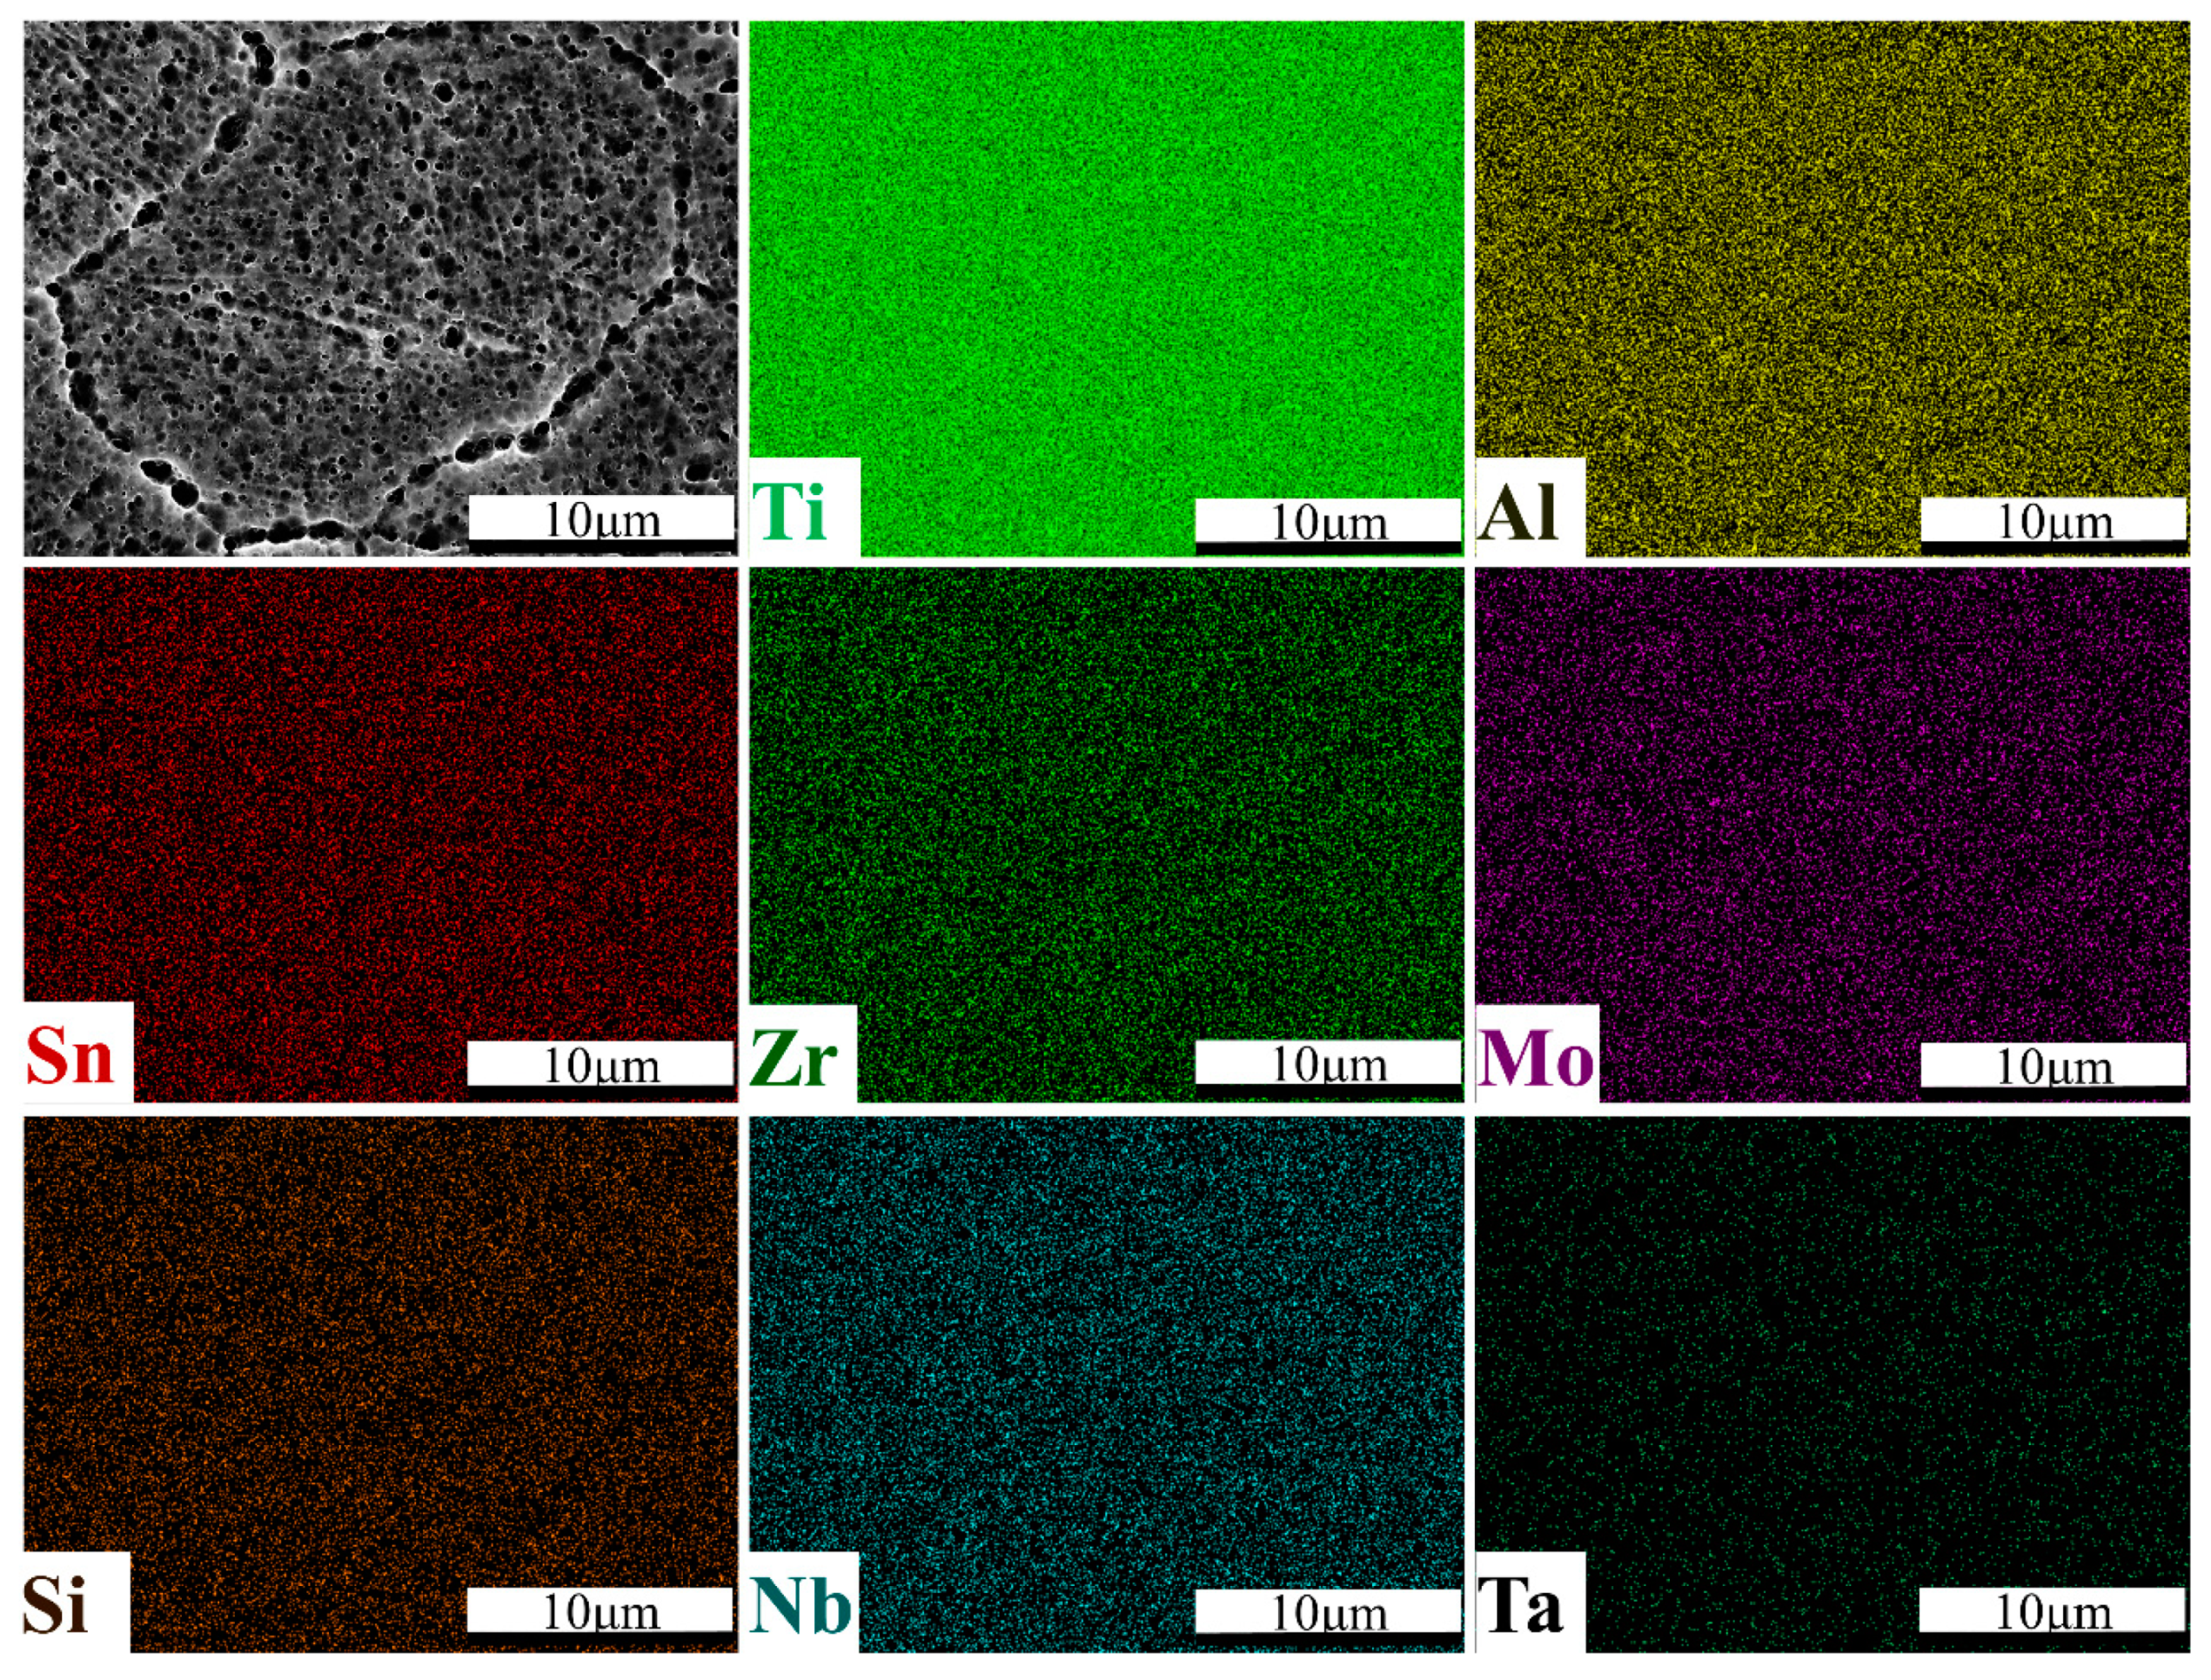
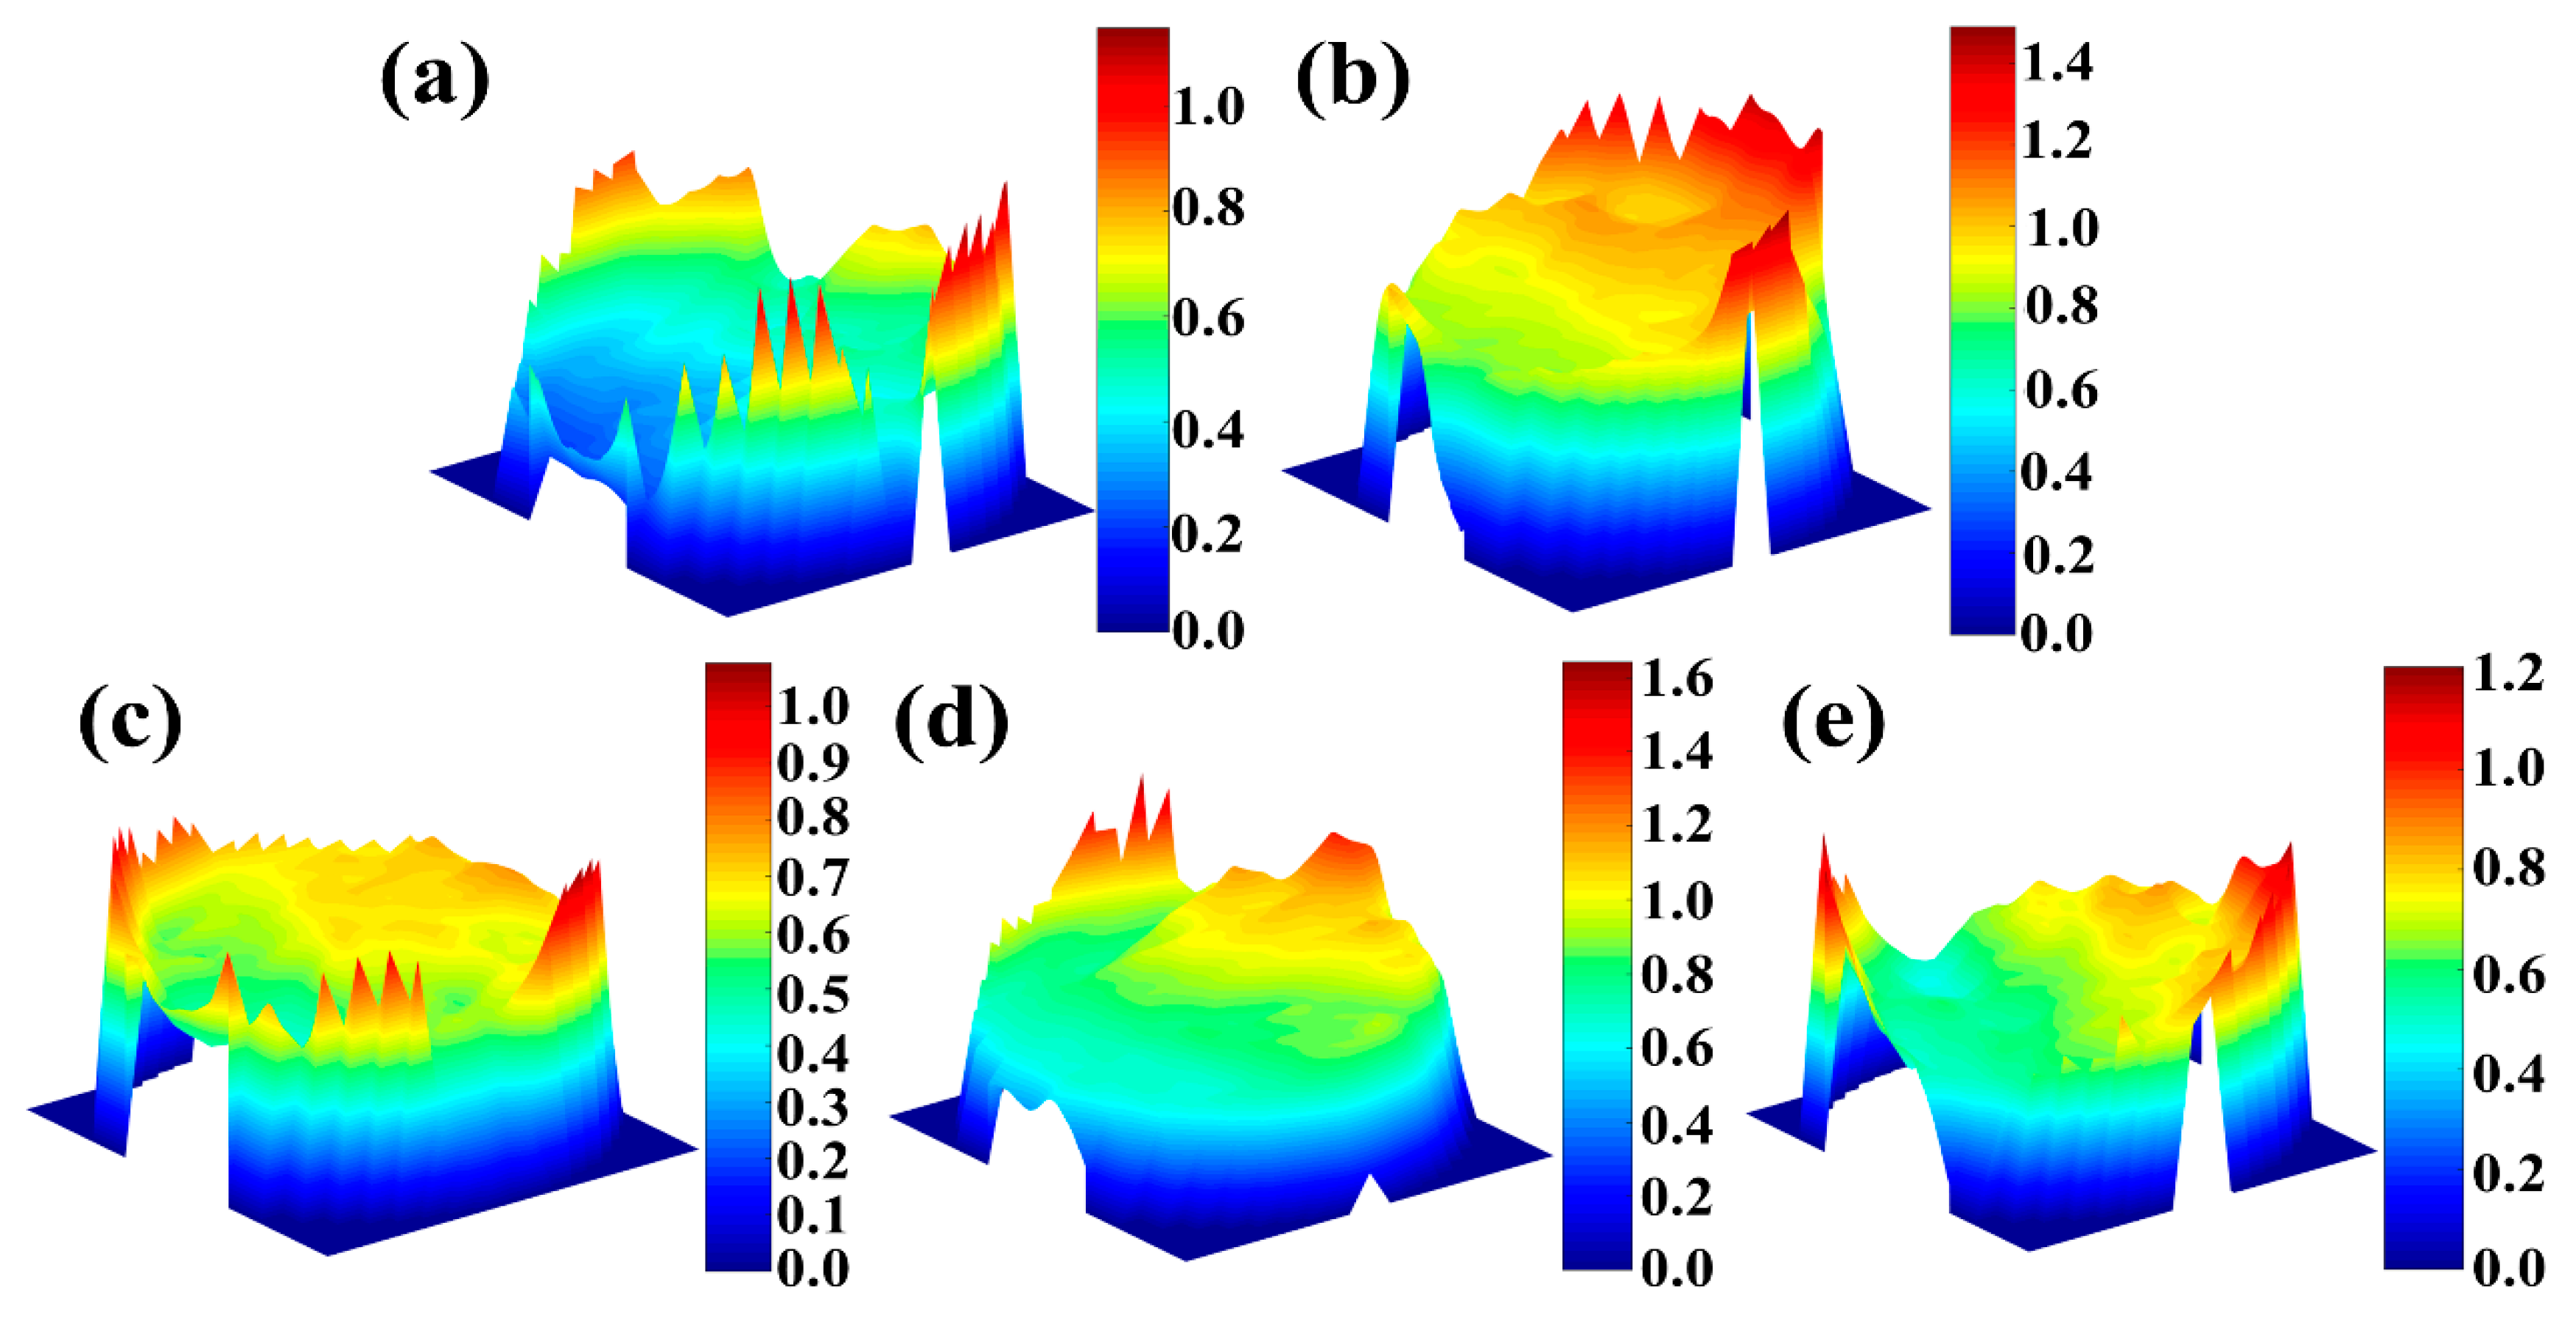
- Al concentration inner grains is higher than that near grain boundaries for specimens built with different laser powers; however, the concentration of Al element is nearly the same in grains and grain boundaries when a laser power of 400 W was adopted, indicating that the elements diffusion is more sufficient with a relatively higher laser power.
- (4)
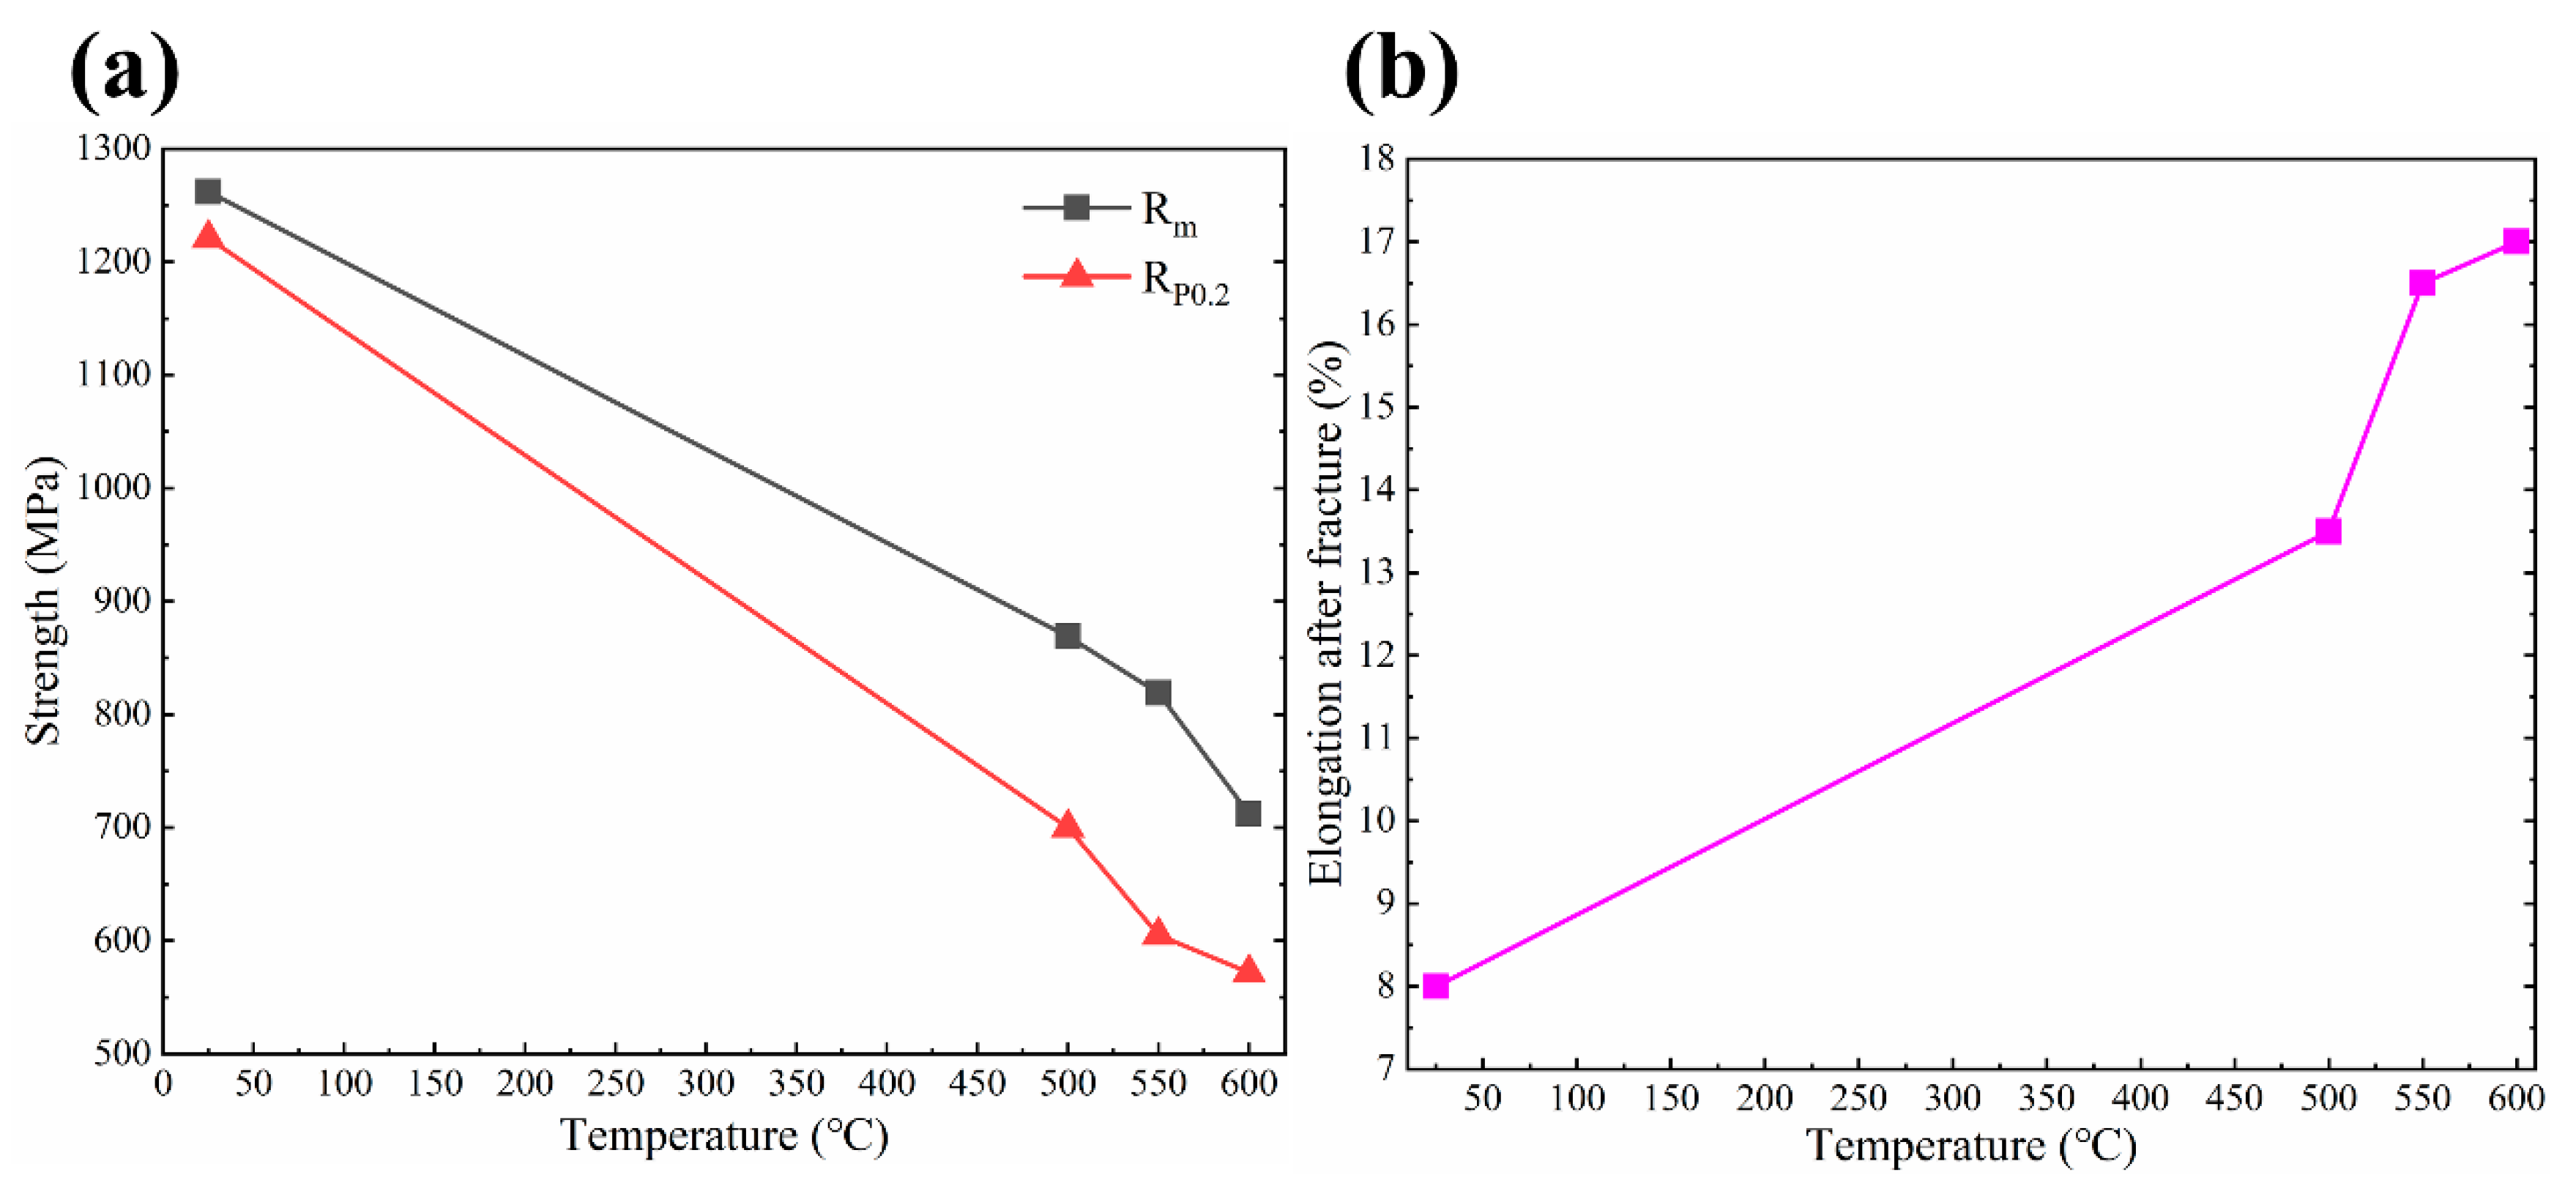
- The tensile strength of the specimens built with a laser power of 250 W at 500 °C, 550 °C and 600 °C was measured as 869 MPa, 819 MPa and 712 MPa, respectively. The tensile strength of TA32 specimens at 550 °C is close to that of Ti-6Al-4V alloy at ambient temperature, which demonstrates that SLM TA32 specimens have an excellent high temperature mechanical property.
Author Contributions
Funding
Acknowledgments
Conflicts of Interest
References
- Liu, S.; Shin, Y.C. Additive manufacturing of Ti6Al4V alloy: A review. Mater. Des. 2019, 164, 107552. [Google Scholar] [CrossRef]
- Kannan, G.B.; Rajendran, D.K. A Review on Status of Research in Metal Additive Manufacturing. Adv. 3D Print. Addit. Manuf. Technol. 2016, 95–100. [Google Scholar] [CrossRef]
- Guo, N.; Leu, M.C. Additive manufacturing: Technology, applications and research needs. Front. Mech. Eng. 2013, 8, 215–243. [Google Scholar] [CrossRef]
- Sun, W.; Ma, Y.; Huang, W.; Zhang, W.; Qian, X. Effects of build direction on tensile and fatigue performance of selective laser melting Ti6Al4V titanium alloy. Int. J. Fatigue 2020, 130, 105260. [Google Scholar] [CrossRef]
- Yap, C.Y.; Chua, C.K.; Dong, Z.; Liu, Z.H.; Zhang, D.Q.; Loh, L.E.; Sing, S.L. Review of selective laser melting: Materials and applications. Appl. Phys. Rev. 2015, 2, 041101. [Google Scholar] [CrossRef]
- Liu, Y.; Zhicong, P.; Ming, L.; Yonggang, W.; Di, W.; Changhui, S.; Shuxin, L. Investigation into the dynamic mechanical properties of selective laser melted Ti-6Al-4V alloy at high strain rate tensile loading. Mater. Sci. Eng. A 2019, 745, 440–449. [Google Scholar] [CrossRef]
- Neikter, M.; Huang, A.; Wu, X. Microstructural characterization of binary microstructure pattern in selective laser-melted Ti-6Al-4V. Int. J. Adv. Manuf. Technol. 2019, 104, 1381–1391. [Google Scholar] [CrossRef] [Green Version]
- Liu, J.; Sun, Q.; Zhou, C.; Wang, X.; Li, H.; Guo, K.; Sun, J. Achieving Ti6Al4V alloys with both high strength and ductility via selective laser melting. Mater. Sci. Eng. A 2019, 766, 138319. [Google Scholar] [CrossRef]
- Cao, S.; Hu, Q.; Huang, A.; Chen, Z.; Sun, M.; Zhang, J.; Fu, C.; Jia, Q.; Lim, C.V.S.; Boyer, R.R.; et al. Static coarsening behaviour of lamellar microstructure in selective laser melted Ti–6Al–4V. J. Mater. Sci. Technol. 2019, 35, 1578–1586. [Google Scholar] [CrossRef]
- Xu, Z.; Liu, A.; Wang, X. The influence of building direction on the fatigue crack propagation behavior of Ti6Al4V alloy produced by selective laser melting. Mater. Sci. Eng. A 2019, 767, 138409. [Google Scholar] [CrossRef]
- Moridi, A.; Demir, A.G.; Caprio, L.; Hart, A.J.; Previtali, B.; Colosimo, B.M. Deformation and failure mechanisms of Ti–6Al–4V as built by selective laser melting. Mater. Sci. Eng. A 2019, 768, 138456. [Google Scholar] [CrossRef]
- Ren, S.; Chen, Y.; Liu, T.; Qu, X. Effect of Build Orientation on Mechanical Properties and Microstructure of Ti-6Al-4V Manufactured by Selective Laser Melting. Met. Mater. Trans. A 2019, 50, 4388–4409. [Google Scholar] [CrossRef]
- Zhang, H.; Dong, D.; Su, S.; Chen, A. Experimental study of effect of post processing on fracture toughness and fatigue crack growth performance of selective laser melting Ti-6Al-4V. Chin. J. Aeronaut. 2019, 32, 2383–2393. [Google Scholar] [CrossRef]
- Yang, J.; Yu, H.; Yin, J.; Gao, M.; Wang, Z.; Zeng, X. Formation and control of martensite in Ti-6Al-4V alloy produced by selective laser melting. Mater. Des. 2016, 108, 308–318. [Google Scholar] [CrossRef]
- Pal, S.; Lojen, G.; Kokol, V.; Drstvensek, I. Evolution of metallurgical properties of Ti-6Al-4V alloy fabricated in different energy densities in the Selective Laser Melting technique. J. Manuf. Process. 2018, 35, 538–546. [Google Scholar] [CrossRef]
- Wei, K.; Zeng, X.; Huang, G.; Deng, J.; Liu, M. Selective laser melting of Ti-5Al-2.5Sn alloy with isotropic tensile properties: The combined effect of densification state, microstructural morphology, and crystallographic orientation characteristics. J. Mater. Process. Technol. 2019, 271, 368–376. [Google Scholar] [CrossRef]
- Wei, K.; Wang, Z.; Li, F.; Zhang, H.; Zeng, X. Densification behavior, microstructure evolution, and mechanical performances of selective laser melted Ti-5Al-2.5Sn α titanium alloy: Effect of laser energy input. J. Alloy. Compd. 2019, 774, 1024–1035. [Google Scholar] [CrossRef]
- Wei, K.; Lv, M.; Zeng, X.; Xiao, Z.; Huang, G.; Liu, M.; Deng, J. Effect of laser remelting on deposition quality, residual stress, microstructure, and mechanical property of selective laser melting processed Ti-5Al-2.5Sn alloy. Mater. Charact. 2019, 150, 67–77. [Google Scholar] [CrossRef]
- Zhou, Y.H.; Li, W.P.; Wang, D.W.; Zhang, L.; Ohara, K.; Shen, J.; Ebel, T.; Yan, M. Selective laser melting enabled additive manufacturing of Ti–22Al–25Nb intermetallic: Excellent combination of strength and ductility, and unique microstructural features associated. Acta Mater. 2019, 173, 117–129. [Google Scholar] [CrossRef]
- Zhou, Y.; Li, W.; Zhang, L.; Zhou, S.; Jia, X.; Wang, D.; Yan, M. Selective laser melting of Ti–22Al–25Nb intermetallic: Significant effects of hatch distance on microstructural features and mechanical properties. J. Mater. Process. Technol. 2020, 276, 116398. [Google Scholar] [CrossRef]
- Gao, P.; Huang, W.; Yang, H.; Jing, G.; Liu, Q.; Wang, G.; Wang, Z.; Zeng, X. Cracking behavior and control of β-solidifying Ti-40Al-9V-0.5Y alloy produced by selective laser melting. J. Mater. Sci. Technol. 2020, 39, 144–154. [Google Scholar] [CrossRef]
- Chlebus, E.; Kuźnicka, B.; Kurzynowski, T.; Dybała, B. Microstructure and mechanical behaviour of Ti―6Al―7Nb alloy produced by selective laser melting. Mater. Charact. 2011, 62, 488–495. [Google Scholar] [CrossRef]
- Yang, Y.; Zhan, J.; Sun, Z.; Wang, H.; Lin, J.X.; Liu, Y.; Zhang, L.C. Evolution of functional properties realized by increasing laser scanning speed for the selective laser melting fabricated NiTi alloy. J. Alloy. Compd. 2019, 804, 220–229. [Google Scholar] [CrossRef]
- Ren, D.; Zhang, H.; Liu, Y.-J.; Li, S.; Jin, W.; Yang, R.; Zhang, L. Microstructure and properties of equiatomic Ti–Ni alloy fabricated by selective laser melting. Mater. Sci. Eng. A 2020, 771, 138586. [Google Scholar] [CrossRef]
- Wysocki, B.; Maj, P.; Sitek, R.; Buhagiar, J.; Kurzydłowski, K.J.; Święszkowski, W. Laser and Electron Beam Additive Manufacturing Methods of Fabricating Titanium Bone Implants. Appl. Sci. 2017, 7, 657. [Google Scholar] [CrossRef]
- Vilaro, T.; Colin, C.; Bartout, J.-D. As-Fabricated and Heat-Treated Microstructures of the Ti-6Al-4V Alloy Processed by Selective Laser Melting. Met. Mater. Trans. A 2011, 42, 3190–3199. [Google Scholar] [CrossRef]
- Rafi, H.K.; Karthik, N.V.; Gong, H.; Starr, T.L.; Stucker, B. Microstructures and Mechanical Properties of Ti6Al4V Parts Fabricated by Selective Laser Melting and Electron Beam Melting. J. Mater. Eng. Perform. 2013, 22, 3872–3883. [Google Scholar] [CrossRef]
- Simonelli, M.; Tse, Y.Y.; Tuck, C. Effect of the build orientation on the mechanical properties and fracture modes of SLM Ti–6Al–4V. Mater. Sci. Eng. A 2014, 616, 1–11. [Google Scholar] [CrossRef] [Green Version]
- Kasperovich, G.; Hausmann, J. Improvement of fatigue resistance and ductility of TiAl6V4 processed by selective laser melting. J. Mater. Process. Technol. 2015, 220, 202–214. [Google Scholar] [CrossRef]
- Xu, W.; Brandt, M.S.; Sun, S.; Elambasseril, J.; Liu, Q.; Latham, K.; Xia, K.; Qian, M. Additive manufacturing of strong and ductile Ti–6Al–4V by selective laser melting via in situ martensite decomposition. Acta Mater. 2015, 85, 74–84. [Google Scholar] [CrossRef]
- Ismaeel, A.; Wang, C.-S. Effect of Nb additions on microstructure and properties of γ-TiAl based alloys fabricated by selective laser melting. Trans. Nonferrous Metals Soc. China 2019, 29, 1007–1016. [Google Scholar] [CrossRef]
- He, Y.; Montgomery, C.; Beuth, J.; Webler, B. Melt pool geometry and microstructure of Ti6Al4V with B additions processed by selective laser melting additive manufacturing. Mater. Des. 2019, 183, 108126. [Google Scholar] [CrossRef]
- Li, H.; Yang, Z.; Cai, D.; Jia, D.; Zhou, Y. Microstructure evolution and mechanical properties of selective laser melted bulk-form titanium matrix nanocomposites with minor B4C additions. Mater. Des. 2020, 185, 108245. [Google Scholar] [CrossRef]
- Hattal, A.; Chauveau, T.; Djemai, M.; Fouchet, J.J.; Bacroix, B.; Dirras, G. Effect of nano-yttria stabilized zirconia addition on the microstructure and mechanical properties of Ti6Al4V parts manufactured by selective laser melting. Mater. Des. 2019, 180, 107909. [Google Scholar] [CrossRef]
- Wang, R.; Gu, D.; Xi, L.; Lin, K.; Guo, M.; Zhang, H. Selective laser melted TiB2/Ti6Al4V graded materials and first-principle calculations. Mater. Lett. 2019, 254, 33–36. [Google Scholar] [CrossRef]
- De Terris, T.; Andreau, O.; Peyre, P.; Adamski, F.; Koutiri, I.; Gorny, C.; Dupuy, C. Optimization and comparison of porosity rate measurement methods of Selective Laser Melted metallic parts. Addit. Manuf. 2019, 28, 802–813. [Google Scholar] [CrossRef]
- Maszybrocka, J.; Gapinski, B.; Stwora, A.; Skrabalak, G. NDT Porosity Evaluation of AlSi10Mg Samples Fabricated by Selective Laser Sintering Method. In International Scientific-Technical Conference Manufacturing; Springer: Cham, Germany, 2019; pp. 270–284. [Google Scholar]
- Hollander, D.A.; Von Walter, M.; Wirtz, T.; Sellei, R.; Schmidt-Rohlfing, B.; Paar, O.; Erli, H.-J. Structural, mechanical and in vitro characterization of individually structured Ti–6Al–4V produced by direct laser forming. Biomaterials 2006, 27, 955–963. [Google Scholar] [CrossRef]
- Facchini, L.; Magalini, E.; Robotti, P.; Molinari, A.; Höges, S.; Wissenbach, K. Ductility of a Ti-6Al-4V alloy produced by selective laser melting of prealloyed powders. Rapid Prototyp. J. 2010, 16, 450–459. [Google Scholar] [CrossRef]
- Edwards, P.; Ramulu, M. Fatigue performance evaluation of selective laser melted Ti–6Al–4V. Mater. Sci. Eng. A 2014, 598, 327–337. [Google Scholar] [CrossRef]
- Leuders, S.; Thöne, M.; Riemer, A.; Niendorf, T.; Troster, T.; Richard, H.; Maier, H. On the mechanical behaviour of titanium alloy TiAl6V4 manufactured by selective laser melting: Fatigue resistance and crack growth performance. Int. J. Fatigue 2013, 48, 300–307. [Google Scholar] [CrossRef]
- Chastand, V.; Quaegebeur, P.; Maia, W.; Charkaluk, E. Comparative study of fatigue properties of Ti-6Al-4V specimens built by electron beam melting (EBM) and selective laser melting (SLM). Mater. Charact. 2018, 143, 76–81. [Google Scholar] [CrossRef]
- Vrancken, B.; Thijs, L.; Kruth, J.-P.; Van Humbeeck, J. Heat treatment of Ti6Al4V produced by Selective Laser Melting: Microstructure and mechanical properties. J. Alloy. Compd. 2012, 541, 177–185. [Google Scholar] [CrossRef] [Green Version]
- Galarraga, H.; Lados, D.A.; Dehoff, R.R.; Kirka, M.M.; Nandwana, P. Effects of the microstructure and porosity on properties of Ti-6Al-4V ELI alloy fabricated by electron beam melting (EBM). Addit. Manuf. 2016, 10, 47–57. [Google Scholar] [CrossRef] [Green Version]
- Śliwa, R.E.; Bernaczek, J.; Budzik, G. The Application of Direct Metal Laser Sintering (DMLS) of Titanium Alloy Powder in Fabricating Components of Aircraft Structures. Key Eng. Mater. 2016, 687, 199–205. [Google Scholar] [CrossRef]
- Neikter, M.; Åkerfeldt, P.; Pederson, R.; Antti, M.-L.; Sandell, V. Microstructural characterization and comparison of Ti-6Al-4V manufactured with different additive manufacturing processes. Mater. Charact. 2018, 143, 68–75. [Google Scholar] [CrossRef]


| Sample ID | 1 | 2 | 3 | 4 | 5 |
| Laser power/W | 200 | 250 | 300 | 350 | 400 |
| Scan speed/(mm/s) | 1000 | ||||
| Scan line hatch spacing/mm | 0.12 | ||||
| Thickness of powder layers/mm | 0.06 | ||||
| Laser Power/W | Position | Elements | Al | Si | Ti | Fe | Zr | Nb | Mo | Sn | Ta |
|---|---|---|---|---|---|---|---|---|---|---|---|
| 200 | A | wt.% | 5.03 | 0.41 | 86.27 | 0.00 | 3.08 | 0.54 | 0.62 | 3.76 | 0.30 |
| 200 | B | wt.% | 3.92 | 0.23 | 87.58 | 0.00 | 2.86 | 0.62 | 0.67 | 3.52 | 0.60 |
| 300 | A | wt.% | 5.44 | 0.35 | 86.10 | 0.04 | 2.94 | 0.68 | 0.51 | 3.74 | 0.21 |
| 300 | B | wt.% | 2.78 | 0.32 | 90.01 | 0.09 | 2.29 | 0.35 | 0.45 | 3.69 | 0.01 |
| 400 | A | wt.% | 4.97 | 0.31 | 87.36 | 0.03 | 2.99 | 0.45 | 0.44 | 3.43 | 0.03 |
| 400 | B | wt.% | 4.84 | 0.29 | 86.96 | 0.00 | 2.86 | 0.61 | 0.57 | 3.73 | 0.14 |
Publisher’s Note: MDPI stays neutral with regard to jurisdictional claims in published maps and institutional affiliations. |
© 2020 by the authors. Licensee MDPI, Basel, Switzerland. This article is an open access article distributed under the terms and conditions of the Creative Commons Attribution (CC BY) license (http://creativecommons.org/licenses/by/4.0/).
Share and Cite
Ran, J.; Sun, X.; Wei, S.; Chen, Z.; Zhao, H. Achieving Ti-5Al-4Sn-2Zr-1Mo-0.25Si-1Nb Alloys with High Strength and Moderate Ductility through Selective Laser Melting. Materials 2020, 13, 5527. https://doi.org/10.3390/ma13235527
Ran J, Sun X, Wei S, Chen Z, Zhao H. Achieving Ti-5Al-4Sn-2Zr-1Mo-0.25Si-1Nb Alloys with High Strength and Moderate Ductility through Selective Laser Melting. Materials. 2020; 13(23):5527. https://doi.org/10.3390/ma13235527
Chicago/Turabian StyleRan, Jiangtao, Xiaojing Sun, Shiliang Wei, Zhuo Chen, and Hong Zhao. 2020. "Achieving Ti-5Al-4Sn-2Zr-1Mo-0.25Si-1Nb Alloys with High Strength and Moderate Ductility through Selective Laser Melting" Materials 13, no. 23: 5527. https://doi.org/10.3390/ma13235527