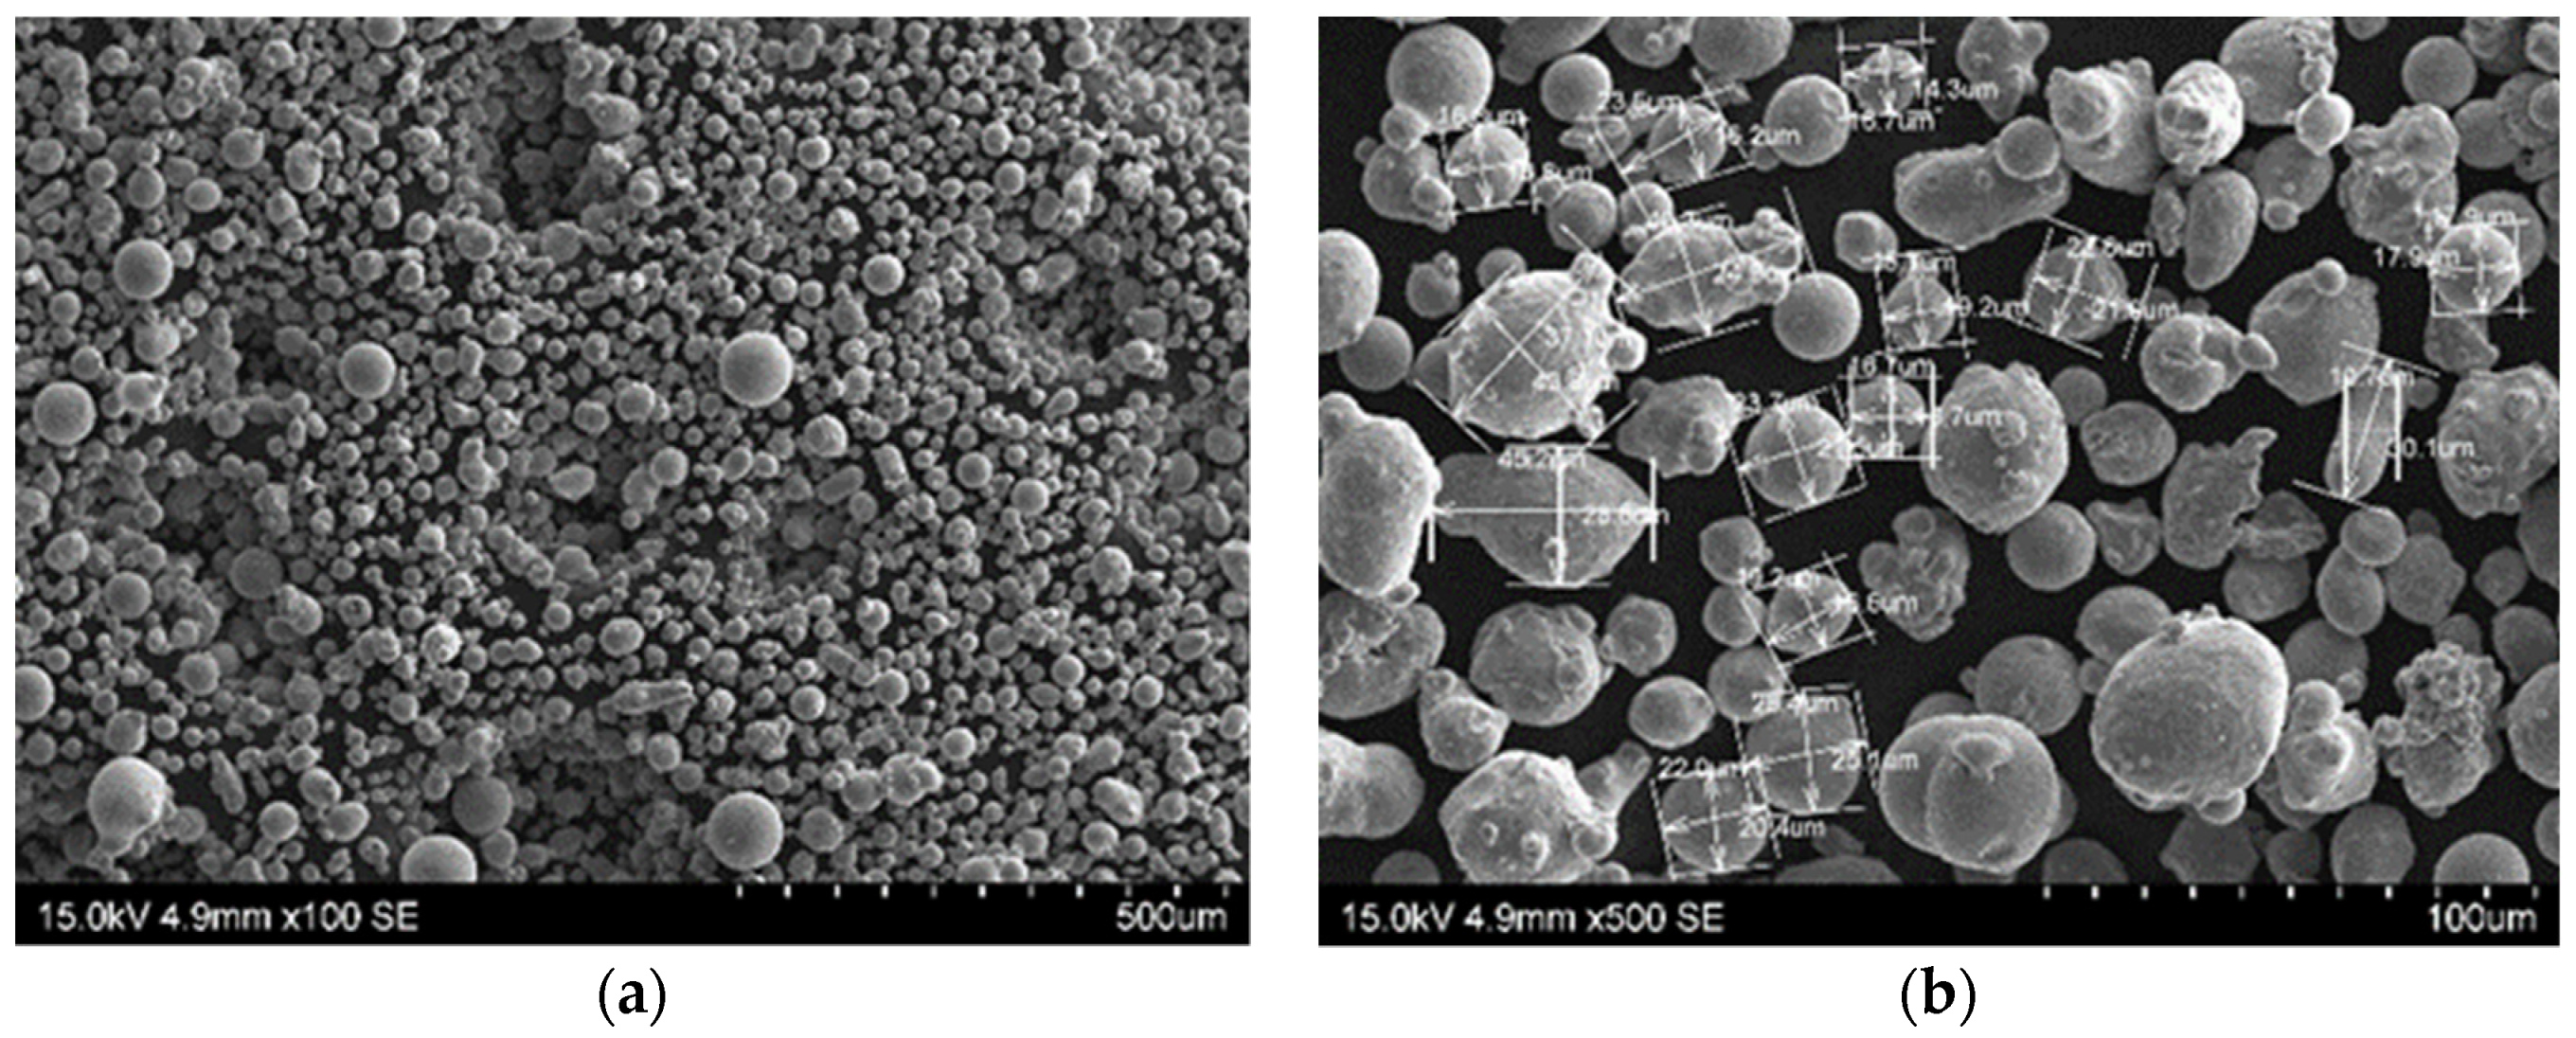
Figure 1.
Scanning electron microscopy (SEM) morphology of 1.2709-grade maraging steel powder: (a) Image of steel powder; (b) different grain sizes marked.
Figure 1.
Scanning electron microscopy (SEM) morphology of 1.2709-grade maraging steel powder: (a) Image of steel powder; (b) different grain sizes marked.
Figure 2.
Size distribution of 1.2709-grade maraging steel powder.
Figure 2.
Size distribution of 1.2709-grade maraging steel powder.
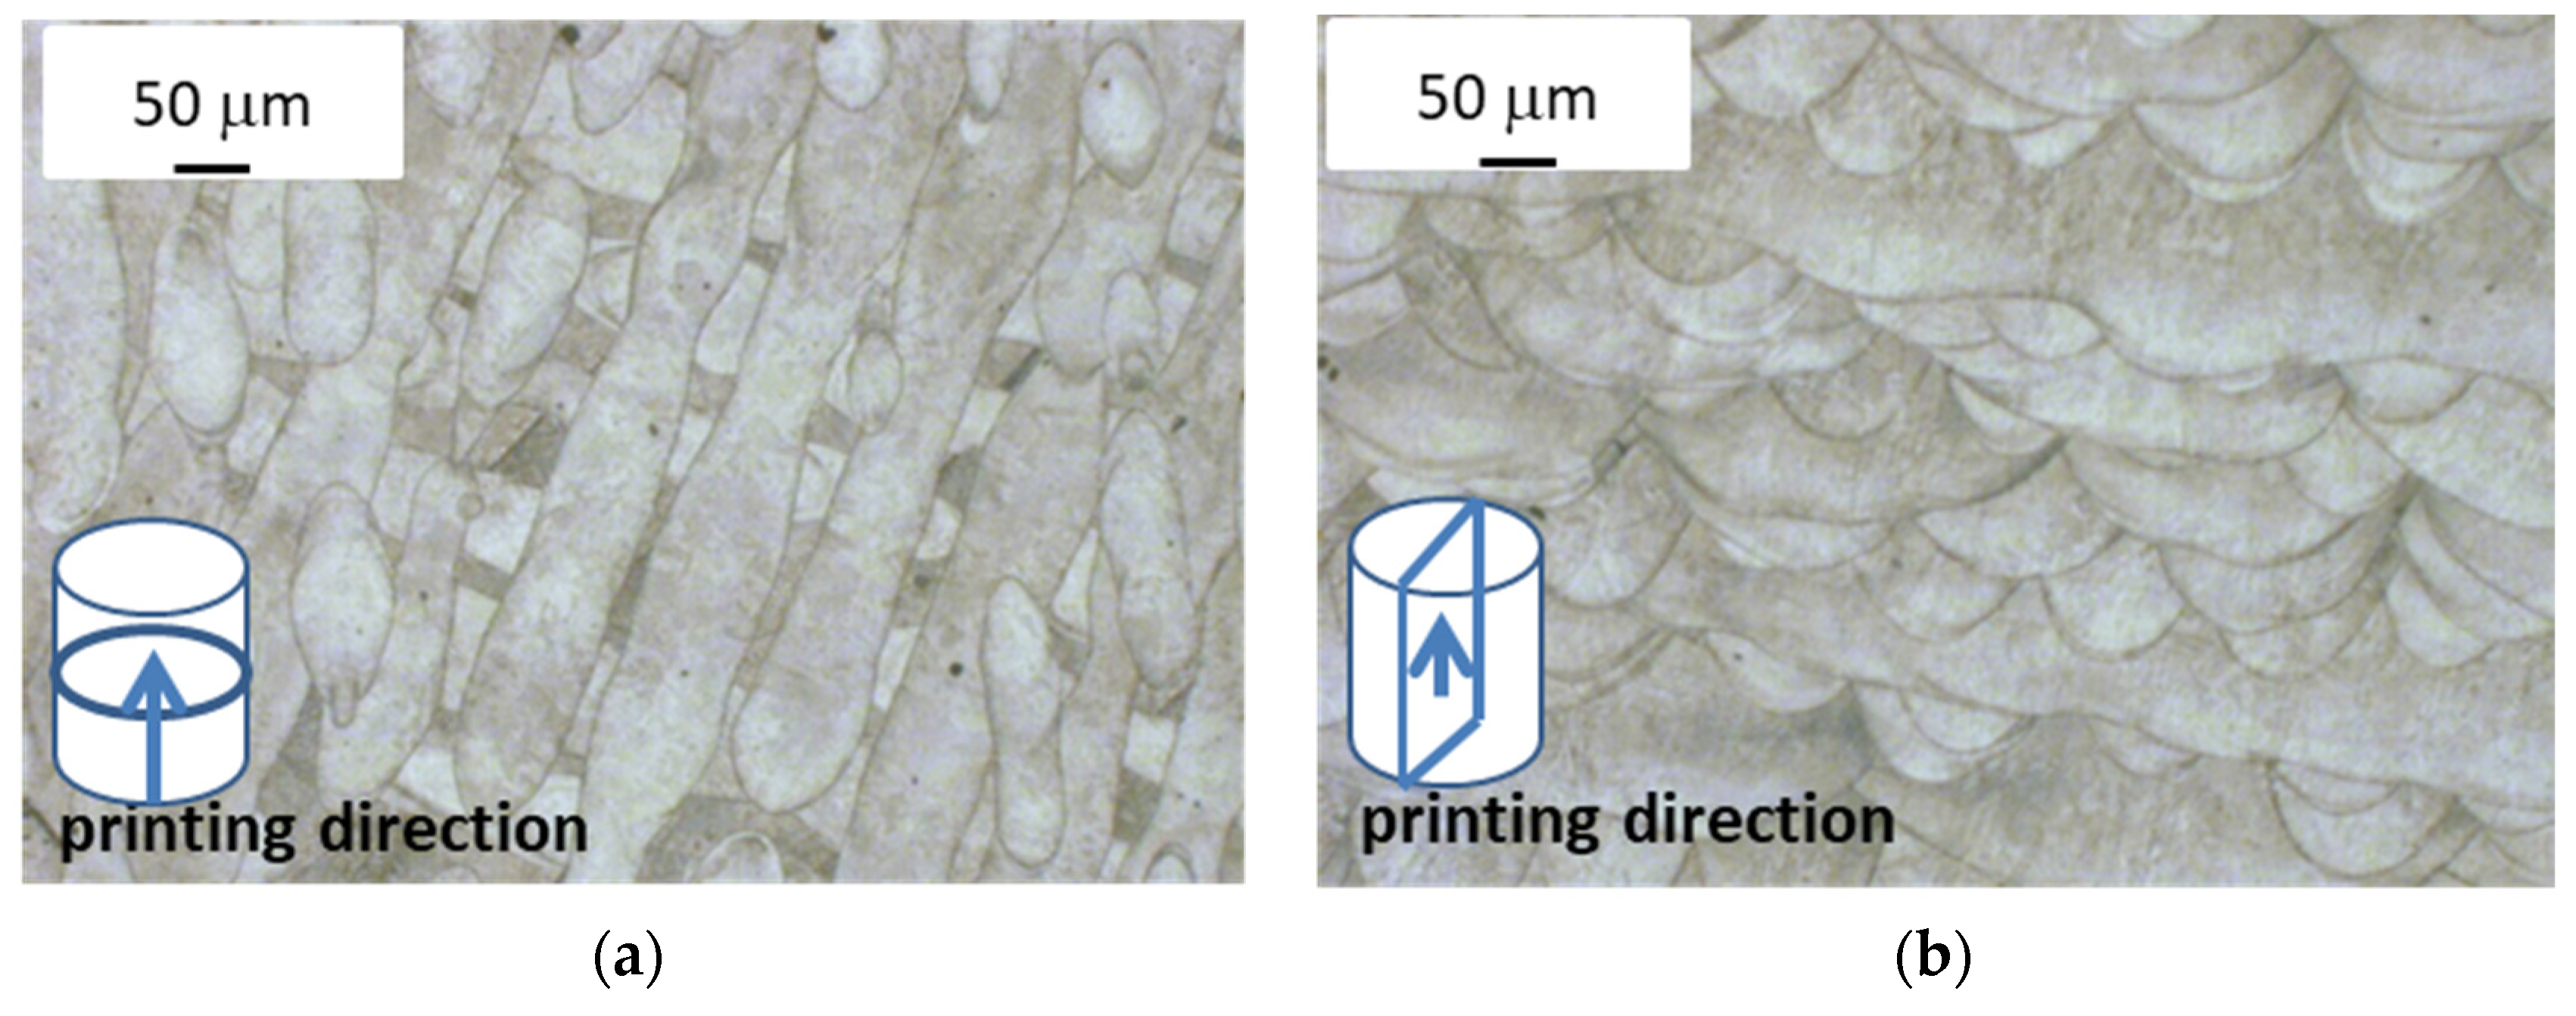
Figure 3.
Images of printed alloy microstructure (optical microscope). (a) View direction perpendicular to direction of laser scanning path (top view); (b) view direction parallel to direction of laser scanning path (lateral view).
Figure 3.
Images of printed alloy microstructure (optical microscope). (a) View direction perpendicular to direction of laser scanning path (top view); (b) view direction parallel to direction of laser scanning path (lateral view).
Figure 4.
Image of alloy microstructure after solidification: (a) Elongated grains from the side view using an optical microscope; (b) oblong precipitate containing over 60%Ti present in alloy structure, taken with a scanning microscope; (c) different cell sizes in alloy structure, taken with a scanning microscope; (d) epitaxial growth of crystal lattice between scanning paths, taken with a scanning microscope.
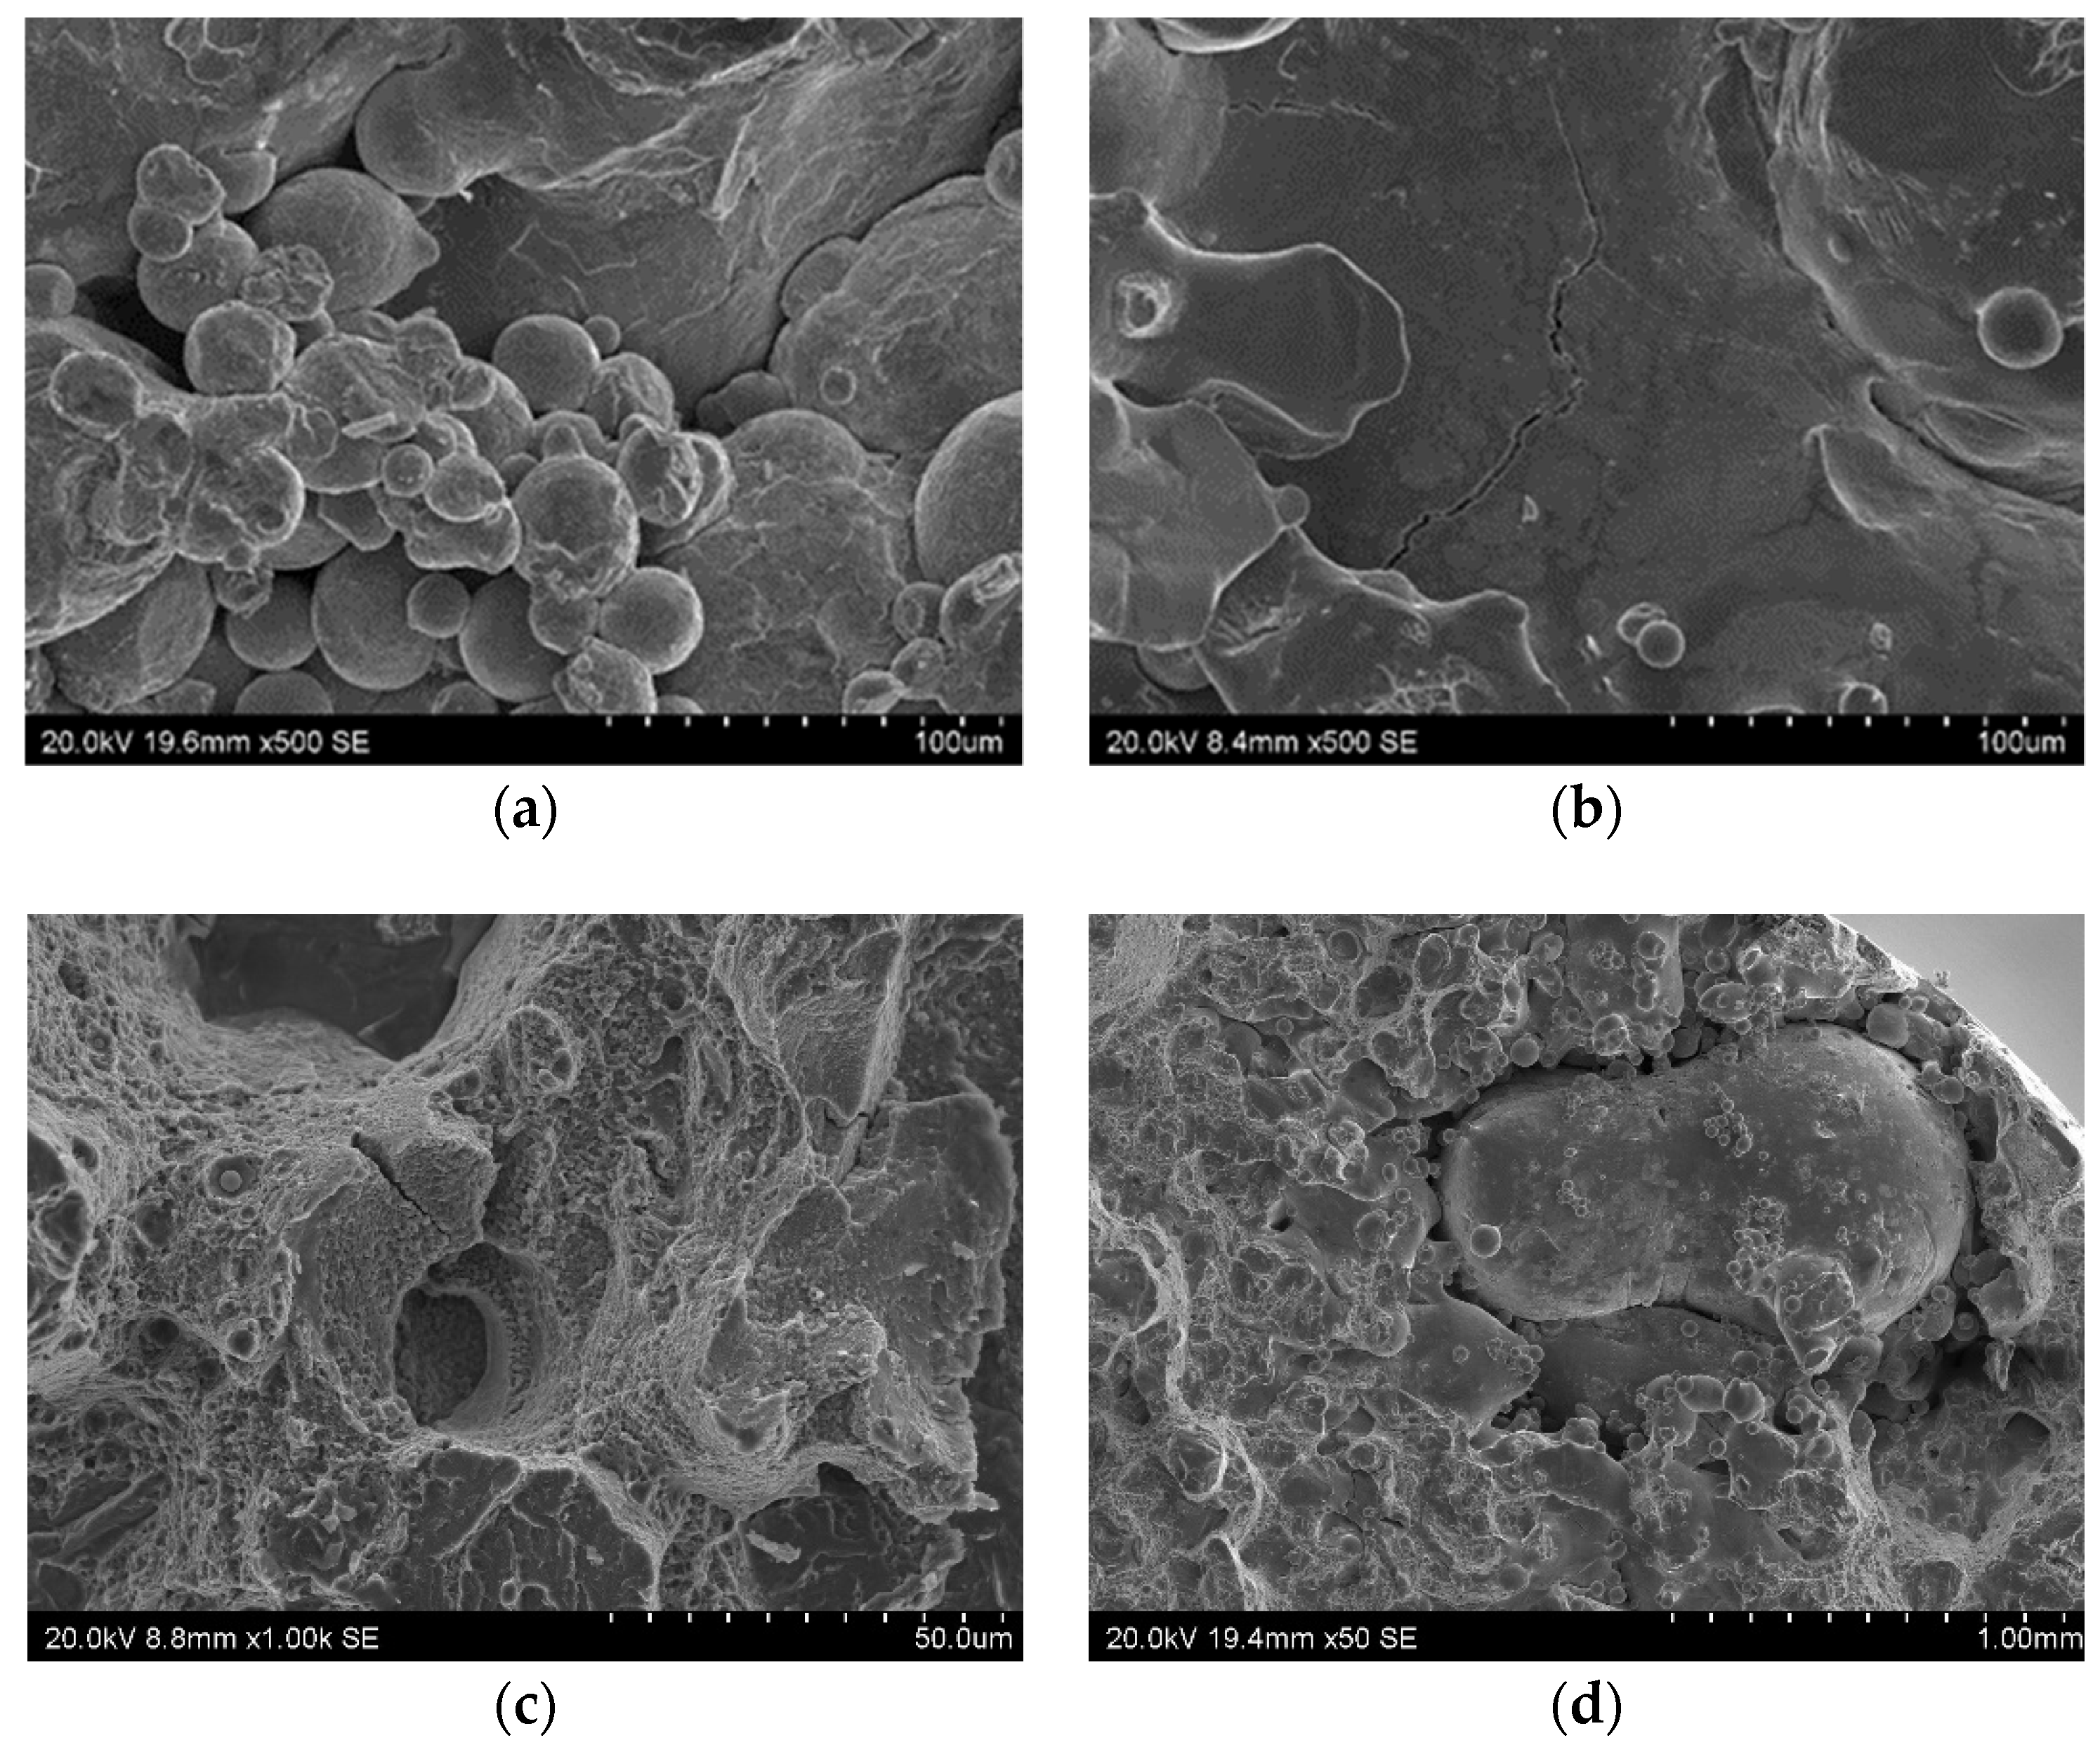
Figure 5.
Defects found in sample fractures (scanning microscope): (a) A large cluster of partially-melted powder (alloy after aging); (b) a crack in the zone containing powder blown out by argon (alloy in raw state); (c) two craters connected by a crack (alloy after aging); (d) a large defect caused by the incorrect fusion of powder (alloy in raw state).
Figure 6.
Porosity in printed alloy (as-built material), taken with an optical microscope at (a) low; and (b) high magnifications.
Figure 6.
Porosity in printed alloy (as-built material), taken with an optical microscope at (a) low; and (b) high magnifications.
Figure 7.
Macroscopic image of sample fractures with unmerged powder area (a,b); (c) unmerged powder area; (d) sample fracture outside unmerged powder area.
Figure 7.
Macroscopic image of sample fractures with unmerged powder area (a,b); (c) unmerged powder area; (d) sample fracture outside unmerged powder area.
Figure 8.
Processed particles: (a) Optical microscope image of an entire particle with porosity and cracks; (b) SEM image of fracture at the boundary of a particle and material.
Figure 8.
Processed particles: (a) Optical microscope image of an entire particle with porosity and cracks; (b) SEM image of fracture at the boundary of a particle and material.
Figure 9.
Typical tensile curves obtained for tested raw alloy and images of sample fractures.
Figure 9.
Typical tensile curves obtained for tested raw alloy and images of sample fractures.
Figure 10.
Typical tensile curves obtained for tested alloy after heat treatment and images of sample fractures: (a) Temperature of 540 °C and duration of 1 h; (b) temperature of 540 °C and duration of 8 h.
Figure 10.
Typical tensile curves obtained for tested alloy after heat treatment and images of sample fractures: (a) Temperature of 540 °C and duration of 1 h; (b) temperature of 540 °C and duration of 8 h.
Figure 11.
Computer Aided Design (CAD) drawing of sprue spreader: (a) Outside view, diameter of spreader’s outer profile is 110 mm and its height is 50 mm; (b) conformal channel design, diameter of 10 mm.
Figure 11.
Computer Aided Design (CAD) drawing of sprue spreader: (a) Outside view, diameter of spreader’s outer profile is 110 mm and its height is 50 mm; (b) conformal channel design, diameter of 10 mm.
Figure 12.
Sprue spreader used in die casting of the AlSi alloy.
Figure 12.
Sprue spreader used in die casting of the AlSi alloy.
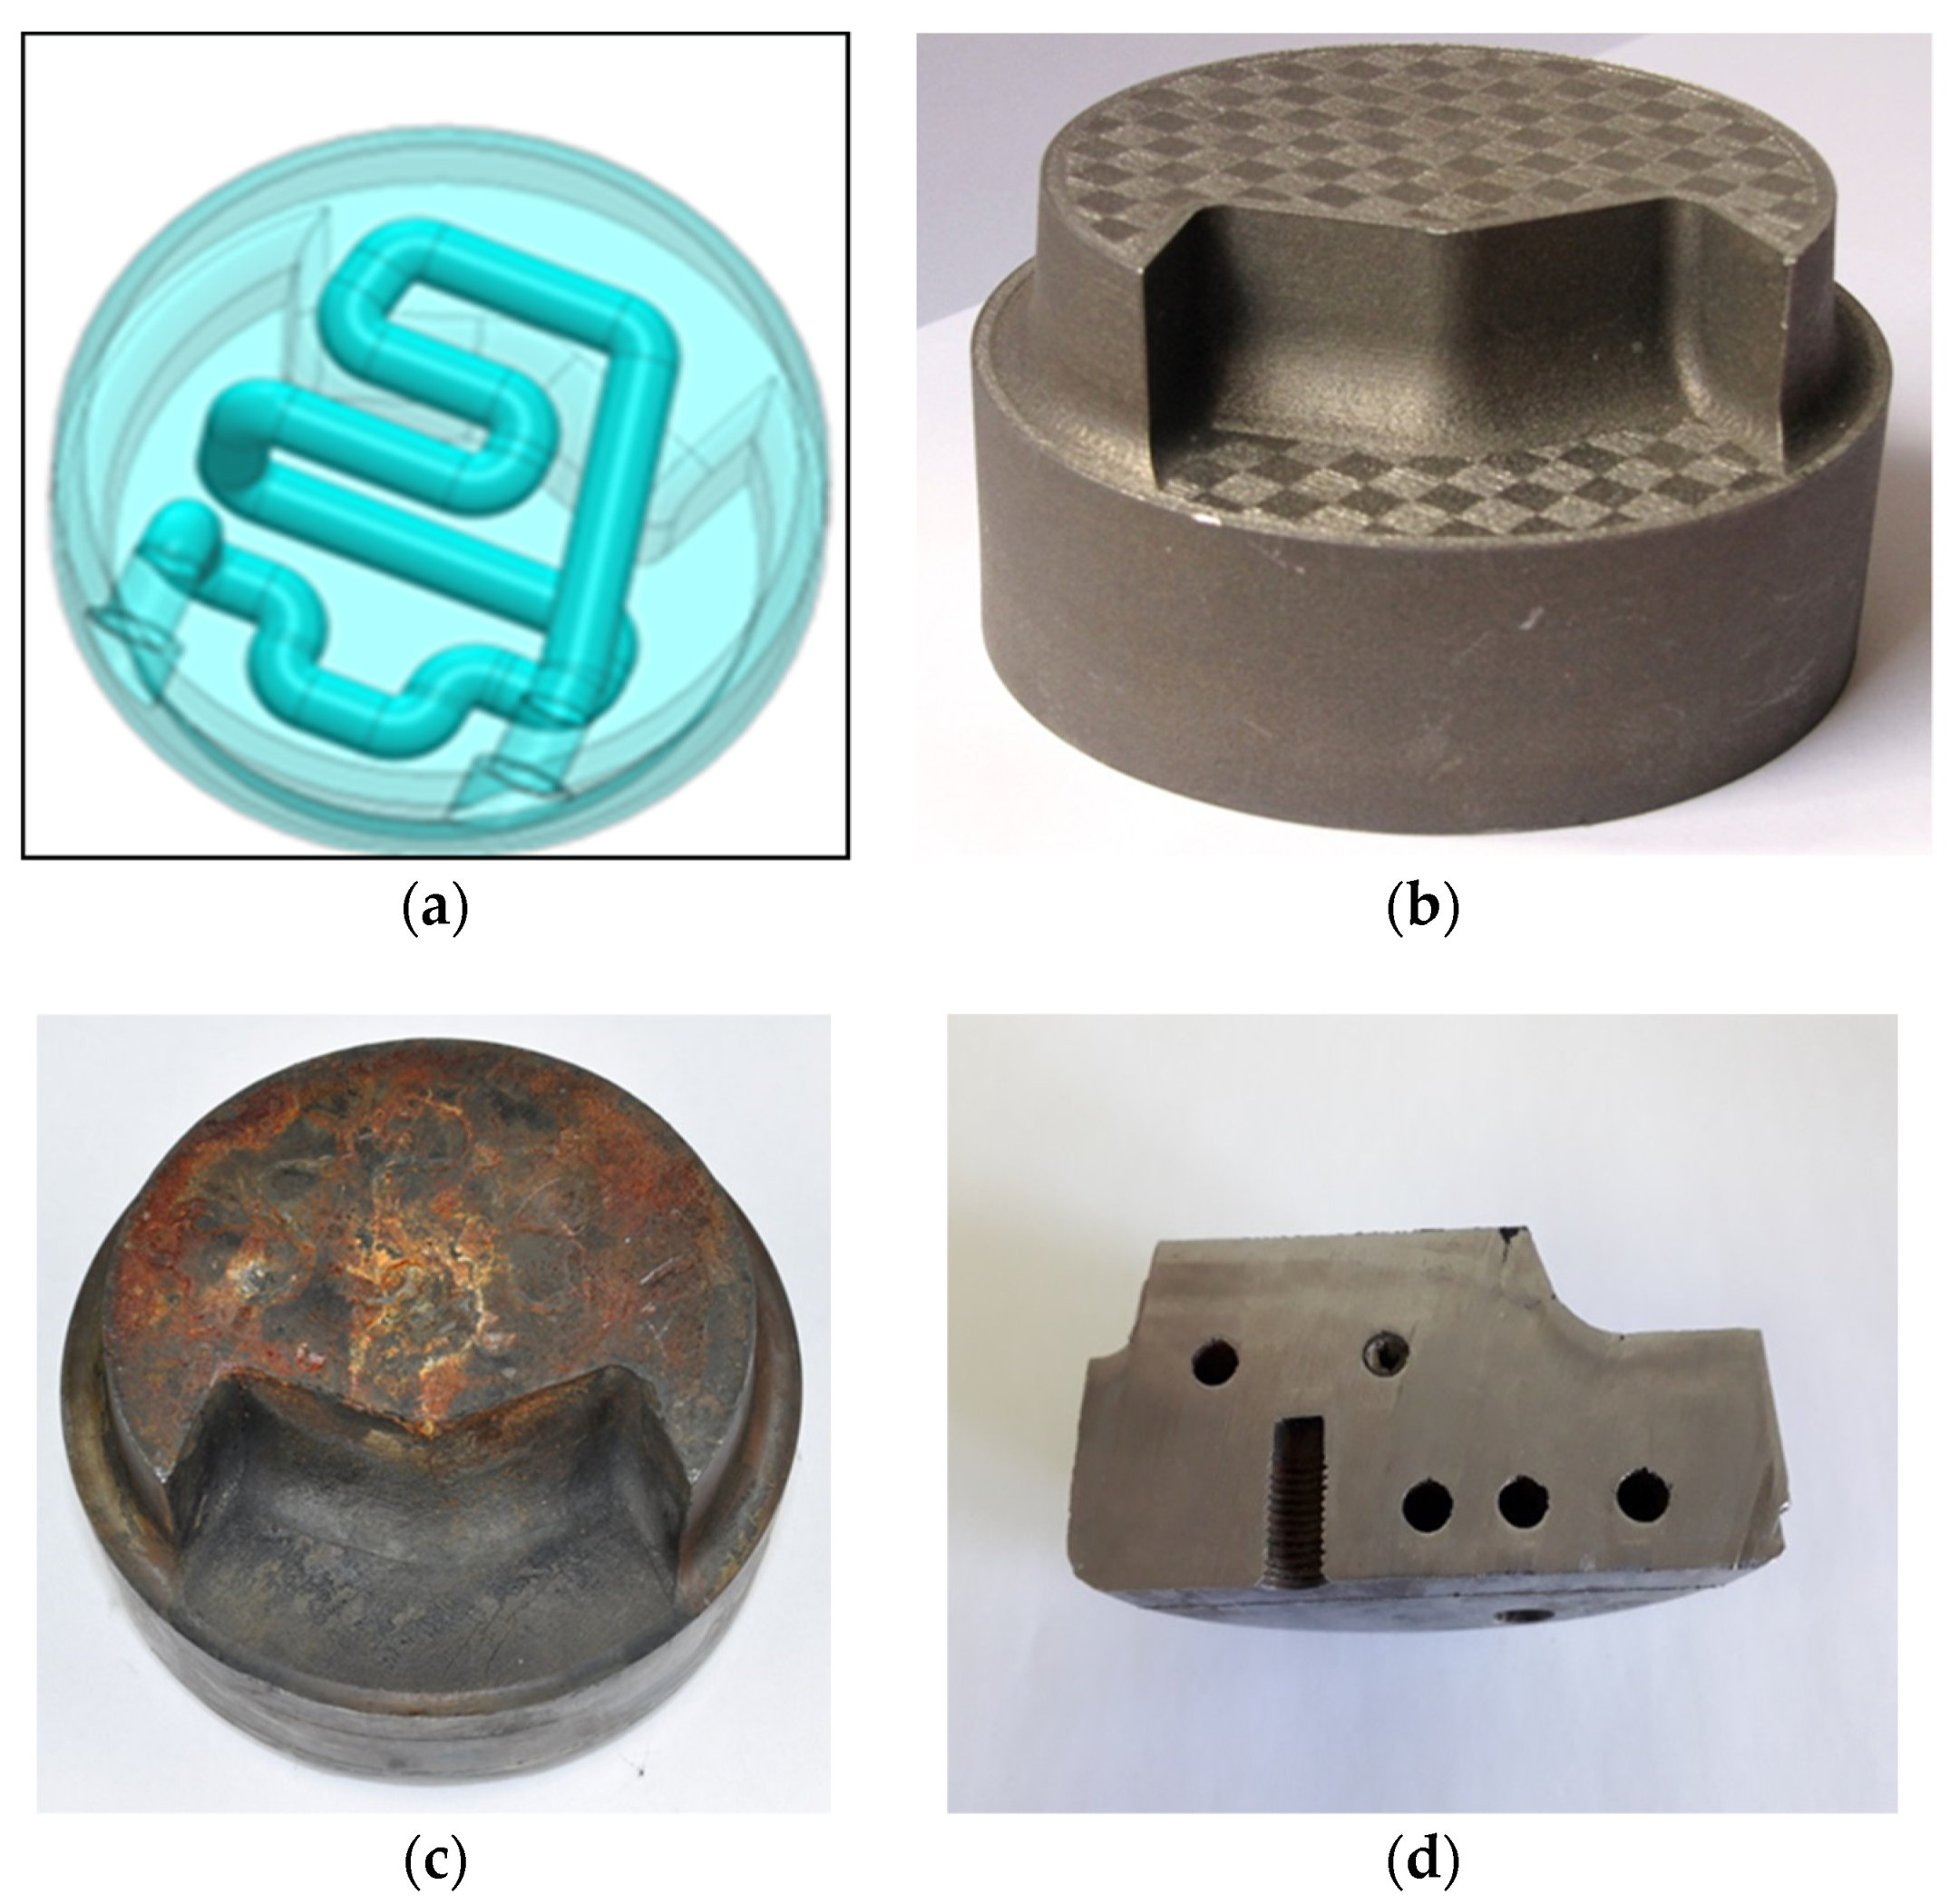
Figure 13.
Sprue spreader with conformal cooling channels: (a) CAD drawing of conformal cooling channels; (b) image of sprue spreader manufactured by additive SLM method; (c) tested sprue spreader after tens of thousands of operating cycles; (d) tested sprue spreader with visible arrangement of conformal channels.
Figure 14.
Geometrical model of thermal contact surface between sprue spreader and biscuit.
Figure 14.
Geometrical model of thermal contact surface between sprue spreader and biscuit.
Figure 15.
Location of the 280 °C isotherm in the sprue spreader: (a) Usual solution of cooling channels; (b) conformal cooling channels. NT11—temperature in °C.
Figure 15.
Location of the 280 °C isotherm in the sprue spreader: (a) Usual solution of cooling channels; (b) conformal cooling channels. NT11—temperature in °C.
Figure 16.
Temperature changes on sprue spreader contact surface: Curve 1—traditional solution; Curve 2—conformal cooling channel system.
Figure 16.
Temperature changes on sprue spreader contact surface: Curve 1—traditional solution; Curve 2—conformal cooling channel system.
Figure 17.
Image of thermal stress [Pa] caused by temperature field changes calculated with FEM directly after injection in a traditional channel system: (a) σo according to Huber–Mises HM hypothesis; (b) stress components σx.
Figure 17.
Image of thermal stress [Pa] caused by temperature field changes calculated with FEM directly after injection in a traditional channel system: (a) σo according to Huber–Mises HM hypothesis; (b) stress components σx.
Figure 18.
Image of thermal stress (Pa) caused by temperature field changes calculated by FEM directly after injection in a conformal channel system: (a) σo according to HM hypothesis; (b) stress components σx.
Figure 18.
Image of thermal stress (Pa) caused by temperature field changes calculated by FEM directly after injection in a conformal channel system: (a) σo according to HM hypothesis; (b) stress components σx.
Figure 19.
Temperature changes during one cycle of pressure machine operation in a sprue spreader with a conformal cooling system at different distances from the contact surface to the cast alloy: Curve 1, 0.5 mm; curve 2, 3.0 mm; curve 3, 5.0 mm; curve 4, 9.0 mm.
Figure 19.
Temperature changes during one cycle of pressure machine operation in a sprue spreader with a conformal cooling system at different distances from the contact surface to the cast alloy: Curve 1, 0.5 mm; curve 2, 3.0 mm; curve 3, 5.0 mm; curve 4, 9.0 mm.
Table 1.
Chemical composition wt% of CL 50WS, MS1, and Marlok C 1650 powders as well as H13 steel.
Table 1.
Chemical composition wt% of CL 50WS, MS1, and Marlok C 1650 powders as well as H13 steel.
| Steel or Powder Grade | C | Si | Mn | P | S | Cr | Mo | Ni | Ti | Co | Al | V |
|---|
| H13 [16] | <0.36 | 1.0 | 0.44 | - | - | 5.3 | 1.3 | - | - | - | - | 0.98 |
| Marlok C1650 [17] | <0.01 | <0.1 | <0.01 | <0.01 | <0.005 | <0.2 | 3–6 | 13–16 | <0.3 | 10–13 | - | - |
| CL 50WS [18] | <0.03 | <0.1 | <0.15 | <0.01 | <0.01 | <0.25 | 4.5–5.2 | 17–19 | 0.8–1.2 | 8.5–10.0 | - | - |
| MS1 [19] | <0.03 | <0.1 | <0.10 | <0.01 | <0.01 | <0.50 | 4.5–5.2 | 17–19 | 0.6–0.8 | 8.5–9.5 | 0.05–0.15 | - |
Table 2.
Chemical composition wt% of studied powder.
Table 2.
Chemical composition wt% of studied powder.
| Chemical Composition wt% |
|---|
| Ni | Mo | Co | Ti | Fe |
| 18.0 | 5.0 | 9.7 | 1.1 | 65.3 |
Table 3.
Selective laser melting (SLM) process parameters.
Table 3.
Selective laser melting (SLM) process parameters.
| SLM Parameter | Solid Section | Surface |
|---|
| Laser power (W) | 340 | 180 |
| Laser speed (mm/s) | 1100 | 200 |
| Laser beam diameter (µm) | 120 | 50 |
| Layer thickness (µm) | 50 | 25 |
| Hatch space (µm) | 91 | 35 |
Table 4.
The value of function describing the constituteive model of the cast alloy AlSi11.
Table 4.
The value of function describing the constituteive model of the cast alloy AlSi11.
| Temperature | 20 °C | 550 °C | 577 °C | 600 °C | 750 °C |
|---|
| Conductivity (W/m·°C) 1 | 160 | 177 | 112 | 80 | 80 |
| Specific heat (J/kg·°C) 2 | 1060 | 1095 | 1095 | 1095 | 1095 |
| Density (kg/m3) 3 | 2650 | 2600 | 2570 | 2490 | 2448 |
| Latent heat (J/kg) 4 | 390 | 390 | 390 | 390 | 390 |
Table 5.
The value of function describing the constitutive model of maraging steel (mold).
Table 5.
The value of function describing the constitutive model of maraging steel (mold).
| Temperature | 20 °C | 400 °C | 650 °C |
|---|
| Conductivity (W/m·°C) 1 | 20 | 20 | 20 |
| Specific heat (J/kg·°C) 2 | 450 | 450 | 450 |
| Density (kg/m3) 3 | 8100 | 8100 | 8100 |
| UTS (MPa) 4 | 1920 | 1900 | 960 |
| Rp0.2 (MPa) 5 | 1900 | 1864 | 930 |
| Poisson’s ratio 6 | 0.27 | 0.27 | 0.27 |
| Young’s modulus (MPa) 7 | 170,000 | 170,000 | 170,000 |
| Temperature Range | 25–100 °C | 25–200 °C | 25–300 °C |
| Linear expansion coefficient (1/°C) 8 | 10.7 × 10⁻⁶ | 11.2 × 10⁻⁶ | 11.5 × 10⁻⁶ |
Table 6.
Tensile test results and hardness at different times and aging temperatures.
Table 6.
Tensile test results and hardness at different times and aging temperatures.
| Aging | UTS (MPa) | Rp0.2 (MPa) | A (%) | E (GPa) | HRC |
|---|
| As-built material | 1117 (±26) | 1057 (±31) | 6.9 (±1.2) | 145 (±7) | 37 |
| 460 °C/8 h | 2017 (±12) | 1955 (±11) | 1.2 (±0.1) | 172 (±0.5) | 57 |
| 540 °C/1 h | 1920 (±14) | 1864 (±37) | 2.8 (±0.4) | 168 (±2) | 53 |
| 540 °C/8 h | 1690 (±10) | 1640 (±11) | 3.8 (±0.2) | 166 (±1) | 47 |
| 580 °C/1 h | 1600 (±21) | 1529 (±20) | 6.1 (±0.2) | 165 (±1) | 45 |
| 580 °C/8 h | 1409 (±23) | 1316 (±27) | 9.4 (±0.8) | 162 (±0.4) | 42 |
| 600 °C/1 h | 1418 (±35) | 1357 (±30) | 11.2 (±0.4) | 162 (±0.2) | 40 |
| 600 °C/8 h | 1314 (±12) | 1212 (±4) | 12.4 (±0.2) | 160 (±1) | 39 |
Table 7.
Comparison of channel lengths (L) determined on the basis of CAD drawings and the heat balance as well as the size of the cooling surface (F) for conformal and conventional solutions of pressure mold cooling system.
Table 7.
Comparison of channel lengths (L) determined on the basis of CAD drawings and the heat balance as well as the size of the cooling surface (F) for conformal and conventional solutions of pressure mold cooling system.
| Lb (mm) | Lcl (mm) | Lco (mm) | Fb (mm2) | Fcl (mm2) | Fco (mm2) |
|---|
| 240 | 180 | 366 | 7562 | 5652 | 11,500 |
| Definitions: Lb—cooling channel length calculated on basis of heat balance; Fb—cooling channel area calculated on basis of heat balance; Lcl—channel length in conventional cooling system based on CAD drawing; Fcl—channel area in conventional cooling system based on CAD drawing; Lco—channel length in conformal cooling system based on CAD drawing; Fco—channel area in conformal cooling system based on CAD drawing. |
| The following have been assumed in the calculations: Biscuit volume, V = 0.0348 m3; contact surface of spreader with metal F = 0.00032 m2; water flow speed, W = 2 m/s; channel surface temperature Tch = 120 °C; water temperature Tw = 35 ℃, initial alloy temperature Tinit = 680 ℃; casting push out temperature Tpush = 400 ℃; alloy solidification heat q = 390 kJ/kg·℃; specific heat, c = 963 J/kg·℃; density ρ = 2700 kg/m3. |


