Article

Stress-Induced In Situ Modification of Transition Temperature in VO2 Films Capped by Chalcogenide

1
Institut Català de Nanociència i Nanotecnologia (ICN2), UAB Campus, ICN2 Building, 08193 Bellaterra, Spain
2
National Institute of Advanced Industrial Science and Technology, Tsukuba-shi, Ibaraki 305-8560, Japan
3
Graduate School of Science and Technology, Tokai University, Hiratsuka 259-1292, Japan
4
Research Institute of Electrical Communication, Tohoku University, 2-1-1 Katahira, Aoba-ku, Sendai 980-8577, Japan
*
Author to whom correspondence should be addressed.
Materials 2020, 13(23), 5541; https://doi.org/10.3390/ma13235541
Submission received: 30 October 2020 / Revised: 29 November 2020 / Accepted: 1 December 2020 / Published: 4 December 2020
(This article belongs to the Section Thin Films and Interfaces)

Abstract

:
We attempted to modify the monoclinic–rutile structural phase transition temperature (Ttr) of a VO2 thin film in situ through stress caused by amorphous–crystalline phase change of a chalcogenide layer on it. VO2 films on C- or R-plane Al2O3 substrates were capped by Ge2Sb2Te5 (GST) films by means of rf magnetron sputtering. Ttr of the VO2 layer was evaluated through temperature-controlled measurements of optical reflection intensity and electrical resistance. Crystallization of the GST capping layer was accompanied by a significant drop in Ttr of the VO2 layer underneath, either with or without a SiNx diffusion barrier layer between the two. The shift of Ttr was by ~30 °C for a GST/VO2 bilayered sample with thicknesses of 200/30 nm, and was by ~6 °C for a GST/SiNx/VO2 trilayered sample of 200/10/6 nm. The lowering of Ttr was most probably caused by the volume reduction in GST during the amorphous–crystalline phase change. The stress-induced in in situ modification of Ttr in VO2 films could pave the way for the application of nonvolatile changes of optical properties in optoelectronic devices.

1. Introduction

In optoelectronic components such as switches, waveguides, transistors, and memories, the operation principle requires the control of electronic signals by light irradiation or the control of photonic signals by an electric field. To realize such devices that are based on photon–electron interaction, materials that show phase transition accompanied by significant change in both electric properties (conductivity, etc.) and optical properties (reflectance, etc.) are strong candidates.
Vanadium dioxide (VO2) undergoes structural phase transition near room temperature (68 °C in a bulk under the atmospheric pressure) between a high-temperature phase with a rutile-type structure (R phase) and a low-temperature phase with a monoclinic structure (M phase) [1,2]. The electrical, optical, and thermal properties of VO2 abruptly change at the transition temperature (Ttr). In the high-temperature R phase, reflectance in the infrared region and electrical conductivity significantly increase compared to the M phase. The M–R phase transition of VO2 can be induced not only by heat, but also by electric field [3,4], light [5,6], and mechanical strain [7], suggesting the possibility of realizing VO2-based electrical/optical switching devices operated with these stimuli.
When VO2 is in the M (or R) phase at a given temperature, its Ttr is supposed to be higher (lower) than that temperature. Therefore, if the Ttr can be tuned for a certain temperature range, it means that the phase can be switched reversibly between R and M in this temperature range. This stimulus-induced phase switching might lead one to expect that VO2 would be applied not only in optical switches, but also in electrical resistance change memory devices. However, the R phase induced by an external stimulus is volatile, i.e., it recovers to the M phase once the stimulus is removed. A certain continuous energy is generally required to maintain the R phase [8,9,10].
The use of strain could be a realistic approach to maintain the R phase of VO2, or to maintain the low Ttr, without supplying continuous extrinsic energy. It is known that shortening of cR axis is accompanied by lowering of Ttr in VO2. In what follows, the subscripts M and R indicate the phases of VO2. Muraoka and Hiroi reported the lowering of Ttr in VO2 films with short cR axes grown on rutile TiO2 (001) substrates [11]. Cao et al. demonstrated a phase transition in a VO2 microbeam by applying mechanical stress, and revealed a wide-ranging relationship between Ttr and the strain along the cR axis [7]. If the strain were nonvolatile and reversible, then so would be the modification of Ttr, and bistability would be realized in a temperature range in which the Ttr could be modified by strain. Sources of strain in previous studies on the modulation of Ttr in VO2 films include lattice mismatches with the substrate or the underlayer [11,12,13] or doping using different elements [14,15]. However, the factor of modulation in these experiments was induced at the deposition stage, and hence, its Ttr was no longer controllable after the formation of the film.
Still, there are several ways to modulate the strain of a thin film in situ. Attempts have been made to control the strain of thin films using piezoelectric materials [16,17,18,19,20,21,22,23,24,25,26]. They include some studies on the modification of the magnetic properties of (La, Sr)MnO3 [16,17,18], CoFeB [19], and Ni [20] films, as well as some on the modification of the transition properties of VOx films [22,23,24,25,26], all grown on piezo layers or piezo substrates. It has been reported that the Ttr of VO2 films can be controlled through the strain of (1−x)Pb(Mg1/3Nb2/3)–xPbTiO3 (PMN–PT) crystalline substrates by 1.35 °C [23] or by 6 °C [24]. Applying uniaxial pressure to a film with the tip of a scanning probe microscope also functions to induce local strain [27,28]. In the present report, we propose a method of capping the target thin film with a material in which amorphous–crystalline phase transition easily occurs. Generally, the density of a solid material in a crystalline phase is higher than that of the same composition material in an amorphous phase. Therefore, in a bilayered sample consisting of a strain-generator layer and VO2, one could expect that amorphous–crystalline phase changes in the strain-generator layer would cause in-plane compressive strain in the VO2 layer, resulting in the modulation of Ttr in VO2.
Ge2Sb2Te5 (GST) is a typical material that undergoes reversible and nonvolatile switching between amorphous and crystalline phases. A number of researchers have worked on the application of this material in the field of optical and electrical memory devices. Previously, we studied the optical and thermal properties of GST [29,30,31,32] and developed several optical devices using it [33,34,35,36,37]. The amorphous–crystalline phase change of GST is accompanied by a volume contraction of 6.8% [38]. Supposing an isotropic volume change, this value can be converted to a linear compressive strain by 1 − (1 − 0.068)1/3 = 2.3%. Assume that this strain is fully transferred to the VO2 layer in touch with the GST layer, and that the cR axis of VO2 lies in-plane. According to the relationship between Ttr and the strain along cR axis in VO2 microbeams, compressive strain for 2.3% along cR could lower the Ttr by about 30 °C [7]. Moreover, previous reports on VO2 thin films grown on TiO2 (001) substrates implied that the strain effect on Ttr was more pronounced in thin films than in microbeams [11,39]. These reports showed Ttr values lower than those in the bulk by more than 50 °C in films with cR compression of only −0.6%. The controllability of Ttr within several tens of °C implies switchability between the M and R phases in a range of several tens of °C, possibly satisfying the requirement of the operation temperature range of commercial devices.
To confirm the above concept, we herein report the in situ reduction of Ttr in a VO2 layer by amorphous–crystalline phase change in a GST layer that caps the VO2. During the preparation of this manuscript, we learned of a recent paper by Meng et al. on reflectivity measurements of GST/VO2 bilayered samples [40]. We would like to note that our study focuses on the modulation of Ttr in VO2, whereas they targeted the function as a four-value memory device by combining the phase changes of GST and VO2.

2. Experimental

2.1. Sample Preparation

Bilayered films consisting of VO2 and amorphous GST layers were prepared on sapphire substrates of either R-plane (1−102) or C-plane (0001). Figure 1 schematically shows the sample preparation processes. In order to realize the amorphous phase, the GST layer should be deposited after VO2, since the growth of crystalline VO2 films requires a temperature higher than the crystallization temperature of GST (161 °C) [41].
VO2 was grown by means of either pulsed laser deposition (PLD) or rf-biased reactive magnetron sputtering on substrates heated at 500 and 400 °C, respectively. A bias power of 5 W was applied to the sample stage during the sputtering process. Other deposition conditions can be found in previous reports [42,43].
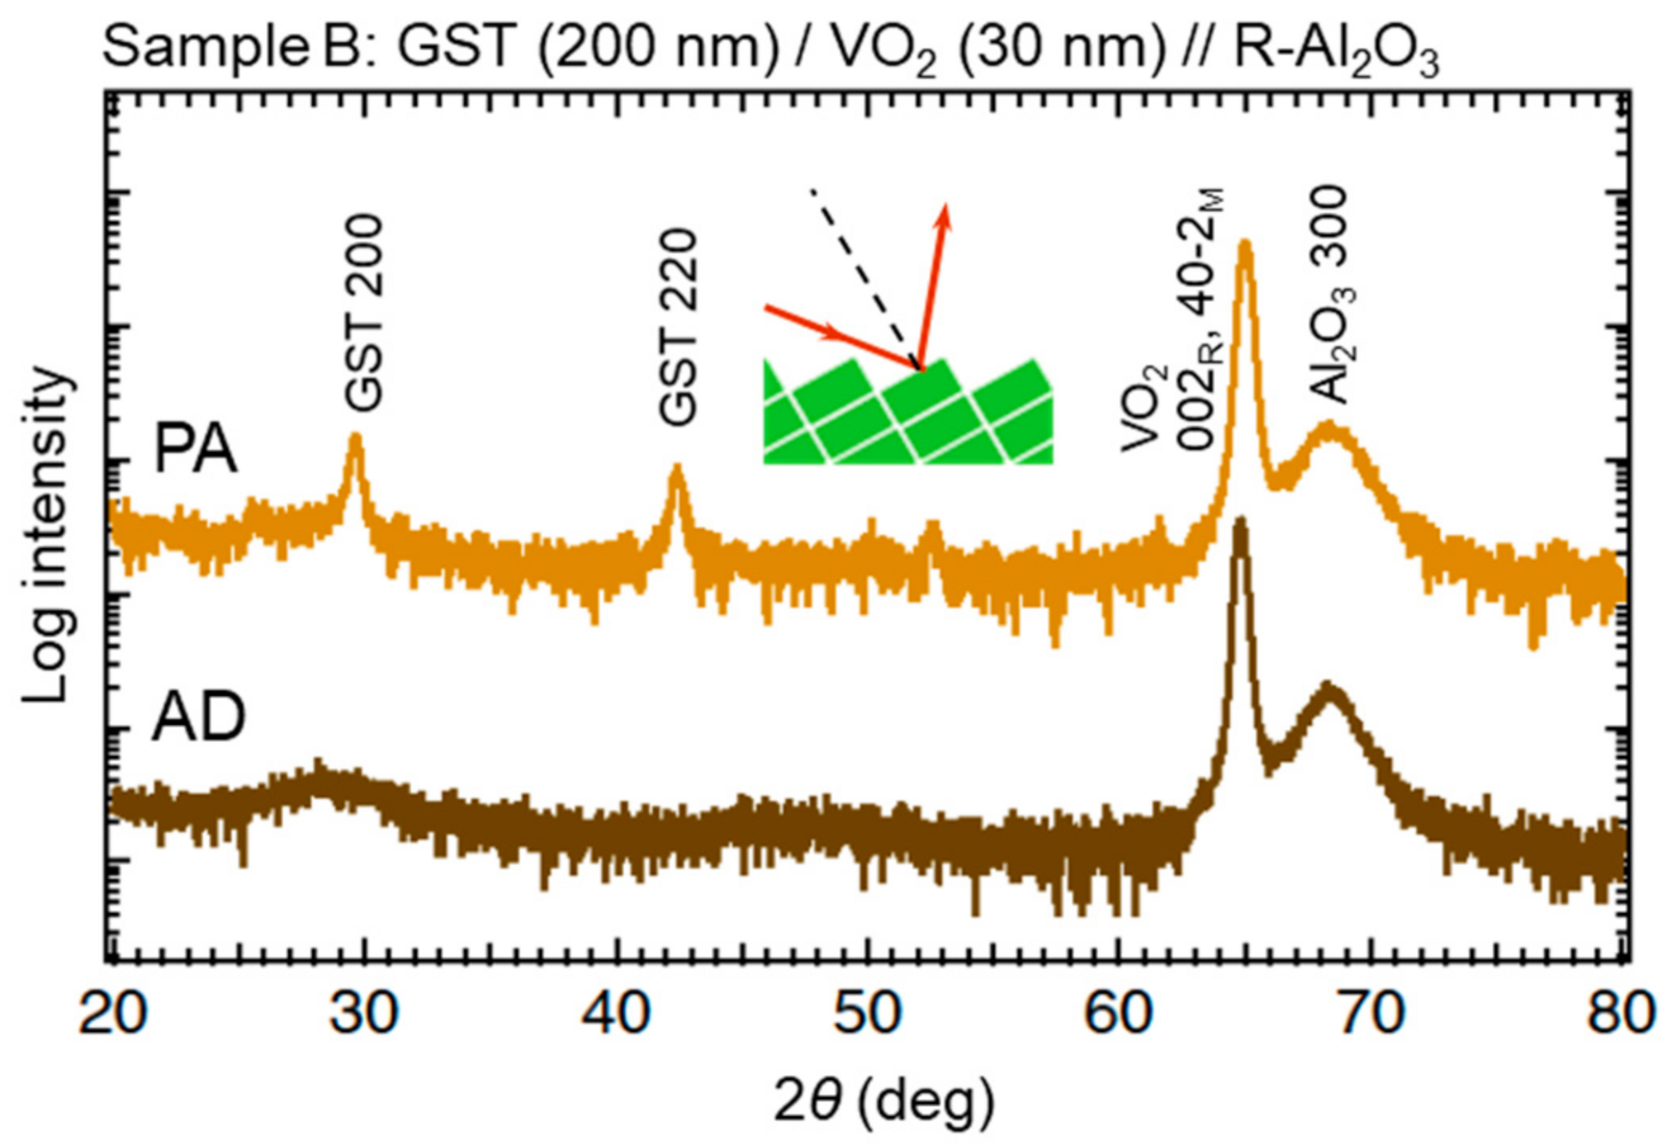
The GST film was deposited by a rf magnetron sputtering method in an argon (Ar) atmosphere of 0.5 Pa with an output power of 100 W. Intentional substrate heating was not carried out. We prepared two types of samples with and without a SiNx buffer layer between GST and VO2 (see Section 3.2). The SiNx layer was grown by rf-sputtering a Si3N4 target with a power of 200 W under 0.5 Pa of Ar. Crystallization of the GST layer was achieved by postannealing the sample at 200 °C (with a heating speed of 20 °C min−1) for 2 min in Ar atmosphere or in air. In what follows, the step with the pristine VO2 layer before GST deposition is referred to as “VO”, the step with the as-deposited GST layer on VO2 as “AD”, and the step after the postannealing of the bilayered sample as “PA”. Figure 2 shows the X-ray diffraction (XRD) profiles of a GST/VO2 bilayered sample in steps AD and PA at RT in a geometry aligned with respect to VO2 40–2M or 002R diffraction peak. The weak intensity of the Al2O3 substrate peaks is because the VO2 100M plane was slightly misoriented against the (1–102) plane of the substrate. The absence of GST peaks before annealing proved the amorphous nature of the as-deposited GST layer, while the diffraction peaks corresponding to NaCl-type GST that appeared after annealing indicated the success of the crystallization process. The cR axis is always supposed to lie in plane in VO2 films grown on C-plane Al2O3, whereas one of three geometries allows the cR axis to lie in plane on R-plane Al2O3. Table 1 shows the thickness of each layer in the four samples (A–D) reported in the present article.

2.2. Characterization

To investigate Ttr of VO2 at each step, we performed temperature-controlled measurements of optical reflection intensity and electrical resistance.
Optical reflection intensity was measured in an Ar atmosphere of 1 atm using a heating/cooling stage (HFS-91, Linkam, Tadworth, UK) installed in an optical microscope. White light from a halogen lamp was shone on the sample surface through a half mirror, and the reflected light was detected by a laser power meter (Vega, Ophir, Jerusalem, Israel). The sample temperature was swept at a rate of either 5 °C min−1 or 3 °C min−1. In order to perform the measurement to temperatures below RT, liquid nitrogen-cooled air was supplied in this stage. It is known that the temperature dependence of the optical properties of GST is negligible in the whole temperature range of the measurements (−20 °C minimum and 120 °C maximum) [29].
It is possible to evaluate the resistance of the VO2 layer only when the insulating buffer layer is inserted between GST and VO2 layers, since the resistivity of the crystalline GST is comparable with that of VO2. A 10 nm thick SiNx layer was employed as the insulating layer. The resistance as a function of temperature (R–T) of the VO2 layer in GST/SiNx/VO2 multilayered samples was measured with a two-probe scheme using tungsten–carbide (WC) probes. Both edges of the VO2 layer were covered during deposition of SiNx and GST layers to make these areas accessible by the probes. The resistance was measured by a multimeter (2000, Keithley, Solon, OH, USA), while the sample temperature was swept with a homemade temperature control stage, in which the power for a Peltier device was controlled by a computer.

3. Results

3.1. Optical Reflection

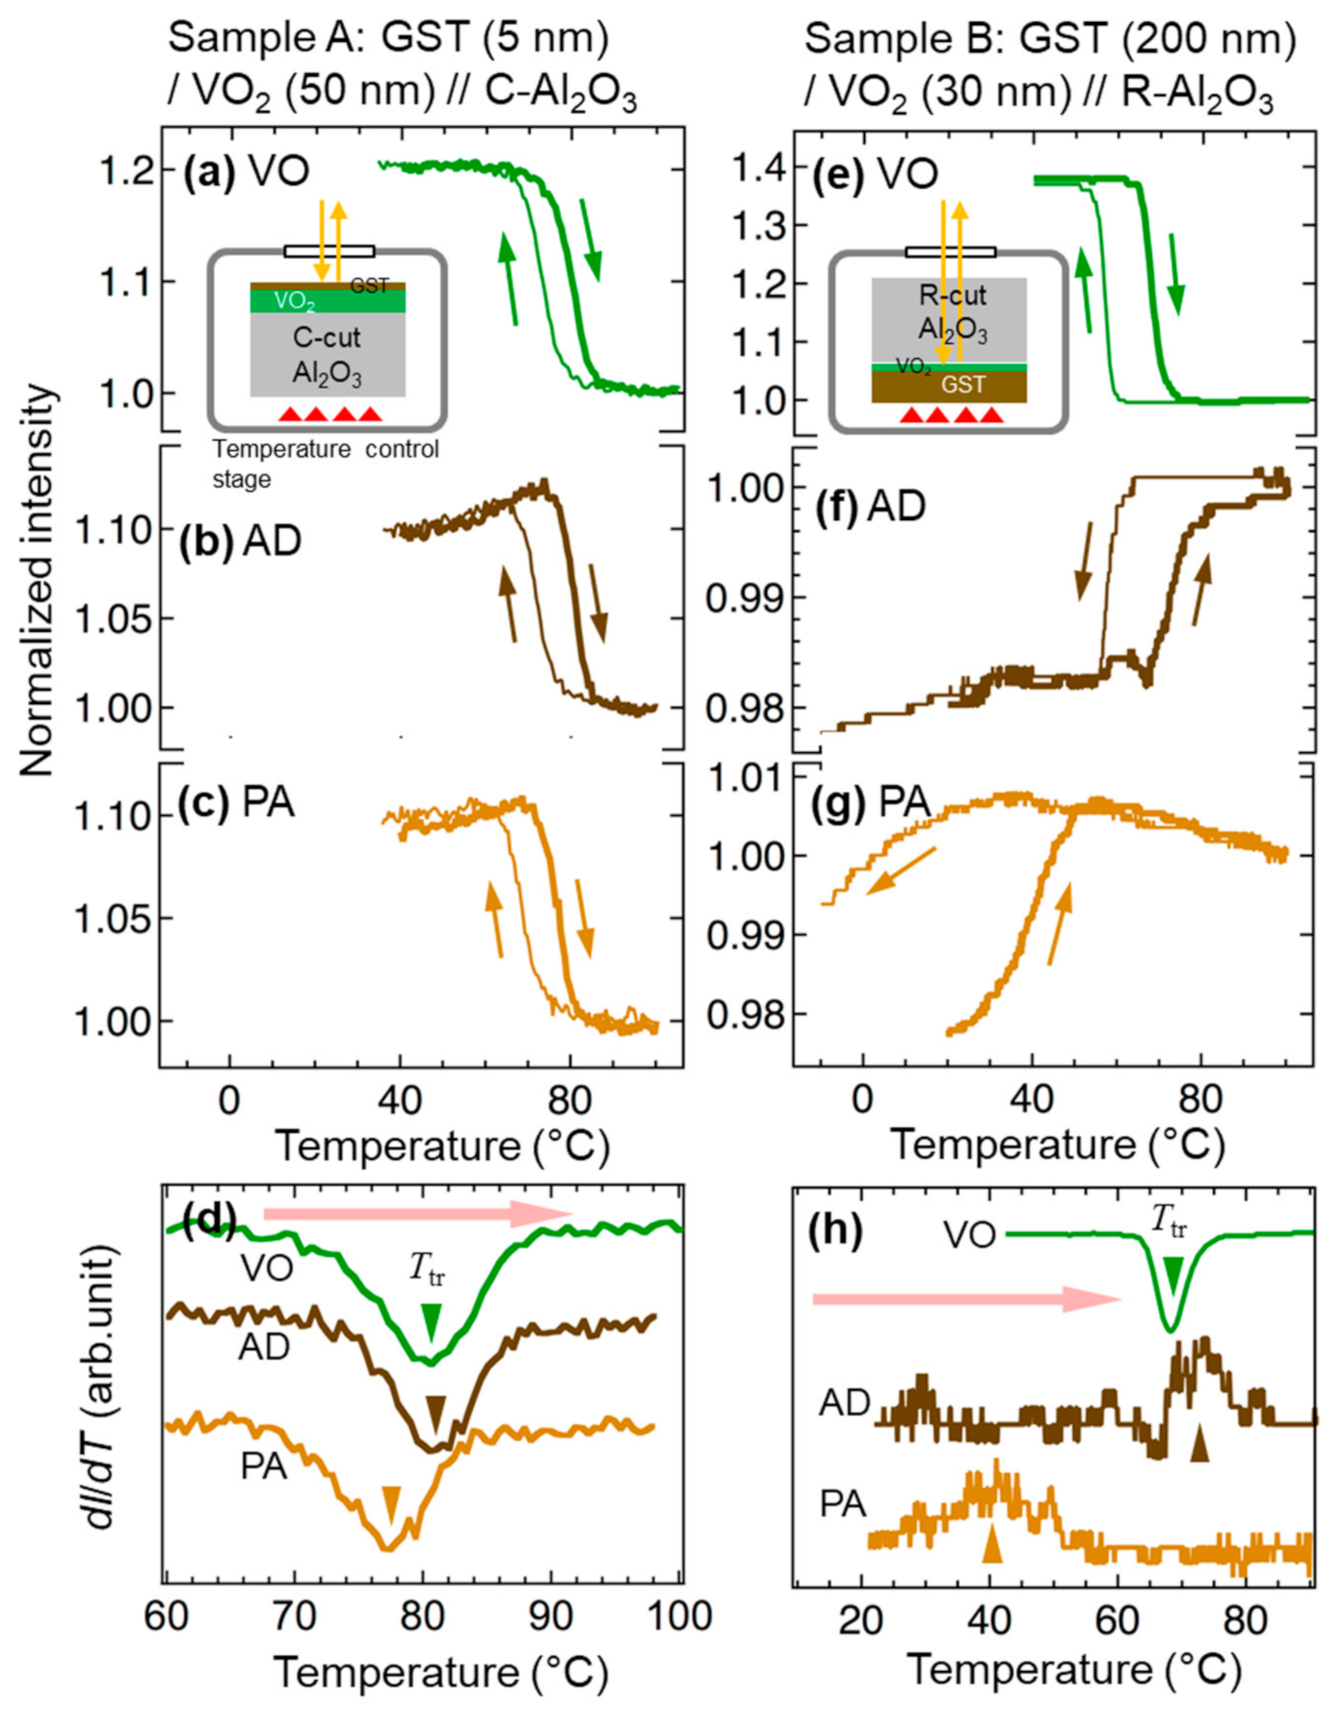
For Sample A with the ultrathin GST layer of 5 nm thick, we observed the reflection from the film side. Figure 3a–c show the temperature dependence of the optical reflection intensity of Sample A in steps VO, AD, and PA, respectively. The intensity is normalized with the values at 100 °C. Significant evolution of ~10% in reflectance was detected even through the GST layer (Figure 3b,c). The sharp change of the reflectance was attributed to the phase transition of VO2. Figure 3d shows the temperature differential profiles of the reflected light intensity (dI/dT) in the heating runs in the three steps. A slight lowering of Ttr, i.e., by about 4 °C, was revealed in step PA with respect to step AD. It is striking that the stress-induced modulation of Ttr in VO2 was realized even when the VO2 layer was 10 times thicker (50 nm) than the GST layer (5 nm). For optical switch applications, combinations of a thin GST layer and a thick VO2 layer may be of use.
Figure 3e–g show the results of similar observations of Sample B. For this sample, the reflection measurements were carried out in a substrate-side incident configuration, since the opaque nature of 200 nm thick GST prevented taking measurements on the film-side. The reflection intensity on the low-temperature side was stronger than that on the high-temperature side in step VO (Figure 3e), whereas the temperature dependence was inverted in steps AD and PA (Figure 3f,g). To confirm if such a difference in temperature dependence was reasonable, we calculated the reflectivity at a wavelength of 700 nm by using analytical solutions of electromagnetic waves [44] that propagate in multilayered structures, based on the dielectric functions of SiO2 and VO2 taken from the literature [45,46], and that of GST measured by us. For a sample with a pristine VO2 layer, modeled with a SiO2 (semi-infinite thickness)/VO2 (30 nm thick)/vacuum (semi-infinite thickness) multilayered structure, the electromagnetic calculation reproduced higher reflectivity when the VO2 was in the M phase compared to the R phase. With a GST layer [SiO2 (semi-infinite)/VO2 (30 nm)/GST (200 nm)/vacuum (semi-infinite) structure], on the other hand, the calculations revealed lower reflectivity in case of the M phase VO2 compared to the R phase, regardless of phases in GST. These simulations were consistent with the experimental results, supporting the hypothesis that both types of abrupt changes in the reflection intensity observed in Samples A and B were caused by the temperature-induced M–R or R–M phase transition.
Figure 3h shows the dI/dT profiles in the heating runs in the three steps. Either the valley or the peak in each curve is supposed to correspond to the phase transition. The center temperature of transition during heating runs existed at 68 and 72 °C in steps VO and AD, respectively, suggesting that deposition of the GST layer did not drastically affect Ttr. In contrast, the postannealing process obviously lowered the Ttr. The transition in step PA took place in a range of 25–50 °C with the center temperature being ~41 °C, suggesting a lowering of Ttr by approximately 30 °C caused by annealing. The Ttr changed more drastically in Sample B compared with Sample A; this can be understood by supposing that the smaller the thickness ratio between VO2 and GST layers, the more stress the VO2 layer will suffer from the shrinkage of the GST layer.

3.2. Electrical Resistance

Here, one may wonder if the lowering of Ttr reported above was an interdiffusion effect, which may have occurred during the postannealing at 200 °C. The possibility of the Ge-doping effect was rejected, since it is known to increase the Ttr [47]. Still, a Sb- or Te-doping effect cannot be excluded at this moment. The migration of oxygen ions from VO2 towards GST could cause the reduction of VO2, which could be another factor to decrease its Ttr [48,49]. Proof of the strain effect on the decrease of Ttr requires a way to prevent interdiffusion. In addition, the GST and VO2 layers should be insulated from each other when one evaluates the electrical conductivity of the VO2 layer in step PA, since the conductivity of the crystallized GST is comparable with that of R-phase VO2. To distinguish the GST crystallization effect from the interdiffusion effect, and to achieve R–T measurements of solely the VO2 layer under GST, we prepared samples with a SiNx buffer layer, which was intended to play two roles, i.e., as an interdiffusion barrier and an insulator.
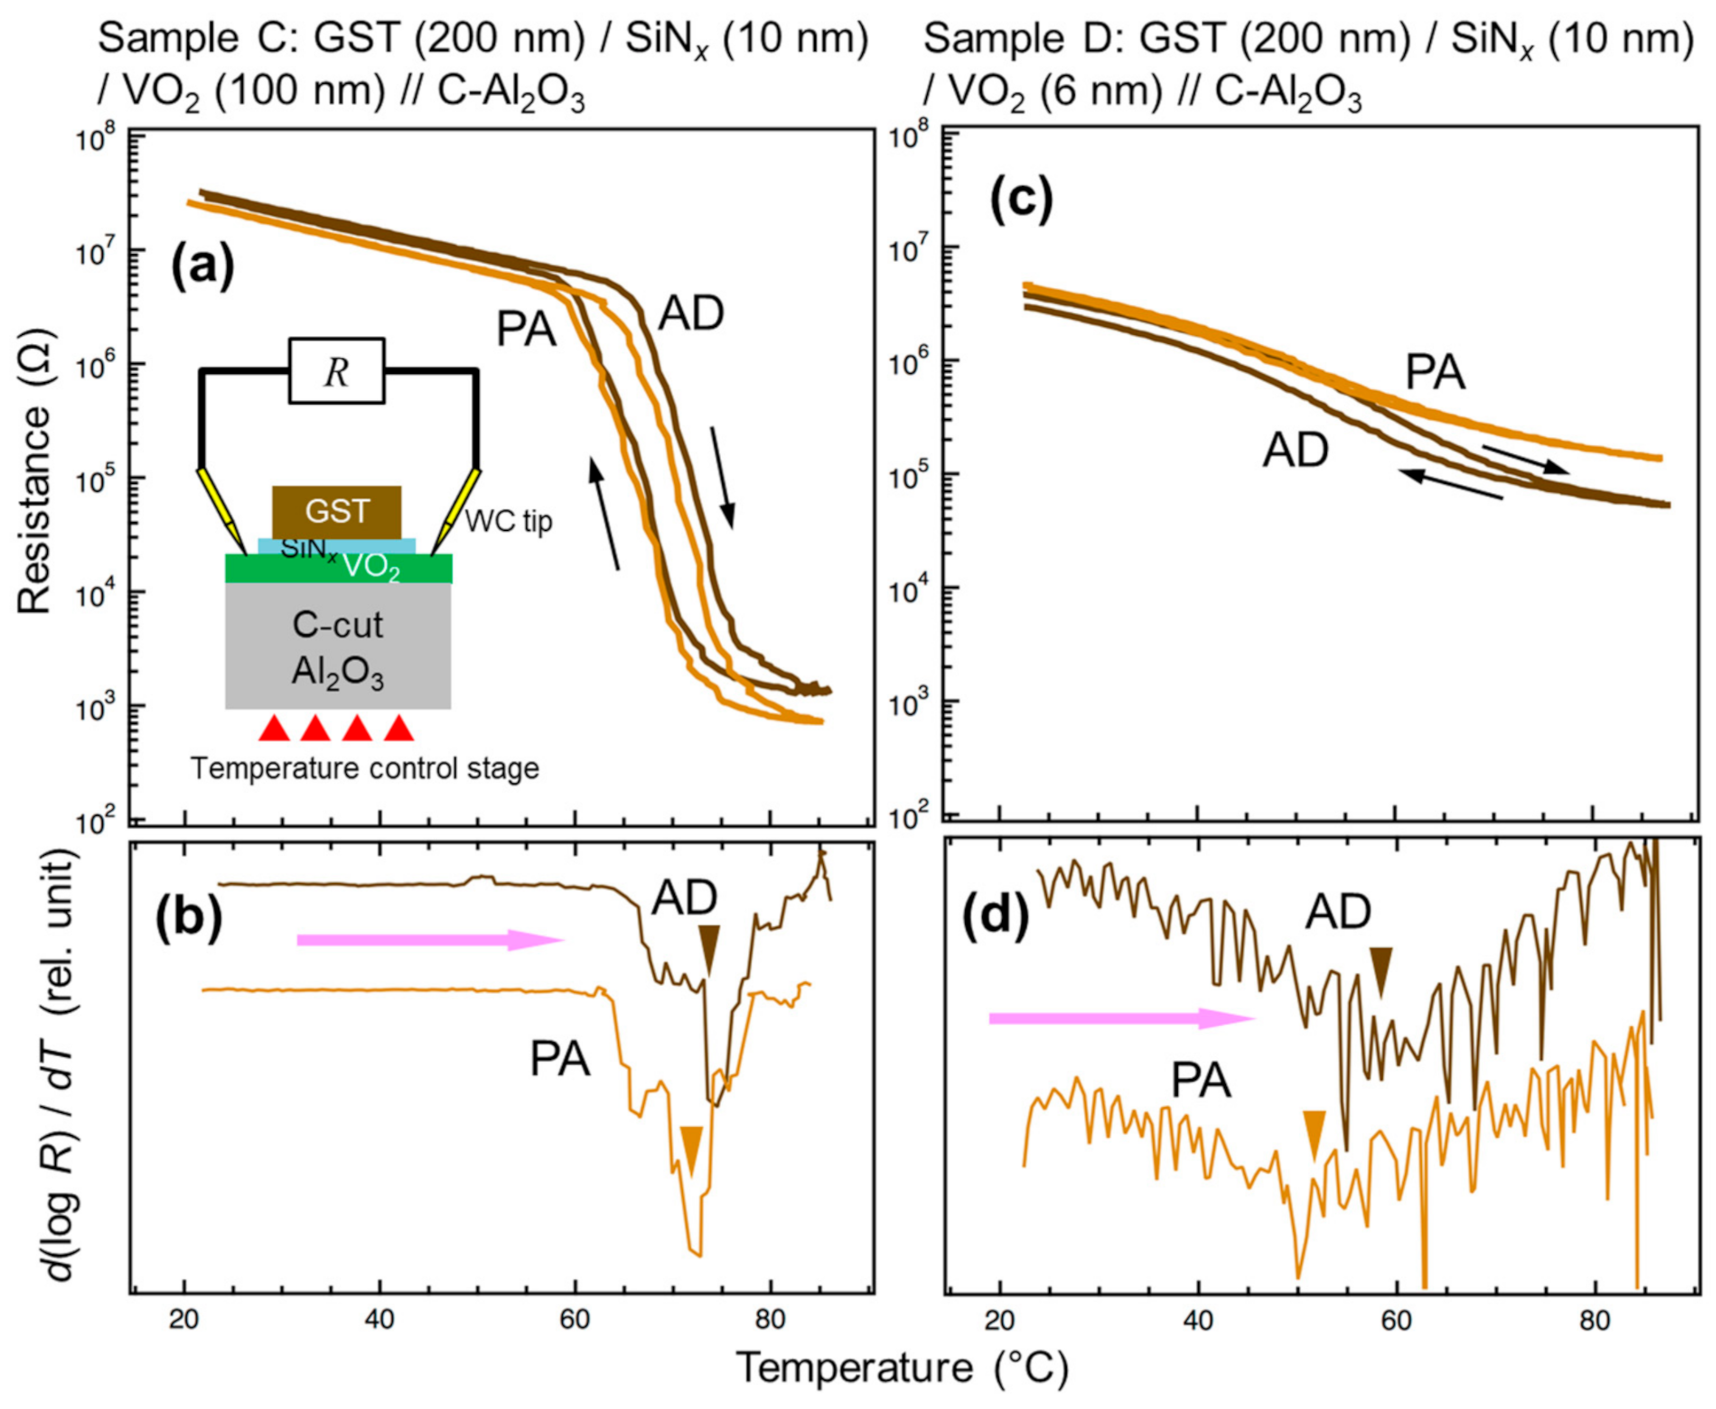
Figure 4a shows the R–T curves of Sample C with a thick VO2 layer (100 nm) in steps AD and PA. In both cases, the phase transition was clearly observed through significant resistance change, i.e., four orders of magnitude. The comparable resistance values in the M phase in both steps implied that the SiNx layer functioned as the insulator, preventing the current flow in the crystalline GST layer. Figure 4b shows temperature differential profiles of logarithm of the resistance of Sample C in the heating runs. One can see a shift of the valley between steps AD and PA, which suggests the decrease of the Ttr caused by the postannealing, even with a configuration where the interdiffusion effect was excluded. It was assumed that this behavior was the result of shrinkage of the cR axis caused by in-plane compressive strain due to the crystallization of GST. The fitting to Pseudo-Voigt functions of the differential curves indicated a Ttr of ~74 and ~72 °C in steps AD and PA, respectively.
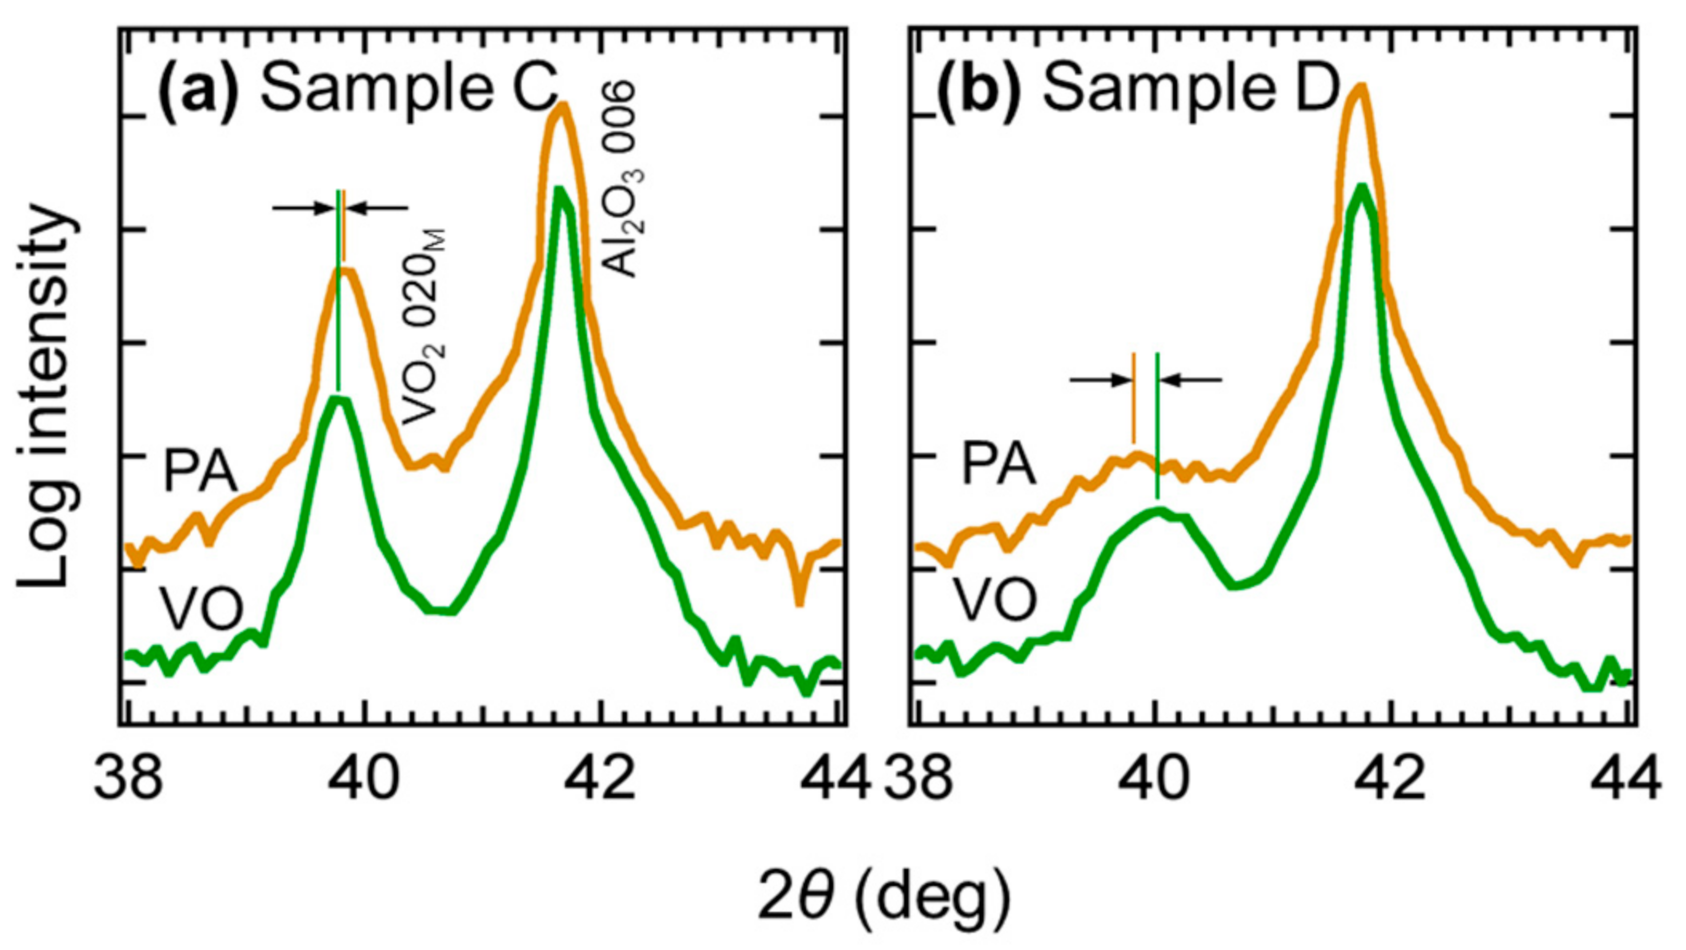
We performed a similar experiment for another sample with a thinner VO2 layer (6 nm, Sample D). The R–T curves of the sample showed a resistance change of more than one order of magnitude, suggesting the existence of a weak phase transition (Figure 4c). The fitting of the temperature differential profiles revealed Ttr of ~58 and ~52 °C in steps AD and PA, respectively, suggesting a lowering of Ttr for about 6 °C during the crystallization of GST (Figure 4d). Thinner than the VO2 layer in sample C, the VO2 layer in this sample was probably more severely affected by the stress from GST. To qualitatively observe the difference of the degree of stress, we performed XRD 2θ − ω scans of Samples C and D in steps VO and PA (Figure 5). In Sample D, a shift of the VO2 020M peak to a lower angle occurred when the ultrathin VO2 layer was capped with crystalline GST. The elongation of the out-of-plane lattice suggested the shrinkage of the in-plane lattice and cR axis, which is in agreement with our understanding. In contrast, no significant shift was observed in Sample C with a thick VO2 layer, which was consistent with the less drastic shift of its Ttr.

4. Discussion

The transition temperatures obtained from all the experiments in this study are summarized in Table 1. It is easy to predict that the lower the thickness ratio between VO2 and GST layers, the larger the stress that VO2 suffers from GST when the GST is crystallized. The tendency found in the results, i.e., a more significant drop of Ttr in the sample with smaller VO2/GST thickness ratio, supports the hypothesis that the modification of Ttr was induced by the stress which occurred during the crystallization of GST. In the present study, mechanical strain was introduced into the VO2 films in situ, unlike the previous films on TiO2 (001) with static strain. On the other hand, studies on piezo-induced in situ Ttr modification of VO2 resulted in reductions of only 1.35 °C [23] or 6 °C [24]. The strain that would be induced through the volume change at an amorphous–crystalline phase change (2.3%) could be significantly superior to that induced through the piezoelectric effect (± 0.2%) [50].
Nevertheless, the shift of Ttr for ~6 °C, observed in R–T measurements (Sample D), was not as huge as that observed in reflectance measurements, ~30 °C (Sample B). One reason for this may be that the optical reflectance is sensitive in detecting the property change at the GST/VO2 interface, whereas the electrical resistance contains the property of the VO2 film for the whole thickness. The VO2 lattice at the film/substrate interface was probably pinned by the substrate lattice, even when that at the GST/VO2 interface was shrunk due to stress from GST. The pinning effect could be pronounced when the VO2 layer is thin. Optimization of the thicknesses of the GST, VO2, and buffer layers would be required. Another reason for this, in particular regarding Samples C and D, could be that the SiNx layer may have absorbed a large part of the stress from the GST layer and weakened the deformation of the VO2. ZnS–SiO2, an insulating material commonly used in optical disks, is supposed to be softer than SiNx, and could be useful for improving the transport efficiency of the stress. The change of Ttr for ~30 °C in the present results may not be large enough for device applications, and therefore, transportation of the 2.3% strain from GST to VO2 with a higher efficiency would be sought after.
More importantly, the application to optical devices such as memories and switches would require an amorphization process of the crystalline GST layer. Amorphization is currently performed in commercial optical disks by rapid local heating of the material, which should be in the order of μm2 in area and tens of ns in duration [51]. Such a process will be examined in our future research.

5. Conclusions

In GST/VO2 bilayered films prepared on Al2O3 substrates, the phase transition properties of the VO2 layers were compared between the steps before and after crystallization of the GST layer. It was shown that the crystallization of the GST layer lowers the phase transition temperature of the VO2 layer, either with or without a SiNx buffer layer. The nonvolatile modification of Ttr was probably induced through strain in the VO2 layer, which originated in the volume shrinkage of the GST layer at its amorphous–crystalline phase change. The shift of Ttr caused by the crystallization of the GST layer was by approximately 30 °C for a GST/VO2 bilayered sample with thicknesses of 200/30 nm. Once an amorphization process has been established, the presently-described devices will possibly be proved to function as reversible, nonvolatile resistance change memory or optical switching devices with operation temperature ranges of several tens of degrees Celsius. The operation mechanisms of the present samples would represent new guidelines in the strain engineering field, and would greatly broaden the possibilities of strain-driven devices.

Author Contributions

Conceptualization, M.K.; deposition—VO2, K.O. and J.S., deposition—GST and SiNx, M.K.; performing optical reflectance measurement, M.K., performing resistance measurement, K.O.; performing simulation, Y.U.; writing draft, J.S.; project administration, Y.U.; funding acquisition, M.K. and J.S. All authors have read and agreed to the published version of the manuscript.

Funding

This work was performed in the Cooperative Research Project of the Research Institute of Electrical Communication, Tohoku University, and was supported by a Grant-in-Aid for Scientific Research C [No. 19K05024] from the Japan Society for the Promotion of Science.

Acknowledgments

The authors are grateful to Yuzo Shigesato, Hisashi Saito, Takenori Tanno, Satoshi Katano, Motoki Takada, José Santiso, Gustau Catalan, Mustapha Zaghrioui, and Vinh Ta Phuoc, for their support on experiments.

Conflicts of Interest

The authors declare no conflict of interest.

References

  1. Morin, F.J. Oxides Which Show a Metal-to-Insulator Transition at the Neel Temperature. Phys. Rev. Lett. 1959, 3, 34–36. [Google Scholar] [CrossRef]
  2. Westman, S.; Lindqvist, I.; Sparrman, B.; Nielsen, G.B.; Nord, H.; Jart, A. Note on a Phase Transition in VO2. Acta Chem. Scand. 1961, 15, 217. [Google Scholar] [CrossRef]
  3. Van Steensel, K.; van de Burg, F.; Kooy, C. Thin-film switching elements of VO2. Philips Res. Repts. 1967, 22, 170–177. [Google Scholar]
  4. Berglund, C.; Walden, R. A thin-film inductance using thermal filaments. IEEE Trans. Electron. Devices 1970, 17, 137–148. [Google Scholar] [CrossRef]
  5. Cavalleri, A.; Tóth, C.; Siders, C.W.; Squier, J.A.; Ráksi, F.; Forget, P.; Kieffer, J.C. Femtosecond Structural Dynamics in VO2 during an Ultrafast Solid-Solid Phase Transition. Phys. Rev. Lett. 2001, 87, 237401. [Google Scholar] [CrossRef] [Green Version]
  6. Baum, P.; Yang, D.-S.; Zewail, A.H. 4D Visualization of Transitional Structures in Phase Transformations by Electron Diffraction. Science 2007, 318, 788–792. [Google Scholar] [CrossRef]
  7. Cao, J.; Gu, Y.; Fan, W.; Chen, L.Q.; Ogletree, D.F.; Chen, K.; Tamura, N.; Kunz, M.; Barrett, C.; Seidel, J.; et al. Extended Mapping and Exploration of the Vanadium Dioxide Stress-Temperature Phase Diagram. Nano Lett. 2010, 10, 2667–2673. [Google Scholar] [CrossRef]
  8. Pellegrino, L.; Manca, N.; Kanki, T.; Tanaka, H.; Biasotti, M.; Bellingeri, E.; Siri, A.S.; Marré, D. Multistate memory devices based on free-standing VO2/TiO2 microstructures driven by Joule self-heating. Adv. Mater. 2012, 24, 2929–2934. [Google Scholar] [CrossRef]
  9. Bae, S.-H.; Lee, S.; Koo, H.; Lin, L.; Jo, B.H.; Park, C.; Wang, Z.L. The Memristive Properties of a Single VO2 Nanowire with Switching Controlled by Self-Heating. Adv. Mater. 2013, 25, 5098–5103. [Google Scholar] [CrossRef]
  10. Jeong, J.; Aetukuri, N.; Graf, T.; Schladt, T.D.; Samant, M.G.; Parkin, S.S.P. Suppression of Metal-Insulator Transition in VO2 by Electric Field-Induced Oxygen Vacancy Formation. Science 2013, 339, 1402–1405. [Google Scholar] [CrossRef]
  11. Muraoka, Y.; Hiroi, Z. Metal—Insulator transition of VO2 thin films grown on TiO2 (001) and (110) substrates. Appl. Phys. Lett. 2002, 80, 583–585. [Google Scholar] [CrossRef] [Green Version]
  12. Fan, L.L.; Chen, S.; Luo, Z.L.; Liu, Q.H.; Wu, Y.F.; Song, L.; Ji, D.X.; Wang, P.; Chu, W.S.; Gao, C.; et al. Strain dynamics of ultrathin VO2 film grown on TiO2 (001) and the associated phase transition modulation. Nano Lett. 2014, 14, 4036–4043. [Google Scholar] [CrossRef] [PubMed]
  13. Kim, H.; Charipar, N.; Figueroa, J.; Bingham, N.S.; Piqué, A. Control of metal-insulator transition temperature in VO2 thin films grown on RuO2/TiO2 templates by strain modification. AIP Adv. 2019, 9, 015302. [Google Scholar] [CrossRef] [Green Version]
  14. Jia, Q.; Grenzer, J.; He, H.; Anwand, W.; Ji, Y.; Yuan, Y.; Huang, K.; You, T.; Yu, W.; Ren, W.; et al. 3D Local Manipulation of the Metal-Insulator Transition Behavior in VO2 Thin Film by Defect-Induced Lattice Engineering. Adv. Mater. Interfaces 2018, 5. [Google Scholar] [CrossRef]
  15. Gu, D.-E.; Zheng, H.; Ma, Y.; Xu, S.; Zhou, X. A highly-efficient approach for reducing phase transition temperature of VO2 polycrystalline thin films through Ru4+-doping. J. Alloys Compd. 2019, 790, 602–609. [Google Scholar] [CrossRef]
  16. Molegraaf, H.J.A.; Hoffman, J.; Vaz, C.A.F.; Gariglio, S.; Van Der Marel, D.; Ahn, C.H.; Triscone, J.-M. Magnetoelectric Effects in Complex Oxides with Competing Ground States. Adv. Mater. 2009, 21, 3470–3474. [Google Scholar] [CrossRef]
  17. Zheng, R.K.; Wang, Y.; Liu, Y.K.; Gao, G.Y.; Fei, L.F.; Jiang, Y.; Chan, H.L.W.; Li, X.M.; Luo, H.S.; Li, X.G. Epitaxial growth and interface strain coupling effects in manganite film/piezoelectric-crystal multiferroic heterostructures. Mater. Chem. Phys. 2012, 133, 42–46. [Google Scholar] [CrossRef]
  18. Leufke, P.M.; Kruk, R.; Brand, R.A.; Hahn, H. In situ magnetometry studies of magnetoelectric LSMO/PZT heterostructures. Phys. Rev. B 2013, 87, 094416. [Google Scholar] [CrossRef]
  19. Zhang, S.; Zhao, Y.G.; Li, P.S.; Yang, J.J.; Rizwan, S.; Zhang, J.X.; Seidel, J.; Qu, T.L.; Yang, Y.J.; Luo, Z.L.; et al. Electric-field control of nonvolatile magnetization in Co40Fe40B20/Pb(Mg1/3Nb2/3)0.7Ti0.3O3 structure at room temperature. Phys. Rev. Lett. 2012, 108, 137203. [Google Scholar] [CrossRef]
  20. Brandlmaier, A.; Geprägs, S.; Woltersdorf, G.; Gross, R.; Goennenwein, S.T.B. Nonvolatile, reversible electric-field controlled switching of remanent magnetization in multifunctional ferromagnetic/ferroelectric hybrids. J. Appl. Phys. 2011, 110, 043913. [Google Scholar] [CrossRef] [Green Version]
  21. Chen, A.T.; Zhao, Y. Research Update: Electrical manipulation of magnetism through strain-mediated magnetoelectric coupling in multiferroic heterostructures. APL Mater. 2016, 4, 032303. [Google Scholar] [CrossRef]
  22. Sakai, J.; Bavencoffe, M.; Negulescu, B.; Limelette, P.; Wolfman, J.; Tateyama, A.; Funakubo, H. Strain-induced resistance change in V2O3 films on piezoelectric ceramic disks. J. Appl. Phys. 2019, 125, 115102. [Google Scholar] [CrossRef] [Green Version]
  23. Petraru, A.; Soni, R.; Kohlstedt, H. Voltage controlled biaxial strain in VO2 films grown on 0.72Pb(Mg1/3Nb2/3)-0.28PbTiO3 crystals and its effect on the transition temperature. Appl. Phys. Lett. 2014, 105, 092902. [Google Scholar] [CrossRef]
  24. Nan, T.; Liu, M.; Ren, W.; Ye, Z.G.; Sun, N.X. Voltage control of metal-insulator transition and non-volatile ferroelastic switching of resistance in VOx/PMN-PT Heterostructures. Sci. Rep. 2014, 4, 5931. [Google Scholar] [CrossRef] [Green Version]
  25. Zhi, B.; Gao, G.; Xu, H.; Chen, F.; Tan, X.; Chen, P.; Wang, L.; Wu, W. Electric-field-modulated nonvolatile resistance switching in VO2/PMN-PT (111) heterostructures. Appl. Mater. Interfaces 2014, 6, 4603–4608. [Google Scholar] [CrossRef] [Green Version]
  26. Zhang, J.; Kong, W.; Liu, L.; Li, C.; Fang, L.; Feng, Y.P.; Tang, R.; Su, X.; Chen, J. Piezoelectric control of resistance switching in VO2/Pb(Zr0.52Ti0.48)O3 heterostructure. Appl. Phys. Lett. 2019, 114, 061603. [Google Scholar] [CrossRef]
  27. Verdaguer, A.; López-Mir, L.; Paradinas, M.; Holý, V.; Železný, J.; Yi, D.; Suresha, S.J.; Liu, J.; Serrao, C.R.; Ramesh, R.; et al. Giant reversible nanoscale piezoresistance at room temperature in Sr2IrO4 thin films. Nanoscale 2015, 7, 3453–3459. [Google Scholar] [CrossRef] [Green Version]
  28. Alyabyeva, N.; Sakai, J.; Bavencoffe, M.; Wolfman, J.; Limelette, P.; Funakubo, H.; Ruyter, A. Metal-insulator transition in V2O3 thin film caused by tip-induced strain. Appl. Phys. Lett. 2018, 113, 241603. [Google Scholar] [CrossRef]
  29. Kuwahara, M.; Suzuki, O.; Taketoshi, N.; Yamakawa, Y.; Yagi, T.; Fons, P.; Tsutsumi, K.; Suzuki, M.; Fukaya, T.; Tominaga, J.; et al. Measurements of Temperature Dependence of Optical and Thermal Properties of Optical Disk Materials. Jpn. J. Appl. Phys. 2006, 45, 1419–1421. [Google Scholar] [CrossRef]
  30. Kuwahara, M.; Suzuki, O.; Yamakawa, Y.; Taketoshi, N.; Yagi, T.; Fons, P.; Fukaya, T.; Tominaga, J.; Baba, T. Temperature Dependence of the Thermal Properties of Optical Memory Materials. Jpn. J. Appl. Phys. 2007, 46, 3909–3911. [Google Scholar] [CrossRef]
  31. Endo, R.; Maeda, S.; Jinnai, Y.; Lan, R.; Kuwahara, M.; Kobayashi, Y.; Susa, M. Electric Resistivity Measurements of Sb2Te3 and Ge2Sb2Te5 Melts Using Four-Terminal Method. Jpn. J. Appl. Phys. 2010, 49. [Google Scholar] [CrossRef]
  32. Hada, M.; Oba, W.; Kuwahara, M.; Katayama, I.; Saiki, T.; Takeda, J.; Nakamura, K.G. Ultrafast time-resolved electron diffraction revealing the nonthermal dynamics of near-UV photoexcitation-induced amorphization in Ge2Sb2Te5. Sci. Rep. 2015, 5, 13530. [Google Scholar] [CrossRef] [PubMed] [Green Version]
  33. Ikuma, Y.; Shoji, Y.; Kuwahara, M.; Wang, X.; Kintaka, K.; Kawashima, H.; Tanaka, D.; Tsuda, H. Small-sized optical gate switch using Ge2Sb2Te5 phase-change material integrated with silicon waveguide. Electron. Lett. 2010, 46, 368. [Google Scholar] [CrossRef]
  34. Tanaka, D.; Ikuma, Y.; Shoji, Y.; Kuwahara, M.; Wang, X.; Kintaka, K.; Kawashima, H.; Toyosaki, T.; Tsuda, H. Demonstration of 1000-times switching of phase-change optical gate with Is wire waveguides. Electron. Lett. 2011, 47, 268–269. [Google Scholar] [CrossRef]
  35. Tanaka, D.; Shoji, Y.; Kuwahara, M.; Wang, X.; Kintaka, K.; Kawashima, H.; Toyosaki, T.; Ikuma, Y.; Tsuda, H. Ultra-small, self-holding, optical gate switch using Ge2Sb2Te5 with a multi-mode Si waveguide. Opt. Express 2012, 20, 10283–10294. [Google Scholar] [CrossRef]
  36. Moriyama, T.; Tanaka, D.; Jain, P.; Kawashima, H.; Kuwahara, M.; Wang, X.; Tsuda, H. Ultra-compact, self-holding asymmetric Mach-Zehnder interferometer switch using Ge2Sb2Te5 phase-change material. IEICE Electron. Express 2014, 11, 20140538. [Google Scholar] [CrossRef] [Green Version]
  37. Kato, K.; Kuwahara, M.; Kawashima, H.; Tsuruoka, T.; Tsuda, H. Current-driven phase-change optical gate switch using indium—Tin-oxide heater. Appl. Phys. Express 2017, 10, 072201. [Google Scholar] [CrossRef]
  38. Njoroge, W.K.; Wöltgens, H.-W.; Wuttig, M. Density changes upon crystallization of Ge2Sb2.04Te4.74 films. J. Vac. Sci. Technol. A 2002, 20, 230–233. [Google Scholar] [CrossRef]
  39. Nagashima, K.; Yanagida, T.; Tanaka, H.; Kawai, T. Influence of ambient atmosphere on metal-insulator transition of strained vanadium dioxide ultrathin films. J. Appl. Phys. 2006, 100, 063714. [Google Scholar] [CrossRef]
  40. Meng, Y.; Behera, J.K.; Ke, Y.; Chew, L.; Wang, Y.; Long, Y.; Simpson, R.E. Design of a 4-level active photonics phase change switch using VO2 and Ge2Sb2Te5. Appl. Phys. Lett. 2018, 113, 071901. [Google Scholar] [CrossRef]
  41. Hu, Y.; Zou, H.; Zhang, J.; Xue, J.; Sui, Y.; Wu, W.; Yuan, L.; Zhu, X.; Song, S.; Song, Z. Ge2Sb2Te5/Sb superlattice-like thin fil for high speed change memory application. Appl. Phys. Lett. 2015, 107, 263105. [Google Scholar] [CrossRef]
  42. Sakai, J.; Kuwahara, M.; Hotsuki, M.; Katano, S.; Uehara, Y. Selective scanning tunneling microscope light emission from rutile phase of VO2. J. Phys. Condens. Matter 2016, 28, 385002. [Google Scholar] [CrossRef] [PubMed]
  43. Azhan, N.H.; Su, K.; Okimura, K.; Zaghrioui, M.; Sakai, J. Appearance of large crystalline domains in VO2 films grown on sapphire (001) and their phase transition characteristics. J. Appl. Phys. 2015, 117, 245314. [Google Scholar] [CrossRef]
  44. Kurosawa, K.; Pierce, R.M.; Ushioda, S.; Hemminger, J.C. Raman scattering and attenuated-total-reflection studies of surface-plasmon polaritons. Phys. Rev. B 1986, 33, 789–798. [Google Scholar] [CrossRef] [PubMed]
  45. Philipp, H.R. Silicon dioxide (SiO2) (Glass). In Handbook of Optical Constants of Solids; Palik, E.D., Ed.; Academic Press: New York, NY, USA, 1985; p. 749. [Google Scholar]
  46. Lamsal, C.; Ravindra, N.M. Optical properties of vanadium oxides-an analysis. J. Mater. Sci. 2013, 48, 6341–6351. [Google Scholar] [CrossRef]
  47. Krammer, A.; Magrez, A.; Vitale, W.A.; Mocny, P.; Jeanneret, P.; Guibert, E.; Whitlow, H.J.; Ionescu, A.M.; Schüler, A. Elevated transition temperature in Ge doped VO2 thin films. J. Appl. Phys. 2017, 122, 045304. [Google Scholar] [CrossRef] [Green Version]
  48. Liu, S.-J.; Su, Y.-T.; Hsieh, J.-H. Effects of postdeposition annealing on the metal–insulator transition of VO2−x thin films prepared by RF magnetron sputtering. Jpn. J. Appl. Phys. 2014, 53, 33201. [Google Scholar] [CrossRef]
  49. Zhang, J.; Zhao, Z.; Li, J.; Jin, H.; Rehman, F.; Chen, P.; Jiang, Y.; Chen, C.; Cao, M.; Zhao, Y. Evolution of Structural and Electrical Properties of Oxygen-Deficient VO2 under Low Temperature Heating Process. ACS Appl. Mater. Interfaces 2017, 9, 27135–27141. [Google Scholar] [CrossRef]
  50. Uchino, K. Electrostrictive actuators: Materials and applications. Am. Ceram. Soc. Bull. 1986, 65, 647–652. [Google Scholar]
  51. Marchant, A.B. Optical Recording: A Technical Overview; Addison-Wesley Publishing: Boston, MA, USA, 1990; pp. 84–88. [Google Scholar]
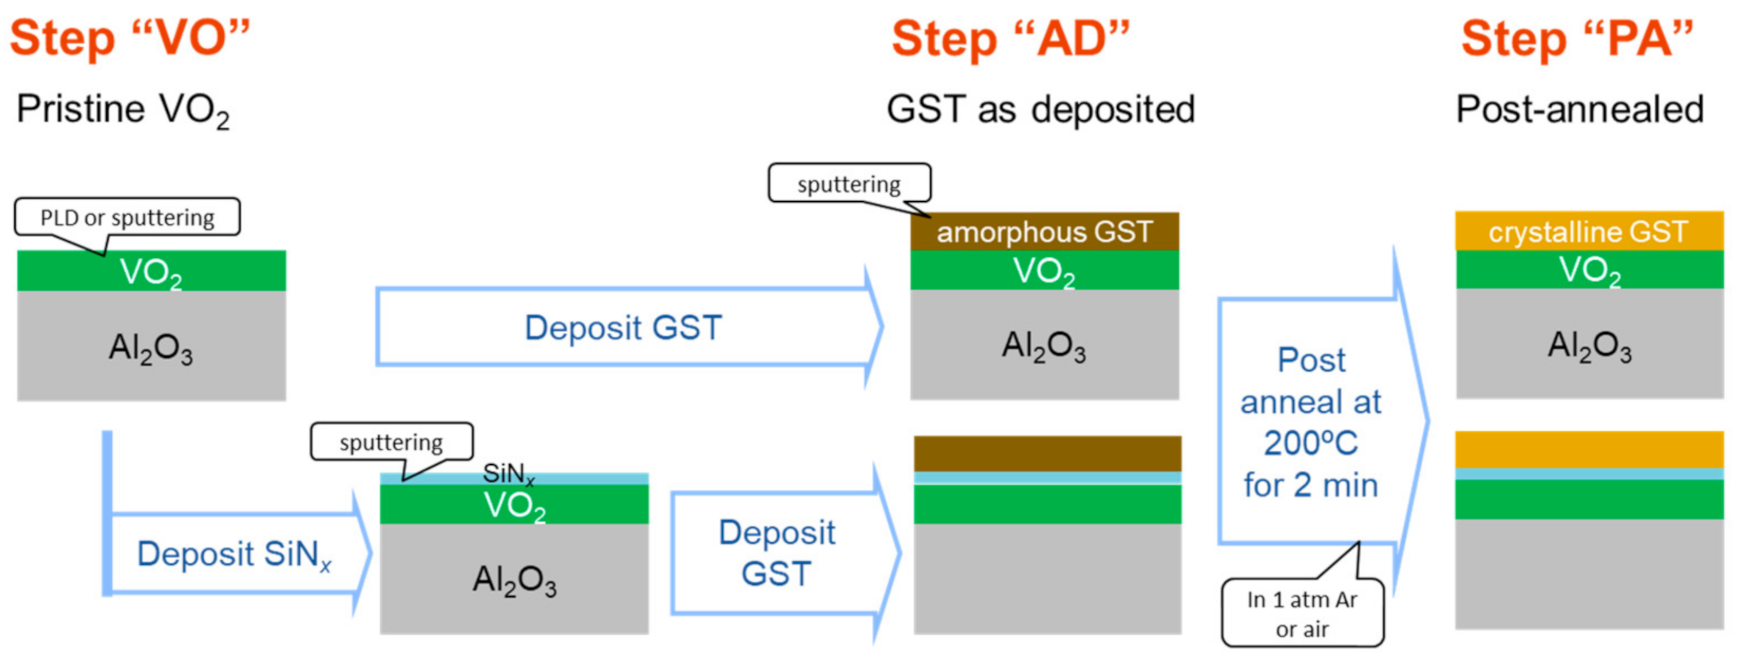
Figure 1. Preparation processes of GST/VO2 and GST/SiNx/VO2 multilayered samples.
Materials 13 05541 g001
Figure 2. XRD 2θ − ω scan profiles of Sample B in geometries aligned with respect to VO2 40–2M or 002R diffraction peak. The profiles are offset for clarity. Inset shows a schematic of unit cells of R phase VO2 and the incident and reflected x-ray.
Materials 13 05541 g002
Figure 3. Temperature dependence of optical reflection intensity from Sample A (ac) and Sample B (eg) in steps VO (a,e), AD (b,f), and PA (c,g) during heating (thick lines) and cooling (thin lines) runs. The intensity is normalized at 100°C. The incident light was shone upon the film side (Sample A) or from substrate side (Sample B), as illustrated in insets of (a) and (e). (d,h) Temperature-differential profiles of reflection intensity (dI/dT) in the heating runs for Samples A and B, respectively, at the three steps. The triangle symbols indicate the peak/valley position.
Materials 13 05541 g003
Figure 4. (ad) Temperature dependence of electrical resistance (a,c) and temperature-differential profiles of the logarithm of the resistance [d(log R)/dT] in the heating runs (b,d) for Sample C (a,b) and Sample D (c,d) at AD and PA steps. Inset of (a) schematically shows the measurement configuration. The triangle symbols indicate the valley position.
Materials 13 05541 g004
Figure 5. XRD 2θ − ω scan profiles of Samples C (a) and D (b) in steps VO and PA.
Materials 13 05541 g005
Table 1. Thickness of each layer, measurements performed at each step, and the results of Ttr in heating runs from each measurement in four samples.
SampleVO2 Thickness (nm)GST Thickness (nm)SiNx LayerSubstrateADPA
Meas.Ttr (°C)Meas.Ttr (°C)
A505NoC-cut Al2O3Refl.81Refl.77
B30200NoR-cut Al2O3Refl.72Refl.41
C100200YesC-cut Al2O3R–T74R–T72
D6200YesC-cut Al2O3R–T58R–T52
Meas. = measurement. Refl. = optical reflection intensity.
Publisher’s Note: MDPI stays neutral with regard to jurisdictional claims in published maps and institutional affiliations.